e-Literate

Present is Prologue

Category: Ed Tech

The “Ed Tech” category includes posts about educational technology products themselves, including LMSs and other learning platforms, adaptive learning and other digital curricular materials products, learning analytics, and educational apps of all types. It also includes technical aspects of ed tech products, especially interoperability.

  • Preliminary Data on K-12 LMS Market

    Preliminary Data on K-12 LMS Market

    Over the past several months, we have worked with our partners at LISTedTECH as they ramp up their efforts to collect data on LMS usage in the K-12 market in the United States. This is a massive effort as the market includes more than 130,000 individual public and private schools, and more than 13,600 school districts, according to recent NCES documentation. We are aware of several private data sources with estimates on the K-12 LMS market, but there are no public sources.

    Part of the challenge is that the K-12 market is messier than higher education’s and its roughly 7,200 institutions. One reason is that the general IT infrastructure in K-12 is less mature than in higher ed, and for smaller schools there are a lot of ad hoc implementations running on a local server not even in a data center. Another reason is the availability of free options such as Google Classroom, or freemium options such as that offered by Schoology and Canvas for individual faculty.

    As we build up the data and improve our methods, we believe we are starting to see some interesting trends in the data worth sharing.

    Our initial sample looks at 6,875 public schools from across the country in the NCES-designated primary, middle, high and other (special ed, vocational or alternative) categories. These results were analyzed over several data collection methods along with manual evaluation of that data. That said, we expect to see movement in the numbers as we collect and verify additional data, including LMS usage at private schools.

    As in our analysis of the higher ed market, we are focusing on school-wide implementations of LMS platforms. At many K-12 schools, in the absence of a school-wide implementation, individual teachers opt to use an LMS for their particular classroom, often for free. We do not consider this case a school-wide adoption and therefore do not include those use cases in our data. This methodology does not fully analyze total usage of a platform like Schoology that has a freemium model, including a free option for individual teachers and an enterprise solution which is a school-wide adoption based on a fee per student model. A platform like Google Classroom likewise has usage by individual teachers as well as school-wide implementations.

    Before we share the preliminary data, some caveats are in order to hopefully avoid anyone misrepresenting this information:

    • This is preliminary data that will likely change as we learn more. While we believe there are some broad trends already emerging, there will be refinements as we increase our coverage over time. We expect the changes to be in small adjustments to specific numbers but not in big changes to market shape.
    • This view is based on number of schools that have implemented an LMS, which is a different metric than district-wide implementations (where many or most of the purchasing decisions occur) or implementations scaled by student enrollments. We will add these views in the future.
    • This view is based on installed base (which represents total estimated deployments), which is different than new implementations in a given time period (which would measure market momentum). Again, we will add these views over time, just as we have done for the higher ed LMS market.
    • Due in particular to the free options available in K-12, there will be schools that have more than one LMS available at the institutional level. Google Classroom in particular is often available as an option at a school even when there is another LMS.
    • As is our practice at e-Literate, we’ll describe the caveats and present the data as is. As we learn more, if the relative percentages change significantly, we will share updates.
    • For more information on our data methods, see this post.

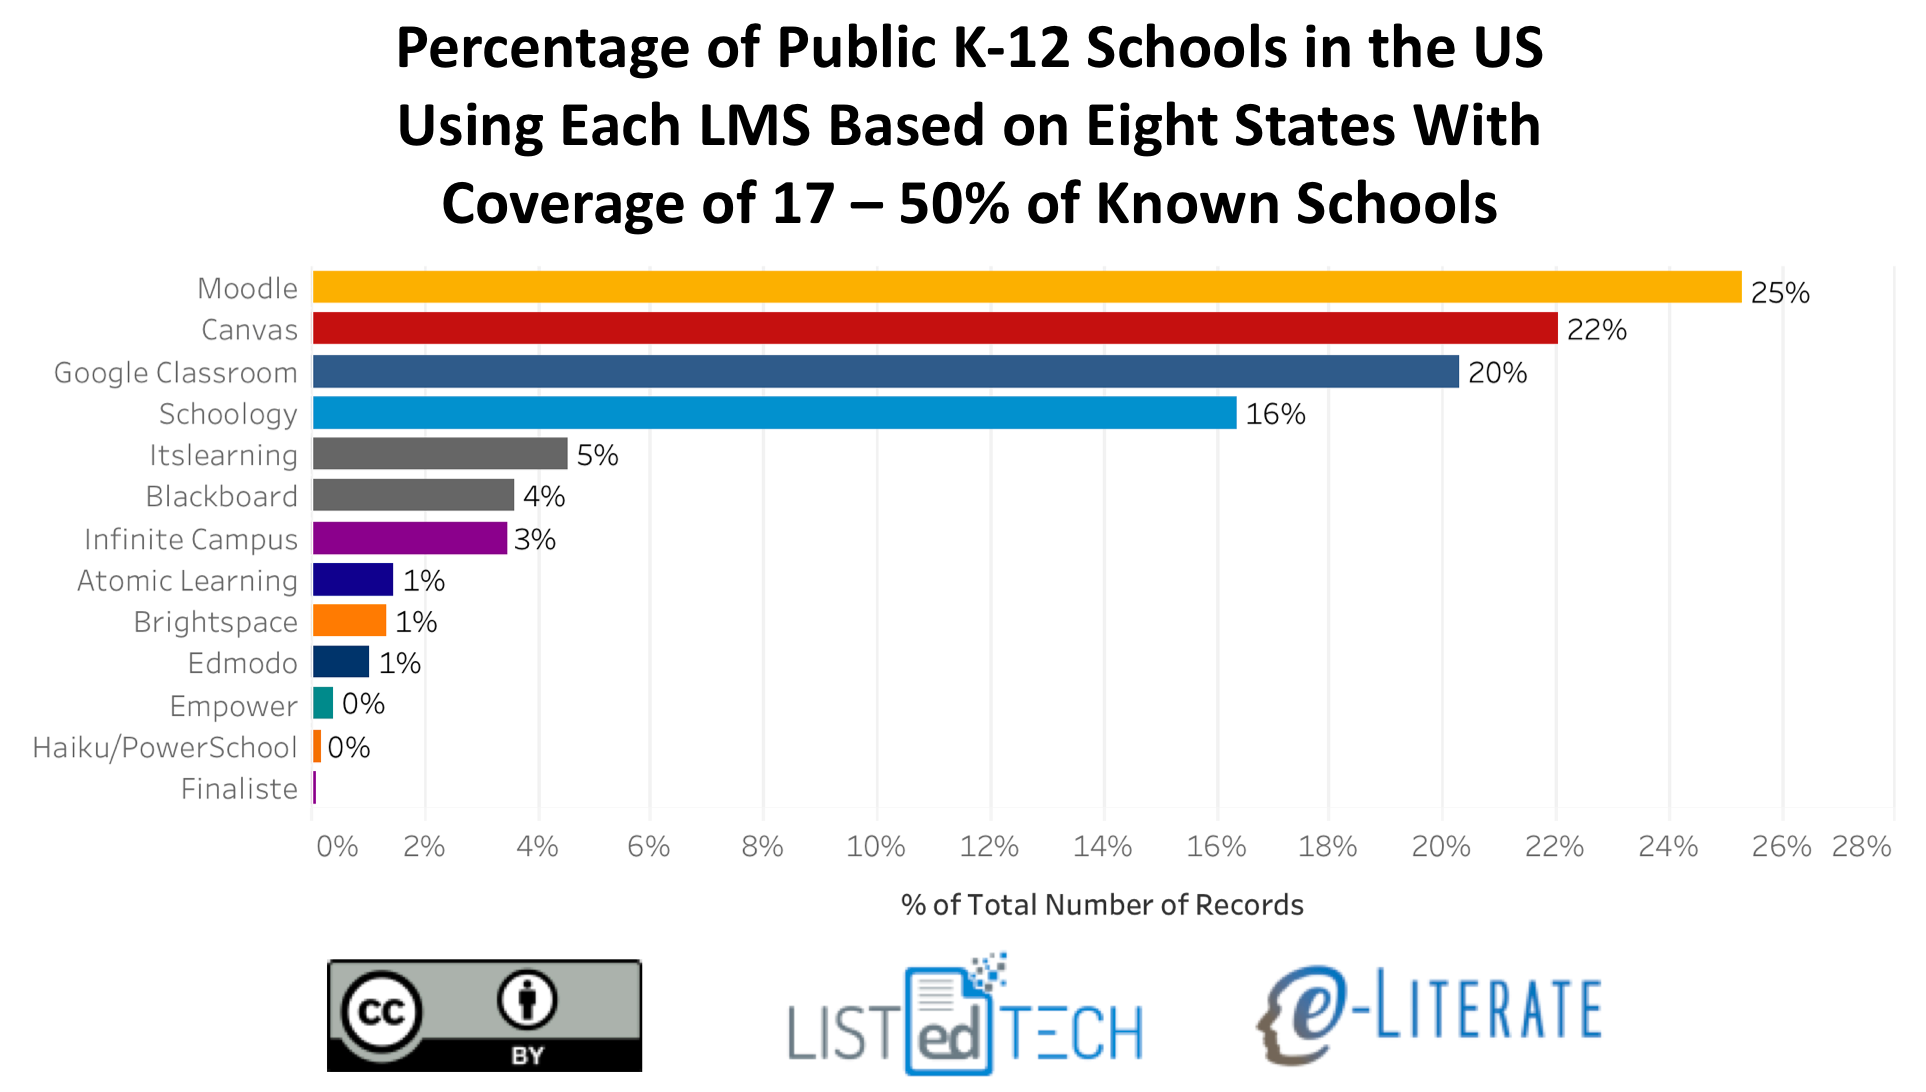
    The first graph presents a view of K-12 school-wide LMS implementations in the United States for the 8 states (and DC) where we have at least 17% coverage of known schools (Alaska, Delaware, District of Columbia, Florida, Massachusetts, Minnesota, Texas, Wisconsin).

    LMS Market Share for K-12 in US, 8 States

    To get a sense of how representative this initial market share is, we made the same calculations across all 6,875 schools from 50 states and DC that in our data thus far. The data for each LMS matched within ~2% for each LMS (e.g. Canvas went from 22% to 24%, Moodle went from 25% to 24%) between the two views.

    As in the higher education market, there appears to be four top contenders in K-12 – Moodle, Canvas, Google Classroom, and Schoology – with all others having 5% or less of market share. Moodle and Canvas are both present in the Big Four for both higher education and K-12, but in K-12 Google Classroom and Schoology are the other big players. We believe that this is the first data set showing just how widely Google Classroom has been adopted. ((Disclosure: Instructure, Schoology, Blackboard, and D2L are subscribers to our LMS Market Analysis service; Instructure and Blackboard also are sponsors for an upcoming event we are organizing.))

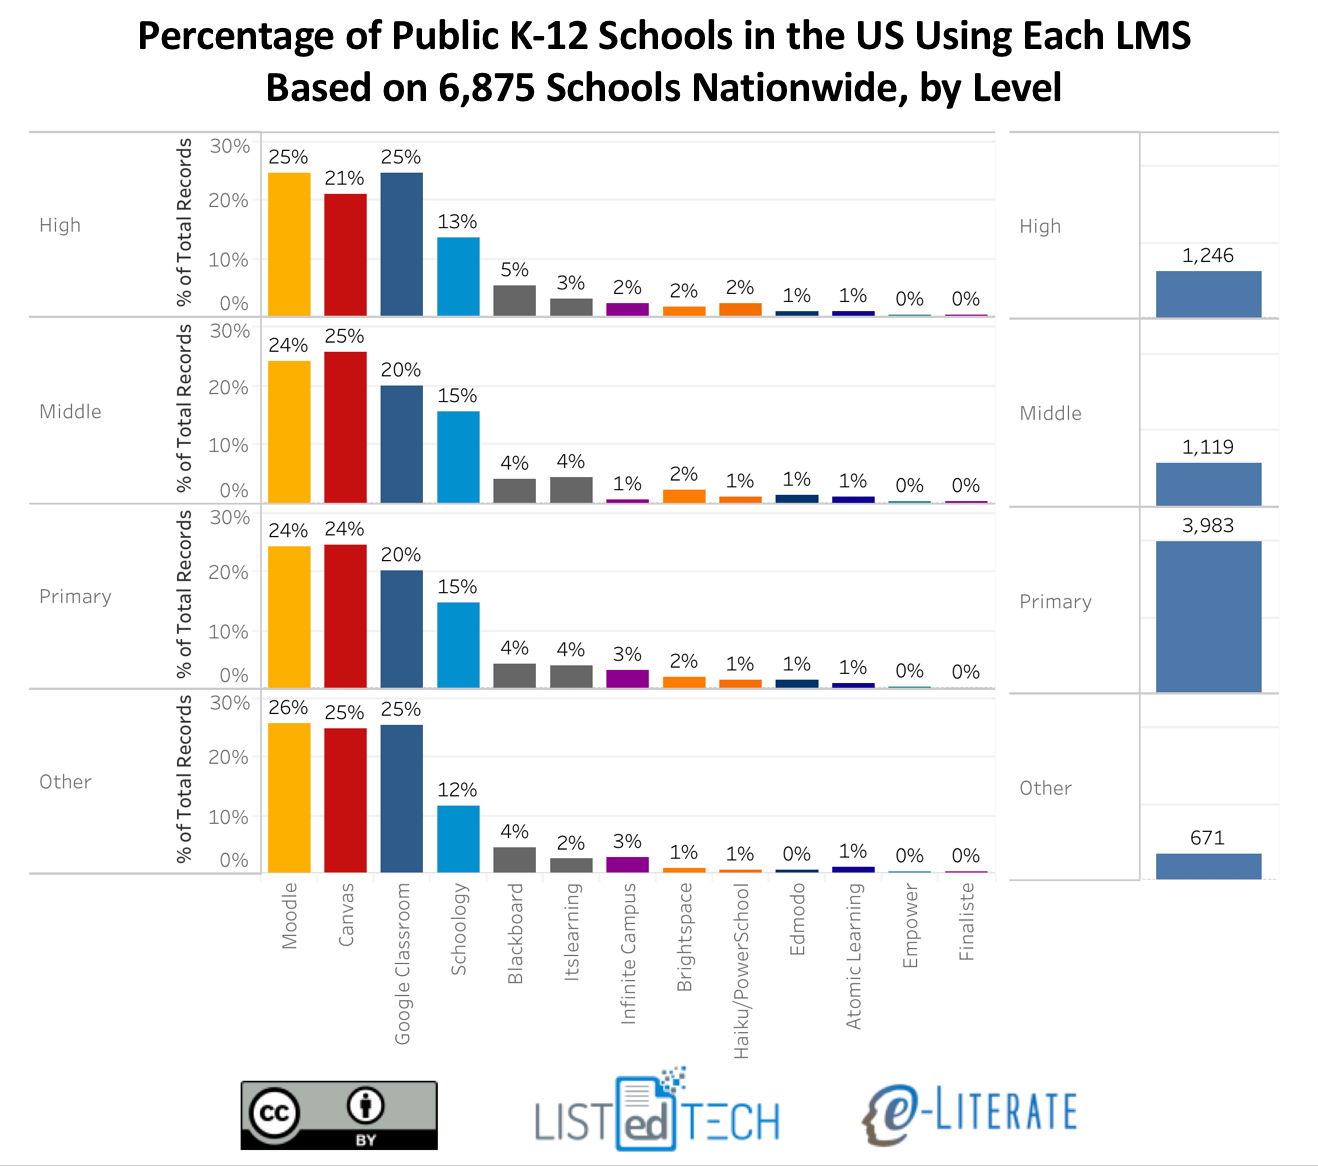
    The general distribution is somewhat consistent across school levels – primary, middle, high school, and others – with some interesting smaller variations. The following view also gives a sense of our relative data coverage by level. In this case we are using all our data across the 6,875 schools. Note that totals are higher than this number due to multiple systems being available at some schools.

    LMS Market Share for US K-12, By Level

    We hope this new data provides a broader view of the academic LMS market. We’d love to hear your feedback and questions.

  • Postscript on College Rankings Revisited: Description of methods

    Postscript on College Rankings Revisited: Description of methods

    There has been a lot of interest in Tuesday’s guest post by Steve Lattanzio from MetaMetrics on an alternate approach to college rankings that relies on algorithmic analysis of thousands of variables from the College Scorecard instead of typical cherry-picking of variables and subjective analysis. There have been some good questions posted on social media and blog comments asking for more information on the algorithms or assumptions behind the algorithms.

    While we linked to a corresponding article with more results and more detail on the methodology, we should have made that link more obvious. That article gives a much deeper description of the assumptions and methods used, including references to assumptions behind the theory and underpinnings of the approach. We have updated the Tuesday post with a direct link and include links in this postscript.

    The article “A New School of Thought for Our Thoughts on Schools” describes the challenge:

    The solution that we propose is to use neural networks to perform representational learning on the data. In other words, instead of manually going through the dataset and engineering a handful of features, we propose to use neural networks to automatically encode (autoencode) the information, including information about where data are missing, in a smaller dimensional space. Similar to principal components analysis (PCA), auto-encoding via neural networks is a dimension-reducing technique, but is more apt at handling variables that are nonlinearly related. In fact, it could be thought of as a more generalized version of PCA. Of course, such compression is lossy, but much of the information lost will be uninteresting noise and redundancies.

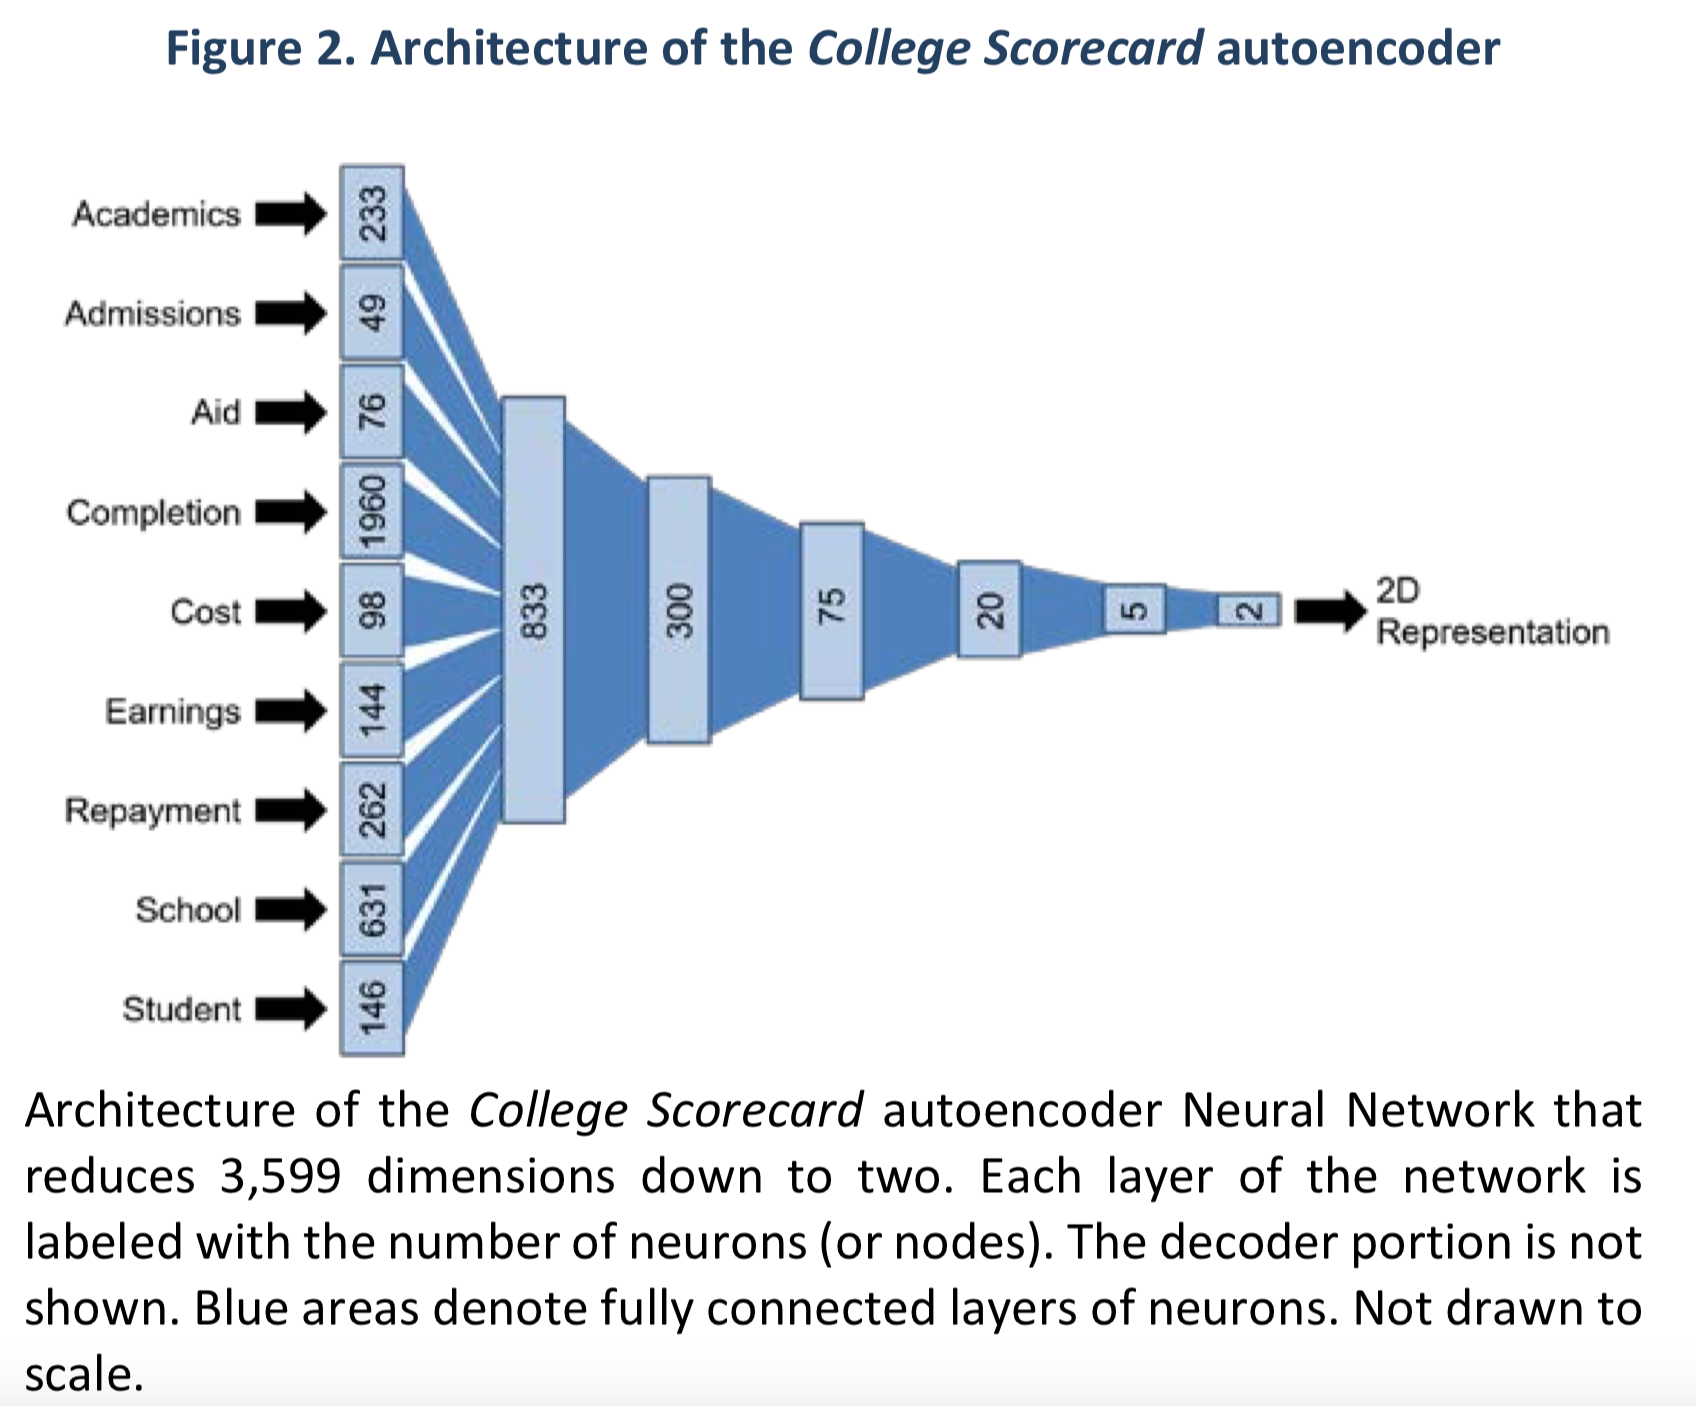
    The approach breaks up the 3,599 variables into a discrete number of categories, which then goes through successive layers of the neural network to generate a 2D representation.

    I won’t pretend to answer all questions by this summary, but instead I want to point out the source for describing this additional detail.

    Through all of this discussion, I want to remind readers that Steve in the original post was quite deliberate about what is not being claimed by this research.

    Out of an abundance of concern that the results of this experiment would be misrepresented, we’ll immediately point out that we make no claim that the rankings in this piece are the proper method for ranking these institutions, and we caution anyone from thinking of them as such.

    The real goal is further described in the New School article’s concluding paragraph:

    The methodology described in this paper and the pedagogical use-cases provide a rich framework for advanced analytics of post-secondary education—something that the consequence of the industry and the unwieldiness of the data demands. It is our hope that a future proliferation of similar work will promote further transparency in the post-secondary school market, more holistic approaches to data use, and ultimately more complete, fairer, and objective metrics that empower students to make the best decisions.

  • College Rankings Revisited: What Might an Artificial Intelligence Think?

    College Rankings Revisited: What Might an Artificial Intelligence Think?

    This post is from guest contributor Steve Lattanzio from MetaMetrics. While we do not tend to cover college rankings at e-Literate, we do care about transparency in usage of data as well as understanding opportunities where technology and data might inform students, faculty, administrators and the general educational community. The following post is an interesting exploration in the usage of the full set of College Scorecard data in a way that is understandable and usable. For people wanting a deeper description of the algorithms and assumptions, please see this corresponding article. For access to an interactive table to explore results, see this post.- ed

    Emphasis on might.

    Ranking colleges has become a bit of a national pastime. There are many organizations that publish “overall” rankings for our institutions of higher education (such as Forbes, Niche, Times Higher Education, and US News & World Report), each with their own methodologies.

    We don’t typically get the complete and precise picture of how these rankings are constructed. The common assertion by critics is that these methodologies, which are definitely subjective, are also quite arbitrary. They may seem complex, often relying on many different variables, but at the end of the day experts and other higher education authorities are making a set of choices about what data should be used and how to weigh those variables. What if those experts were just tweaking what variables to include and how to weigh them until they got results that “feel right” or meet some other criteria they had in mind? Some methodologies go a bit further and outright include human judgments, sounding the fudge-factor alarm. Furthermore, there is reason to be concerned about the fact that none of these rankings exist in a vacuum—it’s very possible that they are, to some extent, reflections of each other (see “herding” in the polling industry). At the same time and counter to herding, there’s a desire to provide a unique twist to rankings which leads to a lack of consensus about what the underlying construct should be behind overall college rankings.

    Against this backdrop, we now have access to ever-increasing amounts of data about our colleges. Newly released datasets like the College Scorecard present a vast trove of data to the public, enabling all sorts of new analytics. But while this provides an apparently more objective foundation for analysis, leveraging all of the data can be challenging.

    This led MetaMetrics to consider whether we could apply some more current machine learning methods to overcome these issues, the type of methods that we employ everyday in our K-12 research. Was it possible to have a computer algorithm take in a bunch of raw data and, through a sufficiently black-box approach, remove decision points that allow ratings to become subjective? Forgive me the gratuitous use of such a buzzword, but could an artificial intelligence discover a latent dimension hidden behind all the noise that was driving data points such as SAT scores, admission rates, earnings, loan repayment rates, and a thousand other things, instead of combining just a few of them in a subjective fashion?

    Out of an abundance of concern that the results of this experiment would be misrepresented, we’ll immediately point out that we make no claim that the rankings in this piece are the proper method for ranking these institutions, and we caution anyone from thinking of them as such. It is merely an alternative that we present that might be similar enough to other rankings to validate them, or different enough to invalidate them or this ranking. It is also possible that ranking colleges is an exercise in futility.

    The data

    Choosing a college is likely to be one of the most consequential decisions, financially and otherwise, of a postsecondary education consumer’s life. In an attempt to bring transparency to higher education and empower young Americans to make a more informed choice, the Obama administration created the College Scorecard in 2015.

    The College Scorecard contains thousands of variables for thousands of schools going back almost two decades. It’s a great initiative that allows someone to look at all of the usual suspects, such as average SAT scores, along with very specific things, such as the “percent of not-first-generation students who transferred to a 4-year institution and were still enrolled within 2 years.” The catch, however, is that there is a lot of missing data and only a minority of the possible data elements actually exist. It’s fairly straightforward to search, filter, or sort by specific fields of information for specific schools, but it’s not really clear how you could utilize all of the data. Consequently, most analytic efforts with the College Scorecard are likely to gravitate towards the archetypal and complete variables you would find in a much less ambitious dataset anyway. Our goal is to take advantage of all of the data available in the College Scorecard.

    The algorithm

    Traditional statistical analyses work best with clean and complete data that have nice linear relationships. These analyses are also going to have trouble handling too many variables at once. But cleaning and curating specific variables in the dataset present more opportunities for humans to unduly (wittingly or not) impact the final results.

    We also find ourselves lacking an independent variable to model. That is, we aren’t trying to predict one piece of data from a bunch of other data. We built an algorithm to find something not directly observable in the data that’s a driving force behind a lot of the directly observable things in the data. In machine learning, such a task is considered to be “unsupervised learning.”

    To tackle this problem, we use neural networks1 to perform “representational learning” through the use of what is called a stacked autoencoder. I’ll skip over the technical details, but the concept behind representational learning is to take a bunch of information that is represented in a lot of variables, or dimensions, and represent as much of the original information as possible with a lot fewer dimensions. In a stacked neural network autoencoder, data entering into the network is squashed down into fewer and fewer dimensions on one side and squeezed through a bottleneck. On the other side of the network, that squashed information is unpacked in an attempt to reconstruct the original data. Naturally, information is lost during this process, but it’s lost in a deliberate fashion as the AI learns how it can combine the raw variables into new, more efficient, variables that it can push through a bottleneck consisting of fewer channels and still reconstruct as much of the original data as possible. To be clear, the AI isn’t figuring out which subset of variables it wants to keep and which it wants to discard; it is figuring out how to express as much of the original data as possible in brand new meta-variables that it is concocting by combining the original data in creative ways. As noise and redundancies are squeezed out over the many layers of the deep neural network, the hope is that a set of underlying dimensions – ones that represent the most important, overarching features of the data – emerge from the chaos, with one being a candidate for overall college quality.

    The results

    The nature and context of the representational learning problem dictates how far you can reasonably compress a dataset. In this case, it’s reasonable to compress to as few dimensions as possible where the meanings of the dimensions are still interpretable and we retain some amount of broad ability to reconstruct the original data.

    It turns out that we were able to compress all of the information down to just two dimensions, and the significance of those two dimensions was immediately clear.

    One dimension has encoded a latent dimension that is related to things such as the size of the school and whether it is public or private (in fact, the algorithm decided there should be a rift mostly separating larger public institutions from smaller schools). The other dimension is a strong candidate for overall quality of a school and is correlated with all of the standard indicators of quality. It seems as if the algorithm learned that for higher education, if you must break it down into two things, is best broken down into two dimensions that can loosely be described as quantity and quality.

    Below are the top 20 colleges according to the AI and the resultant two dimensions.

    1.

    Duke University

    11.

    College of William and Mary

    2.

    Stanford University

    12.

    University of Southern California

    3.

    Vanderbilt University

    13.

    Wesleyan University

    4.

    Cornell University

    14.

    Yale University

    5.

    Brown University

    15.

    Massachusetts Institute of Technology

    6.

    Emory University

    16.

    Northwestern University

    7.

    University of Virginia

    17.

    Bucknell University

    8.

    University of Chicago

    18.

    University of Pennsylvania

    9.

    Boston College

    19.

    Santa Clara University

    10.

    University of Notre Dame

    20.

    Carnegie Mellon University

    Top 20 Colleges in the United States, according to our AI.2,3

    Visualization of AI-based college rankings

    College quality between 2005-2014 for the top 10 private and top 10 public schools as of 2014. The line thickness is proportional to the size of the student population.

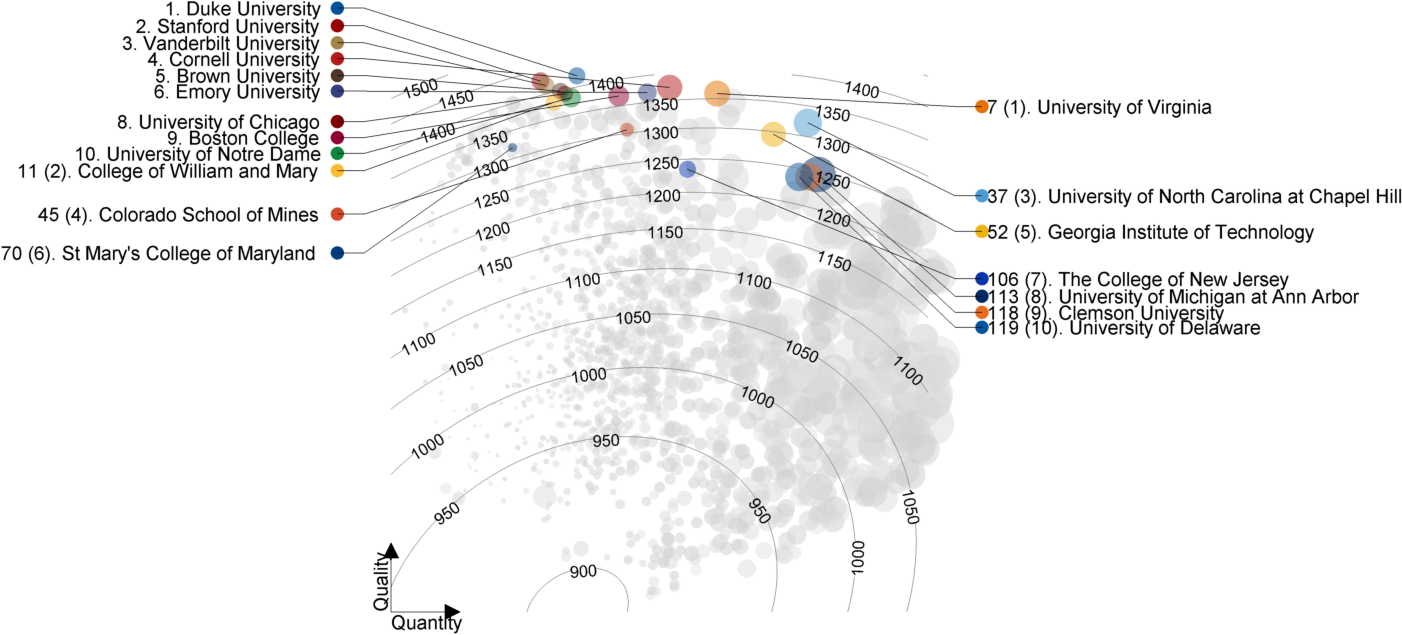
    Chart of quality vs quantity

    College quality versus quantity for the top 10 private and top 10 public schools in 2014. Circle area is proportional to the size of the student population. Approximate SAT score contour lines are superimposed.

    Most of the schools in the top 20 are present in the top 20 in at least one of the published rankings listed earlier. Seven schools—University of Virginia (7), Boston College (9), William and Mary (11), Wesleyan (13), Bucknell University (17), and Santa Clara University (19)—are the newcomers. Of those, the first four schools are reasonably close to being ranked in the top 20 in at least one other ranking, while the latter two are more surprising.

    The most conspicuous name is 19th ranked Santa Clara University, a private school of about 5,000 undergraduate students located in Silicon Valley. It is typically ranked in the low 100s (the consensus still places it in the top 10% of all schools) with its best ranking of 64 by Forbes. However, it is impressing the AI and likely disproportionately benefits from a more holistic use of the data instead of using only the typical metrics used to differentiate top schools.

    The most conspicuously missing names are the Ivy League schools Harvard (ranked 31st by the AI), Princeton (51), Dartmouth (23) and Columbia (26) along with Caltech (74) and Rice (25). It seems like blasphemy to rank Harvard and Princeton, arguably the most prestigious colleges in the United States, so far down. Caltech at 74 is probably the most jarring of all. However, we take this opportunity to remind you that the AI is not developing a metric strictly of prestige, reputation, the academic caliber of students, or earnings potential of its graduates, but something else that is different, but related.

    Duke, Stanford, and Vanderbilt are at the top of the rankings and in any given year any one of them can take the top spot according to the AI. All three schools are often, if not always, ranked in the top 20 in other published rankings. Duke sometimes makes the top five while Stanford does so more often.

    Although it goes against our human instincts, not too much weight should be given to the exact ranking of the top schools—relative to the variation in the rest of the field, the differences in quality are small and it’s very tight at the top.

    The caveats and more

    Throwing things through a black box is often a double-edged sword. You can avoid certain errors and biases that occur in human thinking, but algorithms often come with their own—or at least what we would consider—errors and biases. To an algorithm, data is data, and it’s all fair-game to use to meet some end. What if the neural network believes higher tuition rates, because they are associated with other favorable school characteristics, places a school higher on the dimension that encodes those things? A human would know that higher costs, without commensurate changes in other metrics, should count against a school. Sure, if corresponding quality was not reflected in other metrics, it’s likely the algorithm would mostly ignore the tuition data, but it might not actually lower the resulting quality output. That’s something humans bring to the table with their broad and vast real-world knowledge.

    Even more concerning, what if it uses racial demographics to do the same? Unsurprisingly, an algorithm that’s agnostic to what data it is fed has the potential to be politically and socially insensitive. One may think the solution is to just curate what goes into the black box, but there are often proxies for the same information that the algorithm can exploit. This is a commonly cited, controversial hazard of black box machine learning algorithms that should always be kept in mind.

    Additionally, these results are based on data aggregated across entire schools. Each student applying to or attending a school has a unique situation. There is much variation in a student population and the programs offered within a school. A single measure or ranking applied to a whole school does not tell you everything you need to know to make the best college decision, but it can provide some valuable context and some level of accountability for the schools themselves.

    Of course, there is the axiom that an analysis can only be as good as the data, and while the AI should be relatively robust to sporadic random data errors, systematic errors are another story.

    There are many more nuanced and technical caveats for this type of analysis. It is not perfect and the rankings should not be viewed as infallible. But when viewed among other college rankings, its validity is undeniable. It’s not merely a measure of prestige, and it addresses most of the concerns of critics of college rankings, while undoubtedly raising some new ones. However, the results somewhat “feel right.” The renowned “sabermetricianBill James was credited with saying, “If you have a metric that never matches up with the eye test, it’s probably wrong. And if it never surprises you, it’s probably useless. But if four out of five times it tells you what you know, and one of out five it surprises you, you might have something.’’ I think we might have something.

    Whether you are researching schools to apply to, are curious about your own alma mater, or generally curious, full results can be found in an interactive table, along with other (possibly more useful and less controversial) results that are generated from this type of methodology (such as discovering “hidden” Ivy League schools, value-add metrics, and relatedness of schools).

    Footnotes

    1. We actually train an ensemble of neural networks and average for more reliable results.
    2. These rankings are as of 2014, the last year of the College Scorecard that has sufficient data.
    3. Wake Forest University is in the top 20 between the years 2004-2009, but has insufficient data afterwards.
    Steve Lattanzio is a Research Engineer at MetaMetrics Inc., working in AI, machine learning, natural language processing, and data science. MetaMetrics is an education research company and are the developers of The Lexile® Framework for Reading and The Quantile® Framework for Mathematics.
    Update 1/17: Fixed mistake on ranking of Dartmouth, Columbia, and Cal Tech in text description.
    Update 1/19: Added direct link in introduction to article with more details.
  • Top Hat Marketplace: What is it and should we care?

    Top Hat Marketplace: What is it and should we care?

    When Top Hat announced their latest round of financing a year ago ($22.5m), I admit to having been skeptical, or more accurately cynical, about their stated purpose. The company was primarily known for its mobile and laptop-based classroom response system, but now it is claiming to be a digital content company.

    Top Hat, the Canadian education technology startup, completed a new round of funding to give it more firepower to go after textbook publishers like Pearson Plc. [snip]

    Top Hat is one of a handful of startups trying to find ways to disrupt the traditional textbook publishing industry, dominated by companies like Pearson, Cengage Learning Inc. and McGraw-Hill Education Inc., which is owned by Apollo Global Management LLC. All of these firms have added digital educational materials to their range of products, but the transition has been rocky.

    Then in the summer the company announced their new Marketplace.

    The Top Hat Marketplace answers the urgent need of professors and instructors to easily find and create educational content that is interactive, easily customizable and much more affordable for students than conventional textbooks. The educational content in the Top Hat Marketplace breaks the slow-paced publishing model by allowing educators to provide one another instant feedback. This collaborative community-sourced model means that the Marketplace’s content is continually being updated and improved upon.

    We at e-Literate have been covering the long-running and messy transition to digital curricular materials, including the search for new business models for content companies. But the announcements from Top Hat, to me at least, had the feel of a company pivot leveraging big, bad publishers as the bait for naive investors. Quite often it feels like the official greeting of ed tech entrepreneurs has either been “we’re going to beat Pearson” or “we’re going to beat Blackboard”. Top Hat and its products do not neatly fit into typical categories, but this may mean that we’re seeing a new model emerge, or at least a modernized and serious attempt to establish the self-publishing model.

    The Marketplace provides a series of textbooks and ancillary material, (course notes, question packs, presentations, etc) that instructors can browse, adopt, modify, and share with students either as mandatory or recommended resources. Students pay fees between $0 and roughly $65 for the materials. A spokesperson for Top Hat clarified a recent change:

    As we’ve already discussed, 90% of the content in the Top Hat Marketplace is free for instructors and students to use. However, by the end of January, students no longer need to use the Top Hat engagement app to access this content—meaning, students will no longer need to pay the per-term app fee to use free textbooks and content.

    Other than reasonably low prices, nothing noteworthy so far. What is unique is that there are two primary sources for the content – self-publishing by instructors and open education resources (OER) from OpenStax. As described in the press release this summer:

    “We leveraged our existing relationship with educators already using our classroom engagement tools to test and launch the Marketplace,” said Mike Silagadze, co-Founder and CEO of Top Hat. “The Marketplace finally puts educators — the people at the forefront of learning — in charge of their course materials.

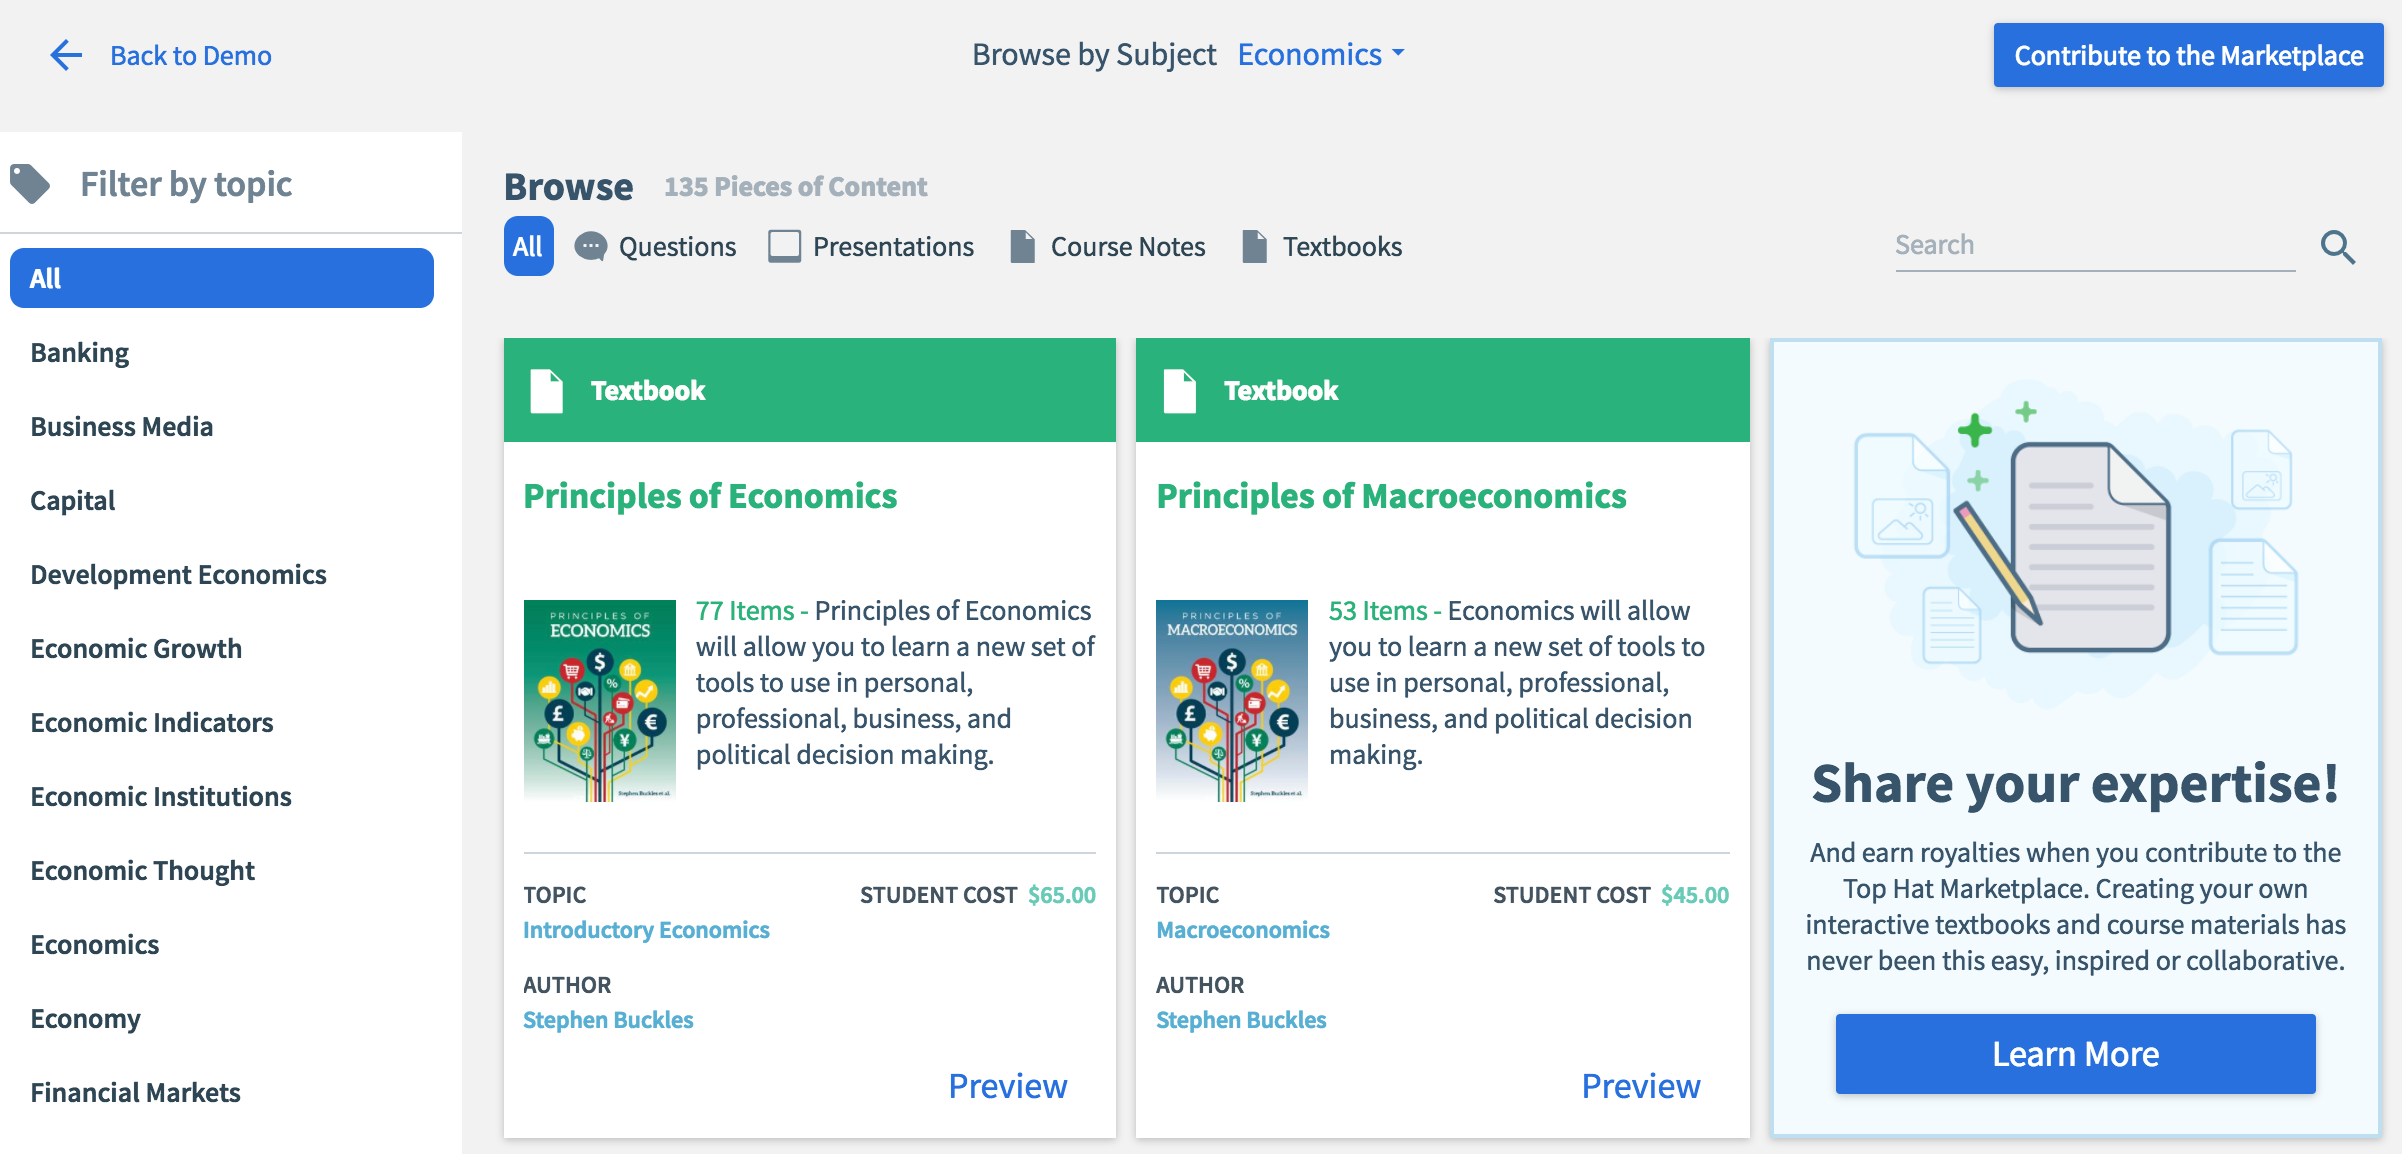
    Screen shot of economics materials

    The Marketplace has been designed as a self-publishing platform for educators designed around collaboration tools called Textbook. I interviewed Demian Hommel, senior instructor of geography at Oregon State University, and his experience helps explain the path that Top Hat is taking from classroom response systems to content marketplace. Hommel is an “an advocate for place-based and experiential education, service learning, and research-informed teaching” and has used the classroom response system for several terms. In the meantime, he has wanted to create a geography textbook but did not want to go through the traditional publishers. Since he already knew of Top Hat, when they announced Textbook and the Marketplace Hommel decided that he wanted to go with the self-publishing route.

    Hommel’s interest in publishing models does not seem to be driven by financial considerations, at least for himself, as he said he is not sure how well Top Hat will be able to scale usage of the Marketplace. One big driver for self-publishing was the interest in keeping the textbook current in a changing world of geography. Hommel views the Marketplace as providing a convenient platform enabling active learning techniques and the ability to control and update his textbook over time.

    There is another differentiator in how Top Hat provides content – the remarkably easy method to enable instructors to modify content, whether in the authoring process or as customizations to content that instructors choose to adopt. Basically, if you can author a post in Medium, you could create and modify content in the Top Hat platform.

    Consider Hommel’s Geography textbook. Here I have added the book to my course and hit edit in one section. By placing the cursor between text and an interactive text discussion prompt, then choosing the pop-up “Add” icon, I get the choice to add any of the following elements:

    Editing a textbook

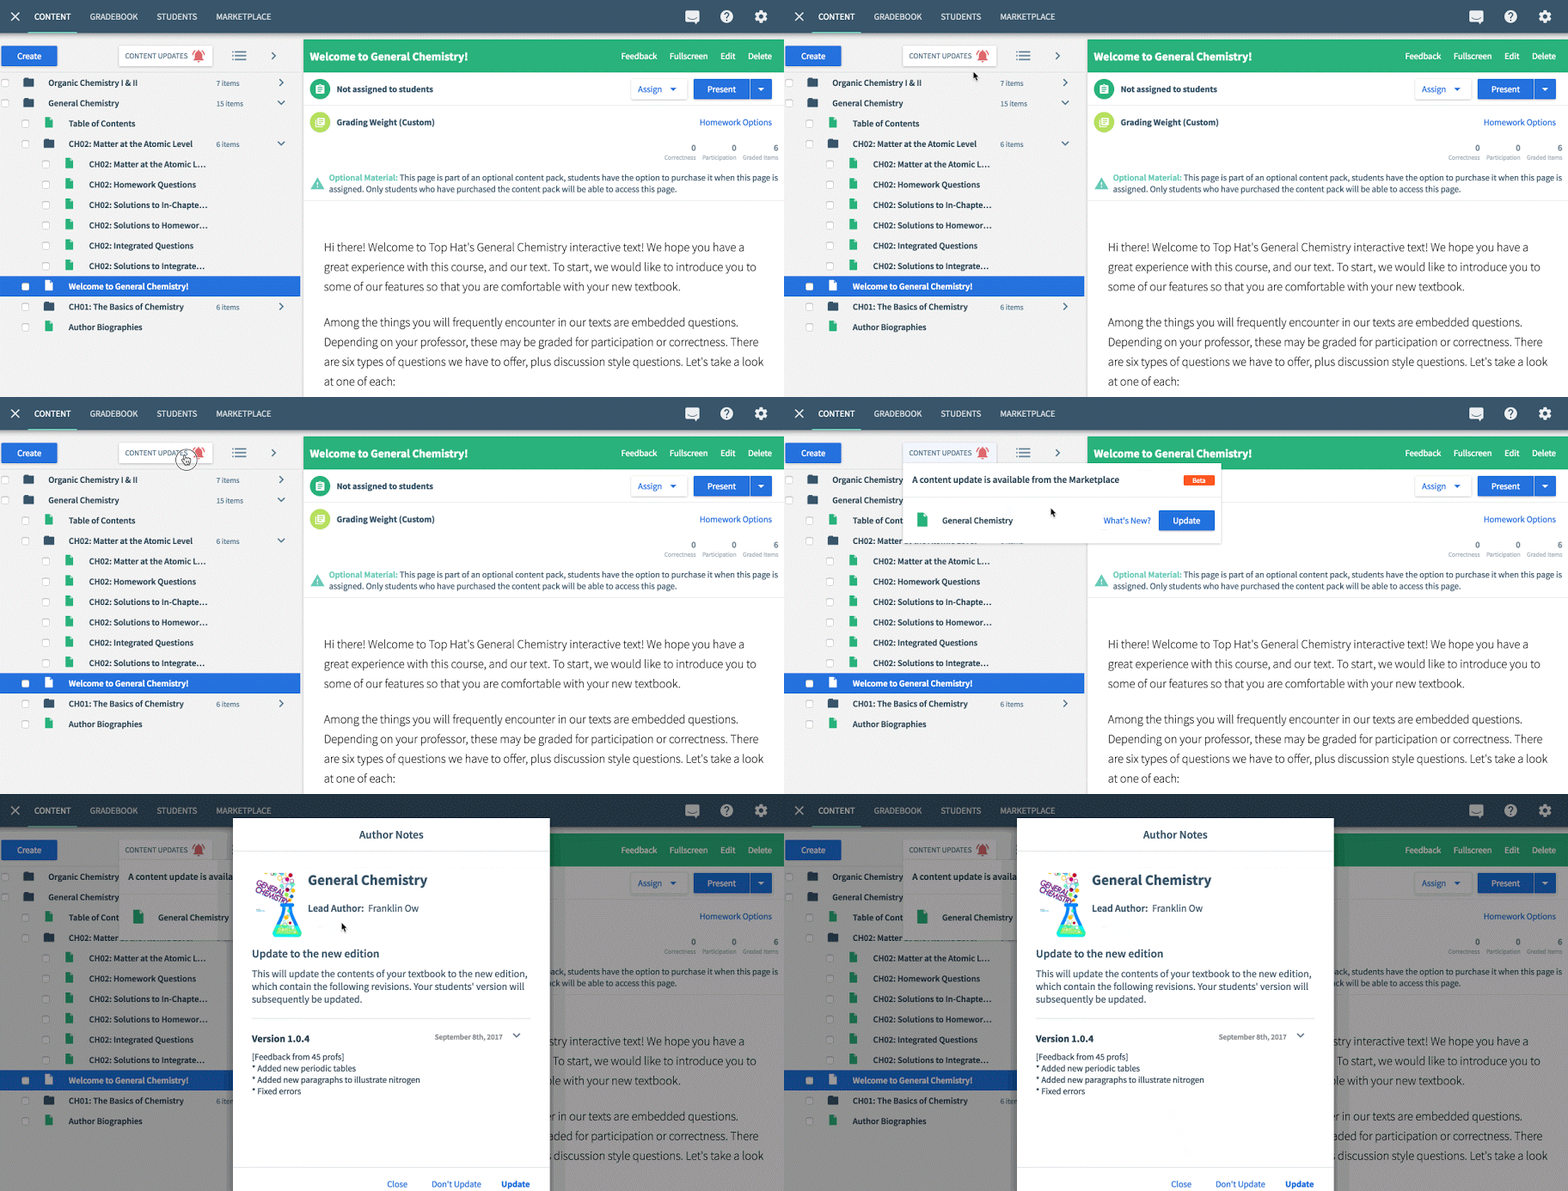
    This is the same interface as originally used to author the textbook. Beyond the ease of editing (customizing for my class, adding my content) is the apparent ease of accepting updates from the content author, based on a new feature introduced in a limited trial in September. The instructor sees a notification about updated content, reviews the updates, and (if all works out) decides whether to update while maintaining any customizations made by instructor.

    Method to accept revisions

    The functionality also promises to allow an instructor to review and adopt  customizations made by others who are working on the same base content.

    This is not an easy problem to solve, but if Top Hat is able to resolve how to deal with conflicting updates and local customizations, the intuitive user experience could change how faculty members and course designers collaborate and update content.

    Top Hat does have some real challenges in establishing themselves as a full-fledged content provider. One was mentioned by Hommel, when he pointed out the lack of broad awareness of the Marketplace amongst faculty even at his university. Top Hat is known for its classroom response and presentation systems, and with the Marketplace acting as a two-sided market, it needs sufficient supply of self-publishing content and sufficient numbers of adopting instructors.

    CEO Mike Silagadze response when I asked him about the adoption challenge is that the Classroom adoption, which they claim to be used “at 75% of North America’s leading colleges and universities and reaches millions of students”, has established Top Hat’s direct relationship with thousands of faculty members. In this way, they are betting that Demian Hommel is a model – aware of company through Classroom, interested in textbook usage based on self-publishing model, and willing to extend their personal usage of the company’s products.

    One other challenge is that it is not a done deal that self-publishing has sufficient demand on the content creation side. Are there enough instructors in a broad array of disciplines who want to invest the time and effort to create textbooks without a clear model of possible financial reward? This is the bet that Top Hat is making, that the market can grow to the point that there are reasonable clear answers on financial rewards. And there is the hope that there are enough Demian Hommels who are willing to make these commitments without financial drivers.

    I do not know if this product will take off, but if it does the Marketplace would establish a viable self-publishing model for faculty willing to work within the Top Hat platform. Over the past year in particular, the landscape of digital curricular materials is adding new models, and the Marketplace is worth watching.

    There is also an OER angle based on Top Hat’s marketing and the OpenStax partnership, which I’ll describe further in another post.

    Update 1/8: Corrected timing on change to student access and fees.

  • Cengage Unlimited Draws the Battle Lines in the Curricular Materials War

    Cengage Unlimited Draws the Battle Lines in the Curricular Materials War

    As Phil wrote about recently, Cengage has announced “Cengage Unlimited,” which is being described in various outlets as the “Netflix” or “Spotify” of curricular materials. It’s an all-you-can-eat digital subscription service to Cengage’s complete catalog. Spotify is probably the more apt comparison, both because the Netflix analogy is contaminated and because the music industry is a more apt analogy for the economic pressure this puts on content creators.

    Make no mistake; this is a potential inflection point in the curricular materials market. There is a war raging between curricular materials that are “good enough,” meaning that the lower price has a bigger impact on student outcomes than any differences in the quality of more expensive alternatives, versus “better enough,” meaning both instructors and students believe the product makes a sufficient difference in student outcomes that the more expensive product is worth the premium. Cengage is betting the farm on “good enough” beating out “better enough” and, win or lose, their bet could cause tectonic shifts in how curricular materials are developed, purchased, and used. It will have implications for inclusive access, adaptive courseware, textbook companies, textbook authors, and the landscape of options available to students and teachers.

    (more…)

  • Good Enough vs. Better Enough: The Macmillan Example

    Good Enough vs. Better Enough: The Macmillan Example

    In my recent post on Cengage Unlimited, I made a brief mention of the battle shaping up in the curricular materials world between “good enough” and “better enough.” I argued that Cengage is coming down on the “good enough” side by emphasizing all-you-can-eat pricing.

    The distinction I’m trying to make between two strategies is a little tricky. I’m not arguing that Cengage, for example, thinks that their products aren’t great or that they think all anybody needs is the cheapest PDF possible. And on the other hand, “better enough” no longer means better editing or better production values, which is the way that textbook publishers used to position themselves against OER (and still do sometimes, although that reflex is beginning to fade). Rather, it’s about improving student outcomes.

    To borrow a phrase from David Wiley, the fight boils down to standard deviations per dollar. ((“Standard deviation” is just statistics geek speak for a measure of difference—in this case, improvement—from the norm.)) This formulation boils the battle down to a fraction. In the numerator, we have impact. In the denominator, we have cost. David likes to say that it’s easier to change the denominator, i.e., reduce cost, than it is to change the numerator, i.e., improve student outcomes. One of the reasons this is true is that putting a different product in a class usually doesn’t have a big impact unless the instructor’s teaching practices also change to take better advantage of the product’s features. Or, if you prefer a formulation that emphasizes the teaching over the tools (which I do), digital courseware tends to have the most impact in classrooms where it supports the chosen pedagogical approach of the instructor.

    For the incumbents, neither the numerator nor the denominator is particularly easy to change. In my last two posts, I wrote about the major investments—and risks—that Cengage took on to deliver their products at a better price point and still make their business model work (they hope).

    But that may be a cake walk for the publishers compared with the challenge of changing the numerator. In my original post about Pearson’s efficacy strategy, I explored these challenges at length. I have chosen to quote a hefty excerpt here because none of these problems have gone away:

    Let’s think some more about the analogy to efficacy in health care. Suppose Pfizer declared that they were going to define the standards by which efficacy in medicine would be measured. They would conduct internal research, cross-reference it with external research, come up with a rating system for the research, and define what it means for medicines to be effective. They would then apply those standards to their own medicines. And, after all is said and done, they would share their system with physicians and university researchers in the hopes that the medical community might be reassured about the quality of Pfizer’s products and maybe even contribute some ideas to the framework around the edges. How confident would we be that what Pfizer delivers would consistently be in the objective best interest of improving health?…

    If Pearson were to say to faculty, “Here’s what we think we know about the efficacy of this product, here’s what we don’t know yet, and here is how we are thinking about the question,” they might get a number of responses. Maybe they would get, “Oh, well here’s how I know that it’s effective with my class.” Or “The reason that you don’t have a good answer on effectiveness yet is that your rubric doesn’t provide a way to capture the educational value that your product delivers for my students.” Or “I don’t use this product because it has direct educational effectiveness. It frees me up from some grunt work so that I can conduct activities with the class that have educational impact.” Most of all, if you’re [Pearson CEO] John Fallon, you really want faculty to say to their sales reps, “Huh. I never thought about the product in quite those terms, and it makes me think a little differently about how I might use it going forward. What can you tell me about the effectiveness of this other product that I’m thinking about using, at least as Pearson sees it?” And you really want your sales reps to run back to the product teams, hair on fire, saying “Quick! Tell me everything you know about the effectiveness of this product!”

    Pearson won’t get that conversation by just publishing end results of their internal analysis when they have them, which means that they have a high risk of failing to align their products with the needs and desires of their market if they think about the relationship between their framework and their customers in that way….

    There are a number of reasons why this part of the transformation will be at least as difficult as the part that Pearson is undertaking now. First, it is far from clear that the company has the trust of the academic community that would be necessary for them to take such a role. That would have to be built, in some cases from the ground (or even the basement) up. Pearson does have real strengths that are known within certain segments of the academic community—in data science, for example—but this does not transfer to a general reputation. Second (and relatedly), unlike the medical research community, the educational research community is still nascent and fragmented. Finding non-paternalistic but effective ways to bring that community together and facilitate useful conversations will be difficult to say the least. These two challenges are outside the company’s sphere of control, which means that Pearson will have to develop new ways to think about how to build their relationships with the broader educational community.

    Internally, changing the way they think about answering the questions that the framework asks them will entail as much subtle, difficult, and pervasive re-engineering of the corporate reflexes and business processes as the work being undertaken now….  [A]ll textbook companies that have been around for a while are wired for a particular relationship with faculty that is at the heart of how they design, produce, and sell their products. Their editors have gone through decades of tuning the way they think and work to this process, and so have their customers. When Pearson layers a discussion of efficacy onto these business processes, a tension is created between the old and new ways of doing things. Suddenly, authors and customers don’t necessarily get what they want from their products just because they asked for them. There are potentially conflicting criteria. The framework itself provides nothing to help resolve this tension. At best, it potentially scaffolds a norming conversation. But a product management methodology that can combine knowledge about efficacy, user desires, and usability requires more tools than that. And that problem is even worse in some ways now that product teams have multiple specialized roles. The editor, author, adopting teacher, instructional designer, cognitive science researcher, psychometrician, data scientist, and UX engineer may all work together to develop a unified vision for a product, but more often than not they are like the blind man and the elephant. Agreeing in principle on what attributes an effective product might have is not at all the same as being able to design a product to be effective, where “effective” is shared notion between the company and the customers. ((Believe it or not, that is a short excerpt as measured as a percentage of the total word count of the post.))

    Publishers that want to improve the numerator will have to completely rewire the ways that they work, both internally and externally. They need to rethink their product design process from the ground up while simultaneously completely resetting their relationships with their customers.

    That post was published on December 31st, 2013. As we enter 2018, we are beginning to see examples of what such efforts might look like. For today’s example, I’m going to draw on recent work by Macmillan.

    Resetting the Conversation

    Before I get into the details, a little more disclosure than usual is called for here. I am a paid member of Macmillan’s Learning Impact Research Advisory Council (IRAC). As such, I was paid to provide input on the paper I’m about to write about as well as the underlying research processes that the paper describes. I was not paid to write this post about the paper. Or rather, I was paid to write something about it, but I was asked to write one page—one page!—of private feedback on the paper. I asked if I could write my feedback as a public blog post of unspecified length. The folks at Macmillan agreed.

    The paper is called Unpacking the Black Box of Efficacy: A framework for evaluating the effectiveness and researching the impact of digital learning tools. Registration is required.

    First piece of feedback for Macmillan: If you really want to foster a new dialog with academics, don’t start it by requiring them to give you their email addresses just to read your paper.

    But the approach outlined in the paper is another matter. Recall that in the Pearson post quoted above, I advised the company to approach customers with something like the following proposition:

    Here’s what we think we know about the efficacy of this product, here’s what we don’t know yet, and here is how we are thinking about the question.

    That is essentially what Macmillan’s paper attempts to do. It starts with an inventory, in plain English, some common educational research methods, how they work, and what their strengths and weaknesses are. The section on randomized controlled trials (RCTs) alone is worth the price of admission, given how often it is simplistically held up as the “gold standard” in research. Any thoughtful educator reading the description of the process will immediately think, “Hey, that’s…problematic in education.”

    Even better, Macmillan was able to accomplish that with one page of text and one picture. They will need to be this incisive on a consistent basis if they are going to reach their intended audience.

    Next, the paper describes their product development lifecycle. Again, there is a good balance here of clarity and brevity. The first stage of that lifecycle is called “Co-design & Learning Research.” While publishers have pretty much always started their product design process with input from customers, I wouldn’t call the historic process “co-design.” Rather, it was typically an author/editor collaboration with some limited and focused customer input. More recently, publishers have developed all kinds of hybrid processes. But Macmillan at least claims to be starting with a clean sheet of paper. They are certainly not the only publisher to do this, but from a communication perspective, framing educational product design as a combination of co-design with customers and structured but comprehensible research is a good move.

    Speaking of which, the third section maps the various research methods described in the first section to the product design process in the second. There’s even a development timeline. The net effect is that educators (and students) have a clear and concise document explaining how Macmillan products are developed, how their potential learning impact is tested, and just how much it’s fair to say that the company knows about that impact at any stage in the development lifecycle.

    While I am by no means claiming credit, this paper reads as if it could have been written as a direct response to my critique of Pearson’s first iteration of efficacy.

    So yeah. I like it.

    Good Enough for What?

    You didn’t think I’d let them off that easily, did you?

    Remember waaay back, all the way at the beginning of the post, when I made the point that learning outcomes are hard to improve with curricular materials partly because their impact depends on what humans in the classroom do with them? That problem still looms, and Macmillan’s paper barely touches it.

    When I talk to students at length about the curricular materials that their instructors assign, their top complaint isn’t price. Don’t get me wrong; they hate the prices. But what they really hate is being told to buy a $200 book that the instructor barely mentions, let alone integrates into the class on a programmatic basis.

    This is what “better enough” is competing against. I always thought it was funny that textbook publishers refer to everything outside the book as “ancillaries,” because many instructors tend to see the categories as reversed. The book is ancillary. It’s not central to the learning that happens in the classroom. Before Macmillan, or any other publisher, can sell products based on the value proposition of “efficacy” or “learning impact” or “learning outcomes”, instructors must first come to believe that these three propositions are true:

    1. Instructors are responsible for learning how to improve their students’ learning outcomes by improving their teaching craft.
    2. Improving their teaching craft includes learning to employ research-validated practices.
    3. Macmillan’s products support and enable research-validated practices effectively enough that they can make the credible case for having more than “ancillary” value.

    This paper makes a good start—as good a start as any short paper can make—on the third proposition. The first proposition isn’t fair to lay at the publishers’ feet; it’s more driven by the incentives and culture of academia. It’s a problem, but not one that Macmillan or its peers can do much about directly. The second proposition is where the vendors, including but not limited to Macmillan, need to figure out how to do more.

    To be fair, the paper nibbles around the edges of this problem. The educators and product developers need to develop shared goals. That’s what a co-design process is for. Educators and product developers also need to develop a shared sense of proof that the goals are being met better by one method than another. A lot of the paper develops the basis for a conversation around this.

    But left implicit is the argument that education should be empirical and that empiricism needs to be formalized at least some of the time. There should be theories of learning impact and rules for what counts as evidence that supports or disproves those theories. This needs to apply not just to curricular materials design but for what happens in the classroom.

    It’s probably too much to expect this paper, as focused as it is, to open up this Pandora’s Box. This paper is, in part, a trust-building exercise, and Macmillan needs to build trust before they can fully own up to the fact that incorporating curricular materials that meaningfully improve learning outcomes usually entails a course redesign. But that’s where both Macmillan and the industry need to get to if they want to be able to sell more heavily researched and designed products at a higher price point.

    “Good enough” means “good enough for the way I use curricular materials in my classroom.” “Better enough” means “better enough that I’m convinced I should change the way I teach.” Macmillan has written a really good paper on the standards of proof they propose to live up to and how they propose to live up to them. But they also have to convince their customers to agree to live up to those same standards in their own teaching.

  • Before We Turn Over Curriculum To Apple And Amazon . . .

    Before We Turn Over Curriculum To Apple And Amazon . . .

    Recently I have been interviewed twice by EdSurge regarding education initiatives by the Big Five tech companies (Amazon and Apple, specifically). The first interview centered on iPads for all and Swift programming initiative at the Ohio State University.

    Hill believes Apple’s main motivation to do this collaboration with Ohio State was to sell devices.

    “The way I sort of look at them, Apple is like the Godot of education, where they’re the world’s largest company, and people keep waiting for them to do something meaningful in education, and not just sell devices, but actually get involved in education, change the game somehow,” says Hill.

    That has been a pattern with Apple, he argues, pointing to a big iPod program at Duke University in the early 2000s, which many see as failing to live up to the hype, or the failed iPad program at Los Angeles Unified School District more recently.

    Beyond the device sales, however, the more significant part of the initiative centered on programming skills:

    [The Apple / OSU collaboration] seeks to “integrate learning technology throughout the university experience,” an iOS design laboratory and opportunities for students to learn coding skills to make the ready for a career in the “app economy.”

    This plan is based on Apple’s “Everyone Can Code” initiative that sets up labs and a curriculum to teach students to program in Swift, Apple’s app language primarily designed for iOS, tvOS, watchOS, and macOS (although there are a small number cases of using it for Windows and Android). Just two weeks after the Ohio State news, Apple announced that “Australia’s RMIT Joins More Than 20 International Universities in Adopting Apple Curriculum”.

    Apple today announced the global expansion of its Everyone Can Code initiative to more than 20 colleges and universities outside of the US. These schools will now offer the App Development with Swift Curriculum, a full-year course designed by Apple engineers and educators to teach coding and app design to students of all levels and backgrounds. Now hundreds of thousands of students from around the world gain the opportunity to become proficient in the Swift programming language and build the fundamental skills they need to pursue careers in the booming app economy.

    In a second interview with EdSurge, I was asked about recent support from Amazon giving away Echo devices and promoting Alexa.

    In August, Amazon gifted 1,600 Echo Dots to engineering students at Arizona State University living in a new dorm. John German, an ASU spokesperson, said at the time that the university’s motivation was to develop an opportunity for its engineering students to get skills in the “emerging field” of voice technology. An Amazon spokesperson explained in August that Amazon officials imagine a world where their devices are entwined in student life.

    To push these efforts further, Amazon launched the Alexa Prize, a research competition where university teams developing new ideas for conversational artificial intelligence can get monetary prizes. A team from the University of Washington won the 2017 competition, getting $500,000. Applications are now open for the 2018 competition.

    My comments on the combination of moves by Apple and Amazon:

    For Phil Hill, an edtech consultant and blogger at e-Literate, it’s no surprise that big tech companies want college graduates to be familiar, if not well-versed, with their tools. He says these companies want to fill the gap “between traditional corporate training and higher education,” creating a “tighter connection” between students getting a college degree and an initial job with the needed skills.

    It’s not a new endeavor by any means. Hill remembers that in the 1980s, Sun Microsystems provided workstations for university students. The company’s business plan explicitly stated under its marketing approach to put “SUN workstations into selected universities to gain visibility.” The idea, says Hill, was to get people “sort of hooked on using Unix” and programming skills that could be used in the workforce.

    Sun also worked closely with schools to establish physical training centers. In 1999 the company and the University of Pittsburgh opened an “Academic Java Center” meant to train and certify students in Java technology.

    Beyond showing my age, what I wanted to highlight with the SUN comments is that there has been a big change in tech industry that colleges and universities should be cautious about. The big five tech companies operate on closed ecosystems, with custom programming languages, custom devices, and proprietary platforms. Whereas the focus on Java in the 80s and 90s enabled students to learn a general-purpose language that could run on any number of platforms, Swift is primarily for the Apple devices, and Alexa is for Echo. Company-specific languages and technology.

    The initiatives from Apple and Amazon are not just to give out freebies, they intend to get more students learning their proprietary languages and coming out of college with skills applicable to their closed ecosystems. Also mentioned by EdSurge is an initiative from Google to promote its virtual reality platform Daydream. These efforts specifically include designing curricula for higher education institutions to adopt.

    Perhaps it would be useful to compare these recent initiatives with the Cisco Networking Academy, which provides curriculum and support for 9,500 schools and over 1 million students worldwide that “identifies and develops the skills people and businesses need to thrive in a digital economy”. ((Disclosure: Cisco is a past client of MindWires, our consulting business, including advice on Networking Academy. Amazon is also a past client.)) The Networking Academy also includes Cisco hardware and software as part of their package, and there is a focus on Cisco-specific platforms.

    One difference, however, is that the Networking Academy can lead to general-purpose certifications in addition to Cisco-specific ones, including those for C, C++, Linux, and CompTIA entry-level computer installation.

    What we see here is an evolution of big-tech support for colleges and universities that mirrors the general tech industry migration from more-open to more-closed ecosystems. Higher education institutions need to be fully aware of and cautious of these changes, as the more recent efforts lose most of the general-purpose educational outcomes and encourage students to move into a closed ecosystem. An Ohio State U graduate of the future who has gone through the Everyone Can Code curriculum will be much more likely to remain an iOS app programmer than an Android programmer, for example. This means that the schools entering into the new partnerships are tying themselves much more closely with specific companies than was the case in the past.

    There are real benefits to these initiatives (even though the iPads for all benefits are overblown), but these decisions should not be taken lightly just for the promise of free stuff. There are real implications to tying curriculum to specific company ecosystems. And maybe schools would do well to insist that these partnerships include support for alternative languages and more general-purpose learning outcomes.

    Update 12/30: Clarified language that while Swift is primarily designed for Apple devices, it can be used in cases for others. See comments below for additional info.