e-Literate

Present is Prologue

Tag: ANGEL

  • State of Higher Ed LMS Market for US and Canada: Spring 2016 Edition

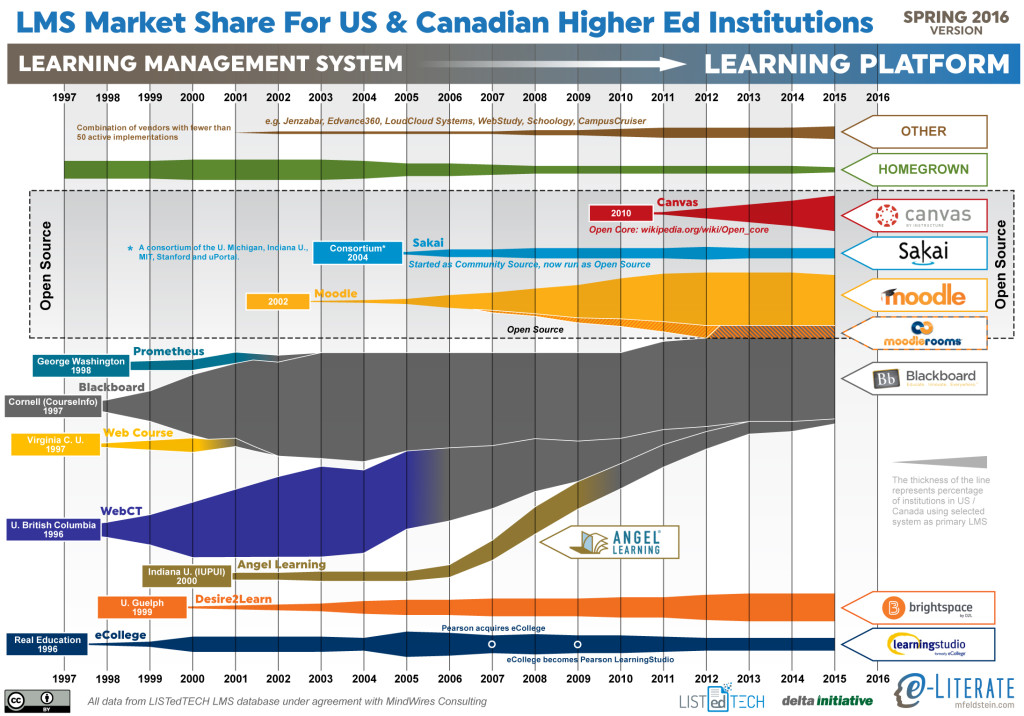
    This is the eighth year I have shared the LMS market share graphic, commonly known as the squid graphic, for (mostly) US higher education. The original idea remains – to give a picture of the LMS market in one page, highlighting the story of the market over time. The key to the graphic is that the width of each band represents the percentage of institutions using a particular LMS as its primary system.

    This year marks a significant change based on our upcoming LMS subscription service. We are working with LISTedTECH to provide market data and visualizations. This data source provides historical and current measures of institutional adoptions, allowing new insights into how the market has worked and current trends. This current graphic gets all of its data from LISTedTECH. Where previous versions of the graphic used an anchoring technique, combining data from different sources in different years, with interpolation where the data was unavailable. Now, every year’s data is based on this single data source.

    This graphic has been in the public domain for years, however, and we think it best to keep it that way. In this way we hope that the new service will provide valuable insight for subscribers but also improve what we continue to share here on the e-Literate blog.

    Since we have data over time now and not just snapshots, we have picked the end of each year for that data. For this reason, the data goes through the end of 2015. We have 2016 data but chose not to share partial-year results in an effort to avoid confusion.
    LMS_MarketShare_20160316

    A few items to note:

    • As noted in previous years, the fastest-growing LMS is Canvas. There is no other solution close in terms of matching the Canvas growth.
    • Blackboard continues to lose market share, although the vast majority of that reduction over the past two years has been from customers leaving ANGEL. Blackboard Learn lost only a handful of clients in the past year.
    • While the end-of-life occurs next year, Pearson’s has announced LearningStudio’s end-of-life for the end of 2017.
    • With the new data set, the rapid rise and market strength of WebCT becomes much more apparent than previous graphics.
    • There is a growing line for “Other”, capturing the growth of those systems with less than 50 active implementations as primary systems; systems like Jenzabar, Edvance360, LoudCloud Systems, WebStudy, Schoology, and CampusCruiser.
    • While we continue to show Canvas in the Open Source area, we have noted a more precise description as an Open Core model.

    For a better description of the upcoming LMS subscription service, read this post and / or sign up for more information here.
  • State of the US Higher Education LMS Market: 2015 Edition

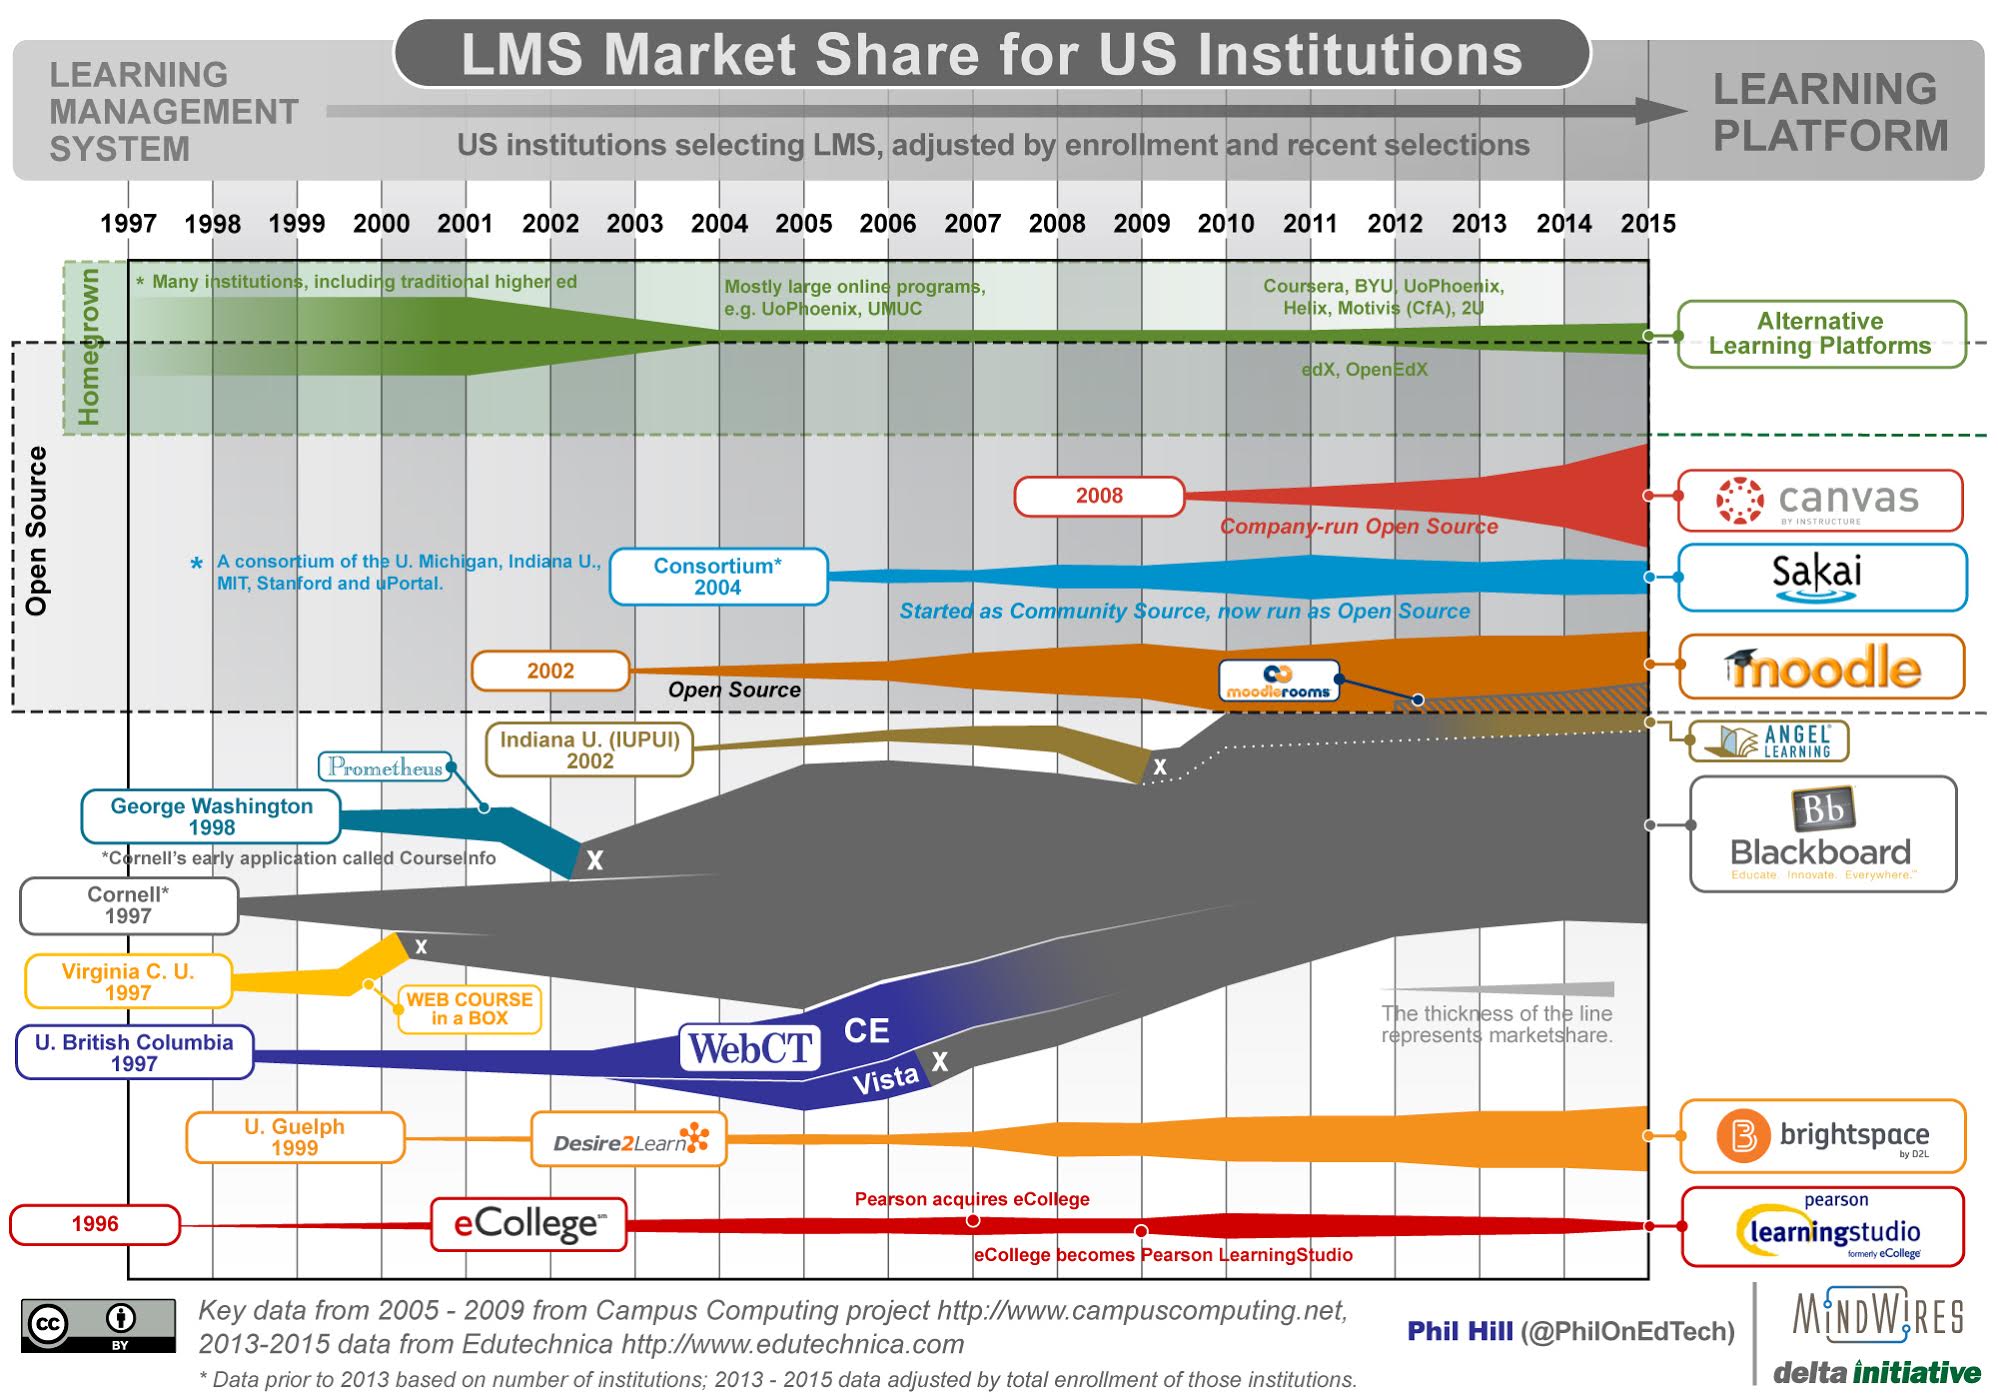
    I shared the most recent graphic summarizing the LMS market in October 2014, and thanks to revised data sources it’s time for an update. As with all previous versions, the 2005 – 2009 data points are based on the Campus Computing Project, and therefore is based on US adoption from non-profit institutions. This set of longitudinal data provides an anchor for the summary.

    The primary data source for 2013 – 2015 is Edutechnica, which not only does a more direct measurement of a larger number of schools (viewing all schools in IPEDS database with more than 700 FTE enrollments), but it also allows scaling based on enrollment per institution. This means that the latter years now more accurately represent how many students use a particular LMS. This post at Edutechnica provides the most recent data for Fall 2015.

    A few items to note:

    • The most important recent feature of the market – the rapid rise of Canvas, surpassing D2L and quickly closing in on Moodle – is quite visible now.
    • Blackboard Learn appears to have stopped its well-documented losses in US higher ed and has even risen in the past year. Its market share is far smaller than at its 2009 peak, but the company is no longer losing large numbers of clients each year.
    • D2L, Sakai, and Moodle have risen ever so slightly, but in effect have hit a plateau.
    • ANGEL and eCollege have lost market share.
    • There is a growing area of “Alternative Learning Platforms” that includes OpenEdX, 2U, Helix and Motivis (the newly commercialized learning platform from College for America).
    • While the data is more solid than 2012 and prior years, keep in mind that you should treat the graphic as telling a story of the market rather than being a chart of exact data.
    • Update (10/16): Removed “Curtin University as origin of Moodle based on Martin’s comments. Mea culpa – should have caught this earlier.
    • Update (10/23): Changed graphic title to refer to US and not North America.

    LMS_MarketShare_20151023

  • State of the US Higher Education LMS Market: 2014 Edition

    I shared the most recent graphic summarizing the LMS market in November 2013, and thanks to new data sources it’s time for an update. As with all previous versions, the 2005 – 2009 data points are based on the Campus Computing Project, and therefore is based on US adoption from non-profit institutions. This set of longitudinal data provides an anchor for the summary.

    The primary data source for 2013 – 2014 is Edutechnica, which not only does a more direct measurement of a larger number of schools (viewing all schools in IPEDS database with more than 800 FTE enrollments), but it also allows scaling based on enrollment per institution. This means that the latter years now more accurately represent how many students use a particular LMS.

    A few items to note:

    • Despite the addition of the new data source and its inclusion of enrollment measures, the basic shape and story of the graphic have not changed. My confidence has gone up in the past few years, but the heuristics were not far off.
    • The 2013 inclusion of Anglosphere (US, UK, Canada, Australia) numbers caused more confusion and questions than clarity, so this version goes back to being US only.
    • The Desire2Learn branding has been changed to Brightspace by D2L.
    • The eCollege branding has been changed to Pearson LearningStudio.
    • There is a growing area of “Alternative Learning Platforms” that includes University of Phoenix, Coursera, edX and OpenEdX, 2U, Helix and Motivis (the newly commercialized learning platform from College for America).
    • While the data is more solid than 2012 and prior years, keep in mind that you should treat the graphic as telling a story of the market rather than being a chart of exact data.

    LMS_MarketShare_20141107

    Some observations of the new data taken from the post on Edutechnica from September:

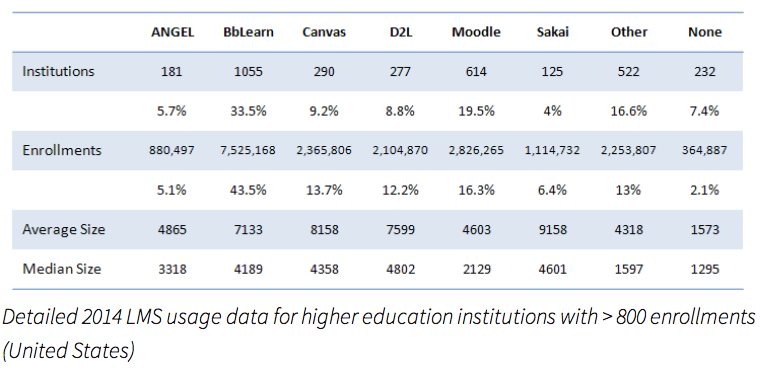
    • Blackboard’s BbLearn and ANGEL continue to lose market share in US -[1] Using the 2013 to 2014 tables (> 2000 enrollments), BbLearn has dropped from 848 to 817 institutions and ANGEL has dropped from 162 to 123. Using the revised methodology, Blackboard market share for > 800 enrollments now stands at 33.5% of institutions and 43.5% of total enrollments.
    • Moodle, D2L, and Sakai have no changes in US – Using the 2013 to 2014 tables (> 2000 enrollments), D2L has added only 2 schools, Moodle none, and Sakai 2 schools.
    • Canvas is the fasted growing LMS and has overtaken D2L – Using the 2013 to 2014 tables (> 2000 enrollments), Canvas grew ~40% in one year (from 166 to 232 institutions). For the first time, Canvas appears to have have larger US market share than D2L (13.7% to 12.2% of total enrollments using table above).
  • New LMS Market Data: Edutechnica provides one-year update

    In Fall 2013 we saw a rich source of LMS market data emerge.

    George Kroner, a former engineer at Blackboard who now works for University of Maryland University College (UMUC), has developed what may be the most thorough measurement of LMS adoption in higher education at Edutechnica (OK, he’s better at coding and analysis than site naming). This side project (not affiliated with UMUC) started two months ago based on George’s ambition to unite various learning communities with better data. He said that he was inspired by the Campus Computing Project (CCP) and that Edutechnica should be seen as complementary to the CCP.

    The project is based on a web crawler that checks against national databases as a starting point to identify the higher education institution, then goes out to the official school web site to find the official LMS (or multiple LMSs officially used). The initial data is all based on the Anglosphere (US, UK, Canada, Australia), but there is no reason this data could not expand.

    There is new data available in Edutechnica’s one-year update, with year-over-year comparisons available as well as improvements to the methodology. Note that the methodology has improved both in terms of setting the denominator and in terms of how many schools are included in the data collection.

    The Fall 2014 data which now includes all schools with more than 800 enrollments:

    (more…)

  • Two-Year Anniversary of Blackboard Acquisition of Moodlerooms and NetSpot

    Two years ago today, Blackboard made a dramatic change of course with a series of public announcements:

    At the time I described these changes:

    Most of the discussion in articles and blogs follows the meme of Blackboard entering open source, or even the meme of Blackboard acquiring competitors. I think the news is more significant than either of these two memes.

    Blackboard just did a 180-degree turn on their strategy for their core LMS business. They have moved from consolidating all customers into Learn 9.1 to providing products and services that are almost LMS-agnostic.

    Archive of Statements

    Given this dramatic turn of events, I wrote an additional post that captured the public statements (press releases, blog posts) from Blackboard, Moodlerooms, NetSpot, and even Blackboard competitors for the purpose of checking to see if the acquisitions really did signal a true change in strategy and support for open source. This two-year anniversary seems the perfect time to check up.

    Bb’s Previous Open Source View

    Just how big of a change did the announcements represent? Consider Blackboard’s moves regarding alternative LMS solutions in the previous six years. (more…)

  • The Resilient Higher Ed LMS: Canvas is the only fully-established recent market entry

    For a few years starting in 2009, it seemed one of the best ways to raise VC funds or corporate internal investment was to say “we can beat Blackboard with a new cloud-based platform”. Witness Coursekit / Lore, Instructure / Canvas, OpenClass, LoudCloud Systems, Helix, and even more recently MOOC platforms. There were many articles written as these new systems entered the market, but what if we look back and ask whether the LMS market has actually changed recently? The picture that emerges is one of surprising resiliency by the established LMS providers.

    In fact, I would argue that in the past eight years (at least in North America) the only new system that has fully established itself in the LMS market is Canvas. Note that I have combined WebCT and ANGEL within the Blackboard umbrella, but even these systems established themselves more than a decade ago.

    (more…)

  • State of the Anglosphere’s Higher Education LMS Market: 2013 Edition

    I shared the most recent graphic summarizing the LMS market in September 2012, and thanks to new data sources it’s time for an update. As with all previous versions, the 2005 – 2009 data points are based on the Campus Computing Project, and therefore is based on US adoption from non-profit institutions. This set of longitudinal data provides an anchor for the summary.

    What I’ve been attempting to do lately is to expand the market definition beyond the US. Last year I used some heuristics:

    LMS_MarketShare_20121018-Home

    (more…)