e-Literate

Present is Prologue

Tag: Prometheus

  • State of Higher Ed LMS Market for US and Canada: 2018 Year-End Edition

    State of Higher Ed LMS Market for US and Canada: 2018 Year-End Edition

    This is the eleventh year I have shared the LMS market share graphic, commonly known as the squid graphic, for US and Canadian higher education. This past year we at e-Literate shifted our LMS Market Analysis reports from Spring / Fall to Mid-Year / End-of-Year to better allow analysis of entire years. With the release of our end-of-2018 report last week to subscribers, it’s time for us to look at updates on the institutional LMS market for North America (US and Canada) higher education. Note that our coverage for the market analysis includes Europe, Latin America, Oceania (Australia, New Zealand, and surrounding island countries) as well as emerging coverage of the Middle East.

    We present the following data “by institutions”, with market share as a percentage of the total number of institutions using each LMS as a primary system, and “by enrollments”, where we scale the institutions by its total enrollment. The latter better captures the business of the LMS market, since most licensing deals are based the number of students.

    But first, let’s look at an updated LMS market share graphic, commonly known as the squid graphic, for US and Canadian higher education. The original idea remains – to give a picture of the LMS market in one page, highlighting the story of the market over time. The key to the graphic is that the width of each band represents the percentage of institutions using a particular LMS as its primary system.
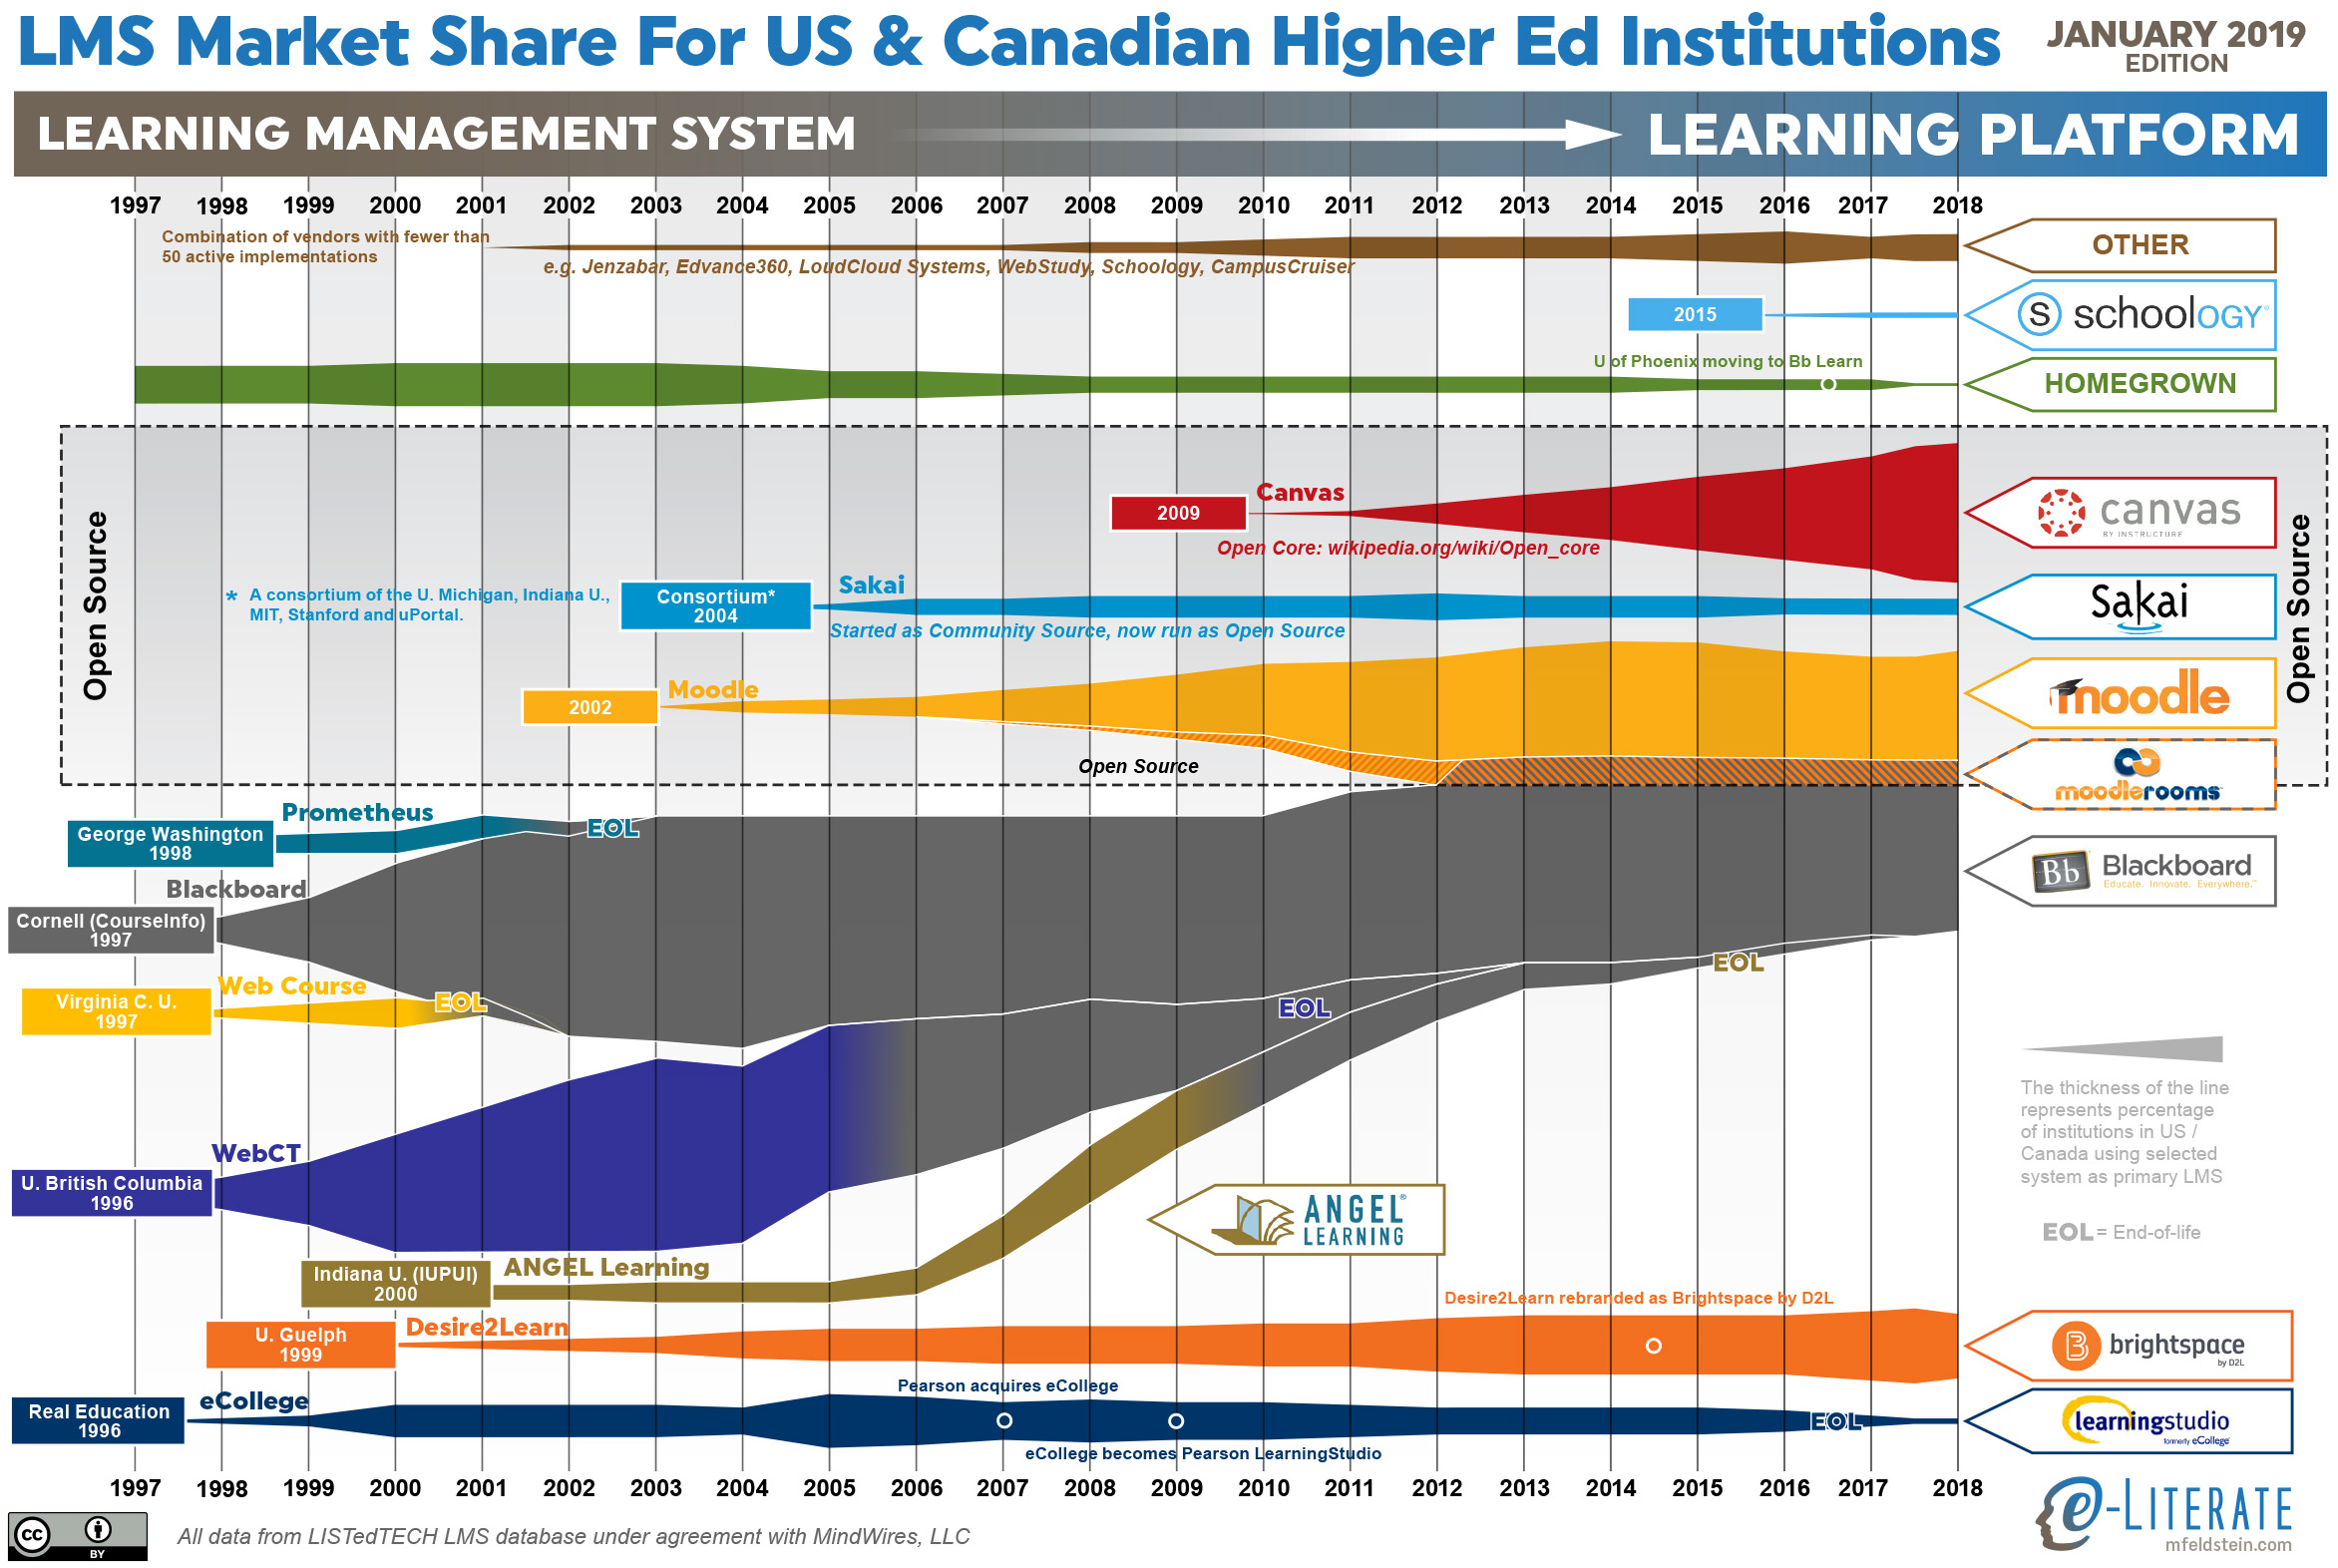
    Higher ed LMS market share for US and Canada, January 2019

    This year there are two inter-related trends that deserve a broader explanation -the LMS market slowed down with less activity overall, and Canvas and Blackboard continue to be neck-and-neck in the top spot of this market.

    We recently described the overall market activity slowdown in that there are fewer LMS formal evaluations taking place since mid 2018, with initial data pointing to a 20 – 25% drop from a year earlier. This slowdown seems to be a type of plateau rather than a continuing trend, and we are watching to see if it is temporary or not.

    Last summer we shared the symbolic passing of the torch where Canvas surpassed Blackboard in US market share, which was the first time Blackboard was not the top system since the market emerged two decades ago. What is interesting is that half a year later, the two systems are still neck-and-neck. In the US Canvas is still slightly ahead, and in North America (adding in Canada), Blackboard remains in the top spot by 0.4% (26.8% to 26.4%). Why is Canvas not continuing to extend its lead? Looking at the underlying data, there seems to be three reasons to consider:

    • The overall market slowdown means that there are fewer deals for Canvas to win lately.
    • Blackboard continues its University of Phoenix implementation, which still includes dozens of campuses despite its enrollment drop.
    • The shutdown in December of the for-profit Education Corporation of America (Virginia College and Brightwood College systems) meant that Canvas lost several dozen campuses.

    The latter two points should fully play out in the next three months, possibly making this a one-time change in trends, but it is important to call this situation out.

    Some other notes:

    • The market continues to consolidate around the Big Four – Blackboard, Canvas, D2L Brightspace, and Moodle.
    • The Homegrown option for LMS usage is going away, at least in a statistical sense. Only a handful of schools even consider this option.
    • D2L shares the challenge of having picked up several large for-profit systems that are closing campuses and therefore hurting market share. In D2L’s case, the biggest one is the former EDMC schools – the Art Institutes, Argosy University, and South University – that were sold out of bankruptcy to a non-profit entity and have closed dozens of campuses over the past year. These losses offset many of D2L’s wins in 2018.
    • Moodle had a few new wins in North America.

    Sticking with North America, we can also show LMS market share scaled by the enrollment of each institution, giving a different measure worth considering.
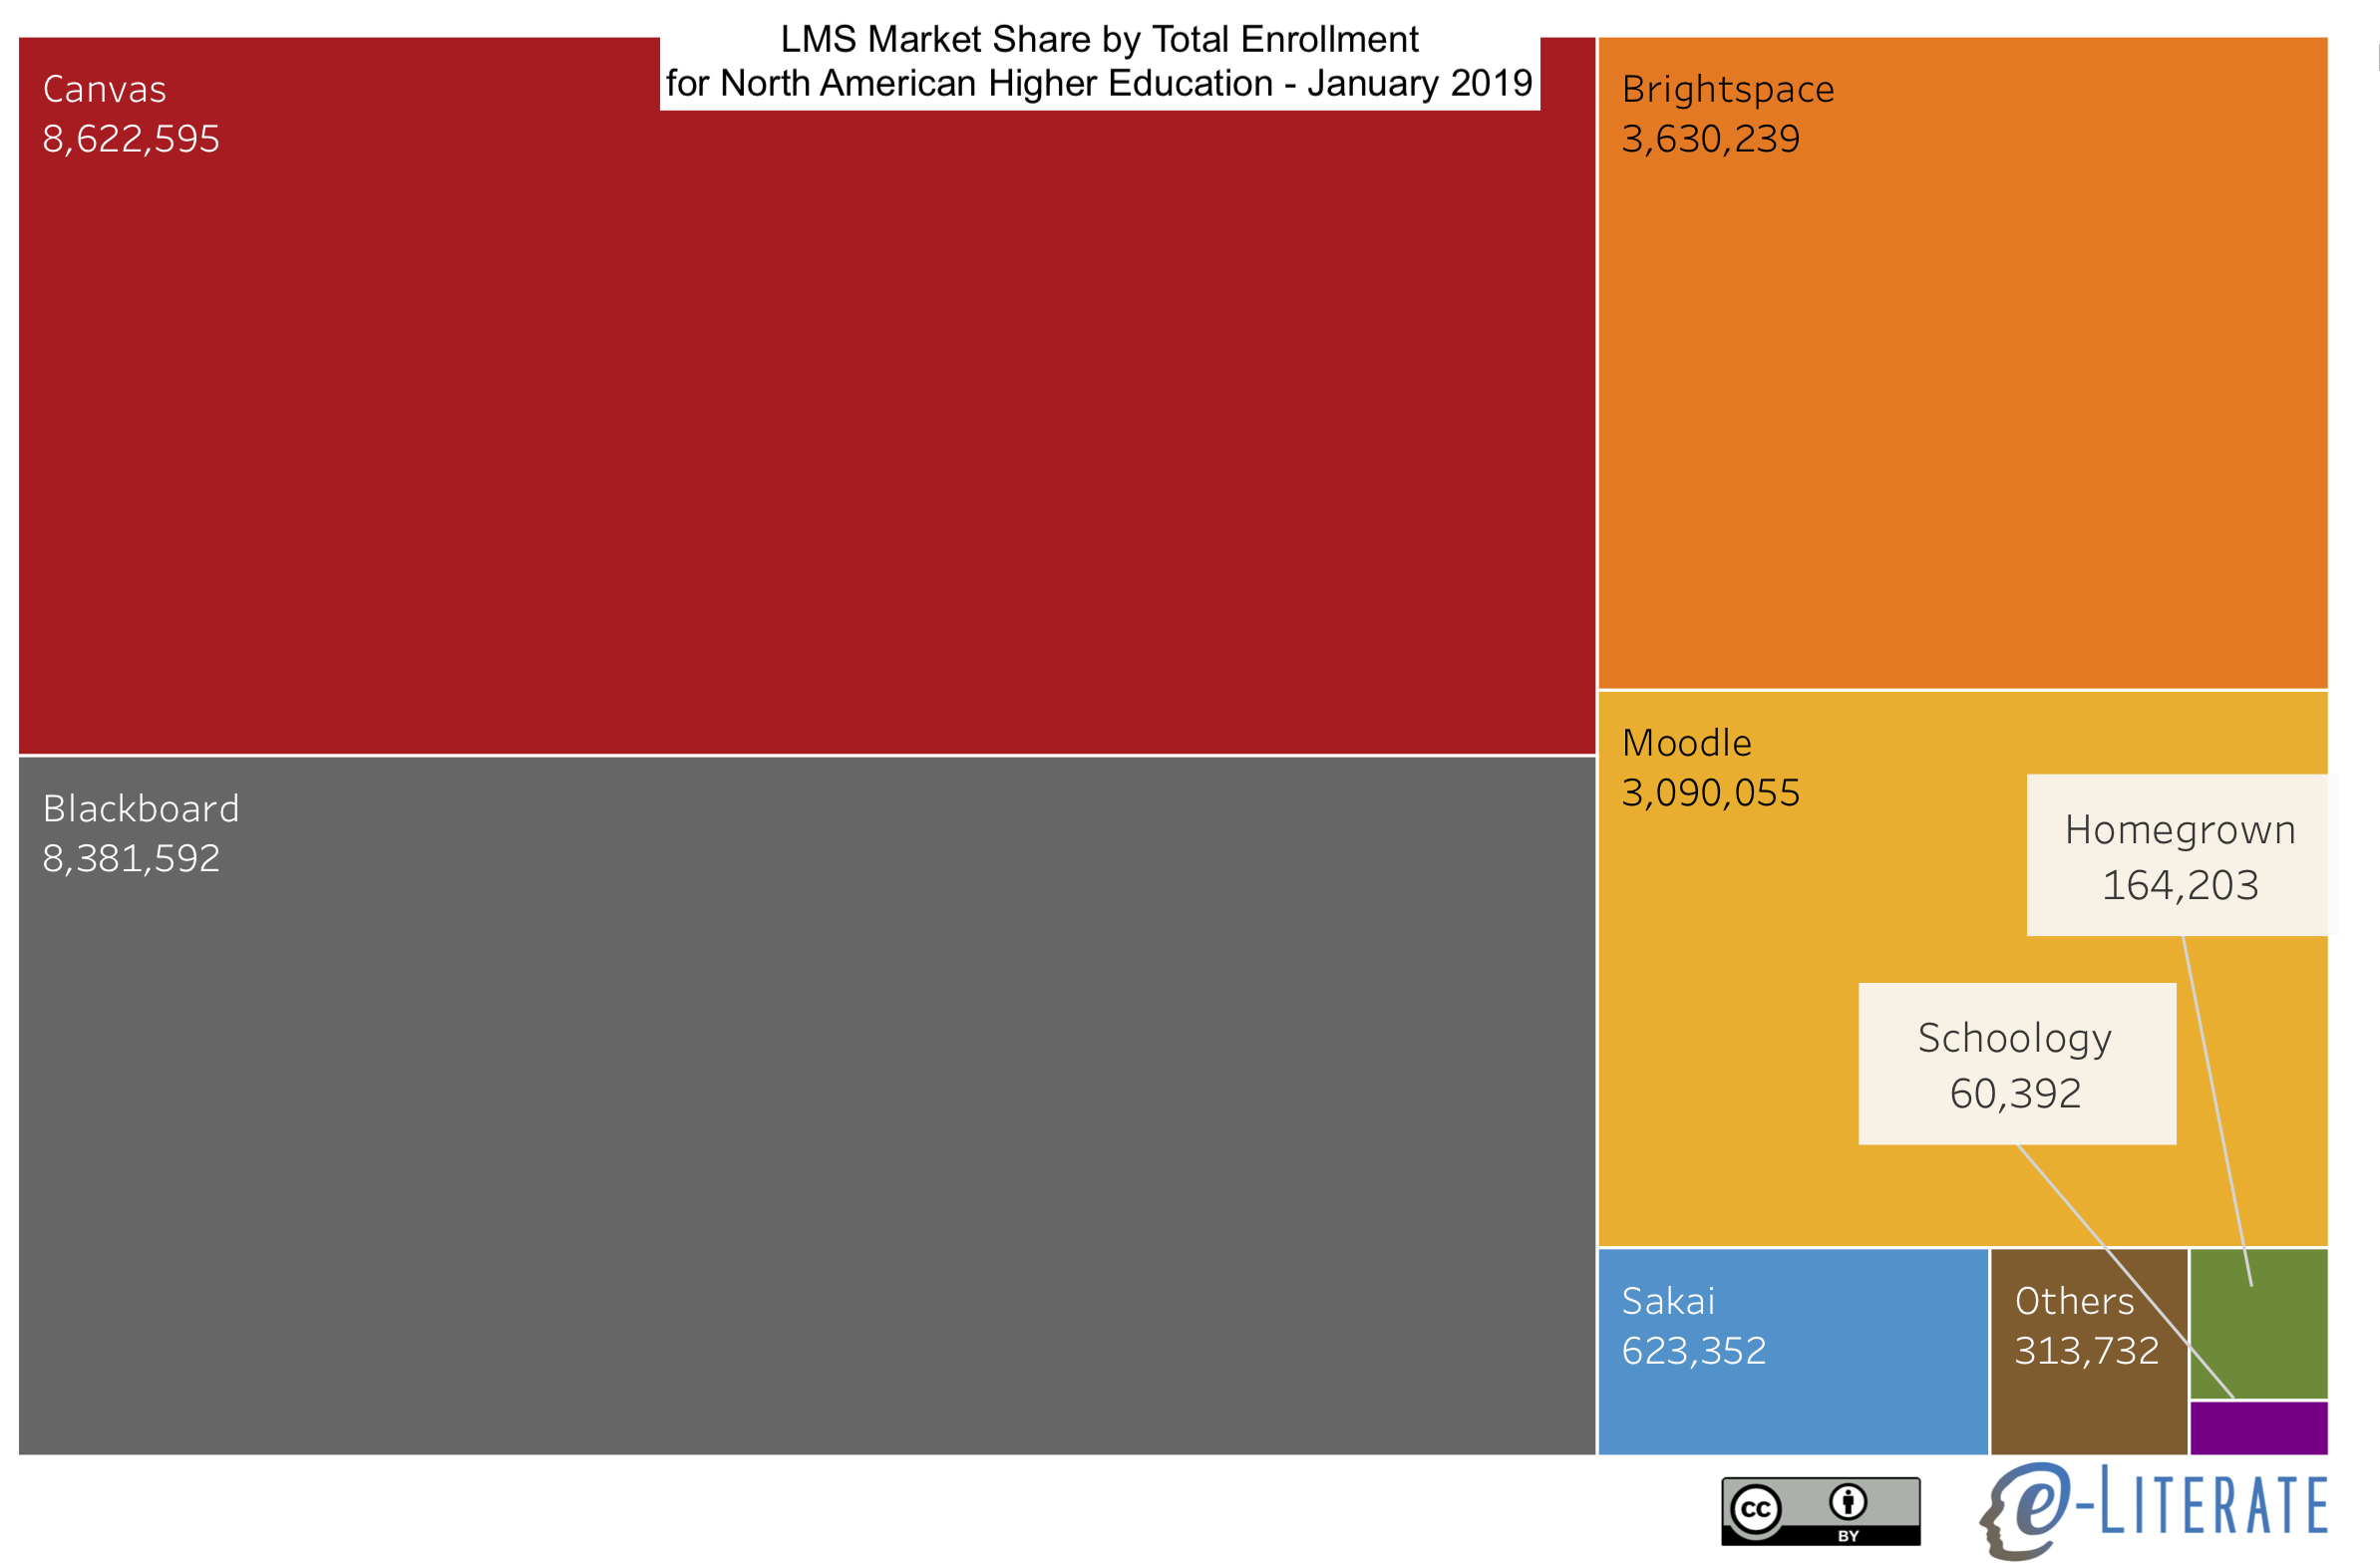
    NA LMS Market Share by Enrollment

    We’ll share more information on other global regions in the coming months.

  • State of Higher Ed LMS Market for US and Canada: Fall 2017 Edition

    State of Higher Ed LMS Market for US and Canada: Fall 2017 Edition

    Now that we’re past the 2017 WCET conference and headed to the EDUCAUSE conference, let’s look at updates on the institutional LMS market for North America (US and Canada). Last year we started our LMS market analysis service, where we are working with LISTedTECH to provide market data and visualizations, and our fall report for subscribers will be released in about a month. Data for 2017 presented below goes through October 1 of this year.

    We present the data “by institutions”, with market share as a percentage of the total number of institutions using each LMS as a primary system, and “by enrollments”, where we scale the institutions by their total enrollment. The latter better captures the business of the LMS market, since most licensing deals are based the number of students. We have also included data from Fall 2016 by institutions for comparison purposes.

    Some notes on the market share as defined by percentage of institutions:

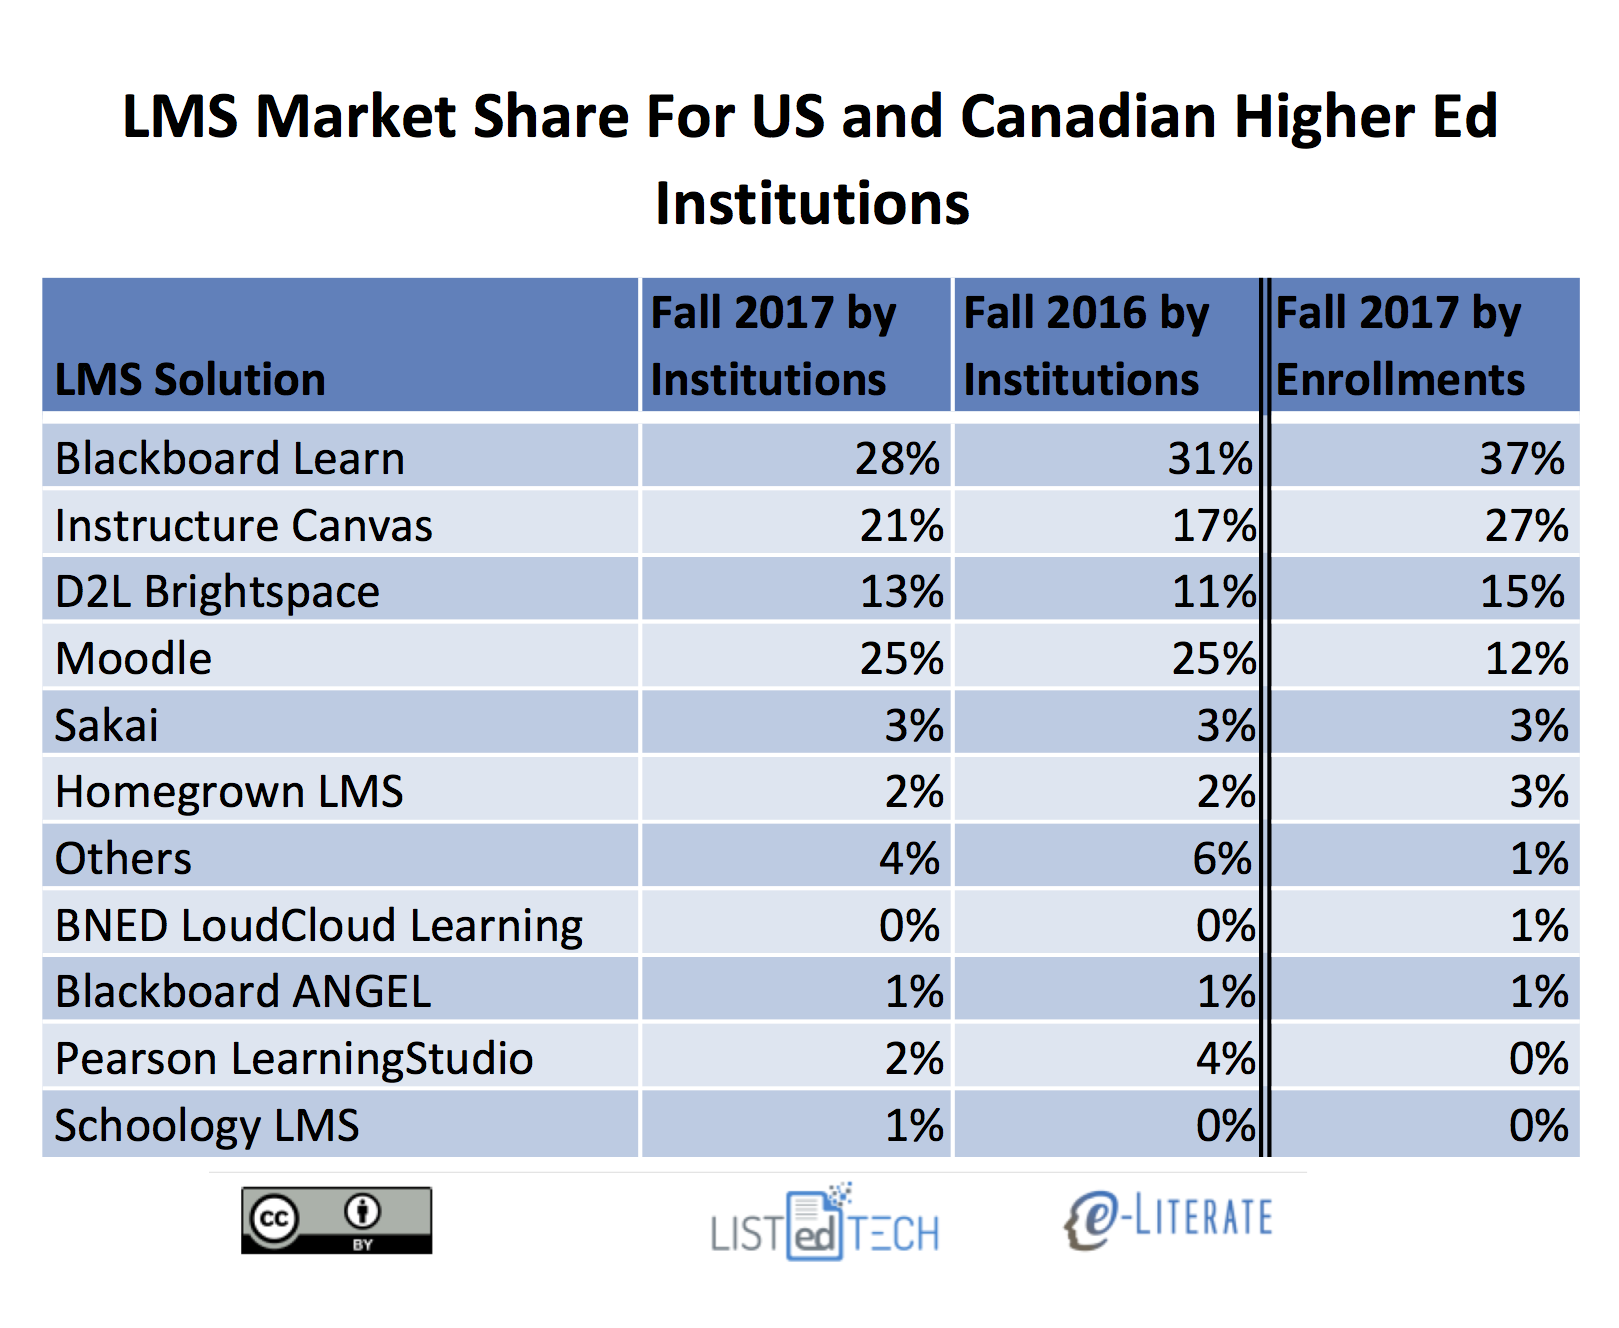
    • In terms of new selections the market continues to be a two-horse race recently with Canvas by Instructure and Brightspace by D2L as the only two solutions with material gains in market share. Canvas grew from 17% to 21% , and Brightspace from 11% to 13%, of the market.
    • Outside of the big four – Blackboard Learn, Canvas, D2L Brightspace, and Moodle – no other system has more than 3% of the market measured either by percentage of institutions or percentage of enrollments. Furthermore, the category of “Others”, capturing systems not listed above and having less than 1% market share, actually dropped from 4% to 2% of the market. This indicates that continued market consolidation.
    • Schoology and BNED LoudCloud grew slightly, but not nearly to the degree of the Canvas and Brightspace.
    • Blackboard Learn fell the farthest, from 31% to 28% of of the market. The second biggest drop was Pearson LearningStudio, from 4% to 2%, based on its end-of-life notice for December 2017.
    • Moodle and Sakai both lost market share of just under 1%, not enough to show up in the rounded numbers in the table but enough to show up in our underlying data.
    • The difference in Moodle’s market share by institutions at 25% and by enrollments at 12% really shows how concentrated their usage is for smaller schools.
    • When viewing market share as defined by percentage of enrollments, Blackboard and Canvas are the most-used systems, at 37% and 27% of the market, followed by D2L at 15% and Moodle at 12%.

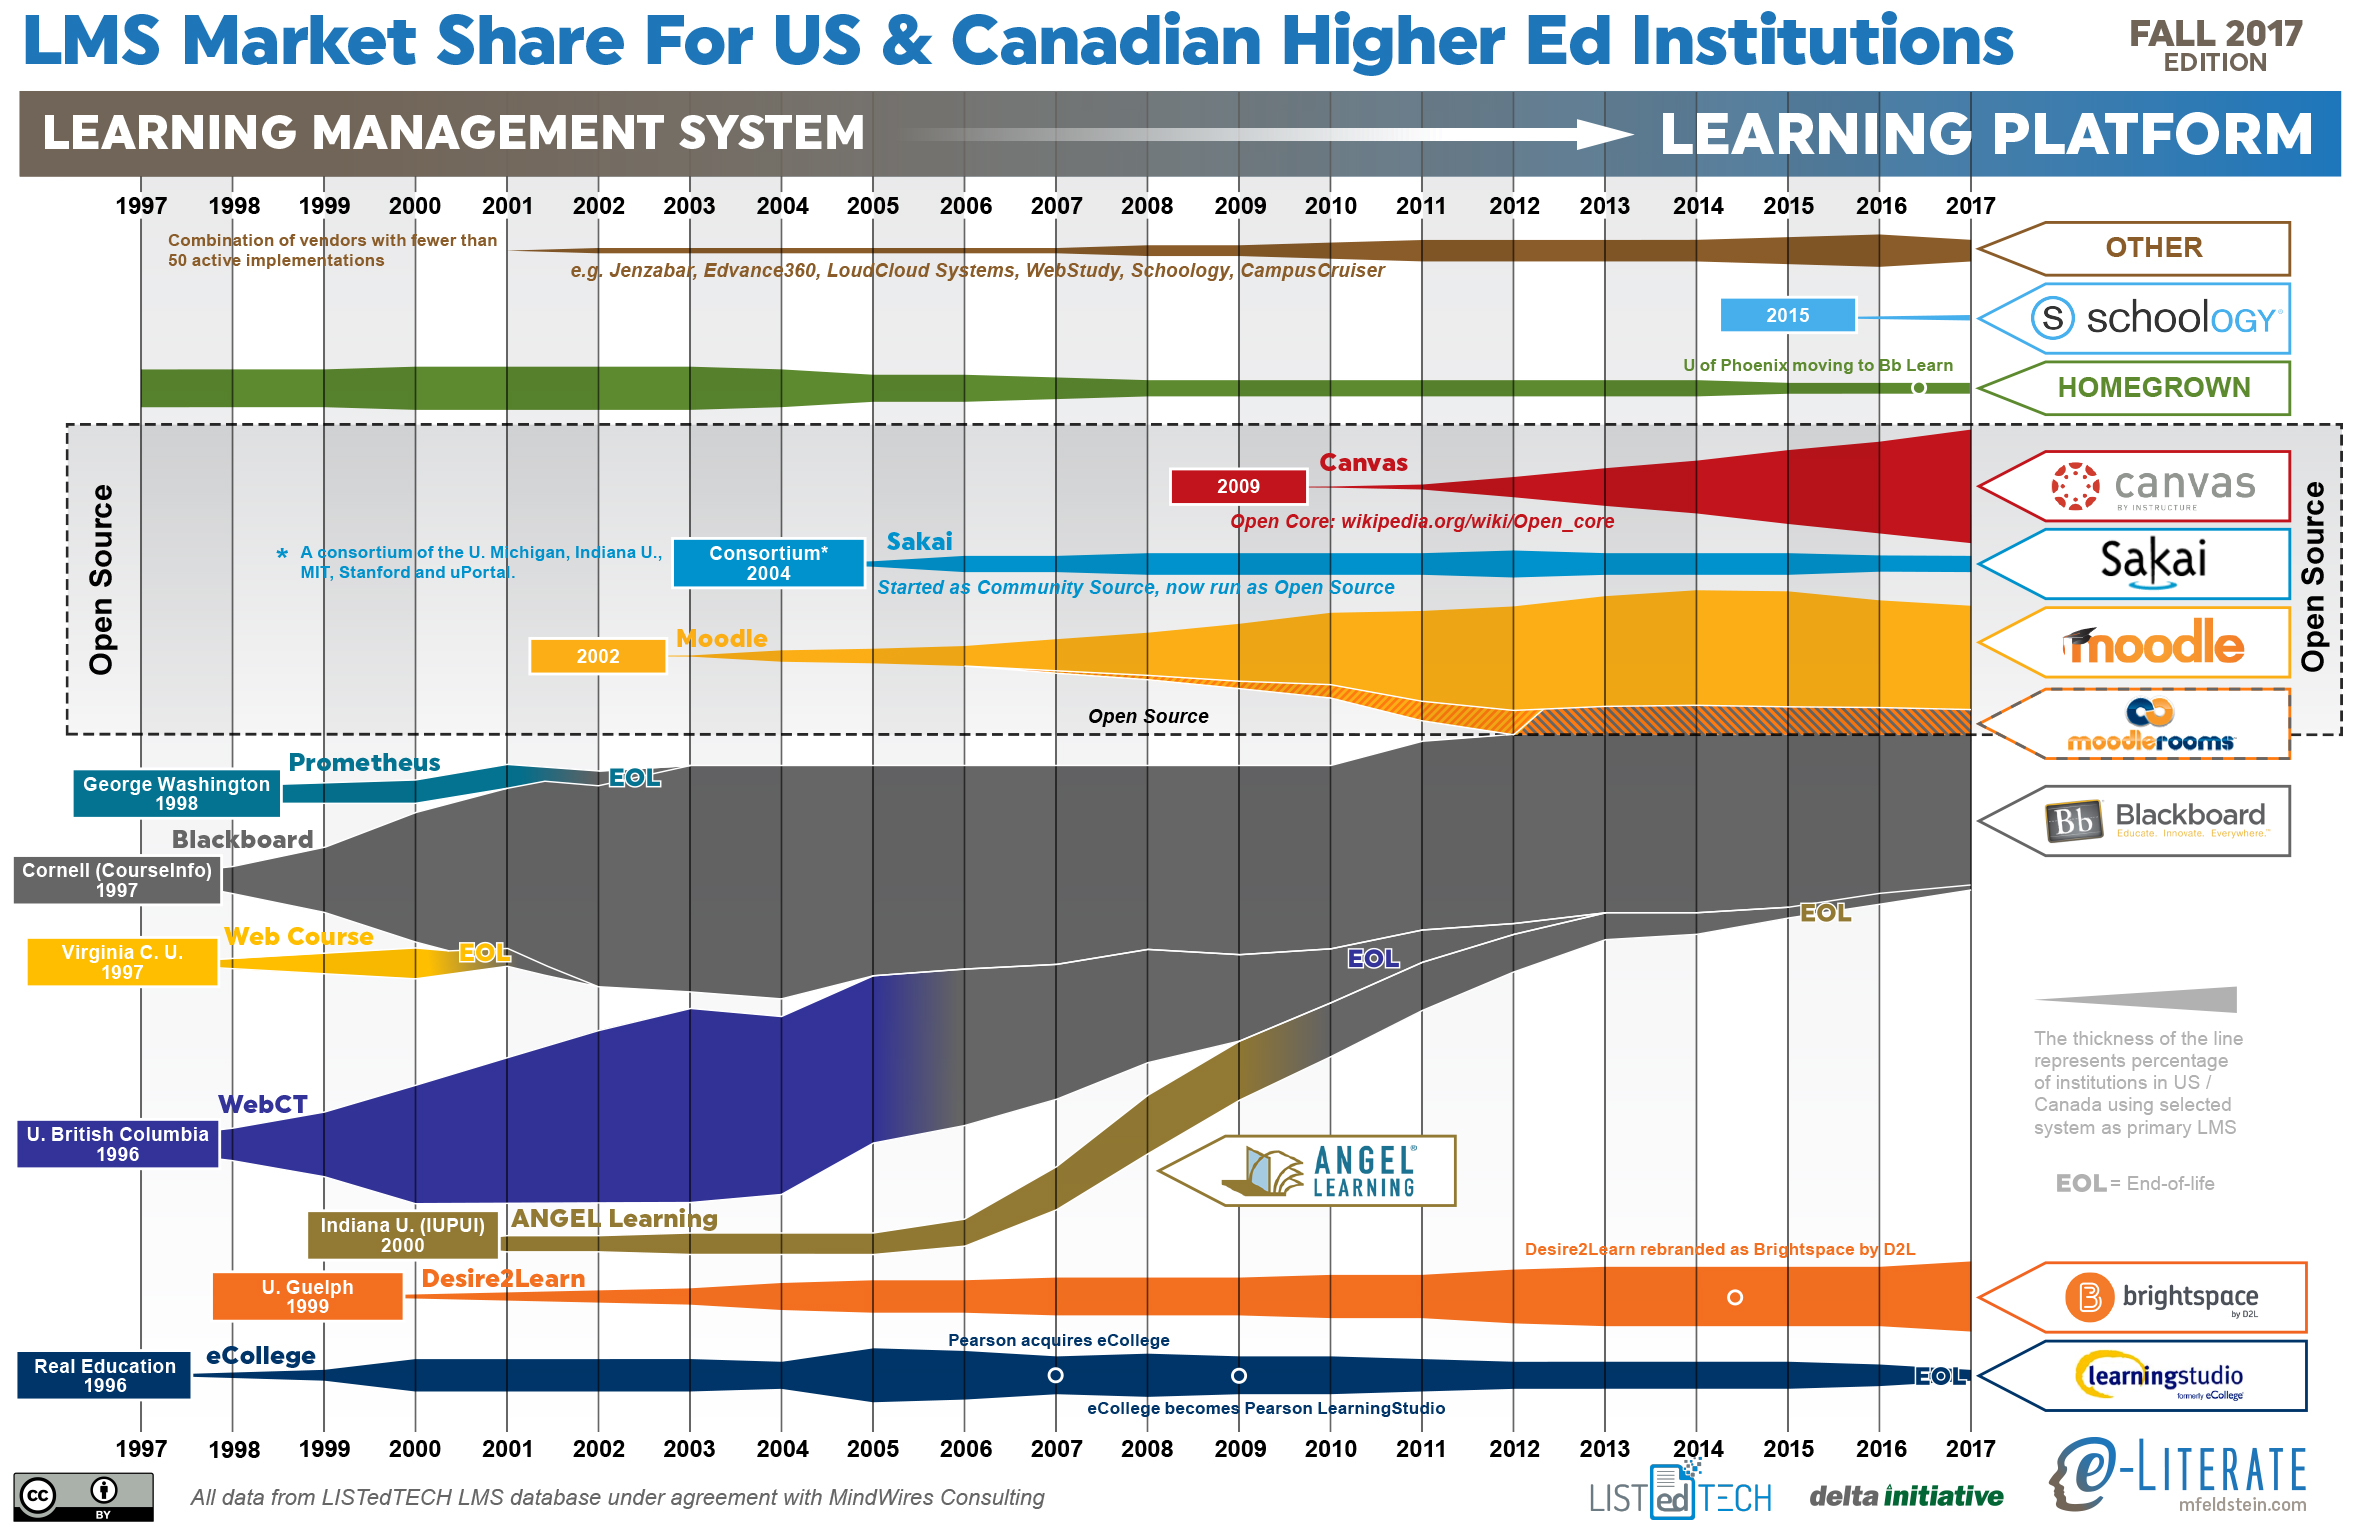
    Stepping back from the immediate data, let’s look at an updated LMS market share graphic, commonly known as the squid graphic, for US and Canadian higher education. The original idea remains – to give a picture of the LMS market in one page, highlighting the story of the market over time. The key to the graphic is that the width of each band represents the percentage of institutions using a particular LMS as its primary system.

    Some additional notes:

    • Blackboard and Moodle have been the market leaders as number one and two in share as they have been for the past decade. However, Canvas is quickly approaching Moodle’s market share.

    We’ll share any updates we discover at the conference this week.

  • State of Higher Ed LMS Market for US and Canada: Spring 2017 Edition

    State of Higher Ed LMS Market for US and Canada: Spring 2017 Edition

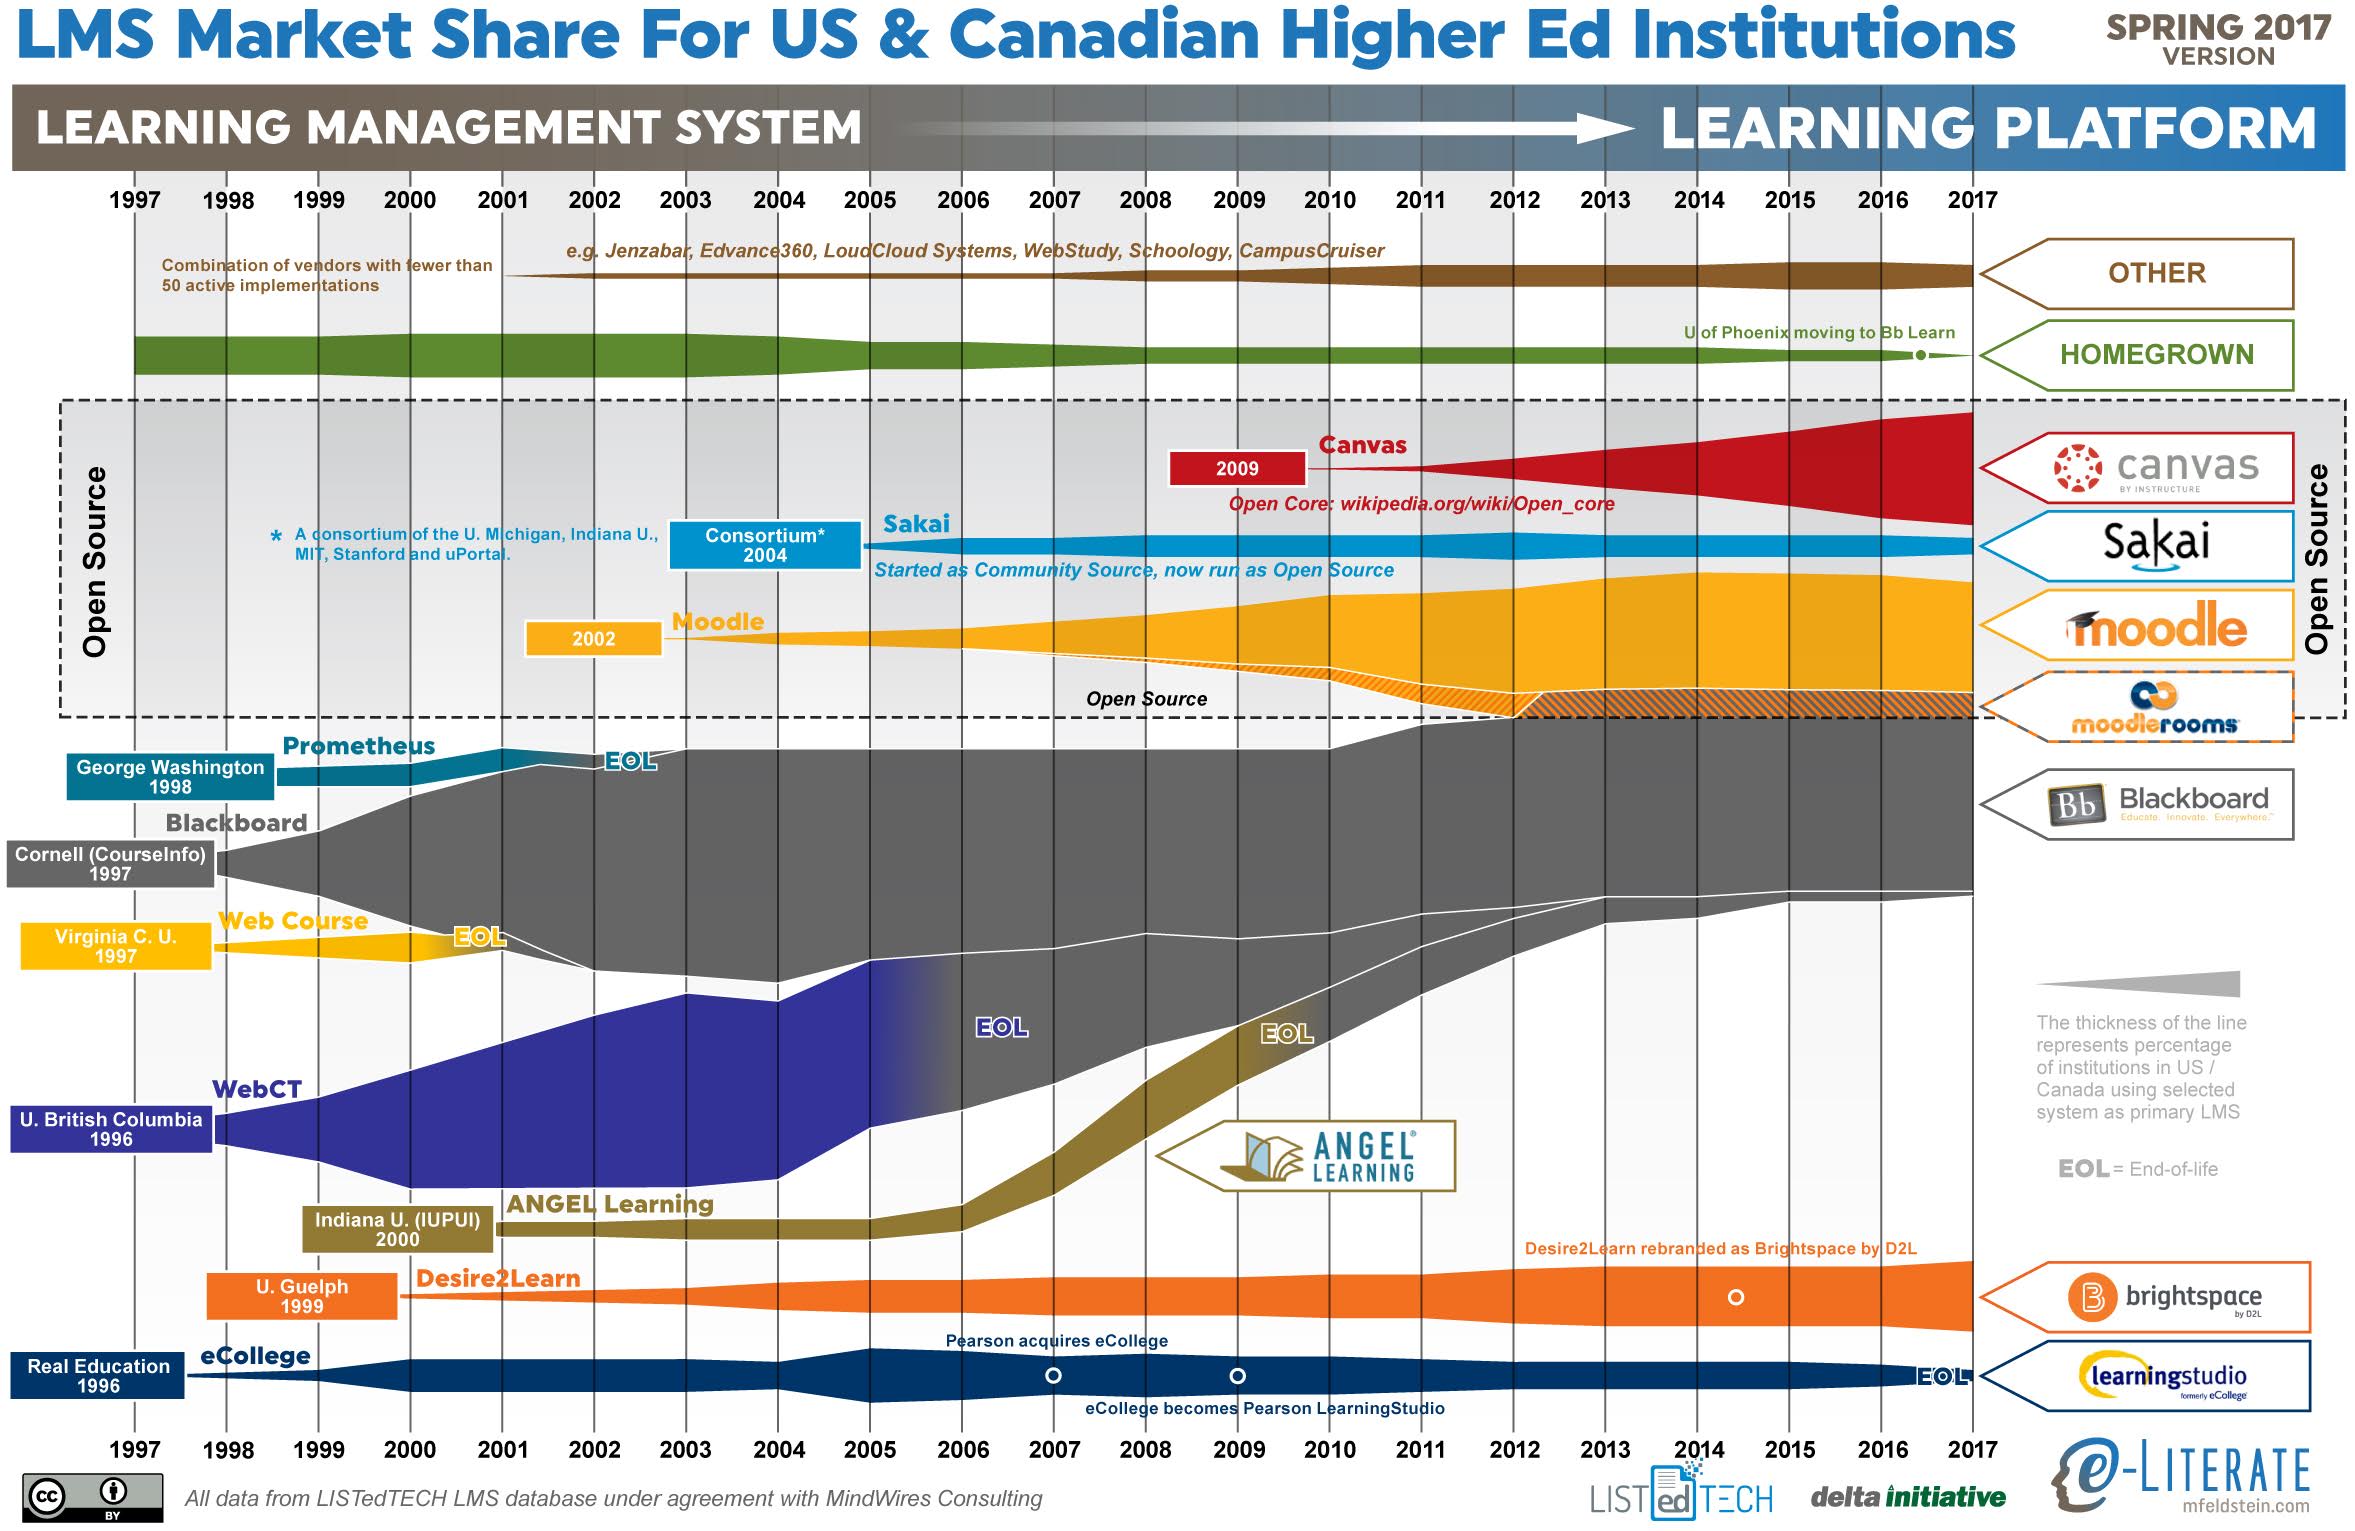
    This is the ninth year I have shared the LMS market share graphic, commonly known as the squid graphic, for US and Canadian higher education. The original idea remains – to give a picture of the LMS market in one page, highlighting the story of the market over time. The key to the graphic is that the width of each band represents the percentage of institutions using a particular LMS as its primary system.

    Last year we made a big shift based on our LMS market analysis service – we are working with LISTedTECH to provide market data and visualizations. This data source provides historical and current measures of institutional adoptions, allowing new insights into how the market has worked and current trends. Our spring report for subscribers will be released this month. Data for 2017 goes through April 1 of this year.

    (more…)

  • State of Higher Ed LMS Market for US and Canada: Spring 2016 Edition

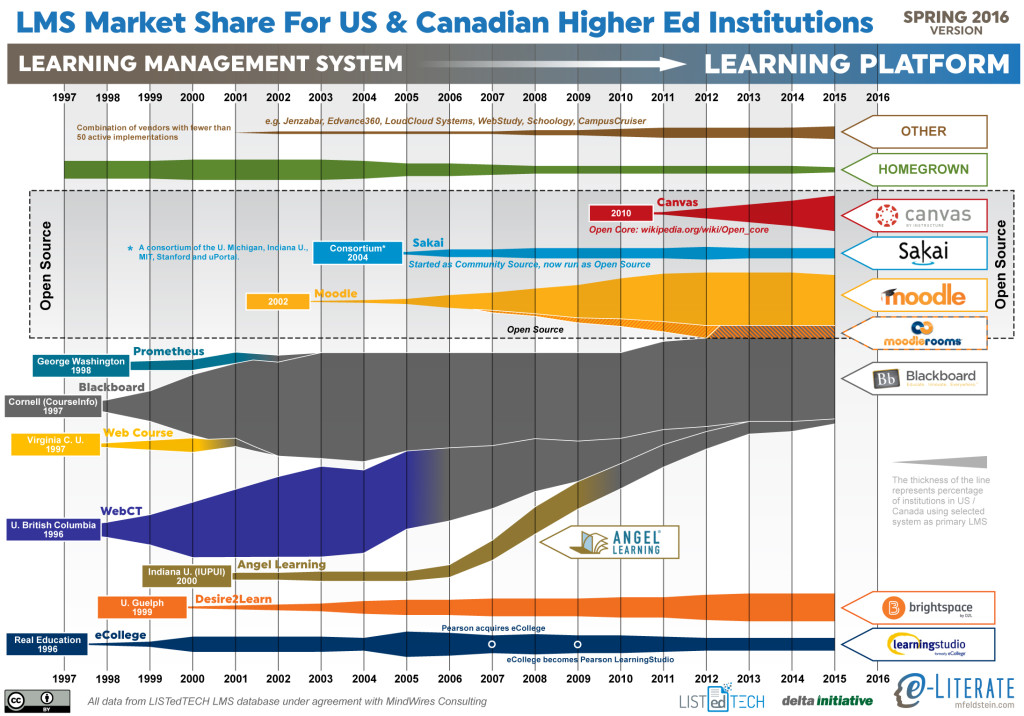
    This is the eighth year I have shared the LMS market share graphic, commonly known as the squid graphic, for (mostly) US higher education. The original idea remains – to give a picture of the LMS market in one page, highlighting the story of the market over time. The key to the graphic is that the width of each band represents the percentage of institutions using a particular LMS as its primary system.

    This year marks a significant change based on our upcoming LMS subscription service. We are working with LISTedTECH to provide market data and visualizations. This data source provides historical and current measures of institutional adoptions, allowing new insights into how the market has worked and current trends. This current graphic gets all of its data from LISTedTECH. Where previous versions of the graphic used an anchoring technique, combining data from different sources in different years, with interpolation where the data was unavailable. Now, every year’s data is based on this single data source.

    This graphic has been in the public domain for years, however, and we think it best to keep it that way. In this way we hope that the new service will provide valuable insight for subscribers but also improve what we continue to share here on the e-Literate blog.

    Since we have data over time now and not just snapshots, we have picked the end of each year for that data. For this reason, the data goes through the end of 2015. We have 2016 data but chose not to share partial-year results in an effort to avoid confusion.

    LMS_MarketShare_20160316

    A few items to note:

    • As noted in previous years, the fastest-growing LMS is Canvas. There is no other solution close in terms of matching the Canvas growth.
    • Blackboard continues to lose market share, although the vast majority of that reduction over the past two years has been from customers leaving ANGEL. Blackboard Learn lost only a handful of clients in the past year.
    • While the end-of-life occurs next year, Pearson’s has announced LearningStudio’s end-of-life for the end of 2017.
    • With the new data set, the rapid rise and market strength of WebCT becomes much more apparent than previous graphics.
    • There is a growing line for “Other”, capturing the growth of those systems with less than 50 active implementations as primary systems; systems like Jenzabar, Edvance360, LoudCloud Systems, WebStudy, Schoology, and CampusCruiser.
    • While we continue to show Canvas in the Open Source area, we have noted a more precise description as an Open Core model.

    For a better description of the upcoming LMS subscription service, read this post and / or sign up for more information here.

  • State of the US Higher Education LMS Market: 2015 Edition

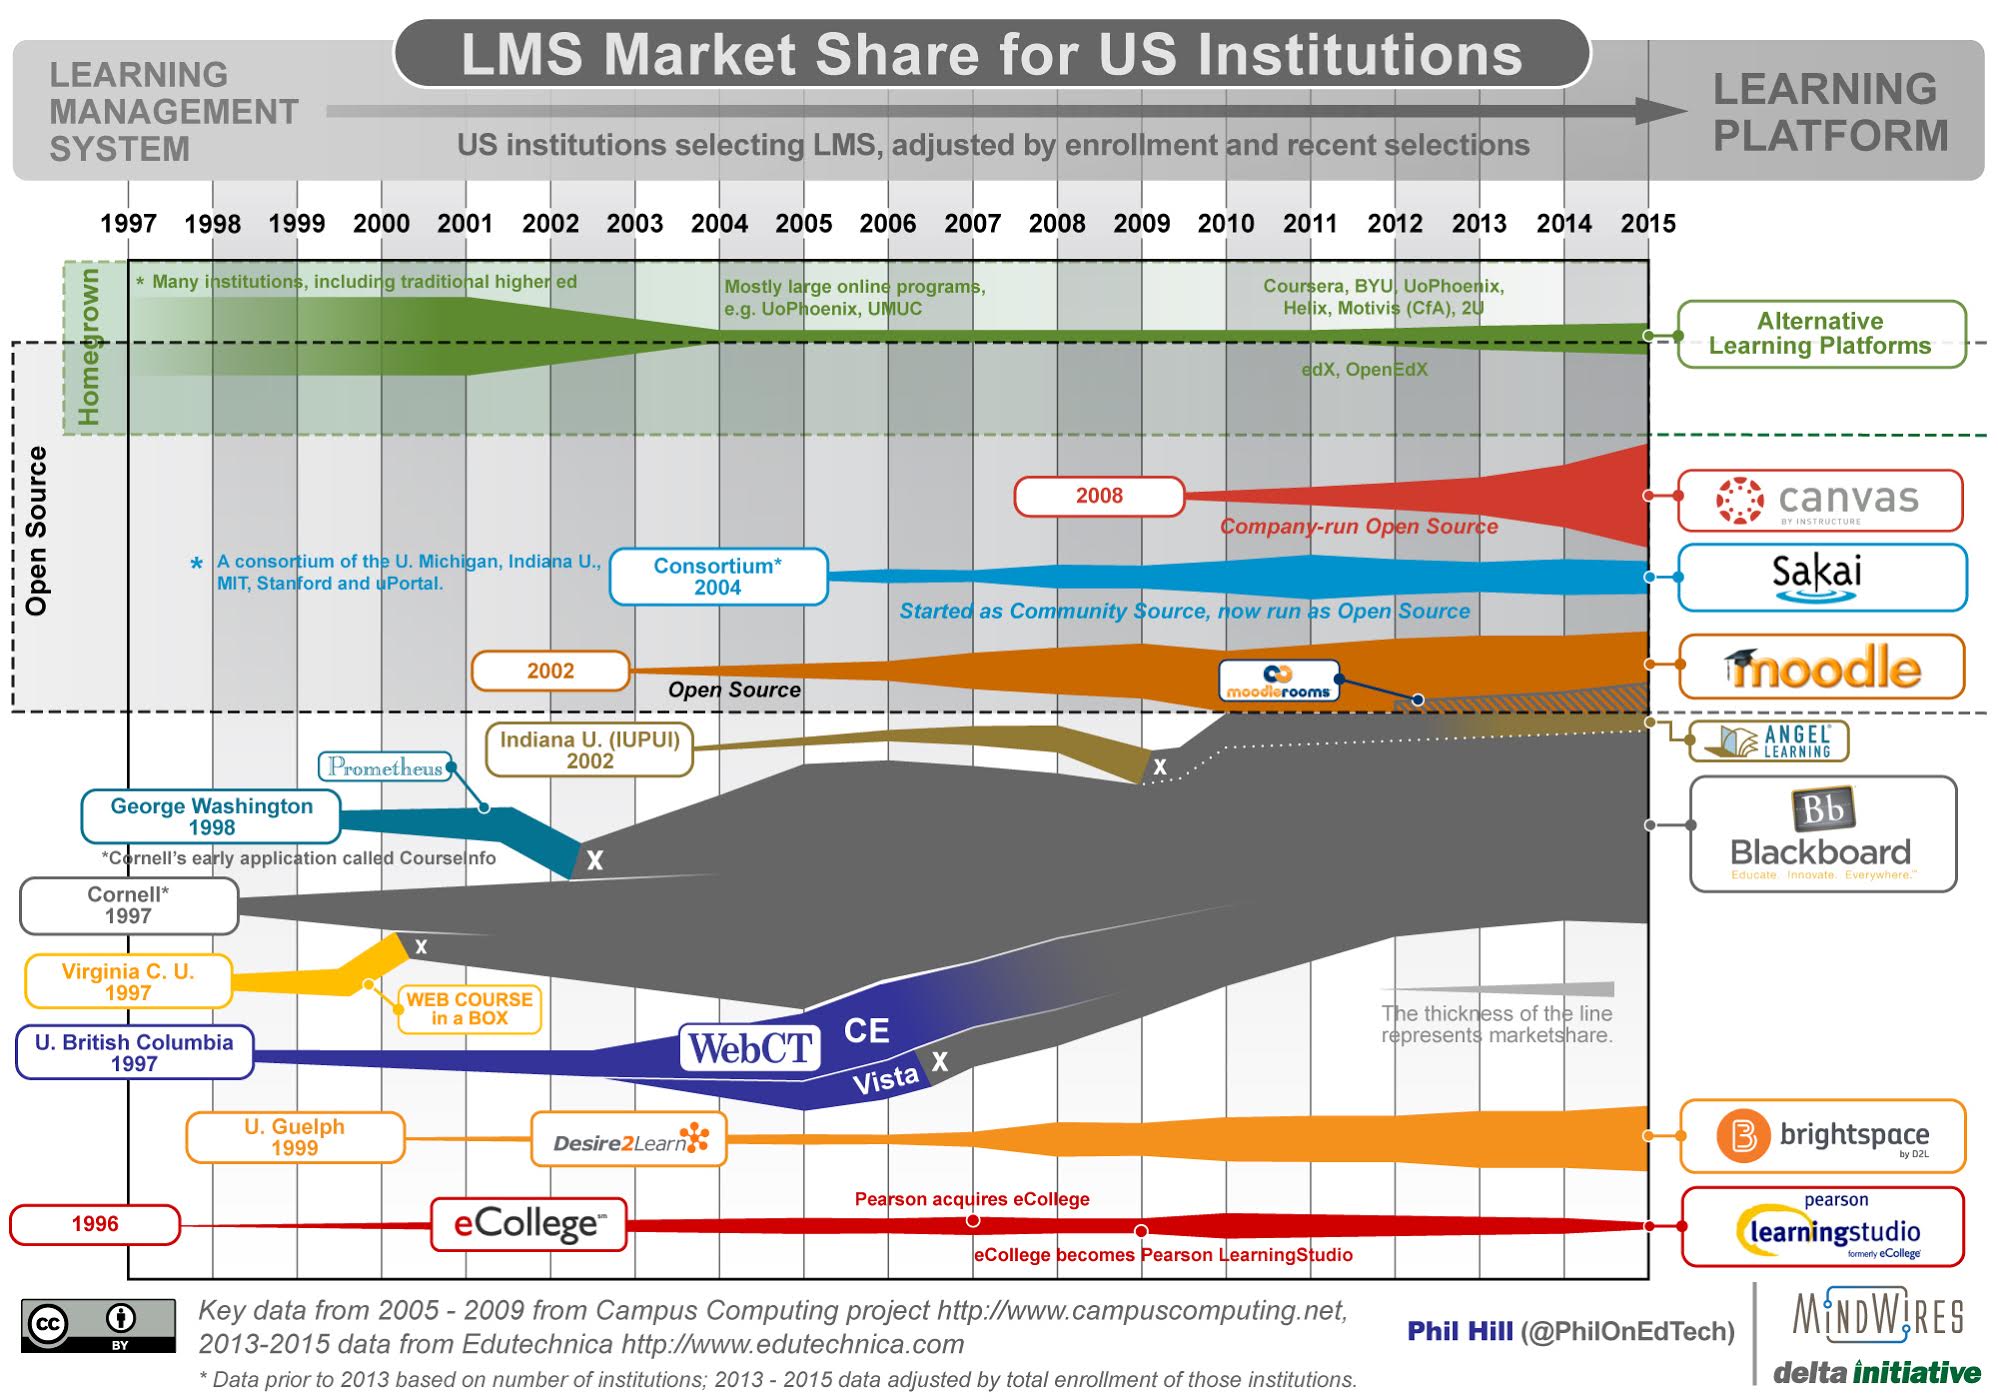
    I shared the most recent graphic summarizing the LMS market in October 2014, and thanks to revised data sources it’s time for an update. As with all previous versions, the 2005 – 2009 data points are based on the Campus Computing Project, and therefore is based on US adoption from non-profit institutions. This set of longitudinal data provides an anchor for the summary.

    The primary data source for 2013 – 2015 is Edutechnica, which not only does a more direct measurement of a larger number of schools (viewing all schools in IPEDS database with more than 700 FTE enrollments), but it also allows scaling based on enrollment per institution. This means that the latter years now more accurately represent how many students use a particular LMS. This post at Edutechnica provides the most recent data for Fall 2015.

    A few items to note:

    • The most important recent feature of the market – the rapid rise of Canvas, surpassing D2L and quickly closing in on Moodle – is quite visible now.
    • Blackboard Learn appears to have stopped its well-documented losses in US higher ed and has even risen in the past year. Its market share is far smaller than at its 2009 peak, but the company is no longer losing large numbers of clients each year.
    • D2L, Sakai, and Moodle have risen ever so slightly, but in effect have hit a plateau.
    • ANGEL and eCollege have lost market share.
    • There is a growing area of “Alternative Learning Platforms” that includes OpenEdX, 2U, Helix and Motivis (the newly commercialized learning platform from College for America).
    • While the data is more solid than 2012 and prior years, keep in mind that you should treat the graphic as telling a story of the market rather than being a chart of exact data.
    • Update (10/16): Removed “Curtin University as origin of Moodle based on Martin’s comments. Mea culpa – should have caught this earlier.
    • Update (10/23): Changed graphic title to refer to US and not North America.

    LMS_MarketShare_20151023

  • State of the US Higher Education LMS Market: 2014 Edition

    I shared the most recent graphic summarizing the LMS market in November 2013, and thanks to new data sources it’s time for an update. As with all previous versions, the 2005 – 2009 data points are based on the Campus Computing Project, and therefore is based on US adoption from non-profit institutions. This set of longitudinal data provides an anchor for the summary.

    The primary data source for 2013 – 2014 is Edutechnica, which not only does a more direct measurement of a larger number of schools (viewing all schools in IPEDS database with more than 800 FTE enrollments), but it also allows scaling based on enrollment per institution. This means that the latter years now more accurately represent how many students use a particular LMS.

    A few items to note:

    • Despite the addition of the new data source and its inclusion of enrollment measures, the basic shape and story of the graphic have not changed. My confidence has gone up in the past few years, but the heuristics were not far off.
    • The 2013 inclusion of Anglosphere (US, UK, Canada, Australia) numbers caused more confusion and questions than clarity, so this version goes back to being US only.
    • The Desire2Learn branding has been changed to Brightspace by D2L.
    • The eCollege branding has been changed to Pearson LearningStudio.
    • There is a growing area of “Alternative Learning Platforms” that includes University of Phoenix, Coursera, edX and OpenEdX, 2U, Helix and Motivis (the newly commercialized learning platform from College for America).
    • While the data is more solid than 2012 and prior years, keep in mind that you should treat the graphic as telling a story of the market rather than being a chart of exact data.

    LMS_MarketShare_20141107

    Some observations of the new data taken from the post on Edutechnica from September:

    • Blackboard’s BbLearn and ANGEL continue to lose market share in US -[1] Using the 2013 to 2014 tables (> 2000 enrollments), BbLearn has dropped from 848 to 817 institutions and ANGEL has dropped from 162 to 123. Using the revised methodology, Blackboard market share for > 800 enrollments now stands at 33.5% of institutions and 43.5% of total enrollments.
    • Moodle, D2L, and Sakai have no changes in US – Using the 2013 to 2014 tables (> 2000 enrollments), D2L has added only 2 schools, Moodle none, and Sakai 2 schools.
    • Canvas is the fasted growing LMS and has overtaken D2L – Using the 2013 to 2014 tables (> 2000 enrollments), Canvas grew ~40% in one year (from 166 to 232 institutions). For the first time, Canvas appears to have have larger US market share than D2L (13.7% to 12.2% of total enrollments using table above).
  • Still Looking for Prior Art Info on Prometheus

    If you have any info on the early days of Prometheus, including when it was built and what its features set was on or before June 1998, please post it to the Wikipedia page. This could be quite important.