e-Literate

Present is Prologue

Tag: student debt

  • GAO Report: Yes, student debt is growing problem

    In case anyone needed additional information to counter the Brookings-fed meme that “Americans who borrowed to finance their education are no worse off today than they were a generation ago”, theU.S. Government Accountability Office (GAO) released a report yesterday with some significant findings. As reported at Inside Higher Ed by Michael Stratford:

    More than 700,000 households headed by Americans 65 or older now carry student debt, according to a report released Wednesday by the U.S. Government Accountability Office. And the amount of debt owed by borrowers 65 and older jumped from $2.8 billion in 2005 to $18.2 billion last year. [snip]

    Between 2004 and 2010, for instance, the number of households headed by individuals 65 to 74 with student loan debt more than quadrupled, going from 1 percent to 4 percent of all such families. During that same period, the rate of borrowing among Americans under 44 years old increased between 40 and 80 percent, even though borrowing among that age group is far more prevalent than it is among senior citizens.

    I have been highly critical of the Brookings Institutions and their report and update. This new information from the GAO goes outside the selective Brookings data set of households headed by people aged 20 – 40, but it should be considered by anyone trying to draw conclusions about student debt holders.

    Noting that Brookings analysis is based on “Americans who borrowed to finance their education” and the GAO report is on student debt holders, it is worth asking if we’re looking at a similar definition. For the most part, yes, as explained at IHE:

    While some of the debt reflects loans taken out by parents on behalf of their children, the vast majority — roughly 70 to 80 percent of the outstanding debt — is attributable to the borrowers’ own education. Parent PLUS loans accounted for only about 27 percent of the student debt held by borrowers 50 to 64 years old, and an even smaller share for borrowers over 65.

    Go read at least the entire IHE article, if not the entire GAO report.

    Student debt is a growing problem in the US, and the Brookings Institution conclusions are misleading at best.

  • Brookings Institution analysis on student debt becoming a farce

    I have previously written about the deeply flawed Brookings Institution analysis on student debt with its oft-repeated lede:

    These data indicate that typical borrowers are no worse off now than they were a generation ago …

    Their data is based on the triennial Survey of Consumer Finances (SCF) by the Federal Reserve Board, with the report based on 2010 data. With the release of the 2013 SCF data, Brookings Institution put out an update this week on their report, and they continue with the lede:

    The 2013 data confirm that Americans who borrowed to finance their educations are no worse off today than they were a generation ago. Given the rising returns to postsecondary education, they are probably better off, on average. But just because higher education is still a good investment for most students does not mean that high and rising college costs should be left unquestioned.

    This conclusion is drawn despite the following observations of changes from 2010 – 2013 in their own update:

    • The share of young (age 20 – 40) households with student debt rose from 36% to 38%;
    • The average amount of debt per household rose 14%;
    • The distribution of debt holders rose by 50% for debt levels of $20k – $75k and dropped by 19% for debt levels of $1k – $10k; and
    • Wage income is stagnant and same level as ~1999, yet debt amounts have risen by ~50% in that same time period (see below).

    (more…)

  • Federal Reserve Board backs up e-Literate in criticism of Brookings report on student debt

    I have been very critical of the Brookings Institution report on student debt, particularly in my post “To see how illogical the Brookings Institution report on student loans is, just read the executive summary”.

    D’oh! It turns out that real borrowers with real tax brackets paying off off real loans are having real problems. The percentage at least 90 days delinquent has more than doubled in just the past decade. In fact, based on another Federal Reserve report, the problem is much bigger for the future, “44% of borrowers are not yet in repayment, and excluding those, the effective 90+ delinquency rate rises to more than 30%”.

    More than 30% of borrowers who should be paying off their loans are at least 90 days delinquent? It seems someone didn’t tell them that their payment-to-income ratios (at least for their mythical average friends) are just fine and that they’re “no worse off”.

    Well now the Federal Reserve Board themselves weighs in on the subject with a new survey, at least as described by an article in The Huffington Post.  I have read the Fed report and concur with HP analysis – it does argue against the Brookings findings.

    Among the emerging risks spotlighted by the survey is the nation’s $1.3 trillion in unpaid student debt, suggesting that high levels of student debt are crimping the broader economy. Nearly half of Americans said they had to curb their spending last year in order to make payments on student loans, adding weight to the fear among federal financial regulators that the burden of student debt on households will depress economic growth for years to come.

    Some 35 percent of survey respondents who are paying back student loans said they had to reduce their spending by “a little” over the past year to keep up with their student debt payments. Another 11 percent said they had to cut back their spending by “a lot.”

    The Fed’s findings appear to challenge recent research by a pair of economists at the Brookings Institution, highlighted in The New York Times and cited by the White House, that argues that households with student debt are no worse off today than they were two decades ago.

    (more…)

  • To see how illogical the Brookings Institution report on student loans is, just read the executive summary

    il·log·i·cal
    i(l)ˈläjikəl/
    adjective
    1. lacking sense or clear, sound reasoning.  ((From Google’s definition))

    There have been multiple articles both accepting the Brookings argument that “typical borrowers are no worse off now than they were a generation ago” and those calling out the flaws in the Brookings report. I have written two articles here and here criticizing the report. The problem is that much of the discussion is more complicated that it needs to be. A simple reading of the Brookings executive summary exposes just how illogical the report is.

    College tuition and student debt levels have been increasing at a fast pace for at least two decades. These well-documented trends, coupled with an economy weakened by a major recession, have raised serious questions about whether the market for student debt is headed for a crisis, with many borrowers unable to repay their loans and taxpayers being forced to foot the bill.

    The argument is set up – yes, tuition and debt levels are going up, but how is a crisis defined? It’s specifically about “many borrowers unable to repay their loans”. Is there a crisis? That’s not a bad setup, and it is a valid question to address.

    Our analysis of more than two decades of data on the financial well-being of American households suggests that the reality of student loans may not be as dire as many commentators fear. We draw on data from the Survey of Consumer Finances (SCF) administered by the Federal Reserve Board to track how the education debt levels and incomes of young households evolved between 1989 and 2010. The SCF data are consistent with multiple other data sources, finding significant increases in average debt levels, but providing little indication of a significant contingent of borrowers with enormous debt loads.

    This is an interesting source of data. Yes, the New York Fed’s Survey of Consumer Finances tracks student debt, but this data is almost four years old due to triennial survey method.  ((Also note that we’re skipping the years with the highest growth in student debt.))

    But hold on – now we’re talking about “significant contingent of borrowers with enormous debt loads”? I thought the issue was ability to repay. What does “enormous” even mean other than being a scary word? (more…)

  • A response to Bloomberg article on UCLA student fees

    Megan McArdle has an article that was published in Bloomberg this week about the growth of student fees. The setup of the article was based on a new “$4 student fee to pay for better concerts”.

    To solve this problem, UCLA is introducing a $4 student fee to pay for better concerts. That illuminates a budgeting issue in higher education — and indeed among human beings more generally.

    That $4 is not a large fee. Even the poorest student can probably afford it. On the other hand, collectively, UCLA’s student fees are significant: more than $3,500, or about a quarter of the mandatory cost of attending UCLA for a year.

    Those fees are made up of many items, each trivial individually. Only collectively do they become a major source of costs for students and their families and potentially a barrier to college access for students who don’t have an extra $3,500 lying around.

    I’m sympathetic to the argument that college often costs too much and that institutions can play revenue games to avoid the appearance of raising tuition. I also think that Megan is one of the better national journalists on the topic of the higher education finances.

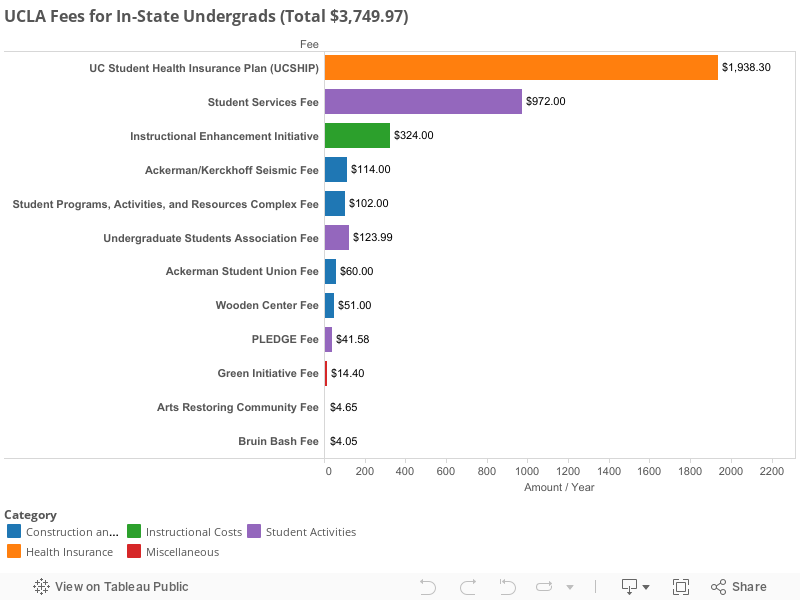
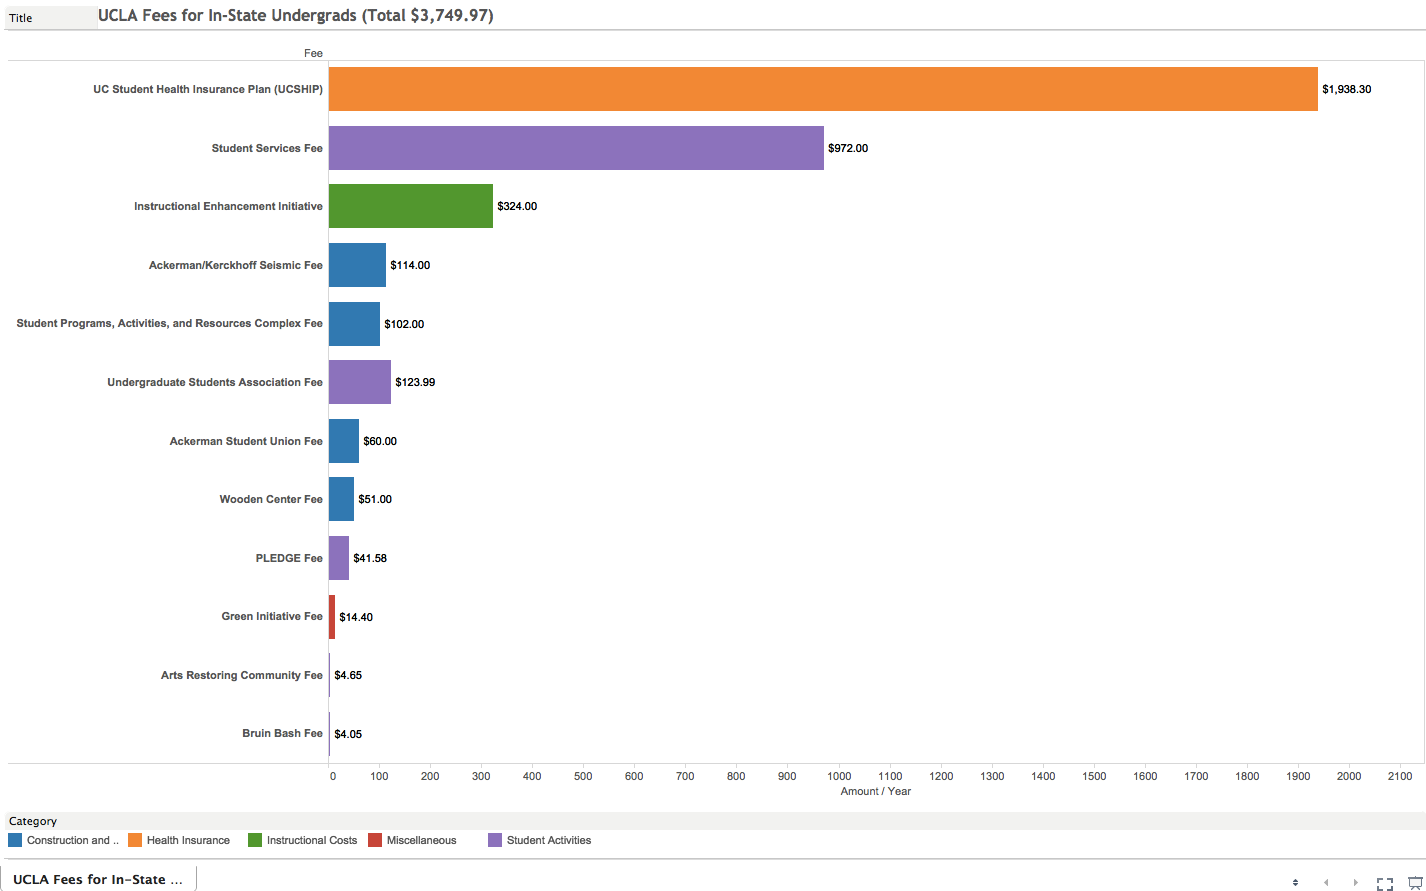
    UCLA Fees

    However, this article is somewhat sloppy in a way that harms the overall message. I would like to clarify the student fees data to help show the broader point.

    Let’s look at the actual data from UCLA’s web site. I assume that Megan is basing this analysis on in-state undergraduate full-time students. The data is listed per quarter, and UCLA has three quarters for a full academic year. I have summarized below summing three quarters into yearly data, and you can:

    • Hover over each measure to see the fee description from UCLA’s fee description page;
    • Click on each category that I added to see the component fees;
    • Sort either column; and
    • Choose which rows to keep or exclude.
    • NOTE: Static image above if you cannot see interactive graphics

    Some Clarifications Needed

    • The total of non-tuition fees is $3,750 per year, not $3,500; however, Megan is right that this represents “about a quarter of the mandatory cost of attending UCLA for a year” ($3,750 out of $14,970).
    • The largest single fee is the UC health insurance fee (UC-SHIP), which is more than half of the total non-tuition fees. This fact (noted by Michael Berman on Twitter) should have been pointed out, given the significant percentage of the total.
    • With the UC-SHIP at $1,938 and the student services fee at $972, I hardly consider these as “trivial individually”.

    Broader Point on Budgeting

    The article’s broader point is that using extraneous fees to create additional revenue leads to a flawed budgeting process.

    As I’ve written before, this is a common phenomenon that you see among people who have gotten themselves into financial trouble — or, for that matter, people who are doing OK but complain that they don’t know where the money goes and can’t save for the big-ticket items they want. They consider each purchase individually, rather than in the context of a global budget, which means that they don’t make trade-offs. Instead of asking themselves “Is this what I want to spend my limited funds on, or would I rather have something else?” they ask “Can I afford this purchase on my income?” And the answer is often “Yes, I can.” The problem is that you can’t afford that purchase and the other 15 things that you can also, one by one, afford to buy on your income. This is how individual financial disasters occur, and it is also one way that college tuition is becoming a financial disaster for many families.

    This point is very important. Look at the Wooden Center fee, described here (or by hovering over chart):

    Covers repayment of the construction bond plus the ongoing maintenance and utilities costs for the John Wooden Recreation Center. It was approved by student referendum. The fee is increased periodically based on the Consumer Price Index.

    To take Megan’s point, this fee “was approved by student referendum”, which means that UCLA has moved budgeting responsibility away from a holistic approach to saying “the students voted on it”. This makes no financial sense, nor does it make sense to shift bond repayment and maintenance and utilities cost onto student fees.

    While this article had some sloppy reporting in terms of accurately describing the student fees, it does highlight an important aspect of the budget problems in higher education and how the default method is to shift the costs to students.

  • The Rising Non-Instructional Cost of College Exemplified By University of Minnesota

    This past weekend the Wall Street Journal published an insightful article on administrative bloat at the University of Minnesota and how it typifies a major problem relating to rising tuition and student debt. The article is heavily based on the new president of the university, Eric Kaler, and his attempts to address rising costs. Unfortunately the article was posted over the weekend and is behind a paywall, but I’ll excerpt some relevant sections.

    When Eric Kaler became president of the University of Minnesota last year, he pledged to curb soaring tuition by cutting administrative overhead. But he hit a snag: No one could tell him exactly what it cost to manage the school.

    Like many public colleges, the University of Minnesota went on a spending spree over the past decade, paid for by a steady stream of state money and rising tuition. Officials didn’t keep close tabs on their payroll as it swelled beyond 19,000 employees, nearly one for every 3½ students. “The more questions I asked, the less happy I was,” Dr. Kaler said.

    Charles Lane at the Washington Post wrote a column today based on the WSJ story, which thankfully is available without a paywall. He summarized some of the key findings of the WSJ study.

    At the University of Minnesota, the number of employees with “human resources” or “personnel” in their job titles has grown from 180 to 272 since the 2004-05 academic year. Since 2006, the university has spent $10 million on consultants for a vast new housing development that is decades from completion. It employs 139 people for marketing, promotions and communications. Some 81 administrators make $200,000 per year or more.

    In the past decade, Minnesota’s administrative payroll has gone up three times as fast as the teaching payroll, and twice as fast as student enrollment.

    Oh, and tuition more than doubled in that same period, to more than $13,000 per year.

    (more…)

  • Postscript to “This Time Is Different: Enrollment and Employment Divergence”

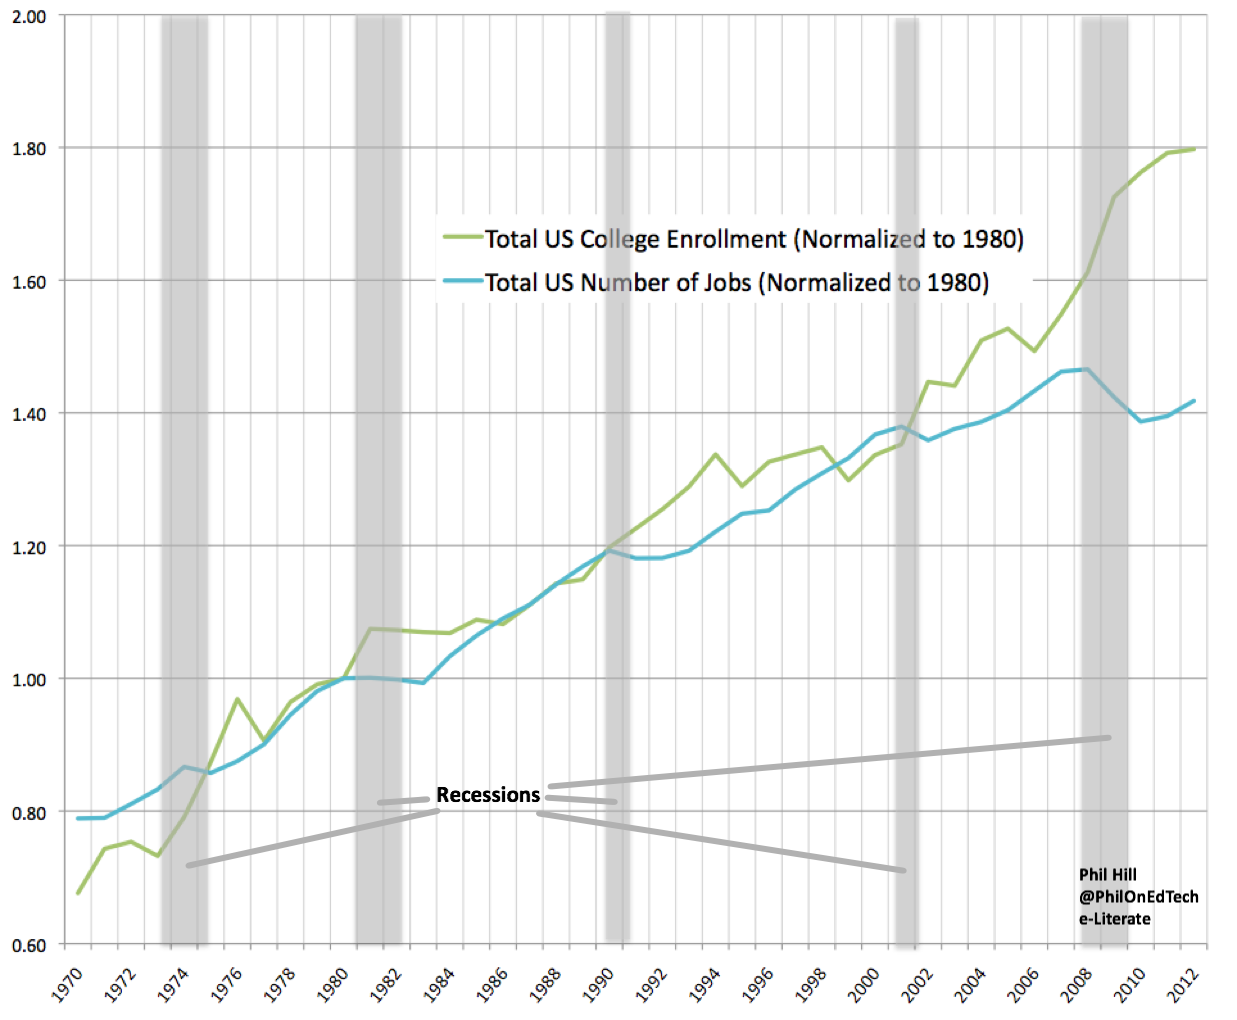
    In a post two days ago, I showed US data comparing enrollment and employment trends. The salient feature of the data that I called out was the significant divergence of the two trend lines since 2006.

    When you look at the data from 1970 – 2012, the results could explain some significant pressures experienced by higher education institutions. In a nutshell – this time is different, we are in uncharted territory.

    There are two related comments that I would like to address, both of which ask the question of whether the mix of full-time vs. part-time enrollment explains part of the divergence noted.

    The first (excerpted) comment is from Thomas Warger under the original post:

    I have to wonder how much of the gap you show here can be attributed to the increased availability of pay-as-you-go higher education–opportunities to take a few credits at a time at a community college or an online provider? Does “normalized for 1980″ factor for this relatively new phenomenon?

    The second comment is from Stephen Downes in his OLDaily blog:

    I don’t agree with the proposition that “this time it’s different.” Here’s what Phil Hill writes: “The conventional wisdom holds that enrollment jumps when employment drops, and the data does show some divergence followed a few years later by a correction. What is different this time is A) the magnitude of the divergence and B) the start of the divergence fully two years before the recession started in 2008.” I think the apparent spike in enrollments is created by a lot of part-time and online learning, and that it is a bit illusory. It’s also caused by echo-boom effects, as the population born between 1982-1995 is in post-secondary education between 2002-1015, give or take. If (and it’s a big if) employment improves, I would expect a dramatic drop in (traditional) enrollment.

    What’s really different is that world population is reaching a breaking point, climate change is disrupting food supplies and other industry, resource depletion has become a significant problem, and (by contrast) worldwide prosperity, literacy and general awareness has led to an increasingly restive global population. There is moreover a chronic economic imbalance, with increasingly large quantities of wealth simply being hoarded instead of invested (it’s an amount that if deployed would makemoney itself meaningless). U.S. demographic trends – which could be rendered obsolete with one major wave of immigration – are irrelevant in the face of these wider forcess.

    (more…)