The “Ed Tech” category includes posts about educational technology products themselves, including LMSs and other learning platforms, adaptive learning and other digital curricular materials products, learning analytics, and educational apps of all types. It also includes technical aspects of ed tech products, especially interoperability.
In one of our premium versions of the LMS Market Analysis services, targeted primarily at the investment community, we have noted since early summer (starting in June 2018) that the global LMS market appears to be slowing down for higher ed. Given our public market analysis role and given the trend now lasting more than half a year, this news seems more than just a note for investors.
Based on CFO Steven Kaminsky’s comments during Instructure’s quarterly earnings call, we’re not the only ones noticing:
So for renewals what we’ve seen specifically this year is fewer large deals in the multi-hundred thousand dollar range than we’ve seen in previous years. It’s a little still too early to talk about 2019, we’ll be doing that in a few months but we have seen that and when I referenced earlier that it didn’t look like we’re going to grow domestic Canvas by much of it all, that’s what I was really referring to, that’s the key driver there.
A recent analysis note from Brian Peterson at Raymond James shared similar observations.
Our proprietary higher-ed North American LMS tracker pointed to a notable slowdown in large deal activity in 2018, with full year levels (as defined by the number of students) down in the double digits.
But first a note about our data to help readers determine how to interpret the description of this trend.
Along with new implementations (changes from one LMS to another at a particular institution), we also track what we call “First Seen” data. This captures how many LMS decisions we capture in a given month, and over time this metric acts as a leading indicator of implementation changes. This data is broken down by global region (North America, Europe, Latin America, and Australia / New Zealand are currently covered), LMS provider, and enrollment band (to capture institution size).
What we noted in Summer 2018 was a fairly dramatic drop in First Seen data, particularly in North America. Over time, we also noted a change in Trailing 12 Month data from New Implementations (total of previous 12 months for each measured month to smooth out market seasonality). For Dec 2018 T12M data, capturing the full 2018 calendar year, the activity of new implementations is roughly 20 – 25% lower than it was a year prior.
Some notes on the data shown described and above:
Even with T12M data smoothing, the trends are still somewhat lumpy, which is the nature of academic markets.
The market for implementations seems to have peaked at the end of the spring 2018 academic calendar and then dropped to current levels that represent a plateau rather than ongoing downward trend.
To allow reasonable comparisons over time, the data above represents T12M as we knew it at the time. The data is not a full set, as it does not contain implementations we discovered more than a month after the reported month, so the key is to look at trends and not absolute levels.
There are other factors to consider that impact company finances, such as the ongoing enrollment declines in North America, particularly among for-profit or formerly for-profit institutions, but we now have two different variables both pointing to at least a temporary dropping of activity.
It’s premature to determine whether the slowdown will continue or whether market activity will rise again in 2019. We have some statistical and anecdotal indicators for both cases but are not ready to predict yet.
Hopefully this data description of market activity hasn’t been too tedious, but there are strong arguments that company financial health in 2018 / 19 for the providers will continue to have an outsized impact on the future of LMS offerings.
I had a trip to the UK this month and only had time to read media coverage of the recent Babson Survey Research Group (BSRG) survey on open educational resources (OER). What a mistake. The Chronicle of Higher Education had a flawed description of a key question – actual and planned adoption of OER material by faculty – that misinformed readers like me who didn’t read the actual survey report, at least initially.
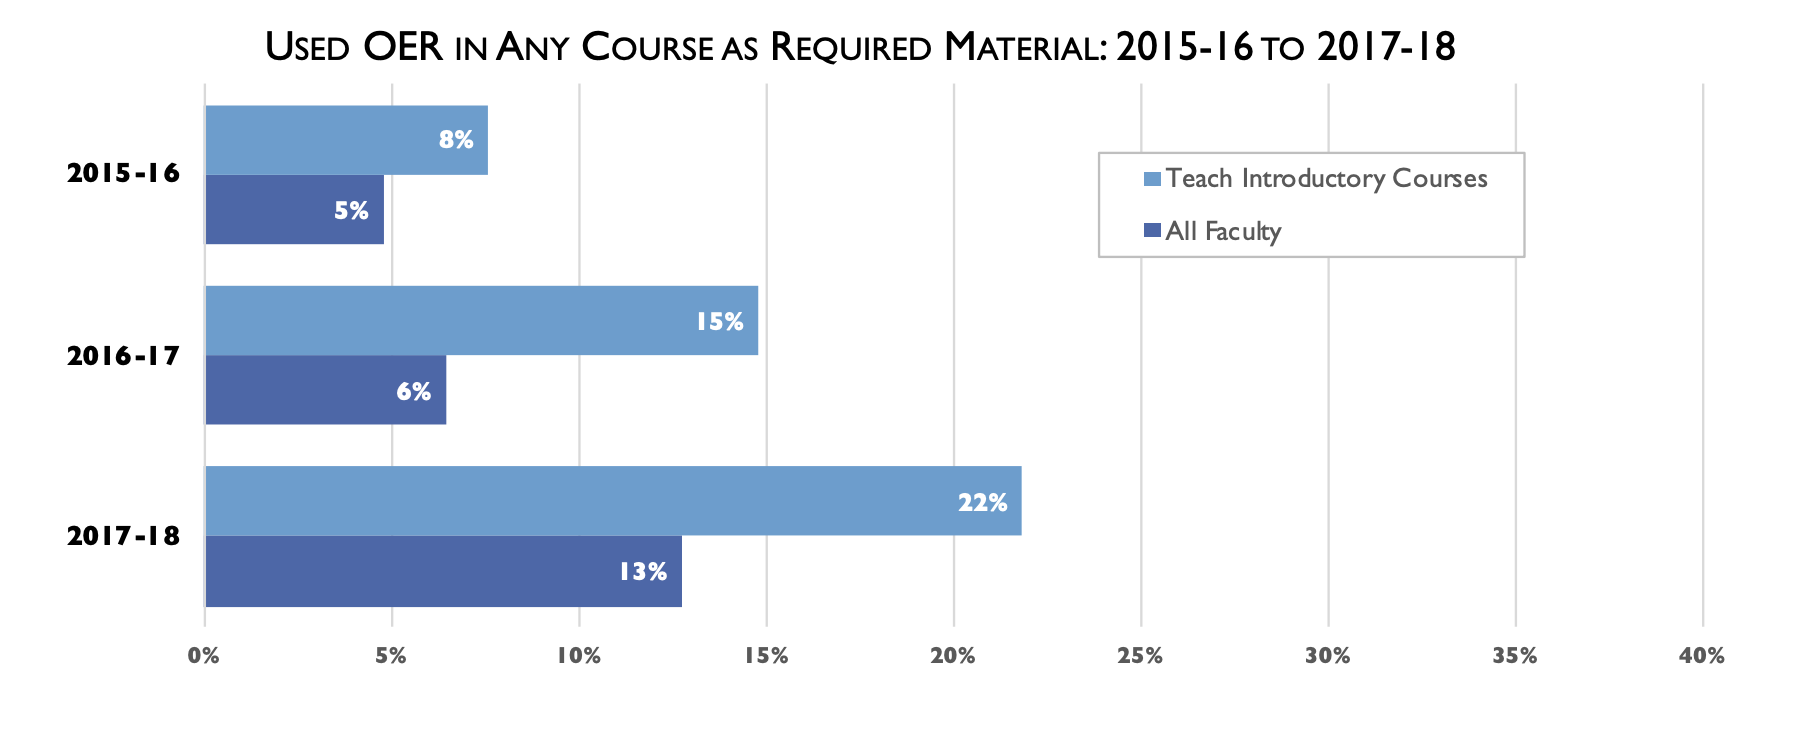
The open-educational-resources movement, commonly known as OER, is an effort to encourage academics to use open-licensed materials in their classrooms as a way to lower costs. Some nonprofits, like OpenStax, have produced textbooks based on this material. The survey shows that OER has made inroads: 22 percent of people who teach introductory courses, subjects in which free textbooks are most commonly available, use it as required material, up from 15 percent last year.
Yet the percentage of faculty members who say they will use, or consider using, open materials in the next three years actually dropped slightly, with the numbers now at 6 percent and 32 percent respectively.
On the surface, this description indicates that OER adoption increased for faculty teaching introductory courses, but the second paragraph shows a potential drop in adoption over the next three years for all faculty. That would be major news showing that the OER movement hit an inflection point and is likely to drop soon, even though faculty have a natural affinity for the same issues that OER offers – lower cost and the ability to remix / reuse.
It turns out this interpretation is wrong. The actual BSRG survey report states the following [emphasis added]:
Each year, this survey asks faculty members who are not current users of open educational resources whether they expect to be using OER in the next three years.
This question is only for non OER-adopting faculty. In other words, it measures growth potential, not total adoption potential. In fact, the percentage of faculty who used required OER material in any of their courses more than doubled this year, and based on the question above should continue to grow. BSRG further described the numbers for non OER-adopting faculty.
There have been minimal changes in the proportion of faculty who report that they will use OER in the next three years, dropping slightly from 7% in 2015-16 and 2016-17, to the 6% reported this year. The number who report that they “Will consider” OER grew from 31% in 2015-16 to 37% for 2016-17, before dropping to 32% for 2017-18.
This description is poorly worded and misses the context provided earlier, which I assume was part of the problem with Chronicle coverage.
As for actual adoption, the category of “all faculty” grew significantly over the past year.
Nearly one-quarter of faculty that teach large enrollment introductory courses report that they are using OER in some fashion, with more of these faculty responding that use OER as supplemental rather than as required materials. The rates are lower across all faculty, with 13% reporting using OER as required course material in at least one of their courses.
These numbers represent a large increase over those in previous years, with the overall faculty rate of required OER use climbing from 5% two years ago to 6% in 2016-17, and then making a large jump to 13% this year. Given the sometimes vague understanding of the OER and its licensing, care must be taken in interpreting these results. Are faculty lumping any free resource into the OER category, even those that are not licensed as OER? Based on previous results we have to assume that there is some level of over-reporting in these figures of OER use; we just don’t know how much of an impact this is having.
What is interesting is that this adoption growth aligns with an independent source, the Cengage OER survey from Fall 2016.
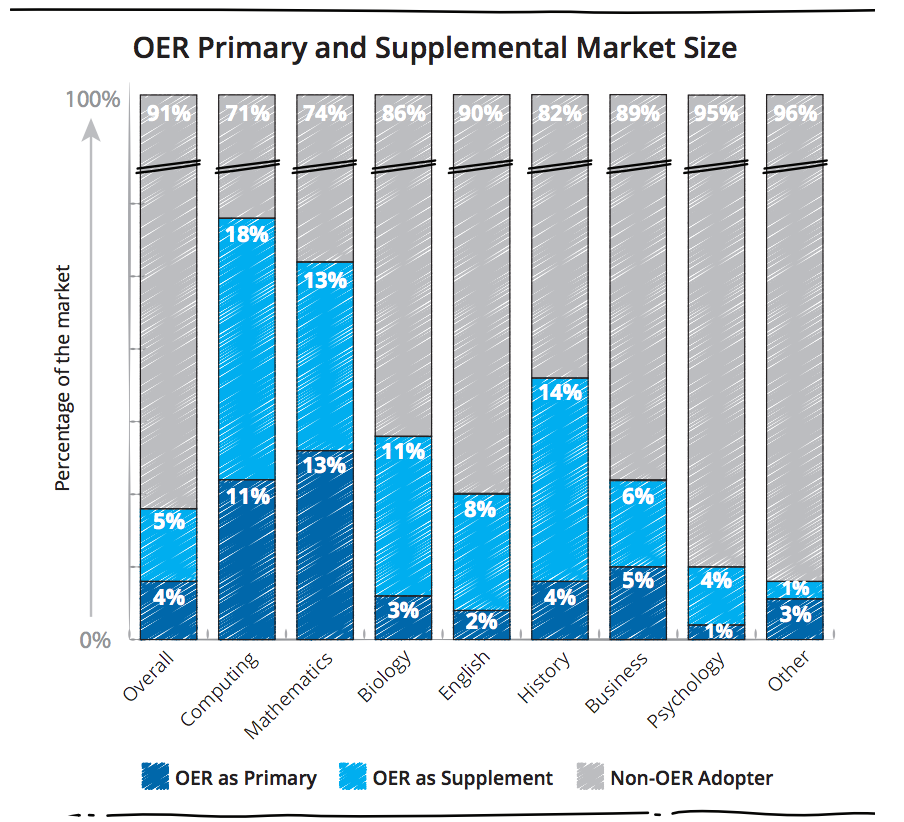
Open Educational Resources (OER) in higher education have the potential to triple in use as primary courseware over the next five years, from 4 percent to 12 percent, according to a survey of more than 500 faculty by Cengage Learning.
What the data appear to show is significant growth in OER adoption for all faculty as well as for the subset teaching introductory courses. Adoption should continue, although it could be at a slower rate than was seen over the past year.
It pays to read source material when the data describes important trends, especially when the results are surprising. I wish I had done this earlier.
Our favorite technology industry blog—Ben Thompson’s Stratechery—has a great piece up about Amazon’s relationship to open source that also explains a lot about the tectonic shifts in the LMS market. The story he’s interested in telling is about the dynamics behind Amazon’s move to essentially copy and abandon a popular open source database called Mongo DB. His introductory analogy to the music business is revealing and worth quoting at length:
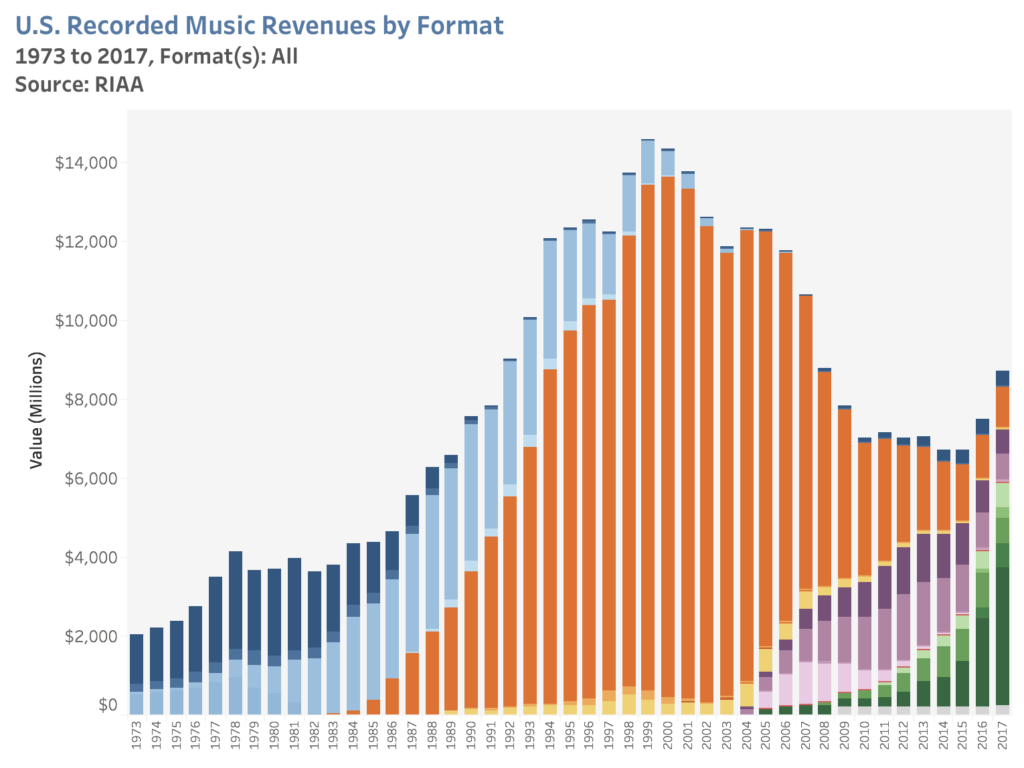
In 1999, music industry revenue in the United States peaked at $14.6 billion (all numbers are from the RIAA). It is important to be precise, though, about what was being sold:
$12.8 billion was from the sale of CDs
$1.1 billion was from the sale of cassettes
$378 million was from the sale of music videos on physical media
$222.4 million was from the sale of CD singles
In short, the music industry was primarily selling plastic discs in jewel cases; the music encoded on those discs was a means of differentiating those pieces of plastic from other ones, but music itself was not being sold.
This may sounds like a stupid distinction, but it explains what happened after that peak:
Music industry revenue plummeted, even as the distribution and availability of music skyrocketed: the issue is that people were no longer buying plastic discs, which is what the music industry was selling; they were simply downloading music directly.
Selling Convenience
The problem is that recorded music has always been worthless: once a recording is made, it can be copied endlessly, which means the supply is effectively infinite; it follows that to capture value from a recording depends on the imposition of scarcity. That is exactly what plastic discs were: a finite supply of a physical good differentiated by their being the most convenient way to get music. Pirating MP3s from sites like Napster or its descendants, though, was even more convenient — and cheaper.
As you can see from the chart, the industry started to stabilize in 2010, and in 2016 returned to growth; 2018 looks to be up around 10% from 2017’s $8.7 billion number, and it seems likely the industry will pass that 1999 peak in the not-too-distant future.
What happened is that the music industry — prodded in large part by Spotify, and then Apple — found something new to sell. No, they are still not selling music; in fact, they are beating piracy at its own game: the music industry is selling convenience. Get nearly any piece of recorded music ever made, for a mere $10/month.
I don’t agree with some aspects of his analysis of open source in the rest of the article, but Thompson’s introductory framing is brilliant. Sometimes we get hung up on the thing that we think is the product in way that blinds us to the critical aspects that are valuable to the customer. These blind spots can cause us to miss potential points of instability in a seemingly stable market landscape. And cloud computing is a classic example of a thoroughly unsexy idea that can sneak into one of those blind spots. It certainly did in the LMS market.
The Instructure surprise
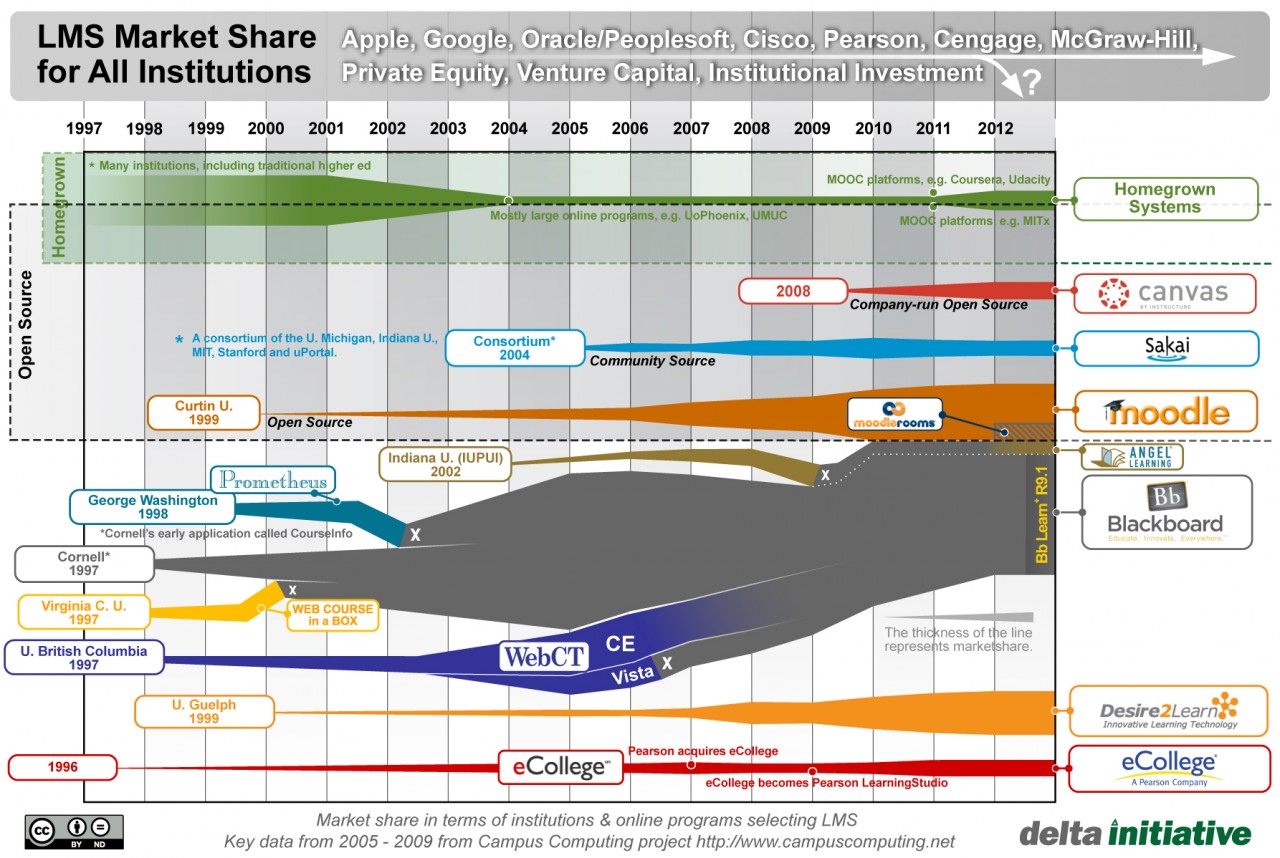
Instructure’s rise is a perfect example of one of those surprises. Let’s think back to the late Noughties, when the company was founded. This predates Phil’s coming to blog on e-Literate, so we’ll have to look at a 2009 version of his famous squid chart that he posted on the blog of his former employer:
2009 Squid Chart
Instructure, having been founded the year before this version of the chart was made, had not yet scored its first big deal with the Utah Education Network. They were literally not on the map. Blackboard was a juggernaut, having successfully swallowed two of their most formidable North American competitors, WebCT and ANGEL. Blackboard was also in the midst of a patent infringement case with Desire2Learn (now known as D2L), having won their case in 2008, only to lose upon appeal in mid-2009. Even after the suit was over, nobody knew how well Desire2Learn would bounce back after seeing their sales largely freeze during the year when it looked like Blackboard would win. eCollege was doing…fine, but it was serving the niches of for-profits and small schools, and there was no real sign that it was going to break out into the general market.
The real action in 2009 appeared to be in open source. Moodle, having picked up the smaller customers that Blackboard had deliberately driven away because of their low profitability, was beginning to score bigger wins. The change was most visible in the Cal State system, where Moodle was spreading there like a virus. Sakai’s growth by institutional adoption numbers was not nearly as dramatic, but in contrast to Moodle, they were rich in prestigious R1 university adopters. In 2005, when I was working at SUNY, I remember my boss at the time telling me, “They have MIT, Stanford, Michigan, Indiana…they can’t fail!” There was a widespread feeling among academics that the only way to escape being a Blackboard hostage…er…customer was to run an open source LMS that the company couldn’t buy. (Blackboard didn’t acquire the largest Moodle hosting provider in the United States until 2012.) It felt like the battle was going to be between Blackboard and open source.
Two years later, Phil’s squid diagram in his inaugural e-Literate post wasn’t much different:
You can see at the top of the diagram that there was increasing speculation about whether other companies—mostly big, established ones—might enter the market. There were, as always, a few startups that popped up in that time period, only to fade away, either by dying or by pivoting. (Remember Epsilen?) But by and large, the fight continued to be perceived as Blackboard vs. Open Source, with D2L and eCollege—by then rebranded by Pearson as LearningStudio—doing fine but not setting the world on fire. Instructure is still not yet on Phil’s map. We had noticed Instructure and written a few posts about them, but honestly, neither of us thought that a new proprietary entrant could break its way into the market, particularly if it lacked the muscle of a big player like a major SIS vendor or textbook publisher.
But by 2013, the picture had changed:
2013 squid diagram
Canvas was growing. Fast. Here’s the squid diagram a year later:
2014 squid diagram
Look at that Canvas line.
Whoah.
It was really only in 2013 and 2014 that most of us started to realize that Canvas was not only going to survive but might provide significant competition to the incumbents. Why did it take us so long to see it coming?
I would argue that we undervalued three of Instructure’s core strengths: usability, customer service, and reliability. We’ve written here before about how Instructure’s usability was a step function better than its competitors at the time. The early but seminal example was Speed Grader, Canvas’ grading app that greatly increased ease of use of the grading function and was the first mobile LMS app that demonstrated the potential of tablet computing. Blogs and wikis, which LMS providers had begun to add, only to find them barely used, were not considered valuable by most faculty. Giving them back hours of their time that they would have spent entering grades, on the other hand…. Likewise, we’ve written about how Instructure quickly established itself as the “uncola” of LMS companies by providing excellent customer service that was inextricably tied with their “not-Blackboard, not-Oracle” brand identity. Both of these non-features turned out to be more valuable to many customers than the bazillion features that were beginning to encrust the older, more “mature” LMSs.
But at least usability, customer service, and branding are all visible to end users in some tangible sense. In contrast, cloud computing was most valuable for something that it made invisible. Specifically, downtime. By 2012, the LMS had become a mission-critical application. Online learning was in full swing. For-profit universities like the University of Phoenix as well as public (mostly Sloan Consortium-funded) public universities like University of Maryland, University College (UMUC) had reached impressive scale in around 2008, right when Instructure was being born. In the intervening four-year period, many colleges and universities were chasing that scale. In 2010, Western Governors University founded its first offshoot campus in Indiana. The Online Program Management (OPM) business was hitting its stride. Academic Partnerships and 2U, two of the most successful OPM companies, were both founded the same year as Instructure. By 2012, both were surging. (Forbes named 2U one of the “10 startups changing the world” that year.)
And online usage in general was surging. Gmail exited beta in 2009. The two remarkable aspects about Gmail were that it provided full, intuitive functionality in any browser and it never went down. Not for crashes, and not for upgrades. It was just always there. Occasionally you would log in and there would be a new feature. But most of those upgrades were invisible to the user. A friend of mine used to love to ask a question during this period to make this exact point: “What version of Google are you using?” Not having to know your version number, having the software be always there and always up-to-date, turned out to be a killer capability. The most important feature turned out to be the one that you never noticed, because it turned your app into something that end users could come to take for granted. As more people were using rich web-based applications—remember “Web 2.0”?—they started having higher expectations for online usage in general. If buying stuff online became a normal, everyday thing, then why wouldn’t checking your course grades online? Even in a traditional, face-to-face classroom, students were starting to expect the convenience of the web to just be there for them in their classes. Documents should be there. Announcements should be there. Schedules should be there. Grades should be there. All the time. Increasingly, when the LMS went down, it was like the ATM machines going down. Before ATMs existed, life went on. Nobody died without them. Nobody noticed the lack of convenience. But afterward, since people have grown to take them for granted, any outage is an outrage.
I honestly didn’t understand why Instructure was making such a big deal about the cloud when they first launched. Neither did their competitors. And it took them quite a long time to figure it out.
Blackboard’s Hopes
Let’s fast-forward now to the relatively recent 2017 version of the squid diagram: ((It’s worth remembering that these diagrams are of market share for the US and Canada only.))
2017 squid diagram
It’s a different world. Sakai and Moodle, having peaked at slightly different points, are in decline in US and Canadian higher education. Canvas’ growth has been off the charts, and has only really slowed down in the year since this chart was made, as LMS adoptions in general have slowed in this market. D2L’s Brightspace bounced back after the patent suit and is holding their own.
But the biggest change is that Blackboard, far from being dominant, is a shadow of its former self in terms of its share of this market. These days, their press releases about customer “wins” in the United States are about Blackboard customers who decide not to leave after conducting an evaluation. We’re not seeing new customer wins in this market.
One of the reasons that we’ve been arguing that SaaS adoption is more important to Blackboard than adoption of its new(er) Ultra user experience right now is for the same reason that SaaS was so important to Instructure. The most important feature for Blackboard right now is the one that the end user doesn’t see. LMS migrations may be easier than they used to be, but they still require significant time and, often, pain on the part of the users who experience the transition. Most of Blackboard’s most risk-tolerant customers have already migrated to a newer, shinier alternative. The company’s remaining North American customer base is heavily risk-averse. It’s exactly that risk aversion that makes SaaS attractive. Blackboard is saying to these customers, essentially,
Hey, migrating is hard. Why don’t you just switch to SaaS? It can be invisible to your end users if you want it to be, but you won’t be in the firing line anymore with the painful downtime that you always get blamed for. And once you’re on SaaS, you can try out Ultra at your own pace. If the change is too scary, then don’t worry. You don’t have to make it. If you want to try it, slow or fast, with a few classes or with all of them, you’re in control. But let’s get rid of that pesky downtime for you. And let’s make upgrades less painful too. Just sign here to extend your contract for a few years and we’ll make those nasty surprises go away for your stakeholders.
It’s the SaaS, rather than Ultra, that is the primary driver for contract extensions. Which is likely why the company’s latest “Hey, we’re doing great!” press release was entitled “SaaS Deployment of Blackboard Learn Continues to Gain Momentum Around the World” rather than “Ultra Deployment of Blackboard Learn Continues to Gain Momentum Around the World” even though both headlines could equally fit the text of the press release. If Ultra adoption creeps along for another couple of years, it probably wouldn’t hurt Blackboard too badly. But if SaaS adoption creeps along, that would be a lot more serious.
Moodle’s worries
The SaaS shoe is on the other foot for Blackboard when it comes to Moodle. While the company has been playing catch-up to Instructure with their 3-year-old SaaS Learn offering, they are doing to Moodle something like what Instructure did to them with their Blackboard Open LMS offering. When Moodlerooms, which was the largest Moodle hosting provider in the US, was acquired by Blackboard in 2012, they had already built out a highly scalable SaaS version of Moodle. (In fact, Blackboard Learn’s SaaS architecture is based on lessons the company learned from studying the Moodlerooms SaaS architecture.) In global higher education markets outside of North America, Moodle is still a formidable player. In fact, it is the dominant player in many places. But the core open source Moodle project has been slow to roll out true multi-tenant SaaS capabilities. This has created an opportunity for Blackboard to roll into markets that are heavily saturated with self-hosted Moodle and say, essentially,
Hey, moving is hard. Why don’t you just switch to our Moodle-based SaaS LMS? It can be invisible to your end users if you want it to be, but you won’t be in the firing line anymore with the painful downtime that you always get blamed for. And once you’re on SaaS, you can try out our enhancements at your own pace. If the change is too scary, then don’t worry. You don’t have to make it. But if you want to try it, slow or fast, with a few classes or with all of them, you’re in control. But let’s get rid of that pesky downtime for you. And the upgrade cycles. Just sign here to have us get you on an Open LMS contract and we’ll make those nasty surprises go away for your stakeholders.
Those self-hosted Moodle customers that aren’t moving to Blackboard’s Open LMS are generally moving to…wait for it…the SaaS versions of Blackboard Learn, Instructure Canvas, or D2L Brightspace. Self-hosting as an option is fading away in the LMS market, for the same reason that fewer and fewer organizations are hosting their own email servers. The market has apparently decided that self-hosting these applications brings them a lot of pain without a lot of gain. And they may be willing to trade off functionality and autonomy in return for the perceived reliability that comes with SaaS.
This brings us full circle to Ben Thompson’s blog post about Amazon and Mongo DB. Amazon basically built its own database that runs natively on the company’s cloud platform and implements an older version of Mongo’s APIs. The threat to Mongo is that customers will find Amazon’s hey-it-just-works offering to be more attractive than Mongo’s more up-to-date APIs or than any benefits, either ideological or practical, that come from adopting open source. We don’t know how this will play out with Amazon and Mongo yet, but we’ve certainly seen how it has played out (and continues to play out) in the LMS market. It’s easy to get distracted by shiny feature-driven trends like competency-based learning, adaptive learning, or learning relationship management. These may or may not turn out to be important. But if you undervalue the boring and often invisible product attributes of “easy” and “reliable,” you can easily miss a sharp turn in the road.
Earlier this month Ben Thompson from Stratechery wrote a post, analyzing SAP’s $8 billion acquisition of Qualtrics, that provides insight into the shift in value proposition of the academic LMS. The SAP explanation along enterprise software lines shows the broader shift of enterprise software extending the view of the internal operations of an organization to also include a deeper view of the end users of an organizations offerings – students in the case of the LMS.
Thompson describes how SAP was founded in the 1970s and has a dominant position in Enterprise Resource Planning (ERP) systems that use central databases to provide customers with “a ‘real-time’ view of the state of their company” – essentially showing what the company is doing from an internal view. Customer Relationship Management (CRM) products emerged in the 1990s with the rise of ubiquitous PCs and the emerging Internet, tracking interactions with a company’s customers across time and across multiple locations – essentially showing a view of who the customers are and their interactions. Thompson then describes the challenge that modern companies face.
Fast forward another 20 years and the world has dramatically shifted yet again: not only are computing devices and Internet access ubiquitous, but critically, that ubiquity is not confined to businesses: customers, the ultimate endpoint of any business, are today just as connected as the employees of any large enterprise.
This can be a rather frightening proposition for large businesses: look no further than social media, where seemingly every week some terrible story about a company with poor customer service goes viral; there are an untold number of similar sob stories shared instantly with friends and family.
This same trend applies in education, with students being just as connected as faculty and staff of a college or university.
There are millions of complaints every day about disappointing customer experiences. This is called the experience gap. Businesses used to have time to sort this out, but in today’s unforgiving world, the damage is immediate, disruption is imminent. This has shifted the challenge from a running a business to guaranteeing great experiences for every single person.
Qualtrics provides a survey tool along with a sophisticated set of analytics and reporting tools based on this data – the key for SAP to understand consumer experiences. What is crucial, however, is not the standalone capabilities of Qualtrics, but the combination, again described by SAP’s CEO [emphasis added]:
To win in the experience economy there are two pieces to the puzzle. SAP has the first one: operational data, or what we call O-data, from the systems that run companies. Our applications portfolio is end-to-end, from demand chain to supply chain. The second piece of the puzzle is owned by Qualtrics. Experience data, or, X-data. This is actual feedback in real-time from actual people. How they’re engaging with a company’s brand. Are they satisfied with the customer experience that was offered. Is the product doing what they expected? What do they feel about the direction of their employer?
Think of it this way: the O-data tells you what happened, the X-data tells you why it happened.
This view of enterprise software navigating the larger trends of ubiquitous technology and connectivity, leading from the what to who to why, provides clarity on many of the trends we see in the ed tech world.
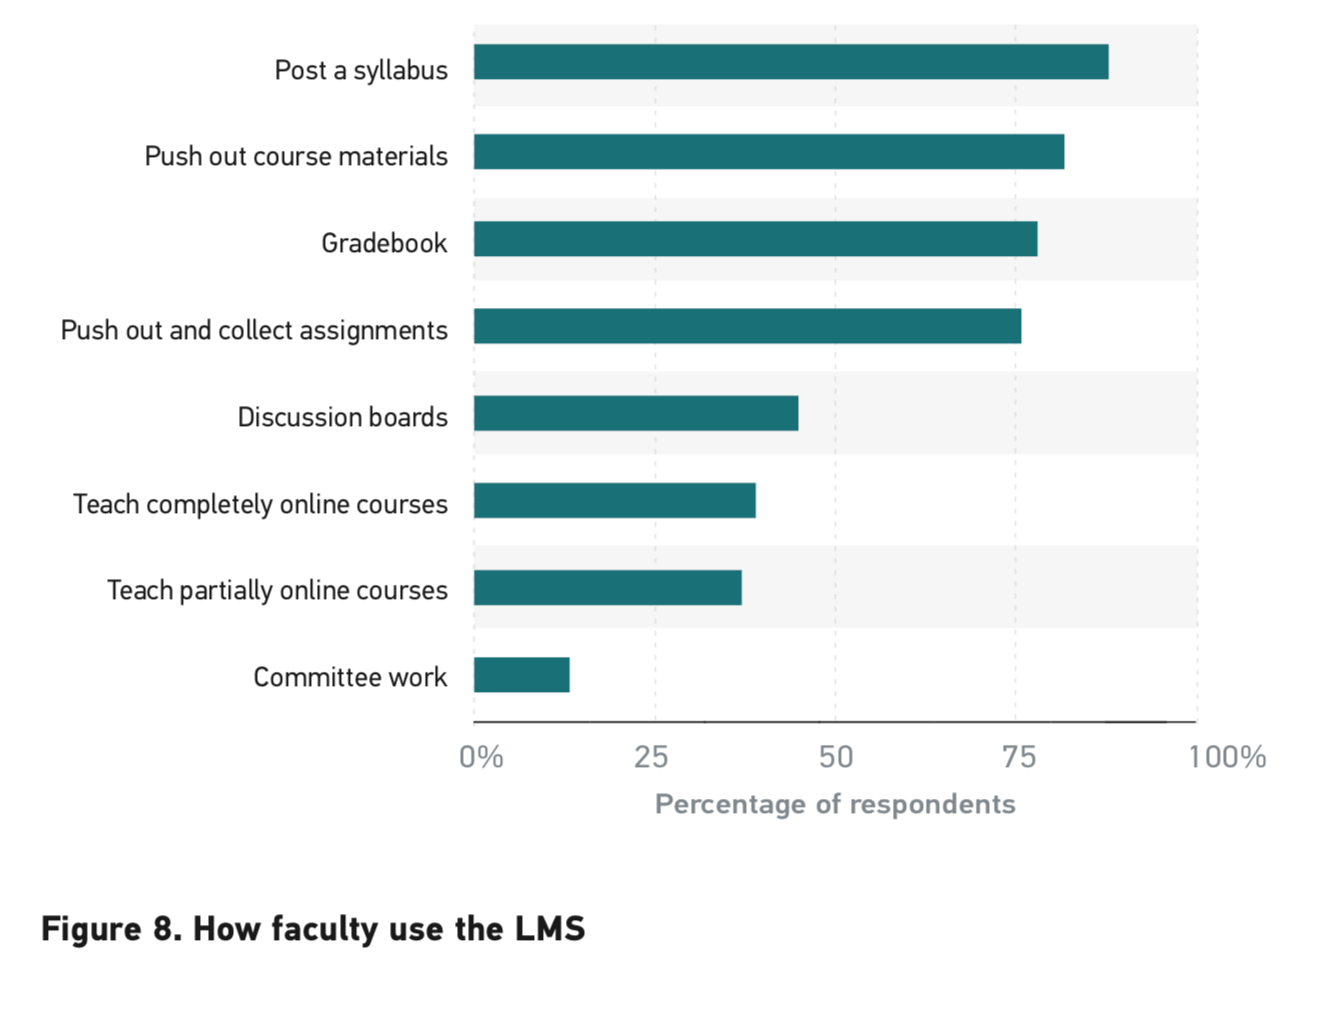
In education, the Learning Management System (LMS) was originally and more accurately called a Course Management System, and it has historically been focused on the management of courses, primarily through announcements to class, rosters, grade book, distribution of syllabus and course content, and submission of student work. Consider this figure from the ECAR Study of Faculty and Information Technology, 2017 that mirrors several other studies in its results:
While the modern LMS has advanced in many ways – particularly around usability, interoperability, and system reliability – the common usage of the this ERP-of-the-classroom has remained fairly steady. The dominant usage is managing the what of courses.
The LMS provides tools to manage communications – a view of the who of courses – through inbox, discussion boards, announcements, and various conferencing apps, but of these the dominant usage is through announcements. One way communication from faculty to students. The tools are there but not the reality of holistic views of interactions with students.
The shift in education from running a course to guaranteeing great experiences for students, to bastardize the SAP explanation, is much like the move towards experience management referred to in the Stratechery article. The movement is in its infancy, and it is likely to be measured in terms of decades, not years. Michael referred to this move in his most recent post.
If you’re a regular e-Literate reader, you know we have a macro thesis that the higher education sector is in the early stages of an evolution from having a philosophical commitment to student success toward having an operational commitment to student success. In other words, colleges and universities are starting to approach student success systematically, not as the natural by-product of hiring good faculty but as something that every student-facing aspect of the institution needs to be optimized for.
When you talk about student success, and great experiences, you have to go well beyond the official production of course content and grades and rosters. It doesn’t just matter what grades students get, it matters whether each student is learning, whether and when they get frustrated, and how often they’re engaging in the class. This gets to learning analytics and formative assessments and opportunities for students to quickly get help.
None of this is new, per se, and we’ve even seen attempts at alternative learning platforms to address this richer ecosystem. Consider the learning platforms designed initially to support competency-based education (CBE) such as Motivis Learning (spun out of Southern New Hampshire University’s College for America) or Sagence Learning (formerly FlatWorld Knowledge). These systems ((Disclosure: SNHU and Motivis were past subscribers to our LMS Market Analysis service.)), often called Learning Resource Management (LRM) systems, are designed to “see a holistic view” of students and “track student engagement”. They are designed to achieve the stated goals of SAP to combine operational data and tools along with experience data and tools.
We’ll get into more detail in future posts, but the category often labeled as adaptive courseware platforms are another example of next-generation systems that are designed to capture both operational data and experience data. These systems blur the boundaries between content and platforms and have the advantage of combining the two into a common design, which should allow deeper instrumentation of student activity during the learning process.
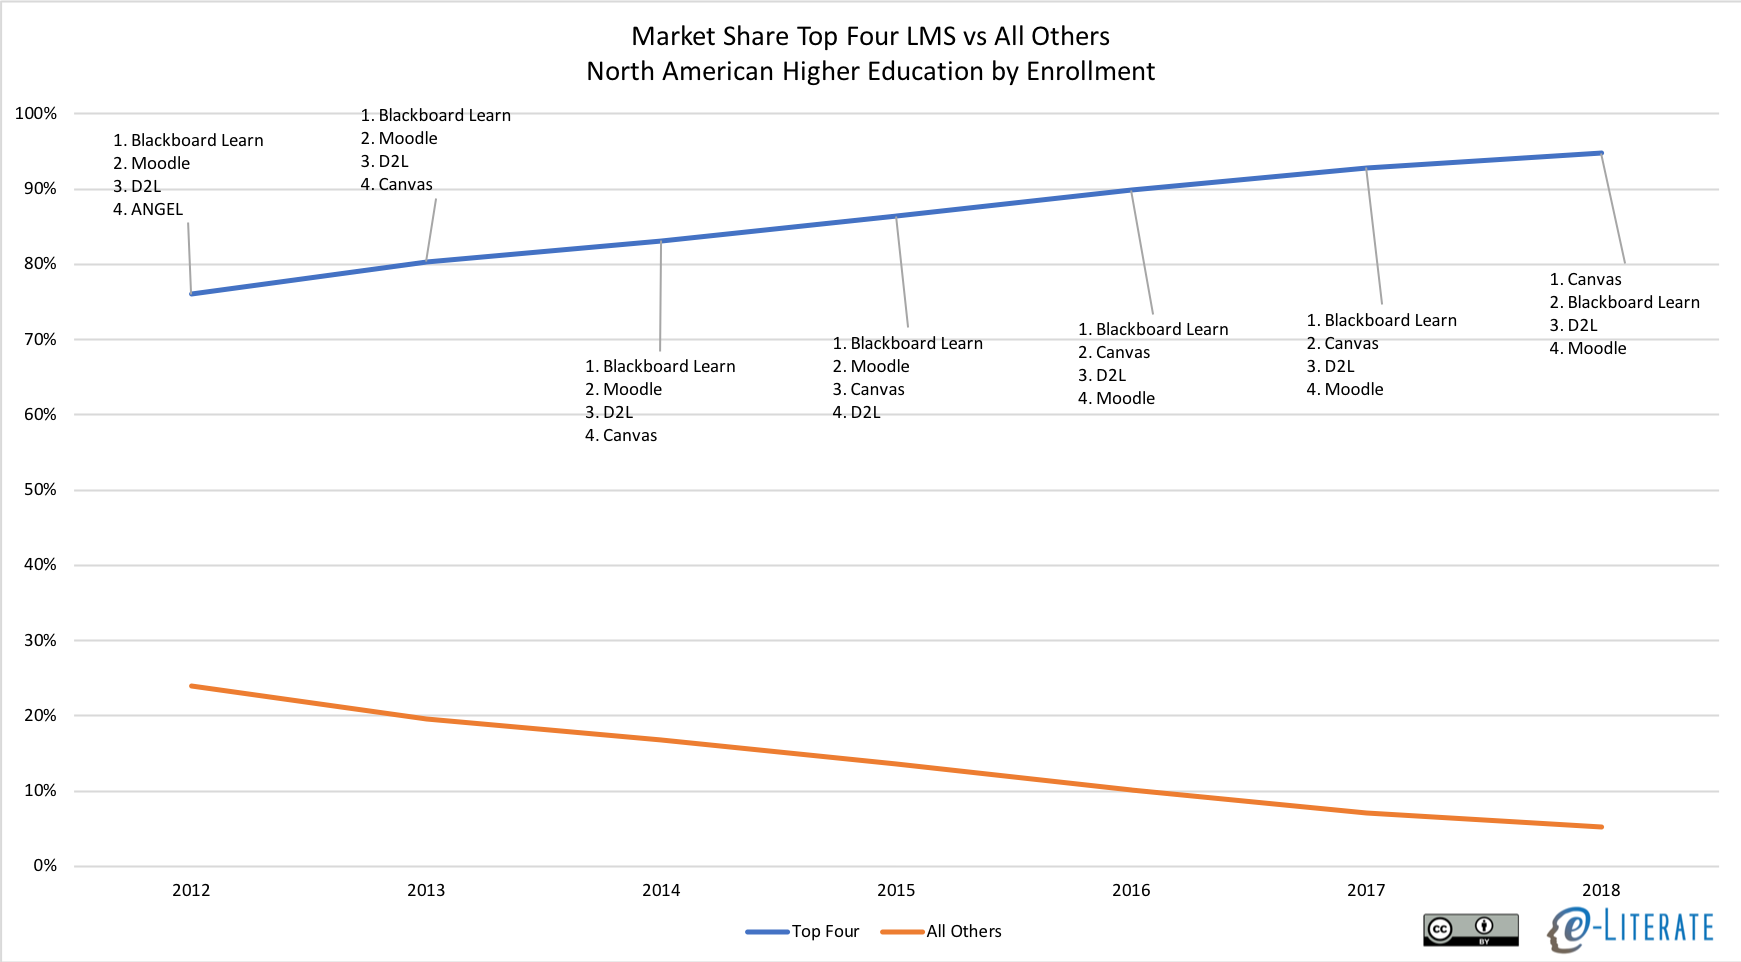
These examples get to the common question of whether the LMS will survive and exist in 10 years. The original LMS concept was designed around a course, not the learner, and most usage is administrative in nature, not learning activities. Shouldn’t next-generation systems like LRMs overtake the LMS market, as these companies expand beyond just CBE programs (see this post for context)? Well, the data do not show signs of this movement, and in fact the LMS market has been consolidating around just four solutions for institutional adoption – Canvas, D2L, Blackboard, and Moodle.
In the meantime, most of the LMS vendors have been adding functionality, whether through extension of their platforms or strategic integrations with third party tools, that seeks to provide views of the student experience. Learning analytics and reporting capabilities, mastery learning additions, federated sharing of student activity data.
One reason for the persistence of the primary LMS is that the LRM and courseware markets are not the ERP market. There are no SAPs in these worlds that already have ubiquitous usage. According to the Stratechery article “SAP is at the center of 77% of transactions worldwide”. The LRM typically starts out in a new CBE program with dozens, or maybe hundreds of students.
What is dominant in higher education circles? The LMS. It is one of the few ed tech solutions used in a majority of courses across online, blended, and face-to-face modalities. What the market appears to be doing is waiting for solutions that build on top of the LMS, or even extend the LMS itself, rather than replacing the LMS. And one of the main reasons is that the LMS has already been accepted as the enterprise system for academic usage, with operational data and tools managing the what of courses. It may be that over time alternative learning platform models will build up enough market share to become a credible threat to change the broader LMS market, but the signs so far are not encouraging for those vendors.
Qualtrics proved to be so valuable ($8 billion) because it could augment the ubiquitous SAP. SurveyMonkey, by contrast, went public as a standalone company and is worth far less ($1.8 billion, still a respectable number).
Looking into the future, the LMS will have to provide useful analytics on student outcomes, learning, and experiences along the way. Shifting from mostly running a course to guaranteeing great experiences for students. Whether this happens within the LMS of the future or as third-party augmentations of the LMS, and whether this happens with the current top four vendors or a different set, is not known. But the move to combine operational and experience data and tools is a trend we should expect to see over the next decade, both in ERP systems like SAP and in the academic LMS market.
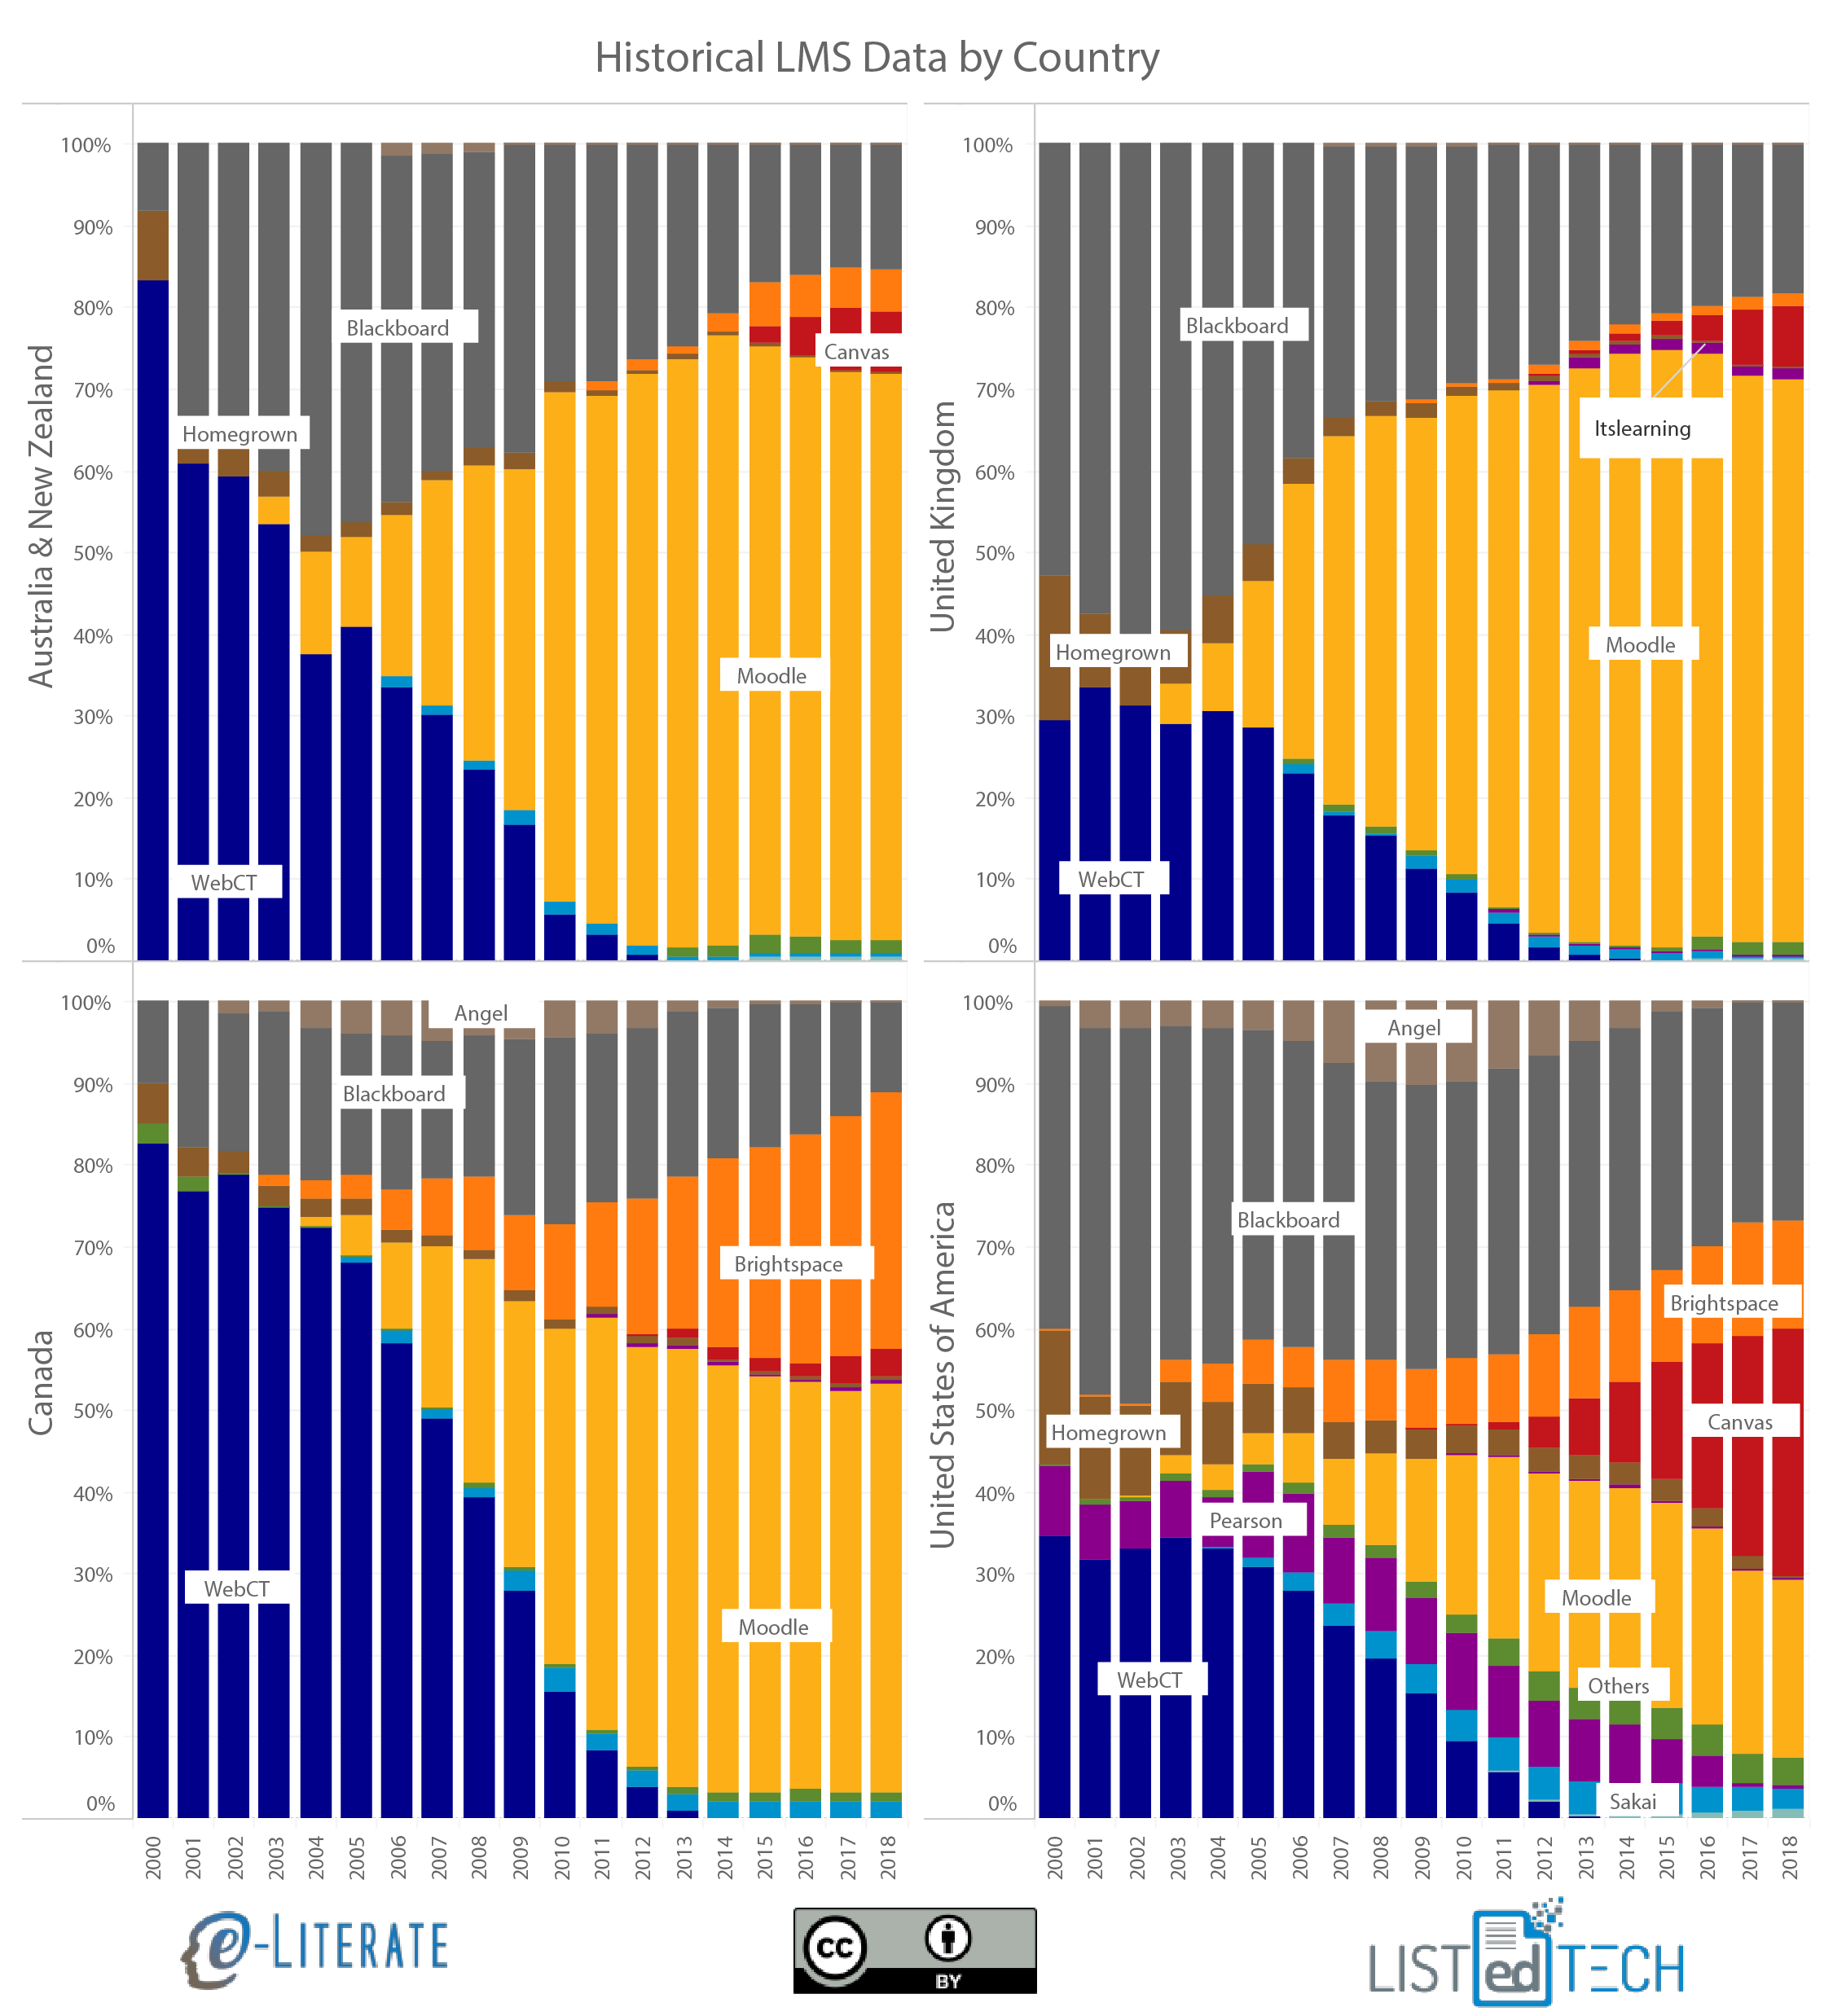
One of the trends we have been covering is the gradual consolidation of global LMS markets in higher education around “the Big Four”, Moodle, Blackboard, Canvas, and D2L Brightspace. While there are market similarities in terms of this consolidation along with the broader move to the cloud, it would be a mistake to view various global regions as having the same same trends overall, even in a subset of English-speaking countries.
By taking a step back and looking at institutional market share per country per year since 2000 (i.e. the percentage of higher education institutions having a particular LMS as their primary system), different adoption patterns become more apparent. In this case we’re looking at Australia / New Zealand (see note below), the United Kingdom, the US, and Canada. Note ahead of time that Blackboard acquired WebCT in 2004 and ANGEL in 2009 – this view separates out the product lines regardless of ownership, thus “Blackboard” means “Blackboard Learn / Academics Suite”. Also note that his is just one subset of the global market intended to show different patterns.
While the very early market was practically a duopoly, the preference for WebCT vs. Blackboard varied significantly.
Australia and New Zealand have a rich history of homegrown LMS development, including CECIL (University of Auckland in New Zealand), which some argue was the very first web-based LMS. There was still quite a bit of Homegrown LMS activity in the early 2000s along with a strong early preference for WebCT over Blackboard. Australia is the home country for Moodle (Perth), yet it lagged the UK in terms of late 2000s adoption of that system.
The UK showed a preference for Blackboard over WebCT, while also having significant Homegrown LMS adoptions early in the 2000s. Starting in 2003 we see the most rapid shift towards Moodle of any of these four countries, followed by a more recent move towards Canvas starting in 2013, starting with the Birmingham University adoption.
Canada is the home country for both WebCT (Vancouver, British Columbia) and D2L Brightspace (Kitchener, Ontario), and accordingly we see the highest percentages for both systems. This country also shows the slowest market gains for Canvas compared to the other three. Overall, early in the market, Homegrown solutions were much more common.
The US – home country to Blackboard, Pearson, Canvas, and Sakai – is seen as an outlier by not having Moodle as the dominant system in terms of installed base. Pearson LearningStudio, formerly eCollege, was quite important in the US market, largely due to its position in the for-profit sector. And this is the leading country in terms of Canvas installed base and growth.
There are other patterns to see in the data, but the overall point is to note how different adoption patterns can be in the LMS market, even for a subset of English-speaking countries since 2000. ((Disclosure: Blackboard, D2L, Moodle HQ, Instructure are all subscribers to our LMS Market Analysis service.))
Update 27 Nov: We have duplicated the x axis to show on both levels for clarify. The data is based on number of institutions and represent running totals of active implementations where we have implementation / decommission dates – approximately 75% of all known active systems. The current totals used for each country are approximately 200 for Australia, 250 for Canada, 700 for the UK, and 3,500 for the US.
Update 30 Nov: In an embarrassing mistake I credited CECIL to Australia when it was based at the University of Auckland in New Zealand. We have since updated the graphic to include both countries combined and edited the description of that region’s Homegrown activity. The article now combines Australia and New Zealand and treats as one country for the purposes of this analysis.
I’m going to be facilitating an Empirical Educator Project-relevant panel at OLC today at 11:15 AM in Oceanic 1, followed by an EEP and EEP-curious meetup at Soomo booth (#226) at 12:15 PM in the Expo Center. The rest of this post is just a little extra information on each of the SoTL work of the panel participants’ home institutions, for those who attend the session.
CMU Eberly Center
At the intersection of faculty research, teaching, and service, the Eberly Center supports Teaching as Research. We help faculty answer compelling research questions regarding which teaching strategies are more effective at promoting learning, increasing engagement, and enhancing the learning environment. Our services provide the tools and expertise to help instructors develop research questions and study designs, identify valid and reliable data sources, analyze and interpret educational data, and present and publish research results. Read more about our research processes and findings in this site:
Support is provided by the UCF Faculty Center for Teaching and Learning and the Research Initiative for Teaching Effectiveness. RITE assists faculty, free of charge, with any SoTL activity within the research design to dissemination continuum.
CTU
CTU is a career-focused university encouraging the use of educational technology and SoTL research in the areas of professional scholarship and adaptive learning. Faculty (including adjunct faculty) can apply for funding through an internal website and faculty are encouraged to share their research and scholarship work with the university. Additionally, research collaboration with other institutions is supported and encouraged as demonstrated by the work with CTU and UCF.
I’m going to be facilitating an Empirical Educator Project-relevant panel at OLC today at 11:15 AM in Oceanic 1, followed by an EEP and EEP-curious meetup at Soomo booth (#226) at 12:15 PM in the Expo Center. The rest of this post is just a little extra information on each of the SoTL work of the panel participants’ home institutions, for those who attend the session.
CMU Eberly Center
At the intersection of faculty research, teaching, and service, the Eberly Center supports Teaching as Research. We help faculty answer compelling research questions regarding which teaching strategies are more effective at promoting learning, increasing engagement, and enhancing the learning environment. Our services provide the tools and expertise to help instructors develop research questions and study designs, identify valid and reliable data sources, analyze and interpret educational data, and present and publish research results. Read more about our research processes and findings in this site:
Support is provided by the UCF Faculty Center for Teaching and Learning and the Research Initiative for Teaching Effectiveness. RITE assists faculty, free of charge, with any SoTL activity within the research design to dissemination continuum.
CTU
CTU is a career-focused university encouraging the use of educational technology and SoTL research in the areas of professional scholarship and adaptive learning. Faculty (including adjunct faculty) can apply for funding through an internal website and faculty are encouraged to share their research and scholarship work with the university. Additionally, research collaboration with other institutions is supported and encouraged as demonstrated by the work with CTU and UCF.