e-Literate

Present is Prologue

Tag: BSRG

  • OER Survey and Adoption Growth: It pays to check source material

    OER Survey and Adoption Growth: It pays to check source material

    I had a trip to the UK this month and only had time to read media coverage of the recent Babson Survey Research Group (BSRG) survey on open educational resources (OER). What a mistake. The Chronicle of Higher Education had a flawed description of a key question – actual and planned adoption of OER material by faculty – that misinformed readers like me who didn’t read the actual survey report, at least initially.

    The open-educational-resources movement, commonly known as OER, is an effort to encourage academics to use open-licensed materials in their classrooms as a way to lower costs. Some nonprofits, like OpenStax, have produced textbooks based on this material. The survey shows that OER has made inroads: 22 percent of people who teach introductory courses, subjects in which free textbooks are most commonly available, use it as required material, up from 15 percent last year.

    Yet the percentage of faculty members who say they will use, or consider using, open materials in the next three years actually dropped slightly, with the numbers now at 6 percent and 32 percent respectively.

    On the surface, this description indicates that OER adoption increased for faculty teaching introductory courses, but the second paragraph shows a potential drop in adoption over the next three years for all faculty. That would be major news showing that the OER movement hit an inflection point and is likely to drop soon, even though faculty have a natural affinity for the same issues that OER offers – lower cost and the ability to remix / reuse.

    It turns out this interpretation is wrong. The actual BSRG survey report states the following [emphasis added]:

    Each year, this survey asks faculty members who are not current users of open educational resources whether they expect to be using OER in the next three years.

    This question is only for non OER-adopting faculty. In other words, it measures growth potential, not total adoption potential. In fact, the percentage of faculty who used required OER material in any of their courses more than doubled this year, and based on the question above should continue to grow. BSRG further described the numbers for non OER-adopting faculty.

    There have been minimal changes in the proportion of faculty who report that they will use OER in the next three years, dropping slightly from 7% in 2015-16 and 2016-17, to the 6% reported this year. The number who report that they “Will consider” OER grew from 31% in 2015-16 to 37% for 2016-17, before dropping to 32% for 2017-18.

    This description is poorly worded and misses the context provided earlier, which I assume was part of the problem with Chronicle coverage.

    As for actual adoption, the category of “all faculty” grew significantly over the past year.

    Nearly one-quarter of faculty that teach large enrollment introductory courses report that they are using OER in some fashion, with more of these faculty responding that use OER as supplemental rather than as required materials. The rates are lower across all faculty, with 13% reporting using OER as required course material in at least one of their courses.

    These numbers represent a large increase over those in previous years, with the overall faculty rate of required OER use climbing from 5% two years ago to 6% in 2016-17, and then making a large jump to 13% this year. Given the sometimes vague understanding of the OER and its licensing, care must be taken in interpreting these results. Are faculty lumping any free resource into the OER category, even those that are not licensed as OER? Based on previous results we have to assume that there is some level of over-reporting in these figures of OER use; we just don’t know how much of an impact this is having.
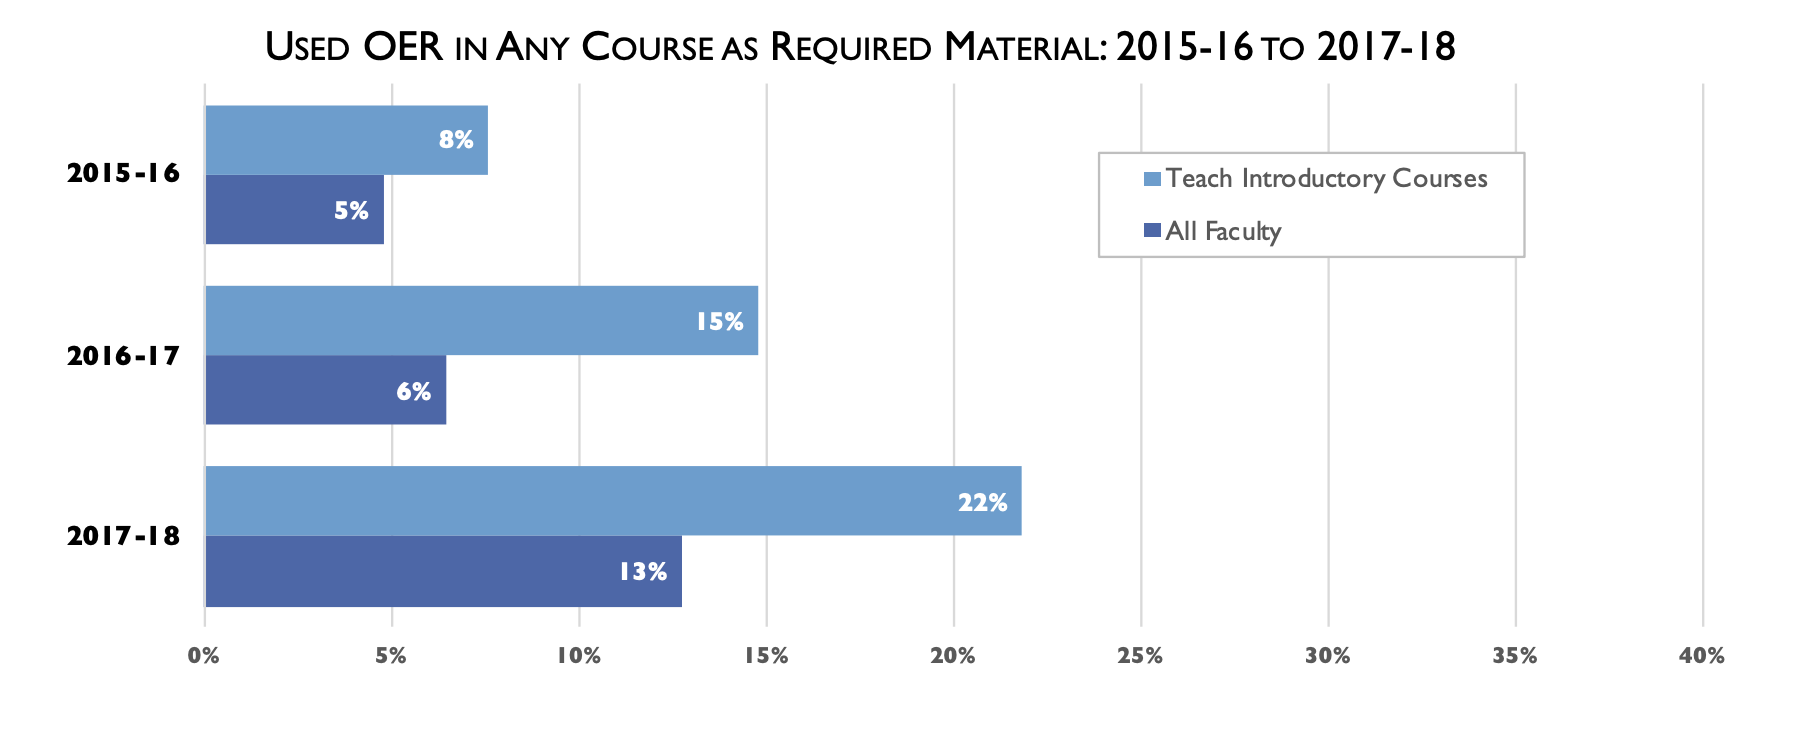
    Chart showing growth of OER adoption

    What is interesting is that this adoption growth aligns with an independent source, the Cengage OER survey from Fall 2016.

    Open Educational Resources (OER) in higher education have the potential to triple in use as primary courseware over the next five years, from 4 percent to 12 percent, according to a survey of more than 500 faculty by Cengage Learning.
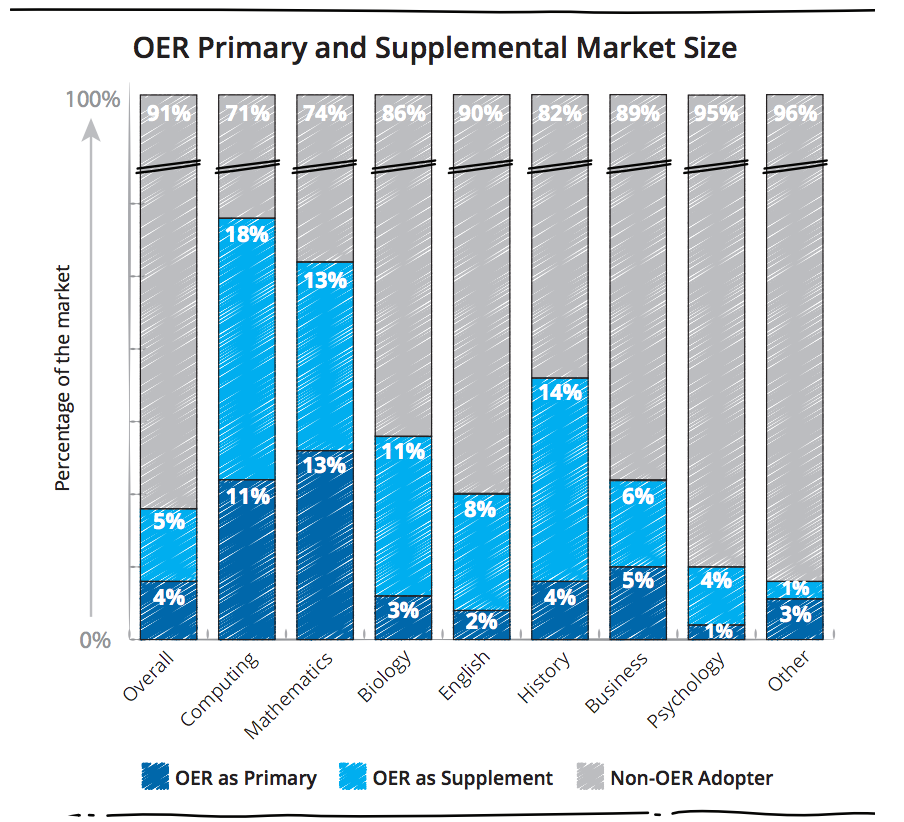
    What the data appear to show is significant growth in OER adoption for all faculty as well as for the subset teaching introductory courses. Adoption should continue, although it could be at a slower rate than was seen over the past year.

    It pays to read source material when the data describes important trends, especially when the results are surprising. I wish I had done this earlier.

  • Do For-profit Institutions Converting to Non-profit Affect Distance Education Enrollment Numbers?

    Do For-profit Institutions Converting to Non-profit Affect Distance Education Enrollment Numbers?

    In a comment to my post on the new Digital Learning Compass report covering distance education enrollment trends for US higher education, Richard Garrett, Chief Research Officer at Eduventures and Director at The Observatory on Borderless Higher Education, asked an interesting question.

    I’d welcome your view on a related issue I’ve been wrestling with, namely how to treat for-profit institutions with significant numbers of online students that are now nonprofit. A number made such a conversion in the fall 2012-15 period, and more are to come (e.g. the EDMC and Kaplan announcements). In your study, did you use institutional control for the year concerned or continue to treat former for-profits as such? If the former, then I think it is worth pointing out that some of the private nonprofit growth, and for-profit decline, is due to control conversion.

    With all of the news around for-profit changes, include Corinthian Colleges, ITT, Kaplan University, DeVry rebranding, I thought it would be worth addressing this question in a new post instead of just in the comments as I suspect others may have the same question.

    tl;dr – There has been no material effect of these institutional control changes for the periods covered in the DL Compass report (Fall 2012 through Fall 2015). (more…)

  • Digital Learning Compass: New report on distance education higher ed enrollments

    Digital Learning Compass: New report on distance education higher ed enrollments

    The next generation of the long-running Online Learning Survey is here, and it is now called Digital Learning Compass. Originally known as the Sloan Survey of Online Learning, then known as the Online Learning Survey, this study led by Jeff Seaman and Elaine Allen from the Babson Survey Research Group (BSRG) has been the definitive source for understanding the state of online learning for higher education in the United States since 2003.

    Three years ago the Department of Education’s Integrated Postsecondary Data System (IPEDS) started releasing census-based data on online enrollments, starting with the Fall 2012 term. The most recent data set is from Fall 2015, and today’s release of the Digital Learning Compass: Distance Education Enrollment Report covers this new data. Download the full report for free here. (more…)

  • Digital Learning Compass: New WCET webcast on distance education enrollment trends

    Digital Learning Compass: New WCET webcast on distance education enrollment trends

    This Wednesday, April 19th, at 11am PDT / 2pm EDT I will be participating in a WCET webcast based on the latest National Center for Educational Statistics (NCES) and its Integrated Postsecondary Education Data System (IPEDS) data for the Fall 2015 term on distance education (DE) enrollment.

    final-logo

    Register today for “Distance Ed Enrollment Trends: New Data, New Trends, New Partnershipon April 19 at Noon MDT. The webcast will run for 60 minutes and take place via GoToWebinar.

    April 19
    8:00 AM HAST /10:00 AM AKDT/ 11:00 AM PDT and MST/ Noon MDT / 1:00 PM CDT/ 2:00 PM EDT

    (more…)

  • One More Thing on NBER Report: Where did pre-2011 data come from?

    One More Thing on NBER Report: Where did pre-2011 data come from?

    Earlier today I critiqued the new National Bureau of Economic Research (NBER) report on the “The Returns to Online Postsecondary Education”, calling it “a hot mess that that conflates online students, enrollments, programs, institutions and uses a bizarre and misleading data set for its analysis”. That post looked mostly at the interpretation of Integrated Postsecondary Education Data System (IPEDS) data to define which institutions were exclusively online or substantially online based on the author’s definition. But this report has a bigger flaw that I initially missed – it shows historical data on online enrollments from the late 1990s and claims to analyze in detail online enrollment data from 2009 – 2014, yet IPEDS did not collect distance education data until 2011.

    (more…)

  • Fall 2014 IPEDS Data: New Profile of US Higher Ed Online Education

    The National Center for Educational Statistics (NCES) and its Integrated Postsecondary Education Data System (IPEDS) provide the most official data on colleges and universities in the United States. I have been analyzing and sharing the data in the initial Fall 2012 dataset and for the Fall 2013 dataset. Both WCET and the Babson Survey Research Group also provide analysis of the IPEDS data for distance education. I highly recommend the following analysis in addition to the profile below (we have all worked together behind the scenes to share data and analyses).

    Below is a profile of online education in the US for degree-granting colleges and university, broken out by sector and for each state. (more…)

  • Babson Study of Online Learning Released

    Babson Survey Research Group (BSRG) just released its annual survey of online learning in US higher education (press release here). This year they have moved from use of survey methodology for the online enrollment section to use of IPEDS distance education data. Russ Poulin from WCET and I provided commentary on the two data sources as an appendix to the study.

    The report highlights the significant drop in growth of online education in the US (which I covered previously in this e-Literate post). Some of the key findings:

    • Previous reports in this series noted the proportion of institutions that believe that online education is a critical component of their long-term strategy has shown small but steady increases for a decade, followed by a retreat in 2013.
    • After years of a consistently growing majority of chief academic officers rating the learning outcomes for online education “as good as or better” than those for face-to-face instruction, the pattern reversed itself last year.
    • This report series has used its own data to chronicle the continued increases in the number of students taking at least one online course. Online enrollments have increased at rates far in excess of those of overall higher education. The pattern, however, has been one of decreasing growth rates over time. This year marks the first use of IPEDS data to examine this trend.
    • While the number of students taking distance courses has grown by the millions over the past decade, it has not come without considerable concerns. Faculty acceptance has lagged, concerns about student retention linger, and leaders continue to worry that online courses require more faculty effort than face-to-face instruction.

    BSRG looked at the low growth (which I characterized as ‘no discernible’ growth’ due to noise in the data) and broke down trends by sector.

    Growth by sector

    (more…)