e-Literate

Present is Prologue

Author: Phil Hill

  • Christensen Scorecard: Data visualization of US postsecondary institution closures and mergers

    Christensen Scorecard: Data visualization of US postsecondary institution closures and mergers

    In 2013, Harvard Business professor Clayton Christensen made a bold prediction based on his ubiquitous innovation theory that maybe half of all postsecondary institutions could close within 10-15 years.

    (source: https://youtu.be/KYVdf5xyD8I, starting at 6:25)

    The scary thing is that 15 years from now, maybe half of the universities will be in bankruptcy, including the state schools. But in the end, I’m excited to see that happen.

    Christensen then doubled down on his predictions in 2017, humorously saying it might take nine years instead of ten.

    (source: https://youtu.be/4ljlUOV-Uj4, starting at 1:04:42)

    Q. Do you still believe, as you’ve said before, that as many as half of colleges and universities will be bankrupt or closed within a decade?

    A. Um, yes. [snip] Whether the providers get disrupted within a decade — I might bet that it takes nine years rather than 10. Maybe I’m too scared about the Harvard Business School to be rational about it. But we should worry.

    There have been plenty of articles written about these claims, but it has been frustrating that very few back up their analysis with data. One exception is Derek Newton’s article critiquing the claims in Forbes, titled “No, Half Of All Colleges Will Not Go Bankrupt”.

    Look at the numbers. In the 2013-14 year, there were 3,122 four-year colleges according to the Department of Education. In 2017-18, the most recent data, there were 2,902 – a drop of about 7% over four years. That could be disruptive. But numerically, all of school closures since Christensen made his 2013 forecast were four-year, for-profit schools, which fell from 769 in 2013 to 499 in 2017 – a drop of 270. Of all the colleges, at all levels, that have closed since 2013, 95.5% of them were for-profit institutions.

    Another exception is Michael Horn’s explanation of the predictions (he co-authored the New York Times op-ed from 2013, titled “Innovation Imperative: Change Everything”, that included the initial prediction). This 2018 post “Will half of all colleges really close in the next decade?” also sought to go back to original, more nuanced claims of 25% closures and mergers at the Christensen Institute.

    Translation? Our predictions may be off, but they are directionally correct.

    To that I emphasize one more piece of nuance. Ultimately we are really predicting a failure rate, made up of a combination of closures, mergers or acquisitions, and bankruptcies in which a college or university has the opportunity to restructure itself. Not all universities that “fail” will disappear. [snip]

    From 2004–2014, “Closures among four-year public and private not-for-profit colleges averaged five per year from 2004-14, while mergers averaged two to three,” according to Moody’s. Moody’s predicted in 2015 that that closure rate—out of 2,300 institutions—would triple by 2017, and the merger rate would double.

    Assuming that were true, and say that the rate held steady for 15 years, that would take out roughly 13% of existing higher education institutions right there.

    Thanks to our partners with our LMS Market Analysis service, LISTedTECH, we can now provide data visualizations to better evaluate the validity or likelihood of these claims. For the first time that I’m aware of, we have visualizations showing combined closures and mergers over time, broken down by sector and degree-type, and showing data 2-3 years in advance of IPEDS publications.

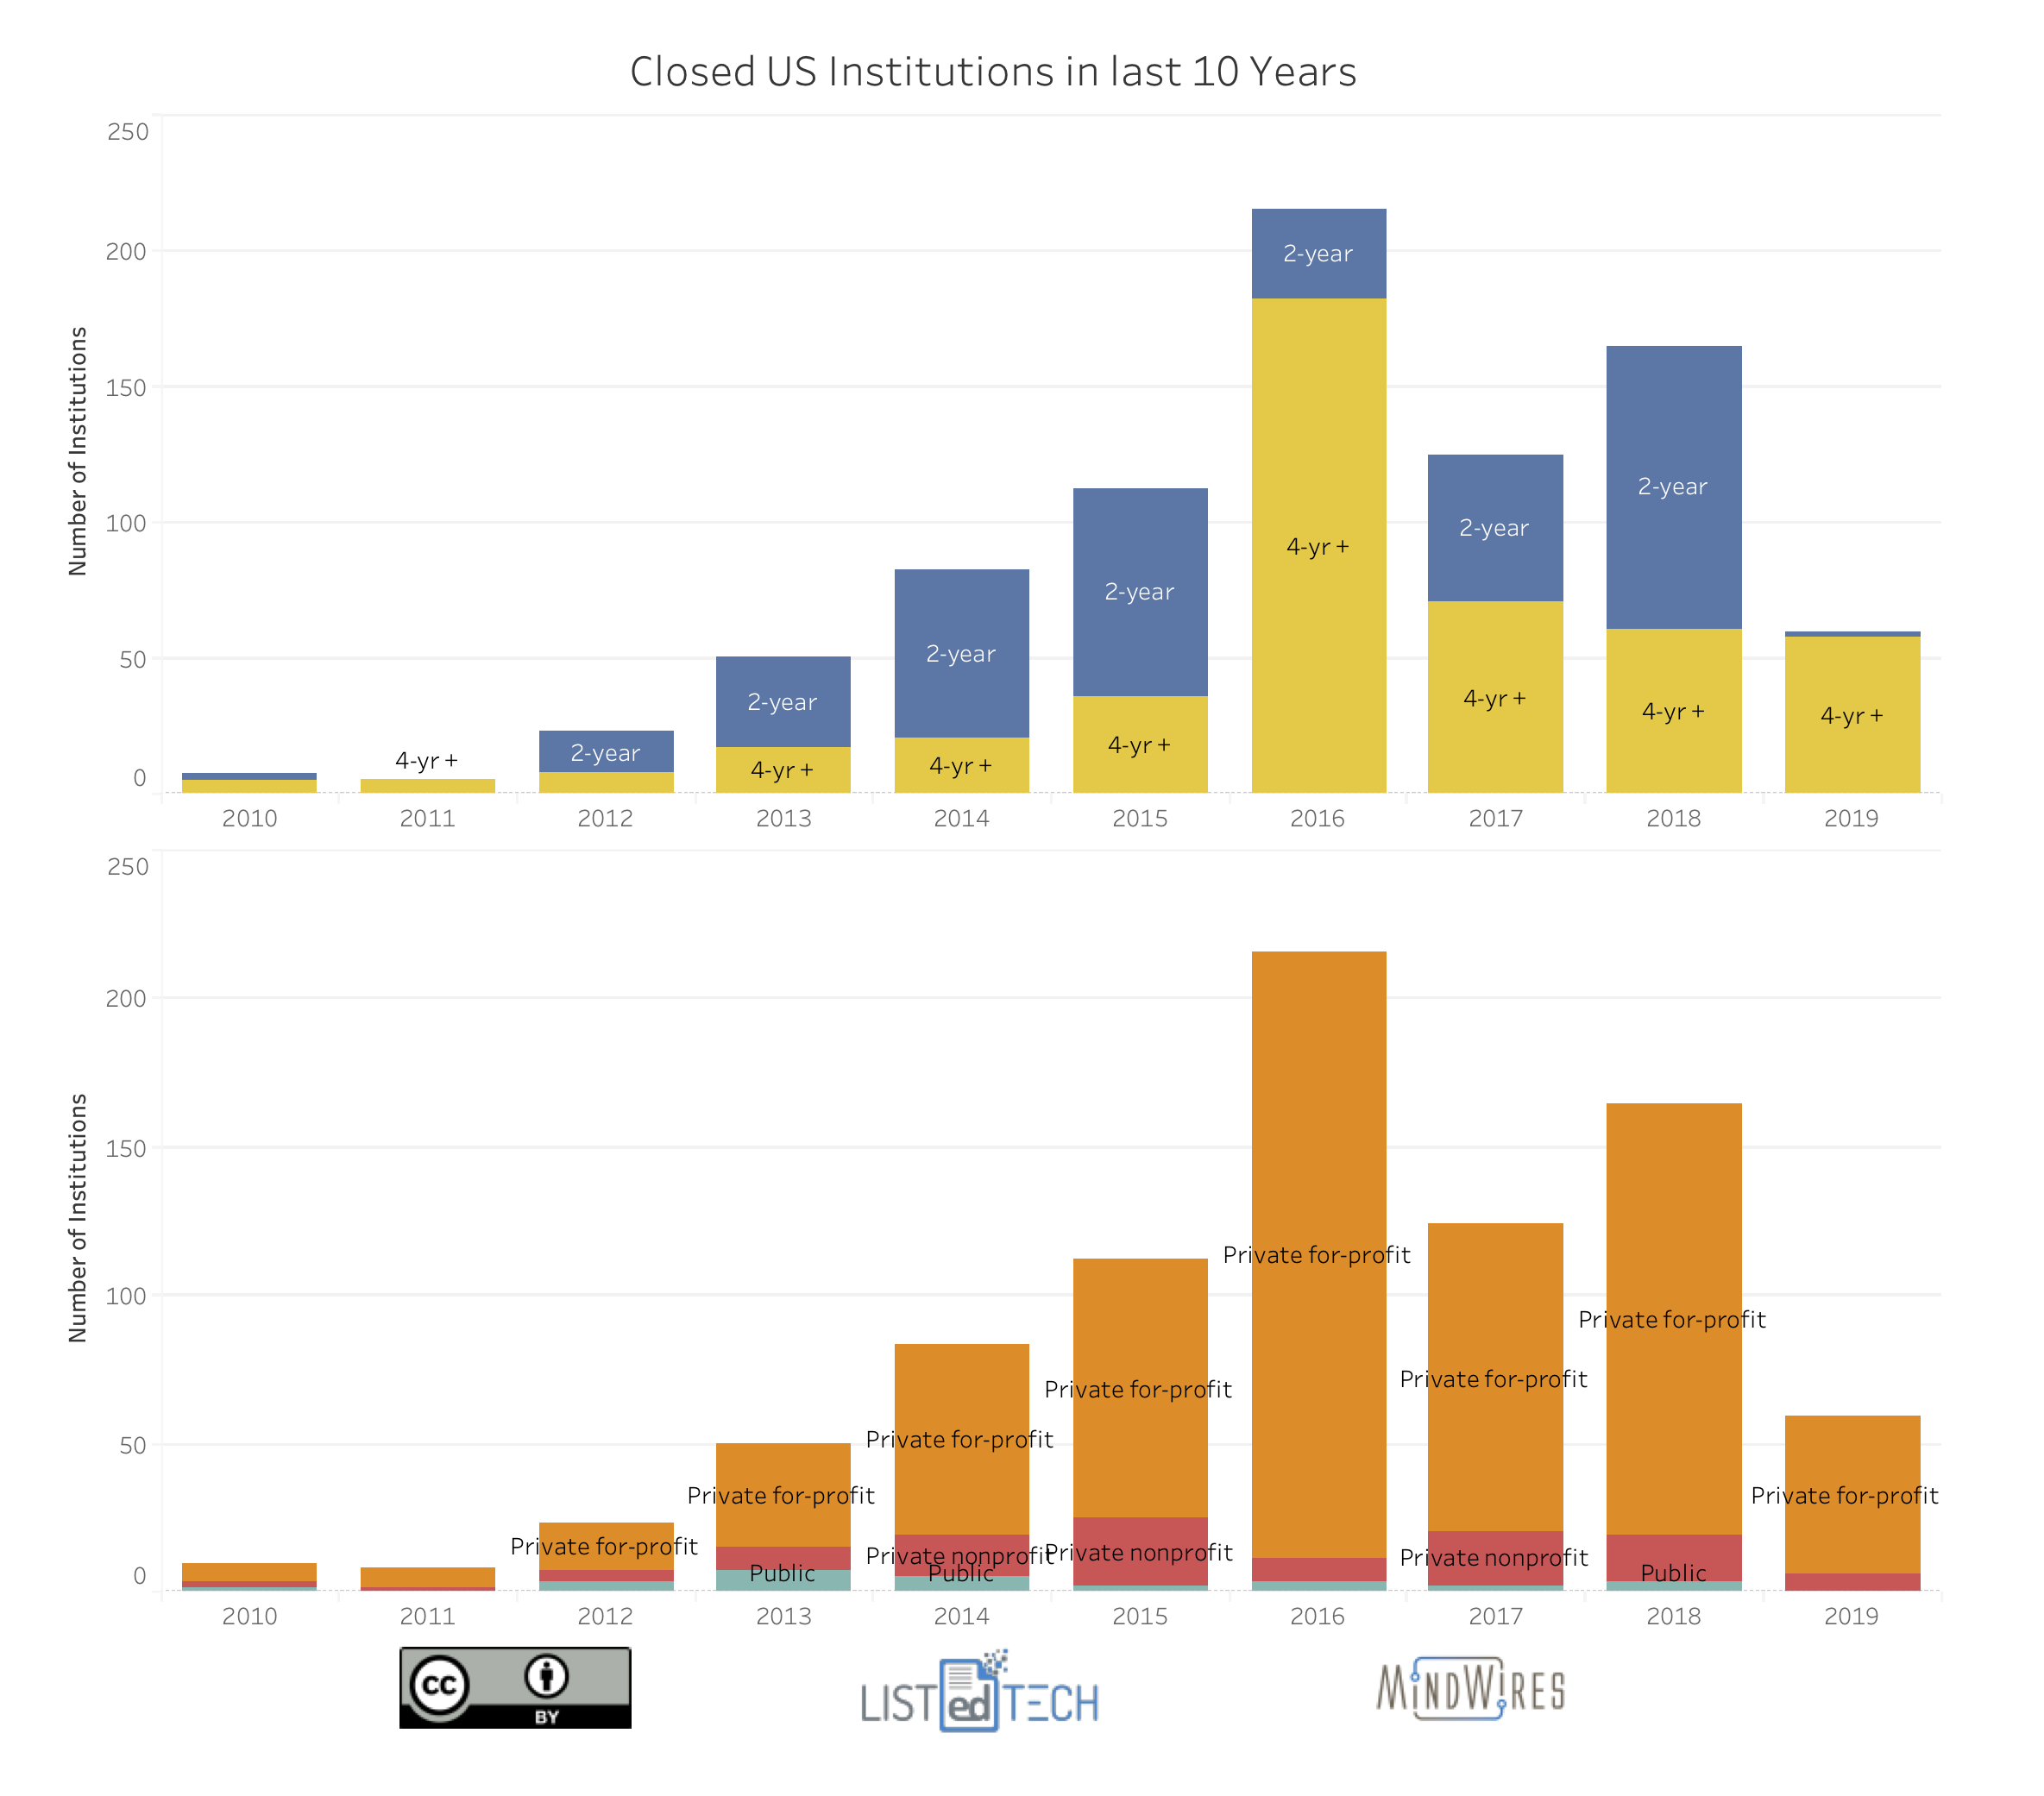
    The LISTedTECH data shown below tracks known closures and mergers, which have then been checked against both IPEDS and Federal Student Aid data sets. There are translation issues in all three data sets, so the data will not match 100% – probably more at the 80 – 90% confidence level. The first view shows combined closures and mergers per year, broken out by control and whether they are classified as 2-year or 4-year degree-granting institutions.

    Closed US higher ed schools over past decade

    As Derek Newton and Michael Horn pointed out, the vast majority of closures were from the for-profit sectors. Part of the dynamic at play is that when a large for-profit chain meets its demise (e.g. Corinthian Colleges, ITT, Westwood Colleges) or has a massive downturn (e.g. University of Phoenix) literally dozens of individual institutions close, whereas when a small private nonprofit college in New England closes, it is one school. Add to the that the massive drop in for-profit enrollments since 2012.

    The public sector data in 2013 and 2014 is largely driven by reorganizations in the University System of Georgia.

    Also note that the 2019 data only includes the first quarter.

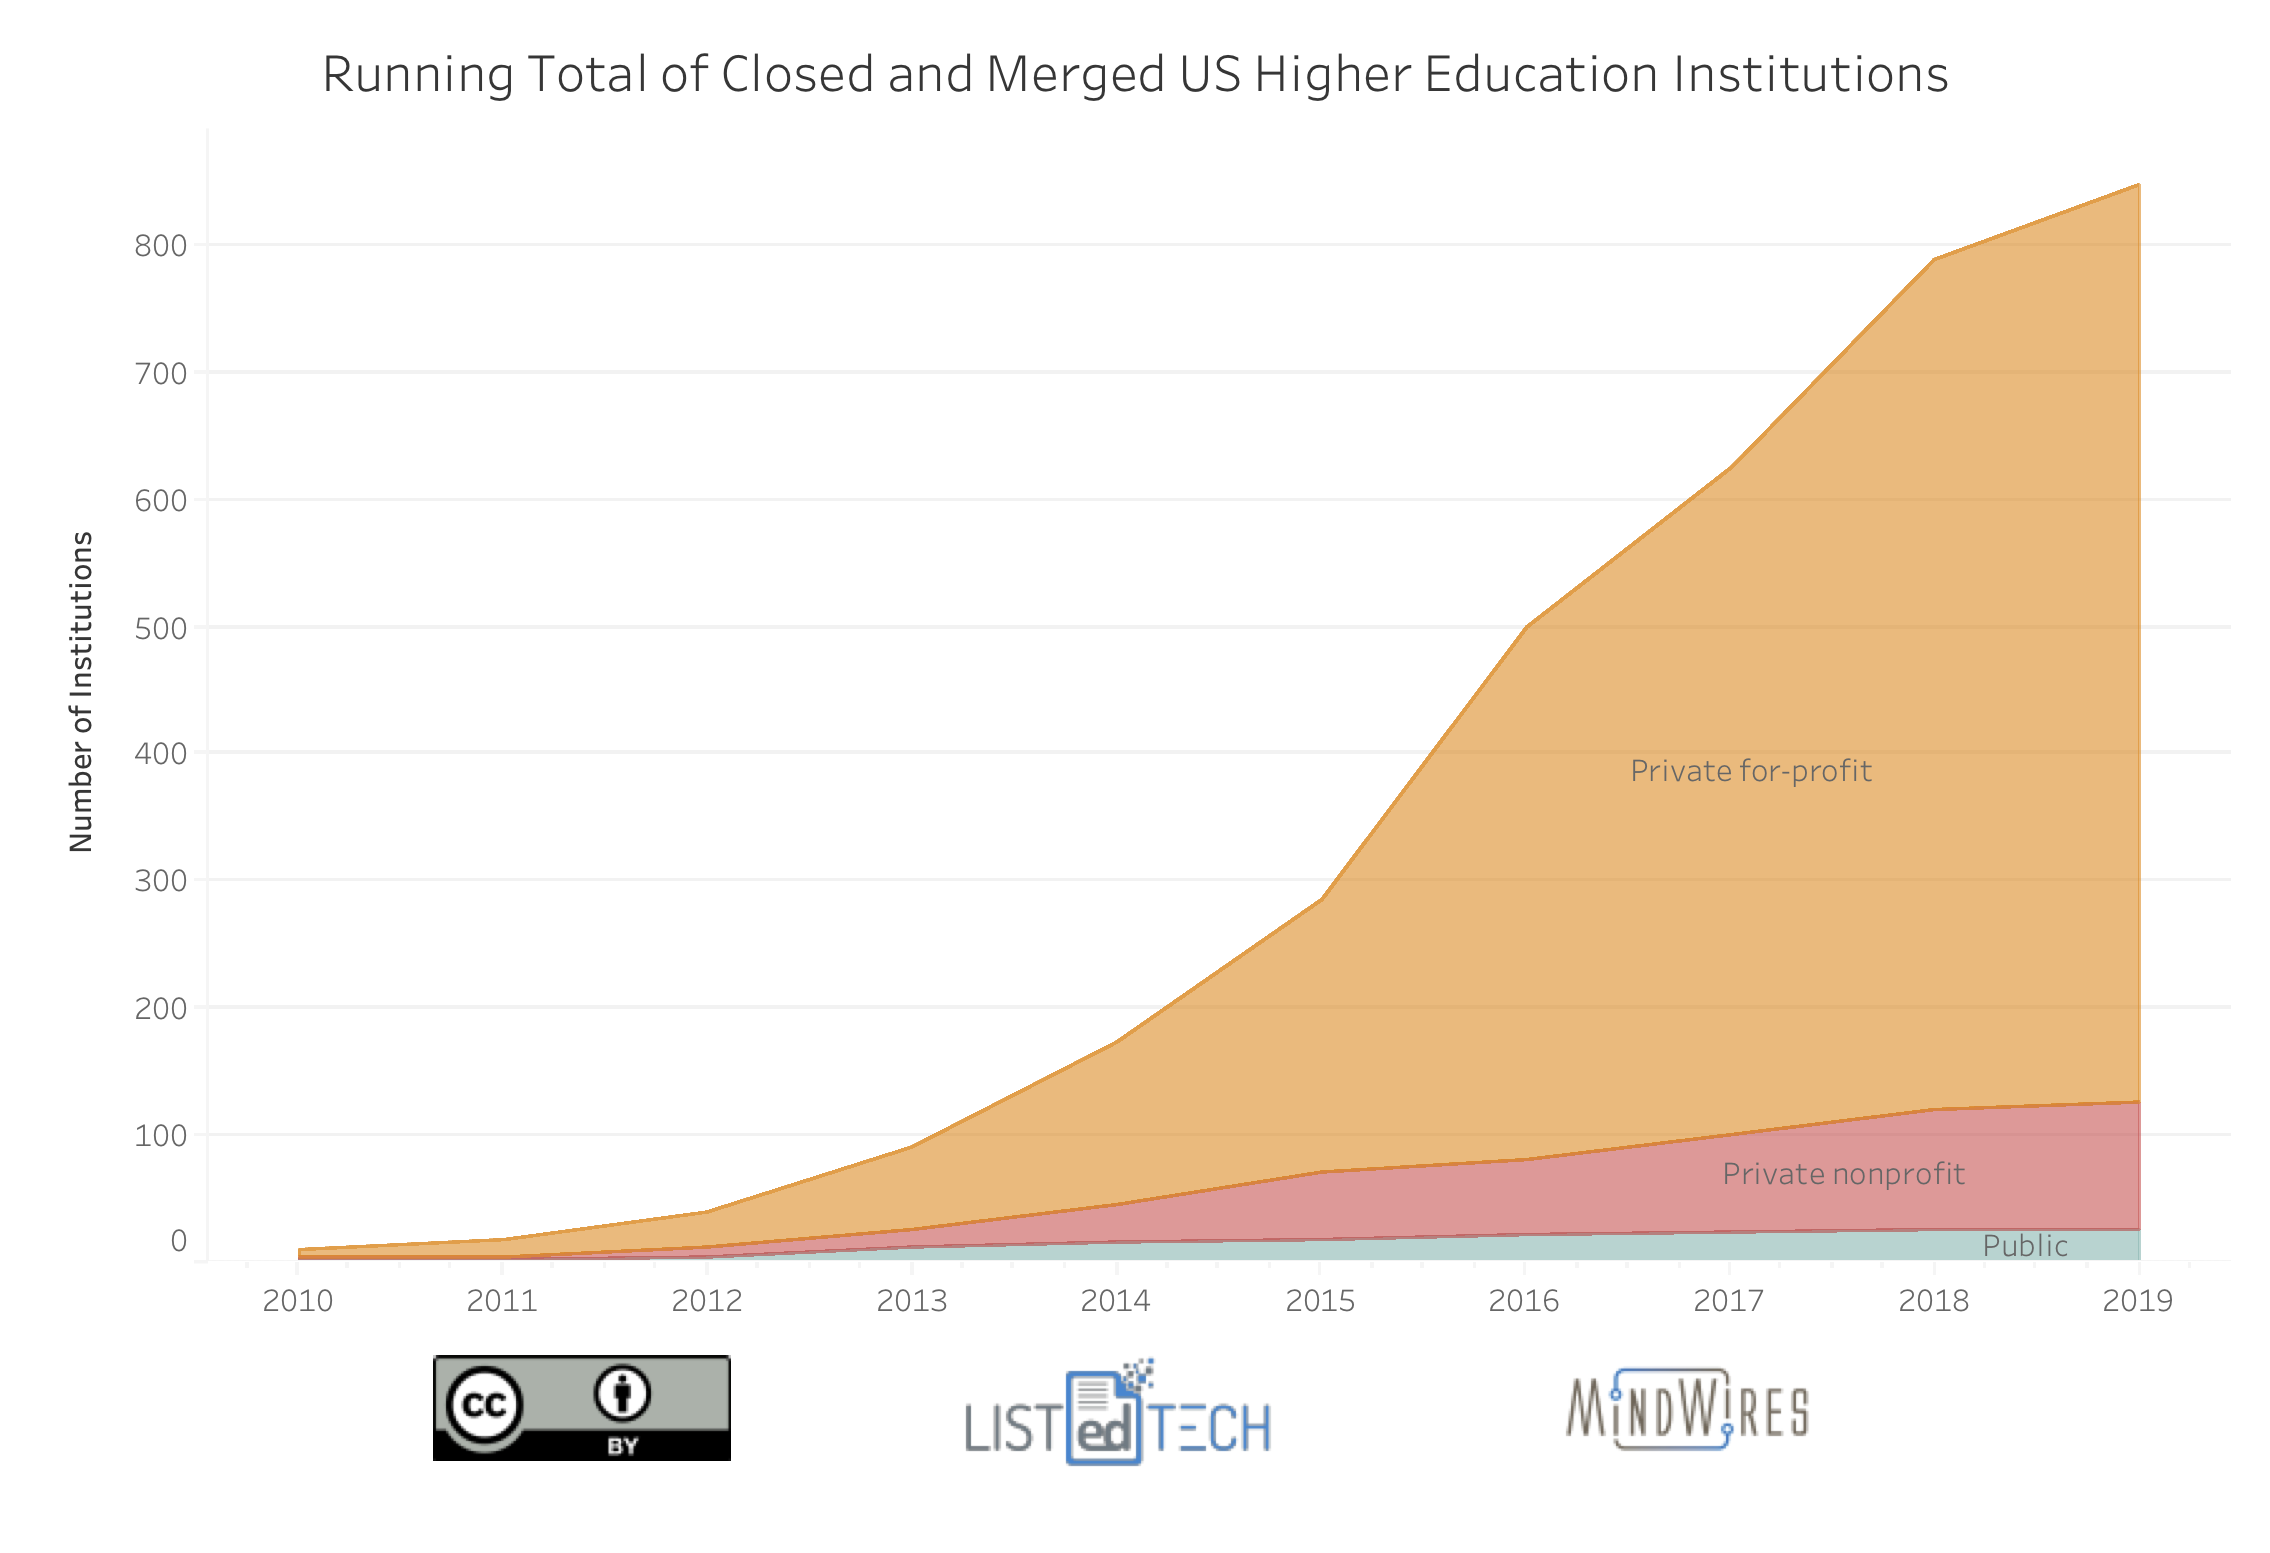
    If we want to track the Christensen (and Horn) predictions, however, we need to view this data as a running total.

    Running total of closed and merged US higher ed institutions

    Let’s zoom out to capture the timeline of the most recent predictions of a decade from 2017, and let’s add the rough levels indicated (using bold row from this IPEDS table to define number of institutions).

    Running total of closed US institutions with trend lines

    If you include all degree-granting institutions (i.e. for-profits as well as private nonprofits and publics), then the current trends lines show that the 50% closure prediction by 2027 certainly seems feasible. Note, however, is that there are less than 1,000 for-profit institutions remaining as of Fall 2017 IPEDS data, and the rate of for-profit closures cannot continue more than another 8-10 years (best case / worst case, take your pick).

    There are quite a few stories recently about private nonprofit small-school closures, but the data thus far don’t show a rapid acceleration of closures. Some perspective is useful here.

    If you ignore the for-profit sectors, then the trend line for private nonprofit and public institution closures + mergers remains far below that needed to hit the 25% level described by Horn or the 50% level described by Christensen. None of this is to say that the trends moving forward will be linear, however. The rate of private nonprofit and public closures and mergers would need to at least triple to hit the more conservative level of 25% within a decade, a possibility that I would not reject out of hand. And it turns out that Moody’s was wrong – the rate of closures and mergers in this group did not triple from 2015 – 2017. Nevertheless, the data could get worse.

    We’ll share more information on this new data, but hopefully these visualizations provide a better sense of the trends on college closures and mergers.

  • Instructure: Plans to expand beyond Canvas LMS into machine learning and AI

    Instructure: Plans to expand beyond Canvas LMS into machine learning and AI

    It’s common knowledge that Instructure has shifted its focus to place more emphasis on its growth in corporate learning markets than in the educational markets that have fueled the company growth to date. We covered the initial news about their introduction of the corporate learning LMS, Bridge, four years ago.

    While Instructure has excelled on maintaining product focus and simplicity of user experience, this move outside of education raises the question about whether they can maintain company focus. The corporate market is very different than the education market – different product needs, fragmented vendor market, different buying patterns. Many companies have tried to cross over between education and corporate learning, but most have failed. Blackboard, D2L and Moodle have made a footprint in the corporate space using one product for both markets. Instructure’s approach is different.

    As noted, the other Big Four LMS vendors are also targeting corporate learning (or professional ed, or workplace, pick your name). D2L and Blackboard are using the same platforms in both markets (Brightspace for D2L, Learn and Open LMS for Blackboard), while Moodle released Workplace, a set of plugins on top of core Moodle. Instructure, however, has different products for educational and corporate markets.

    That is old news. What is more interesting is to understand Instructure’s emerging strategy given the new executive team. Thanks to the nature of Instructure being a publicly-traded company, we are getting more insight that should set expectations for educational customers. As CEO Dan Goldsmith said during an investor conference a week ago:

    We really changed the company, as I came in nine months ago and then took over as CEO January 1st of this year. We’re initiating the second chapter in the journey of Instructure.

    I should first note that the audience for these calls is the investment community, so naturally Instructure executives focused more on financial performance and projections that they would in academic meetings. But there is a lot to learn here.

    In some ways, the changes to operations of Instructure are welcome and are already helping them manage corporate finances. In other ways, however, that second chapter reads a lot like Blackboard. Moving beyond the LMS, willing to bet on corporate acquisition, expecting big focus on data and analytics, and continuing challenges in completing products.

    Operational Improvements

    One of the ongoing criticisms of Instructure, particularly by their competitors, is that they continue to lose money and are buying growth. While these observations are accurate, as long as Instructure keeps growing, they have never been at risk of running out of money or having their losses significantly impact their operations. Under the new leadership, Instructure has been much more aggressive in managing expenses, with a big milestone described on the conference call by CFO Steve Kaminsky [emphasis added].

    Turning to the expense side. With our focus on operational excellence during the second half of 2018, we’ve changed the mindset of our leadership team and the entire organization about how we approach the business and fund investment. We focused on disciplined investments for balancing profitable growth has been put in place and is reflected in the outlook we provided today. On the cash side, we have a strong cash position to support our important strategic objectives for both Canvas and Bridge. And looking forward to 2019, we anticipate being approximately free cash flow neutral for the full year.

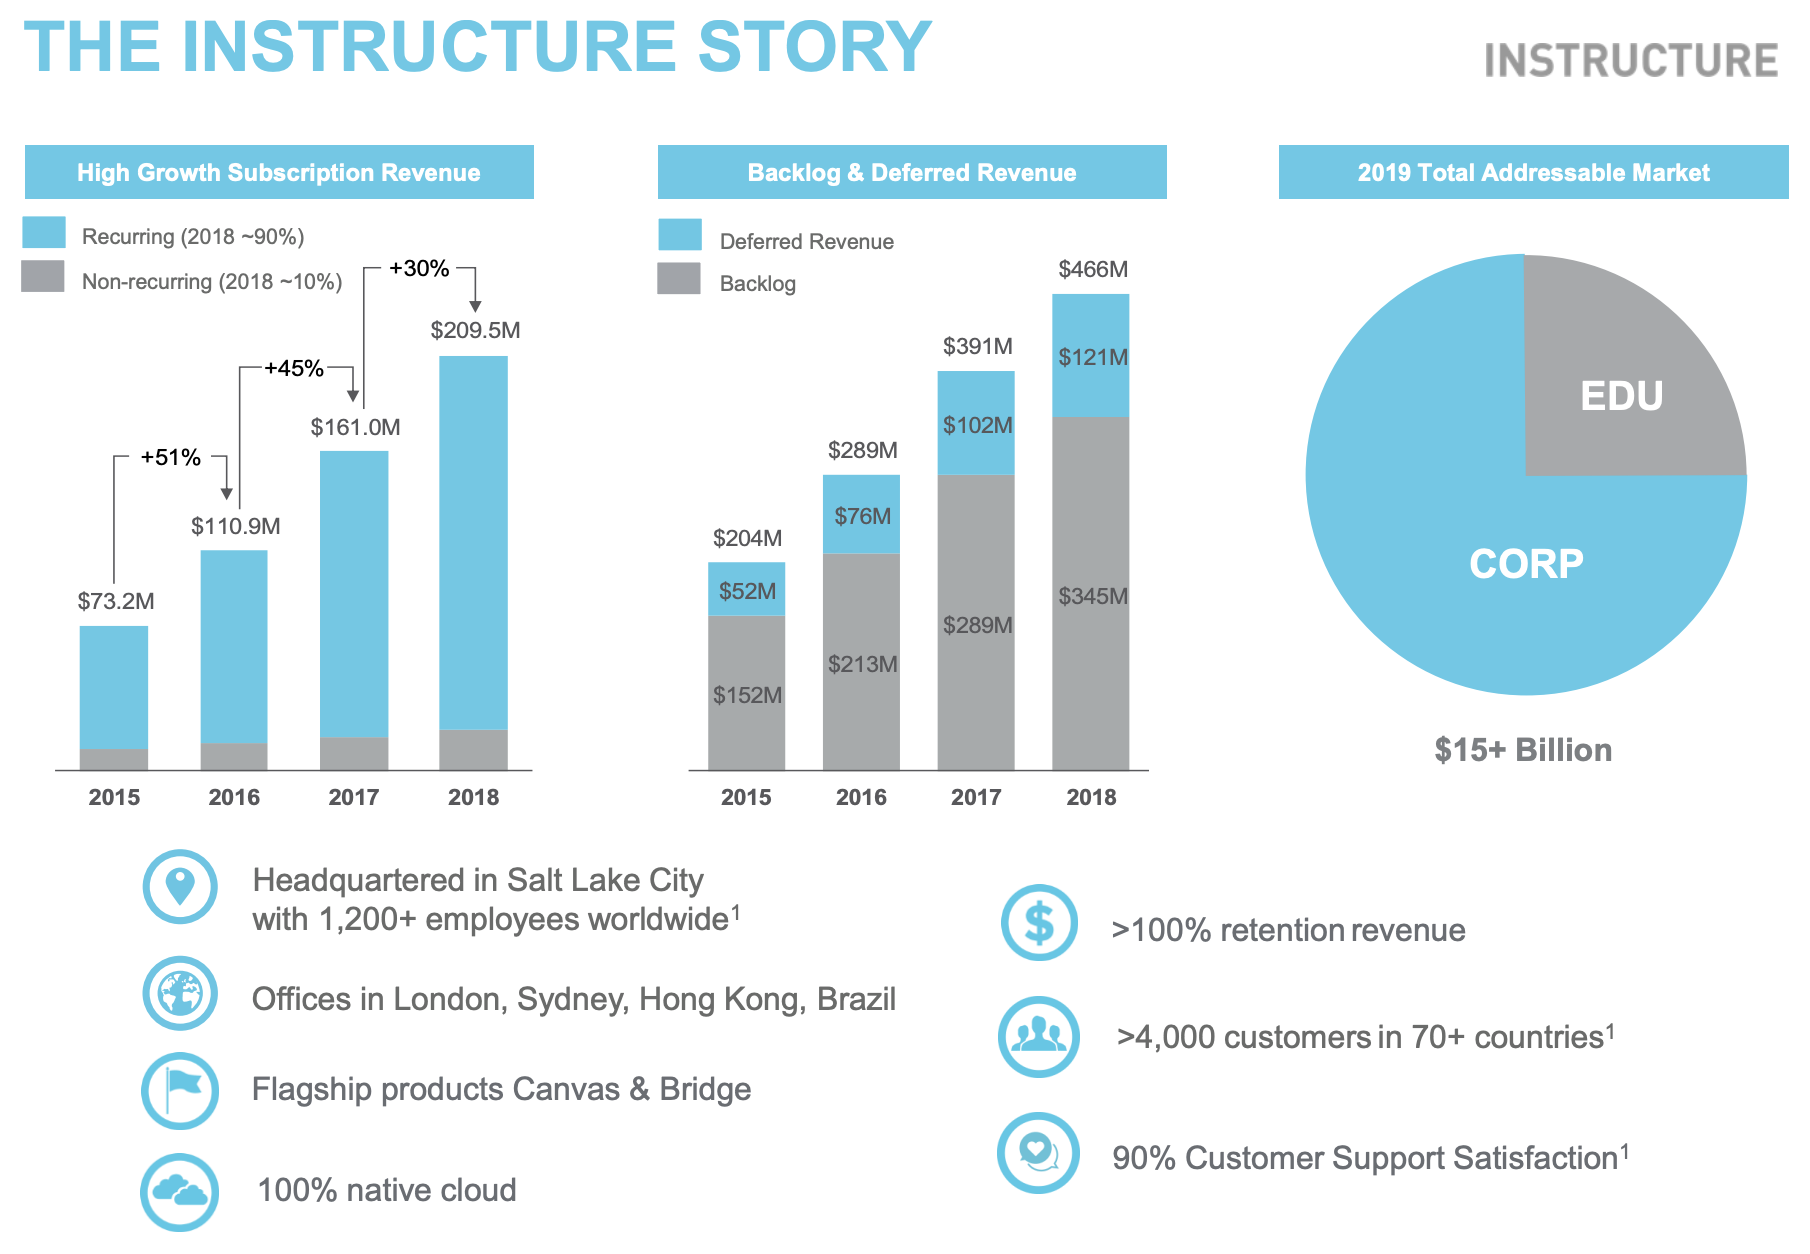
    Beyond simple finances, we have seen some operational changes for international operations as well. The global regions (EMEA, Latin America, APAC) all have more autonomy now, including control over country-specific marketing and product management. The non-US operations have moved beyond being regional sales and support offices into more aggressive engines of growth. In Europe and other regions, the management team has more autonomy is deciding which countries are worth investment for expanding markets, and when. From the Feb 25th investor presentation:
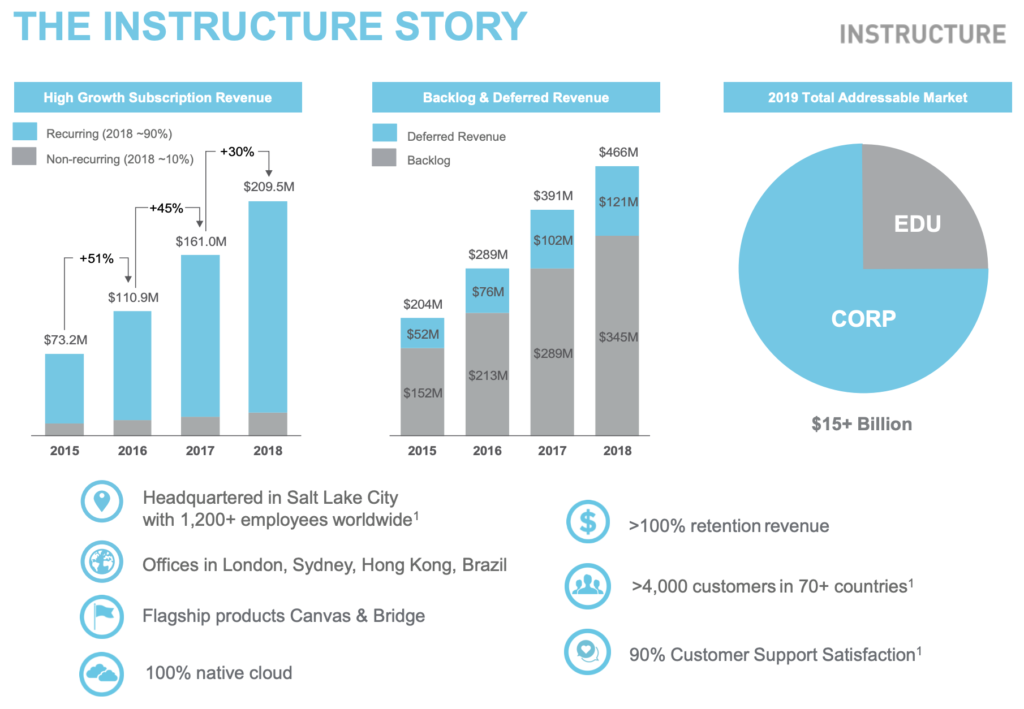
    The Instructure Story

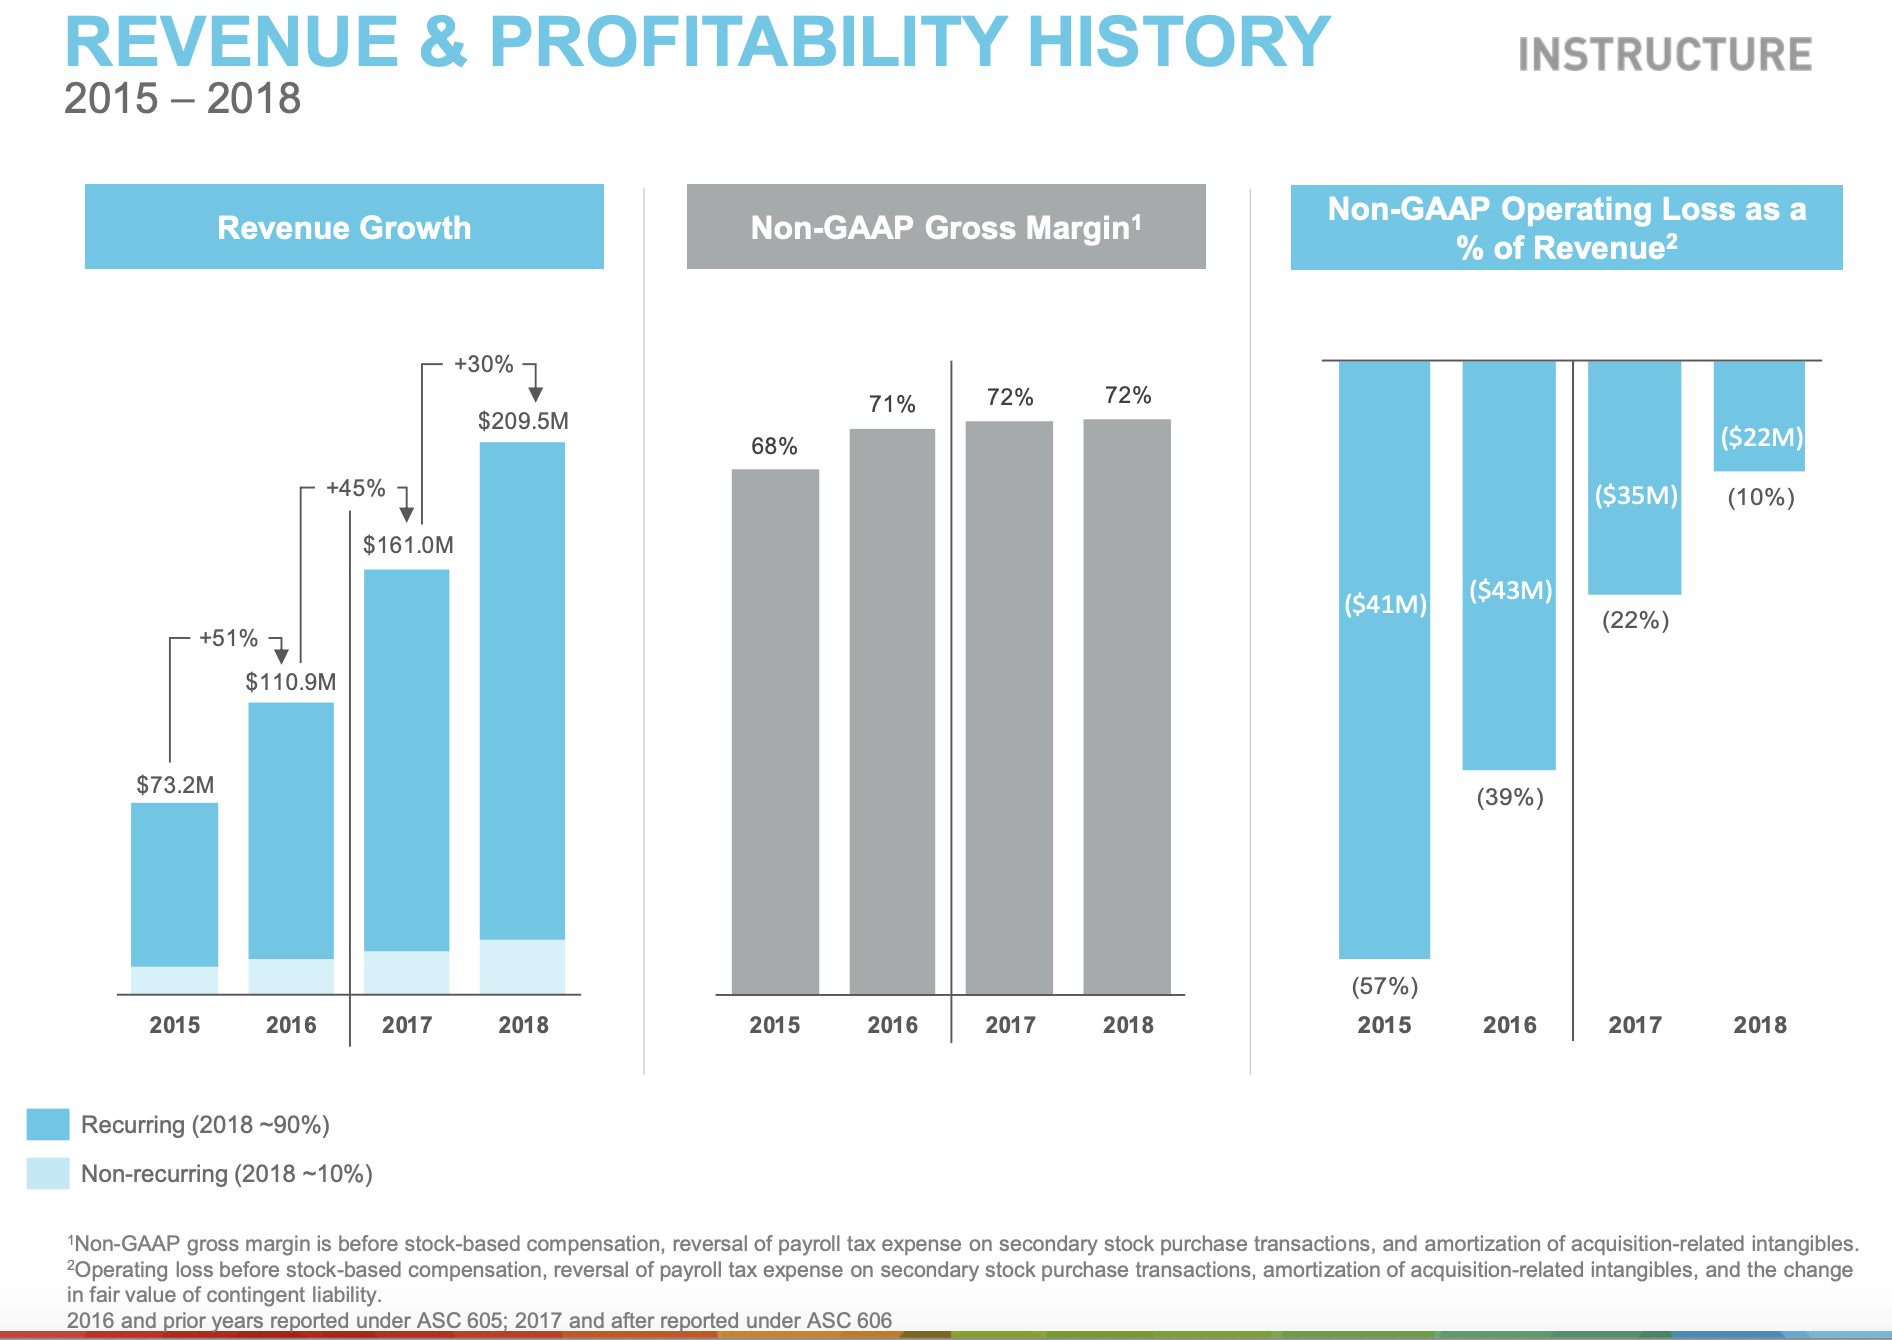
    With the improving operations, Instructure has reduced their operating losses from 57% of revenue to 10% of revenue in the past three years.
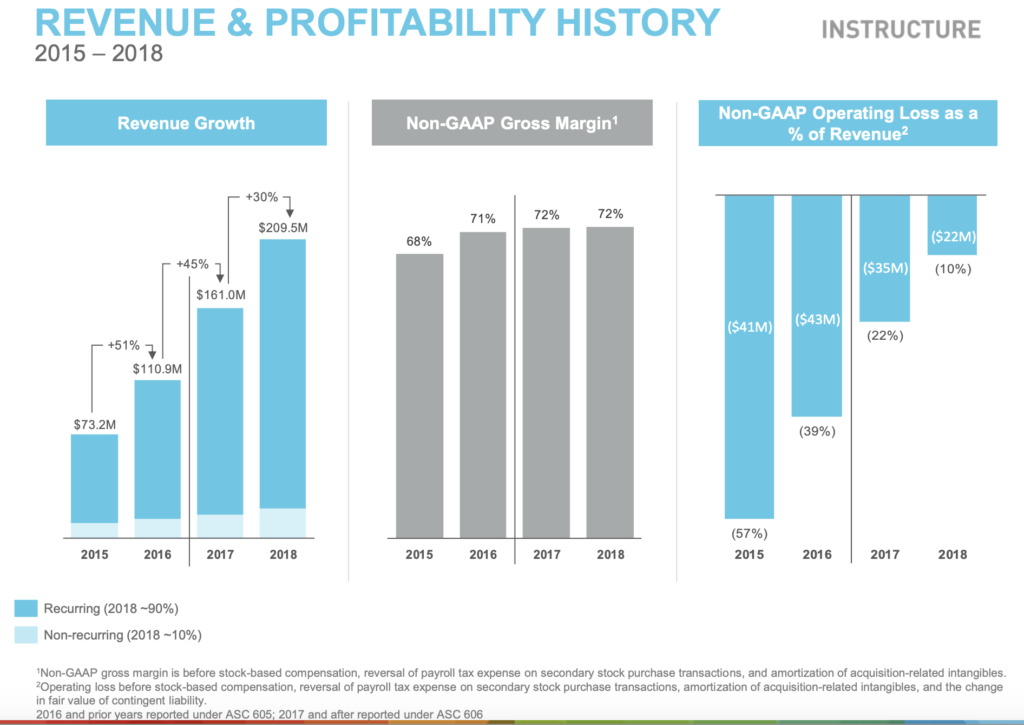
    Investor conference slide

    Moving Beyond the LMS

    On the same day as Instructure’s earnings call and release of FY2018 financial results, the company announced the acquisition of Portfolium for $43 million, a small startup focusing on “ePortfolio network, student-centered assessment, job matching capabilities, and academic and co-curricular pathways”. We interviewed Instructure staff the same day as the earnings call and noted a different message. In our initial call, the Portfolium acquisition was positioned primarily as a way to improve how Instructure can handle structured assessments in the education market – think CBE, mastery learning, with ePortfolios not as the goal but as the necessary infrastructure. During the earnings call, however, the positioning was more about bridging educational and corporate markets and expanding total addressable market (TAM).

    Today, we’ve taken a great stride towards enabling that transition with our expected acquisition of Portfolium, a successful long time Canvas partner. Portfolium vision is to help each person realize their full potential by connecting learning with opportunity, through e-portfolios, program and course level assessments, career pathways and by matching students to job opportunities. Portfolium will join Instructure with a wealth of shared customers, such as Virginia Tech, Santa Clara University and Swinburne University in Australia. This acquisition is a great match in vision and culture and represents our first major step into the Student Success market. And while Portfolium’s current offerings provide an excellent solution, more importantly, they establish the first Bridge between academia and the corporate world that aligns precisely with Instructure’s vision.

    Instructure now views itself as a company with a suite of products, and they are much more open to using corporate M&A to build this portfolio.

    Emphasis on Data & Analytics

    The second initiative announced on the earnings call was DIG, a strategic move with data and analytics.

    I am also pleased to share with you an early insight into our second growth initiative focused on analytics, data science and artificial intelligence. The code name for this initiative is DIG. And this technology platform combined with the most comprehensive SaaS database on the educational experience uniquely positions us to deliver meaningful value to our customers. And from a growth perspective, DIG has the potential to double our TAM in education.

    Instructure started ramping up their data and analytics efforts (again) about a year ago, although the focus was described at the time as being about internal analytics – that is, making Canvas a better and more valuable LMS product. From what I have heard the product validation for DIG are consistent with this message – dashboards, surfacing useful data within a workflow, etc. But that was not how DIG is being sold during the conference call [emphasis added].

    We’ve been working on the scaffolding for [DIG] for well over a year now. I mentioned in our remarks that we already have product validation towards out there in the market. We have instructors and students consuming output from some of the initial experiments with DIG. And we anticipate later this year obviously to make more announcements around specific products and offerings and how we bring them into the market. DIG ultimately is a platform first and foremost based upon machine learning and artificial intelligence. I believe that any multi tenant SaaS company born in the cloud has the opportunity once they hit a certain market share. And in fact, it may even be incumbent upon those organizations to partner with the industry and evolve that industry with new insights and predictive modeling using AI and ML. That’s what DIG is at its heart.

    This is brand new behavior for Instructure as a company. Previously the company was reticent to talk much about non-released products, but now they are talking not just about a new initiative, they are touting buzzwordy machine learning and artificial intelligence and predictive modeling well before any of those capabilities exist or are in customer hands. Goldsmith further clarified the DIG plans during the investor conference discussion [starting at 9:00, emphasis added].

    We already have analytical capabilities in our Canvas platform. I want to be really clear and delineate the difference between an analytics and reporting capability, and a machine learning and AI platform. [snip]

    We have the most comprehensive database on the educational experience in the globe. So given that information that we have, no one else has those data assets at their fingertips to be able to develop those algorithms and predictive models.

    Goldsmith then described an example of predicting a student’s expected performance in a class and how that prediction reliability goes up over time. Then we get the vision.

    What’s even more interesting and compelling is that we can take that information, correlate it across all sorts of universities, curricula, etc, and we can start making recommendations and suggestions to the student or instructor in how they can be more successful. Watch this video, read this passage, do problems 17-34 in this textbook, spend an extra two hours on this or that. When we drive student success, we impact things like retention, we impact the productivity of the teachers, and it’s a huge opportunity. That’s just one small example.

    Our DIG initiative, it is first and foremost a platform for ML and AI, and we will deliver and monetize it by offering different functional domains of predictive algorithms and insights. Maybe things like student success, retention, coaching and advising, career pathing, as well as a number of the other metrics that will help improve the value of an institution or connectivity across institutions. [snip]

    We’ve gone through enough cycles thus far to have demonstrable results around improving outcomes with students and improving student success. [snip] I hope to have something at least in beta by the end of this year.

    Wow. Robot tutor in the sky – meet the new kid on the block.

    The most generous interpretation I have is that they are being sloppy in their terminology and casually throwing out machine learning and AI to eager investors, while the reality could be more mundane but useful sharing of useful data to help instructors or administrators.

    If I had to guess, however, I would suggest that Instructure has its sights set on additional corporate acquisitions over the next year or two to try and back up these expectations. I hope they realize they are not the first company to believe that AI on top of their best-in-world data will deliver success for all.

    The message is also clear that Portfolium and DIG are intended to increase TAM. This means separate product categories with separate pricing in addition to Canvas. Either that or offering Canvas at different pricing levels to include add-on product bundles.

    Challenges in Completing Products

    We noted the modernization efforts behind Quizzes.Next, the next generation quizzing and test engine for Canvas, as well as the big schedule miss. In short, Quizzes.Next was announced at InstructureCon 2016 as being available within a few months. 12 months later at InstructureCon 2017 it entered limited beta, and at InstructureCon 2018 it entered general availability. But the story is not over. Quizzes.Next is still not at feature parity with the original quiz engine, as noted by Indiana University.

    Instructure has released a new quizzing tool for Canvas called Quizzes.Next. Quizzes.Next offers several new features and question types, but is missing many features from the current Quizzes tool on which many instructors depend. Both tools will continue to be available until Quizzes.Next has achieved feature parity with Canvas Quizzes. The original Canvas Quizzes tool will eventually be retired, but Instructure has not yet announced the timeline.

    If you read the Canvas Community page comparing features, it is clear that feature parity is not imminent. The transparency is impressive, however, and from what we are hearing customers are still giving Instructure some leeway because of trust. But Quizzes.Next and its delivery is a continuing problem, not least of which is the reduction in R&D spending growth for Canvas, described by CFO Steve Kaminsky on the call.

    Regarding the R&D investment, we don’t really break that out. But what we can tell you qualitatively is while we are doing some incremental investments on the Canvas side and DIG is a good example of that, the lion share of the growth in R&D is going into Bridge.

    What to Expect

    Instructure is at a crossroads. While they continue to grow, especially in education markets, and while they report improving financial performance, Instructure is entering uncharted territory (for them) in this second chapter. It is remarkable that they have not lost a major educational LMS customer in the 8+ years since Canvas was first selected by the Utah Education Network, but there are some warning signs that should not be ignored and some risky expectations being set.

  • Flawed AEI Report on Online Education: The good, the bad, and the ugly

    Flawed AEI Report on Online Education: The good, the bad, and the ugly

    To paraphrase the intro paragraph from January’s post on the George Mason University report, another year month and another deeply flawed report about online education in US higher education, this time by Di Xu (assistant professor of educational policy and social context at the University of California
    Irvine and a visiting fellow at AEI) and Ying Xu (Ph.D. candidate at the School of Education at the University of California Irvine). The report is titled “The promises and limits of online higher education: Understanding how distance education affects access, cost, and quality”.

    AEI Report Cover

    While the supply and demand for online higher education is rapidly expanding, questions remain regarding its potential impact on increasing access, reducing costs, and improving student outcomes. Does online education enhance access to higher education among students who would not otherwise enroll in college? Can online courses create savings for students by reducing funding constraints on postsecondary institutions? Will technological innovations improve the quality of online education?

    This report finds that, to varying degrees, online education can benefit some student populations. However, important caveats and trade-offs remain.

    In many ways this report takes a similar approach to the GMU report and a prior one by Caroline Hoxby from Stanford University, which was subsequently withdrawn, in asking important questions but providing flawed analysis to support conclusions. The problems with the American Enterprise Institute (AEI) report lie in its description of the history of online education and the 50 percent rule, the usage of data to describe the “supply side” of online, and some misinterpretations of IPEDS data. The flaws are hard to overlook, which is a shame, in that much of the qualitative discussion on online education provides a nuanced set of answers to the questions posed above.

    The Good

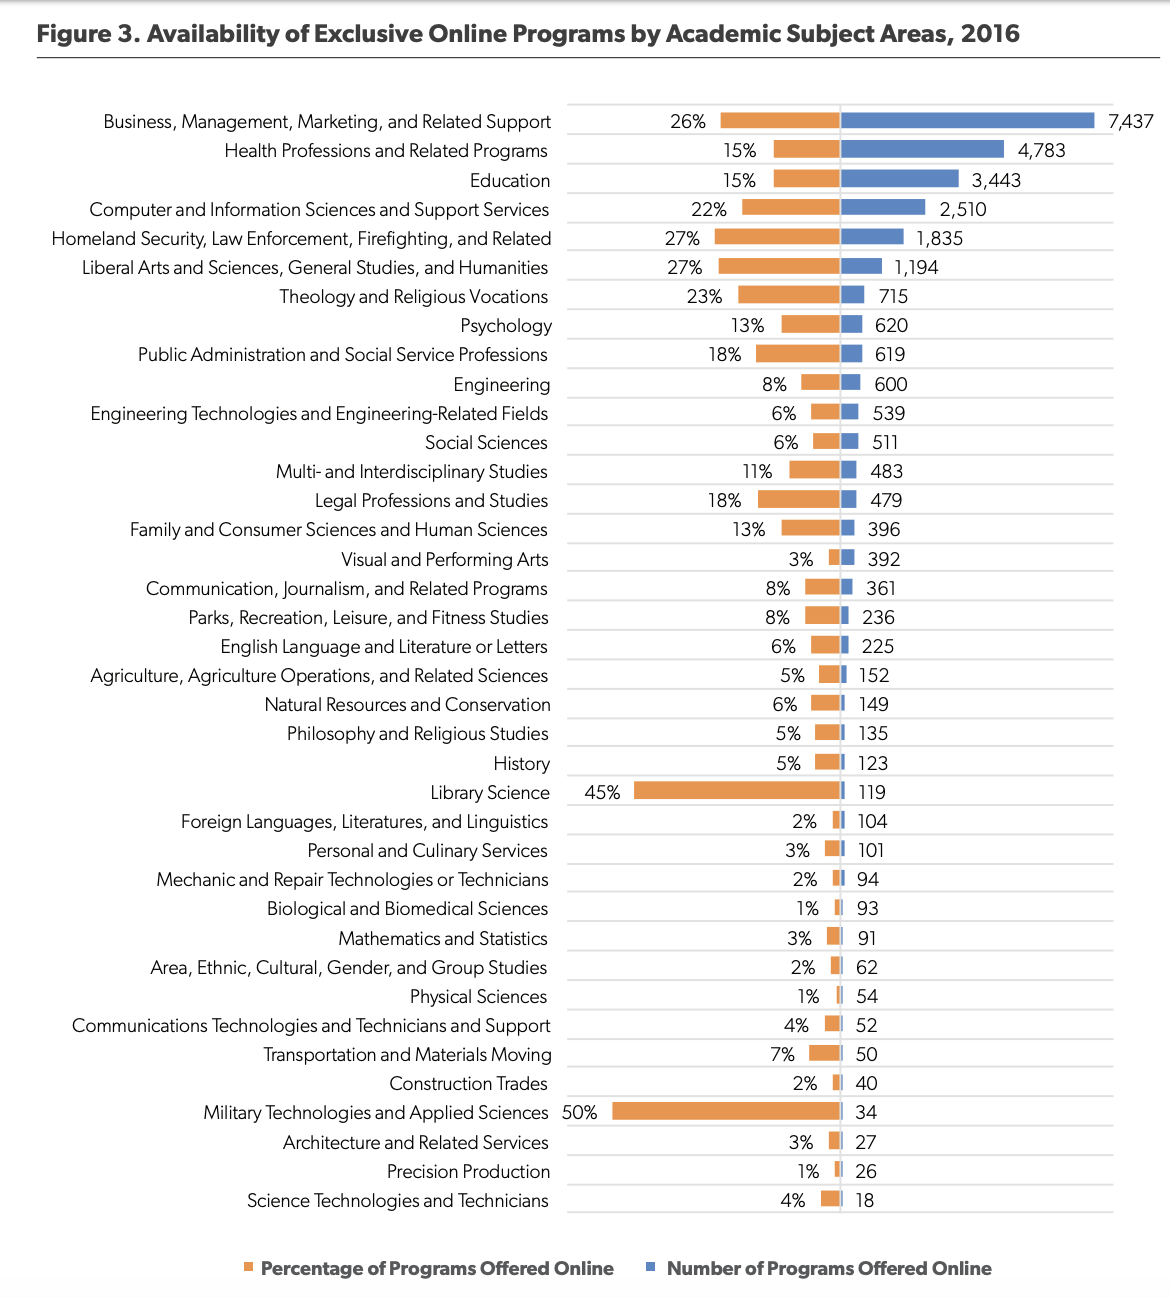
    The AEI report takes a look at a little-used portion of the IPEDS data set – The Completions survey and its program-level data on whether an institution offers certain programs at all and whether they are offered as a fully online (distance education) offering. This data has its flaws, which we’ll get to below, but it was quite interesting to get a summary view at the program level.

    program-level AEI summary of IPEDS data for online

    After a relatively solid discussion of research findings on Online Education and Student Outcomes, which summarizes positive and negative results along with the context and limitations of the relevant research, the report presents its discussion of known strategies to improve online education. This is a welcome relief, as many studies view online as a conclusion to be made about online vs. face-to-face, while this one summarizes known methods to continue improvements of a necessary modality.

    Based on the growing knowledge regarding the specific challenges of online learning and possible course design features that could better support students, several potential strategies have emerged to promote student learning in semester-long online courses. The teaching and learning literature has a much longer list of recommended instructional practices. However, research on improving online learning focuses on practices that are particularly relevant in virtual learning environments. These include strategic course offering, student counseling, interpersonal interaction, warning and monitoring, and the professional development of faculty.

    The Bad

    The introduction relies heavily on the “50 percent rule” and 1998 and 2006 changes to this rule as key points in the expansion of online education. This regulation did have an effect, but so did a number of other factors not mentioned in the report. To make matters worse, the wording of the rule conflates students and institutions. For example, in an email conversation with Russ Poulin from WCET, he noted how the following is inaccurate:

    Sim­ilarly, the HEA also denied access to certain types of federal financial aid and loans for students who took more than half their courses through distance courses.

    yet this statement is accurate:

    …the rule dictated that institutions that offered more than 50 percent of their courses through distance edu­cation or enrolled more than half of their students in distance education courses would not be eligible for federal student aid programs.

    The regulation applied to institutions and in no way measured this usage at the student level. I find that this article from New America does a much better job describing this regulation’s history and impact.

    Update 3/8: Poulin also noted (see comment below):

    After talking to you Phil, the oddity of the 50% discussion being front and center hit me even more. The lifting of the 50% rule had an impact on only a small number of institutions. Several for-profits and a small number of non-profit and public universities. The vast growth in distance learning has primarily been in institutions that get nowhere near the 50% mark, so the change in that rule was not a direct influence in their decision to enter the distance education market. To place it front and center seemed odd to me and not a real reflection of the motivations for most college leaders.

    The report also confuses institutional vs. student level data in looking at per-state online statistics.

    Finally, considering that state-level policies may shape online learning in unique ways, Figure 13 shows online enrollment by state in the 2016–17 school year. Unsurprisingly, the most populated states, such as California, Florida, and Texas, also had the largest number of online course takers. Once accounting for between-state differences in overall higher education enrollment, four states have the largest share of students who enrolled in at least one online course in 2016: Arizona (61 percent), Idaho (52 percent), New Hampshire (58 percent), and West Virginia
    57 percent).

    This might be nitpicking, but the IPEDS data referenced is for institutions located in each state, not students located in each state. But a report trying to make sense of a complex subject should get this information correct and not add to the confusion.

    The Ugly

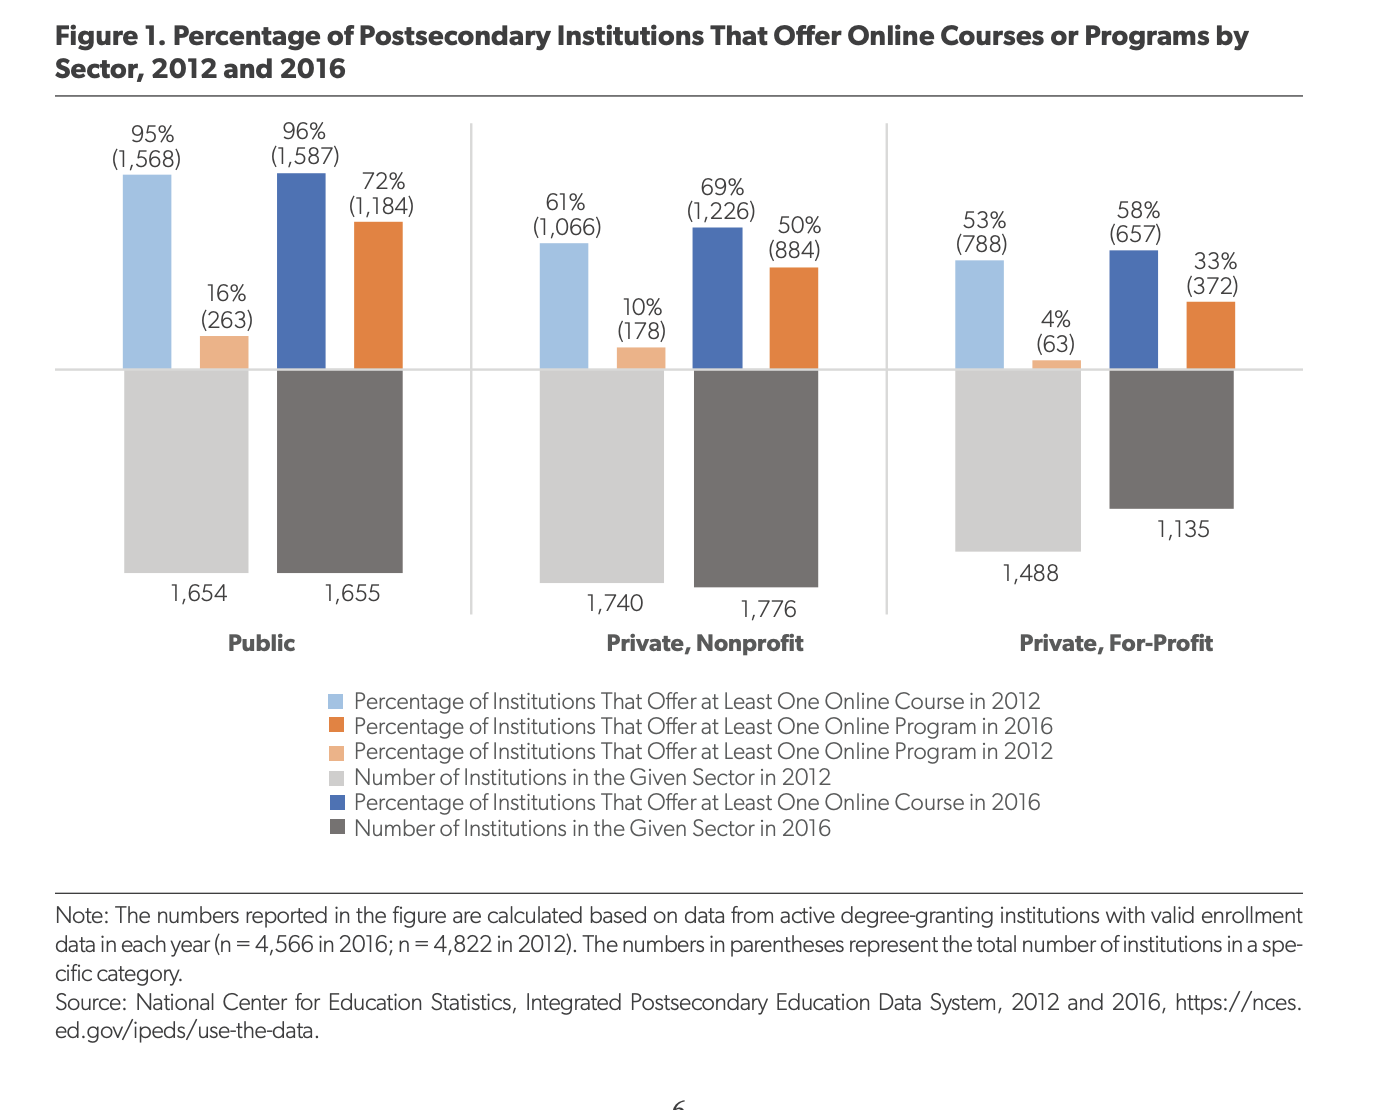
    The worst aspects of the report can be seen in figure 1 and an attempt to summarize changes in the supply side of online education. The authors chose to define the supply side as number of institutions offering at least one online course or one online program, using the aforementioned Completions / program-level data.

    AEI analysis of IPEDS dataI’ll wait while you take the necessary 5 minutes to decipher the worst color-legend usage in a chart that I’ve seen in years . . . Not yet? . . .

    When I shared this image on Twitter, Kevin Carey pointed out some results that seems non-sensical.

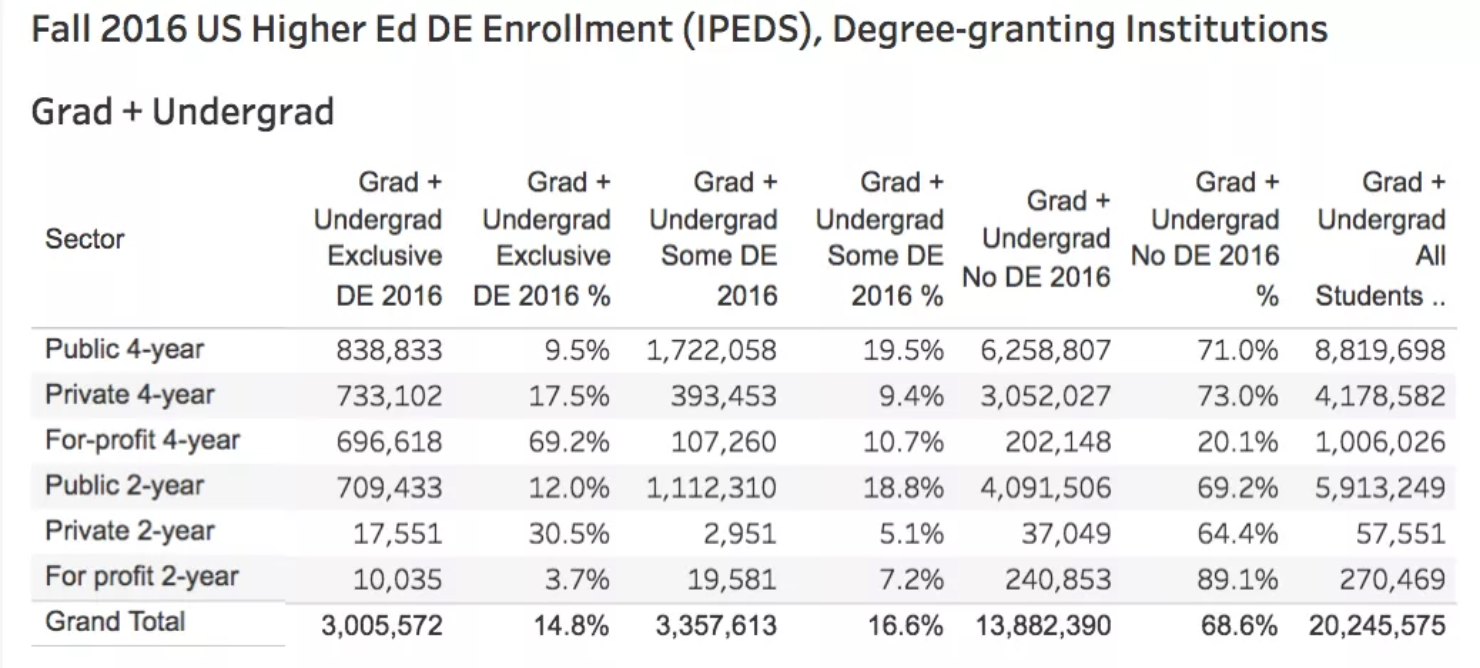
    The GMU report and the Stanford / Hoxby report made the more common mistake of essentially conflating online education with the for-profit sector, but this data makes little sense on the surface – implying that the for-profit sector offers relatively few online programs compared to public and private institutions. Looking at our 2016 IPEDS profile, you can see that 4-year for-profits by far have the greatest percentage of students in fully online programs (69%). How does AEI measure for-profits as much lower in offering fully-online programs?

    IPEDS 2016 data

    It took a while to figure out, but I think the authors made two mistakes. One is that they combined all for-profits together (2-year and 4-year), which is confusing since 2-year for-profits have the lowest usage of online education and a bunch of really small schools. This combination cuts the for-profit numbers dramatically. Look at the 2012 summary data below, where I show data for each sector and then combining 2-year and 4-year sectors together for public, private, and for-profit.

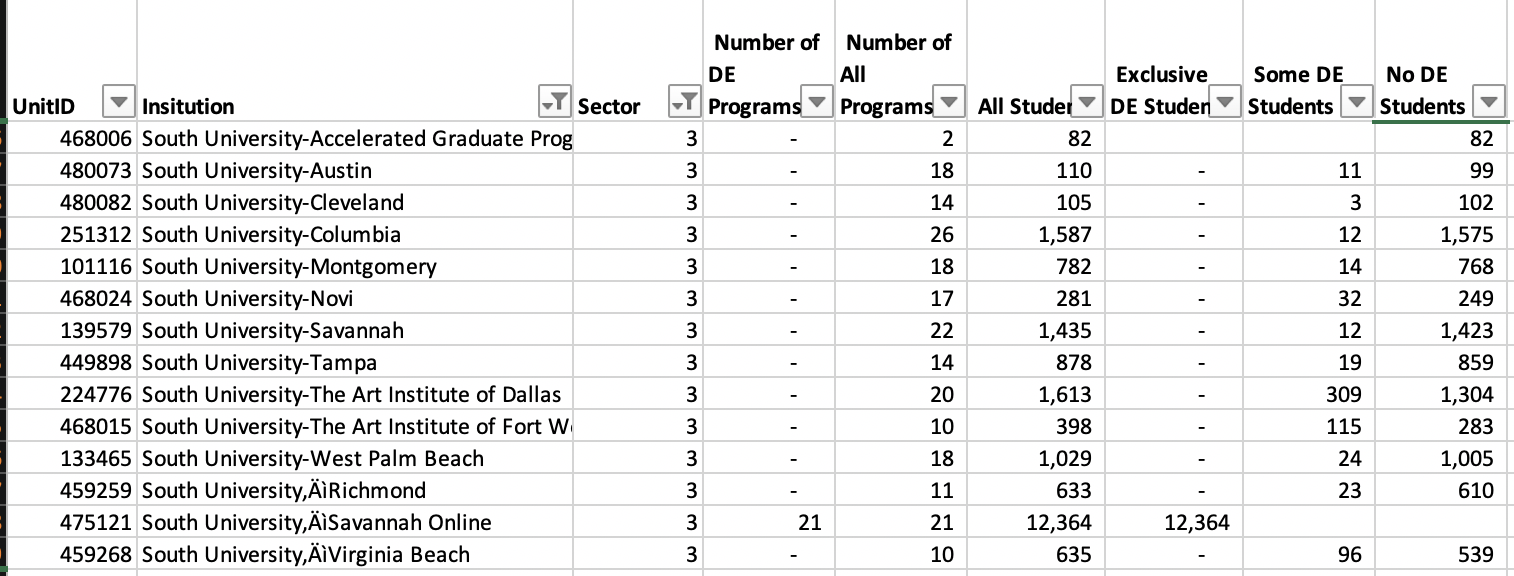
    The second issue is that simply measuring for-profits by institution using Completions program-level data is an unreliable approach to understanding online education supply, particularly for the for-profit sectors. Most for-profit systems own a number of smaller campuses, each with their own IPEDS code, yet the online programs are offered centrally by the system. And the Completions survey DE data has major holes in it. Consider South University (part of EDMC as of the 2012 data shown below):

    All 21 online programs are offered through the online campus, with over 12,364 taking exclusively DE courses and 8,898 taking no DE courses. Using the AEI methodology, 13 of the 14 institutions have no online courses or programs – almost no supply of online education in their language.

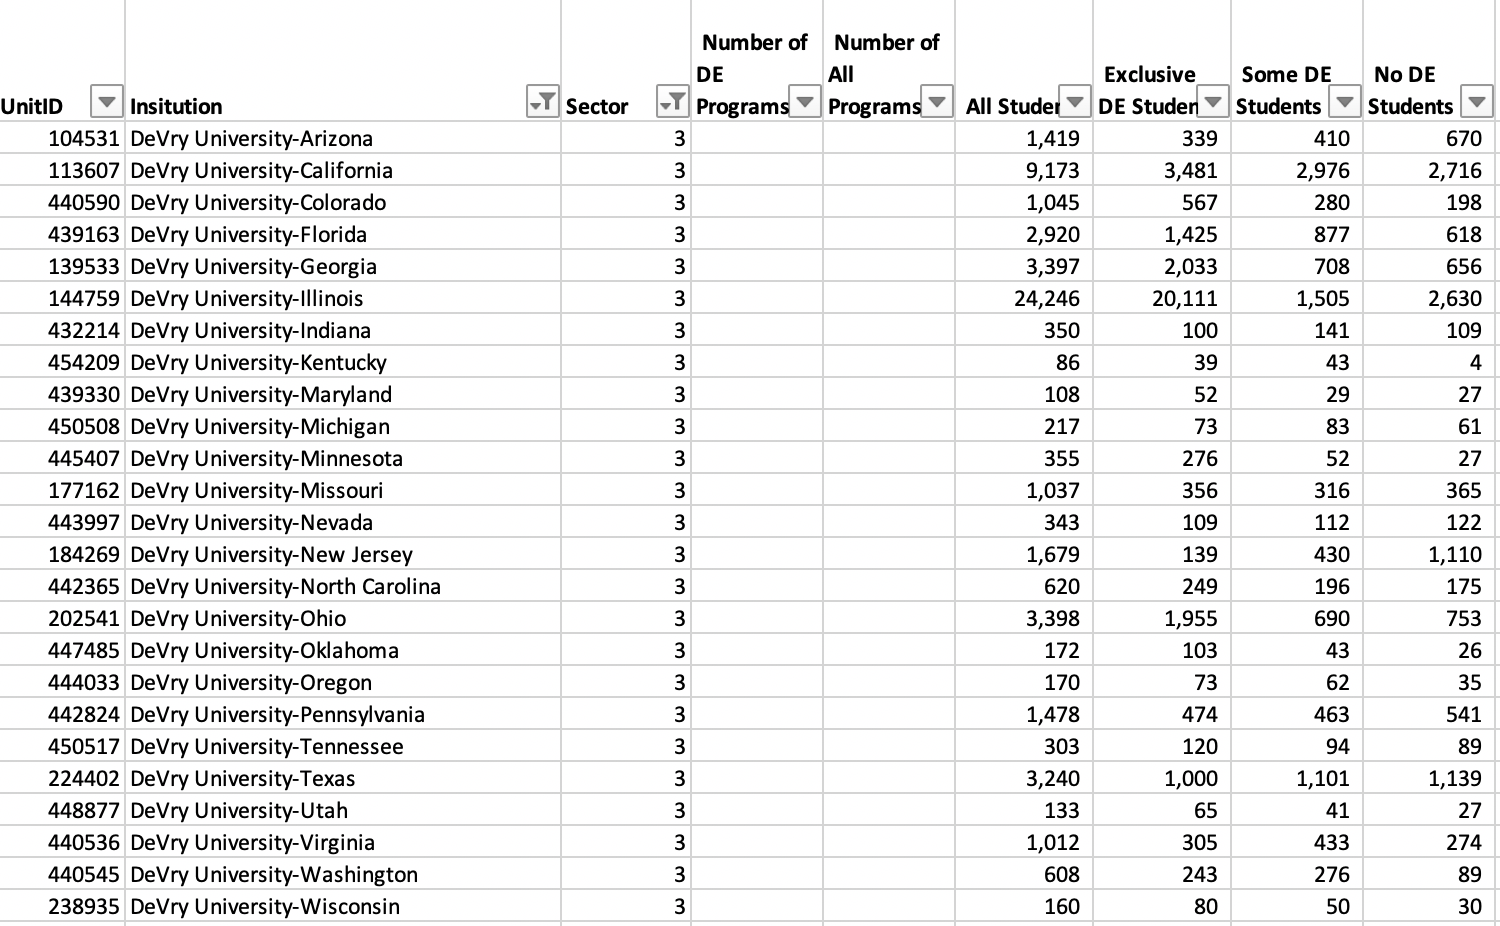
    Also consider DeVry University, which does not list a centralized online campus yet has significant online presence. For whatever reason, they report the student enrollment data per campus, but they did not fill out the Completions program-level data at all. Zero supply of online education in AEI’s approach.

    My therapists jumped in at this point and convinced me to not fully duplicate the AEI findings (serenity now!!!). What’s important here is that the basis of AEI’s description of online education supply, using institutional metrics that are dubious and ignore how the for-profit sector works, is flawed and misleading. Technically they used data in IPEDS, but they misunderstood its usage and limitations.

    Yes, there are valuable parts of this report. But like the GMU and Stanford reports, the flaws in analysis make it very difficult to separate the good from the bad and the ugly. This type of report from well-funded organizations aimed at policy-makers should inform, not confuse, but yet again we are faced with some serious flaws. We need better.

  • Moodle Workplace: A new product and change in open source deployment

    Moodle Workplace: A new product and change in open source deployment

    Moodle unveiled its new product, Moodle Workplace, at the the Learning Technologies conference in London three weeks ago. While the open source Moodle LMS has been used by companies and organizations for employee training for years (approximately 40% of Moodle implementations worldwide according to this 2015 interview), Workplace represents a new approach for Moodle’s usage of open source deployment.

    Moodle Workplace

    Based on an email interview with Moodle Pty Ltd (aka Moodle HQ) CEO and founder Martin Dougiamas, Moodle Workplace is a “a series of well-written plugins that sit cleanly on top of the standard core distribution” and is being released under an open source GPL license. The plugins add functionality to:

    • Create training paths;
    • Create departmental structures and reporting;
    • Automate enrollment, certificates and other back end processes; and
    • Customize reporting and report delivery.

    From first reading, the Workplace functionality is a subset of the features available in other products, notably Totara Learning. That solution is also based on Moodle core, although Totara forked its code base more than three years ago. ((At the time of the fork, Totara management also predicted Moodle was planning to offer the market ‘Moodle for Workplace’.)) Workplace appears to be a solid, if somewhat unremarkable platform for organizational training delivery which can provide compliance tracking, learning pathways, and other business-focused features. For organizations looking to add training features to existing stock Moodle, Workplace should offer an easier migration path than Totara.

    The bigger news is the change in the distribution and business model as described by Dougiamas.

    We are restricting distribution to Moodle Partners for now so that we can give more value back to our Moodle Partners who invested time and money into it.

    Similar to Totara’s business model, there are limitations put on the Moodle Partners to prevent modification or distribution of the code. By providing Workplace only as a SaaS solution, Moodle is using the same distribution loophole in the GPL. ((For those unfamiliar with the peculiarities of open source licensing, Moodle and Workplace are released under the General Public License (GPL). The GPL requirement to release the source code ONLY applies if you are providing someone a copy of the binary. Providing software as a service does not constitute “distribution” under the GPL. This is how Google, Amazon, Facebook and all the other major internet players can build on open source, but not release their source code.)) The upshot is that if a company or organization wants to use Moodle Workplace, they have to work through a Moodle Partner and cannot download and install the software for free.

    The business model around Moodle Workplace is clearly a departure from the norm for Moodle, where the core GPL code is available to anyone, anytime, for free. But it is not clear whether this change in model for Workplace is a limited play or has broader applications that may impact education markets. In our interview, Dougiamas directly addressed our question on whether we should expect similar changes to Moodle core:

    No, we remain intensely committed to developing and improving Moodle core as a GPL product with the same license, open source practices and active community as now.

    He further stated:

    Our team developing Workplace have been contributing features (the more general ones) into core at the same time, and the plan is that any Workplace features that also supports sectors like Higher Ed or schools will always be migrated into core this way.

    So, what are educational institutions to make of the new business model around Moodle Workplace? We’re not entirely sure at this point. At a minimum, it would appear to be an attempt to better monetize the large installed base – a move to satisfy investors and to replace the Blackboard revenue after cancellation of their Moodle Partner agreement. At a more strategic level, it could be an attempt to stay competitive with peers, particularly SumTotal and Totara, who are going after the corporate learning space.

    If Workplace is successful, it will create a new revenue stream for Moodle HQ, potentially accelerating the development of the core educational product. A Moodle Partner we interviewed for this piece claimed they were already seeing increased lead generation from the announcement. The small and medium business (SMB) market is larger and generally has faster sales cycles than the education market, which could drive partner revenue and cash flows. The partners who are able to create sales momentum in both spaces and find their product / market niche are likely to see some accelerated growth. If this is successful, Moodle HQ should capture additional revenue and accelerate the product and service roadmap. This move directly addresses the issue Michael raised in the Fall about the termination of the Blackboard contract and revenue stream.

    For Moodle, everything rides on their ability to grow alternative sources of revenue. The company has been touting newer offerings such as MoodleCloud, MoodleNet, LearnMoodle, and MoodleServices. Since we don’t have any external evidence that these are material sources of revenue for the company, and since the company itself has not shared numbers that we can independently evaluate, it’s very hard to tell what their chances are. Moodle has a huge installed base, which gives the project a lot of momentum. But the company that drives most of the core platform development has a business model that has not aged well and is in the process of diversifying into business models that are as yet unproven. I remember enough physics to know that momentum and acceleration are not the same thing. I think the risks are probably greater for Moodle Pty. than they are for Blackboard. But both sides of the equation bear watching.

    Moodle Workplace as a monetization strategy seems to be a stronger bet than the previous offerings.

    The risk for education institutions, however, is that the Workplace development roadmap pulls resources from making investments in core Moodle necessary to keep pace with better-funded rivals. At worst case, Workplace fails to find a market niche and position itself in a crowded field. The opportunity cost of investing in Workplace vs other potential investments in the core education product and cloud services could end up having larger knock on effects downstream.

    What we have observed over the past 6 – 9 months is an increased customer focus by Moodle HQ, acknowledging the importance of market messaging (e.g. first-time presence at EDUCAUSE, announcing Workplace at London conference) and better understanding and satisfying business needs of revenue-generating Moodle Partners. The jury is still out on how these changes will impact financial sustainability and competitiveness of Moodle in education markets, but there is little doubt that there are changes in behavior.

    In the end, this is another example of corporate financial health issues having an outsized impact on the LMS market in 2018 – 2019. And one that bears watching, coming from the LMS provider with the world’s largest installed base.

    Update 3/6: Changed naming throughout to Moodle HQ instead of Moodle Pty to reflect more accurate and common usage. Also edited footnote about ‘Moodle for Workplace’ prediction to remove the implication of Moodle Workplace being a copy of Totara code.

  • D2L: Continuing emphasis on services and completion of move to SaaS model

    D2L: Continuing emphasis on services and completion of move to SaaS model

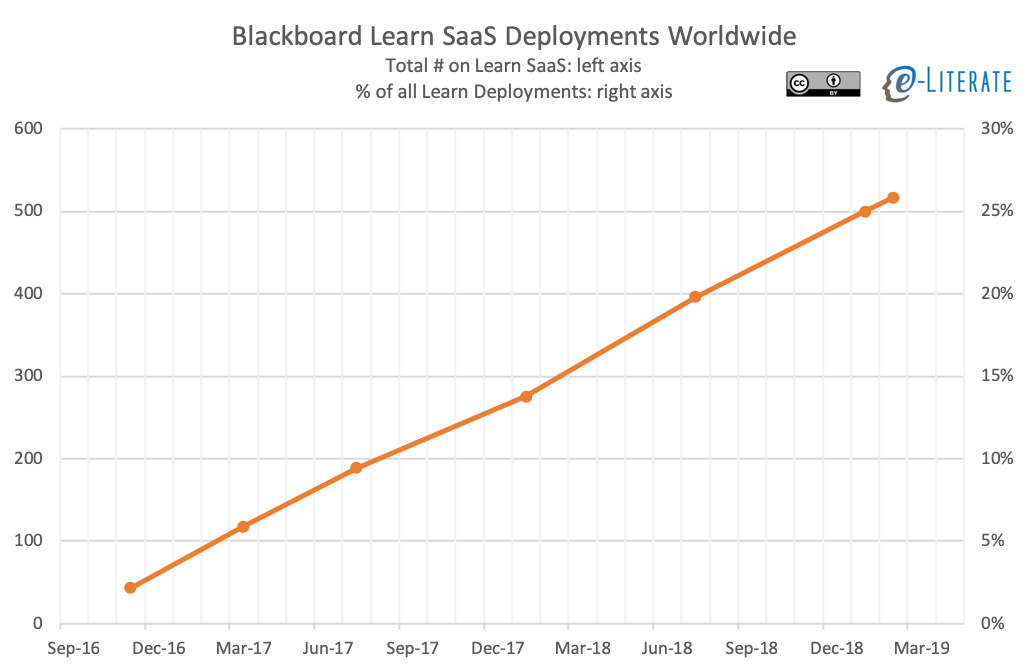
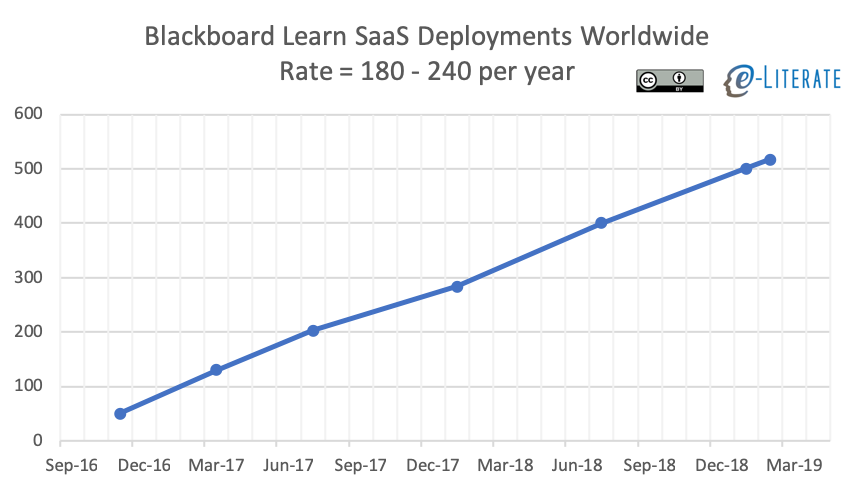
    In last week’s post on Blackboard, I shared the roughly linear progression of migration of the Learn LMS to a software-as-a-service (SaaS) model – a move that we believe is more important than is the Learn Ultra user experience. If you take into account percentages of total Learn deployments, you see that Blackboard has roughly 25% of Learn clients on SaaS after starting in late Fall 2016, increasing by approximately 10% per year. ((Each point is taken from Blackboard public release of information either directly to us at e-Literate or in press releases.))


    Blackboard Learn SaaS Deployments over time

    Blackboard is not the only LMS company migrating to the cloud, however, and D2L  ((Disclosure: D2L and Blackboard and Instructure are all subscribers to our LMS Market Analysis service.)) has taken a more aggressive bet on SaaS for their Brightspace LMS platform (also based on AWS), as described in Summer 2018.

    While we heard grumblings from multiple clients during the transition – especially through early 2017 – D2L clearly made some hard choices and and is aggressively moving to the cloud, not just as an option, but as their primary delivery model. According to David Koehn, VP of Product Management at D2L:

    • All new Brightspace implementations are on AWS cloud;
    • Virtually all current Brightspace implementations use Continuous Delivery; and
    • Approximately 50% of current customers are already on the AWS version of cloud deployment; and
    • By the end of 2018, a large majority of customers will be on cloud deployment.

    Last Fall I spent time at D2L’s Kitchener, Ontario headquarters getting an update on the company’s progress on a number of initiatives. D2L executives described that all but roughly a dozen Brightspace clients are now on SaaS deployment, and by the end of 2019 they should be fully a SaaS platform company.

    Why is percentage of total deployments important? Two reasons are that the move to 100% SaaS deployment enables the movement to a single version of code, dramatically simplifying regression testing and enabling more rapid development of new designs, while also taking advantage of modern technology stacks. As described in the Summer 2018 post:

    David Koehn also pointed out that the real driver for the AWS cloud move by D2L is to enable a redesign of the user experience [branded Daylight] and to provide improved scalability and reliability. In other words, the cloud deployment is a means to the Daylight end.

    The downside, of course, is that pure SaaS deployments largely leads to a reduction in customization capabilities. Companies like D2L and Blackboard that are moving from an enterprise model to a cloud model are betting that they can build in appropriate configuration options (rather than customized code) and leverage third-party integrations to overcome this challenge. But to get the full advantage of SaaS, a company needs to do the entire move.

    I further spent some time in London and had the opportunity to talk with D2L’s London-based leadership team that covers EMEA and Latin America regions. D2L leaders in London presented a transparent and honest appraisal of the company’s current market position in Europe and Latin America, and where they see the biggest opportunities. For starters, D2L acknowledged that Instructure’s system-wide wins for the Canvas LMS in the Nordic countries had largely blocked opportunities for expansion in that region. Other areas, however, have been much more promising. They are doing well particularly in the Benelux countries (Belgium, Netherlands and Luxembourg) with Ghent University in Belgium being an example of a recent, large (45,000 student) implementation. There have been important wins in the UK and Ireland, and activity in Spain seems to be picking up some momentum. Germany continues to be a challenging place to get a foothold partially due to university funding that favors in-house staff maintaining open source systems.

    In Latin America, D2L was open about cutting back investment in the region in 2017, particularly in Brazil, largely due to economic uncertainties and limited growth opportunities. They now see activity picking up in the region and have been investing to take advantage of the market potential.

    In both Europe and Latin America, the provision of professional services beyond the LMS platform, as well as willingness to add requested features, appears to be a differentiator for D2L, especially in comparison to Instructure. D2L has shown a much greater willingness to roll up their sleeves and collaborate on instructional design, course building, and online pedagogy using internal staff, almost in an Online Program Enablement model. It surprised me during my Fall HQ visit to see just how well-established is the content creation team that helps schools redesign courses and even design front-end web sites for online programs. We have heard similar messages from D2L customers and even from a consulting firm that works directly with Canvas and Brightspace customers.

    To a degree, none of this post is different from our Summer 2018 coverage other than updating on progress, so why has D2L not made more of a market share increase in the past year? I suspect there are three reasons. One is that D2L has done a better job updating their product line and introducing new services than they have done in fixing issues with current customers, particularly around data and analytics. During my Fall HQ meetings, when the D2L team was describing their new data and analytics approach called the Brightspace Data Platform, I pointed out that while this appears to be an improved approach, it does not acknowledge that D2L has been touting its data and analytics capabilities for years. There are leftover frustrations from customers based on previous attempts that did not match client expectations.

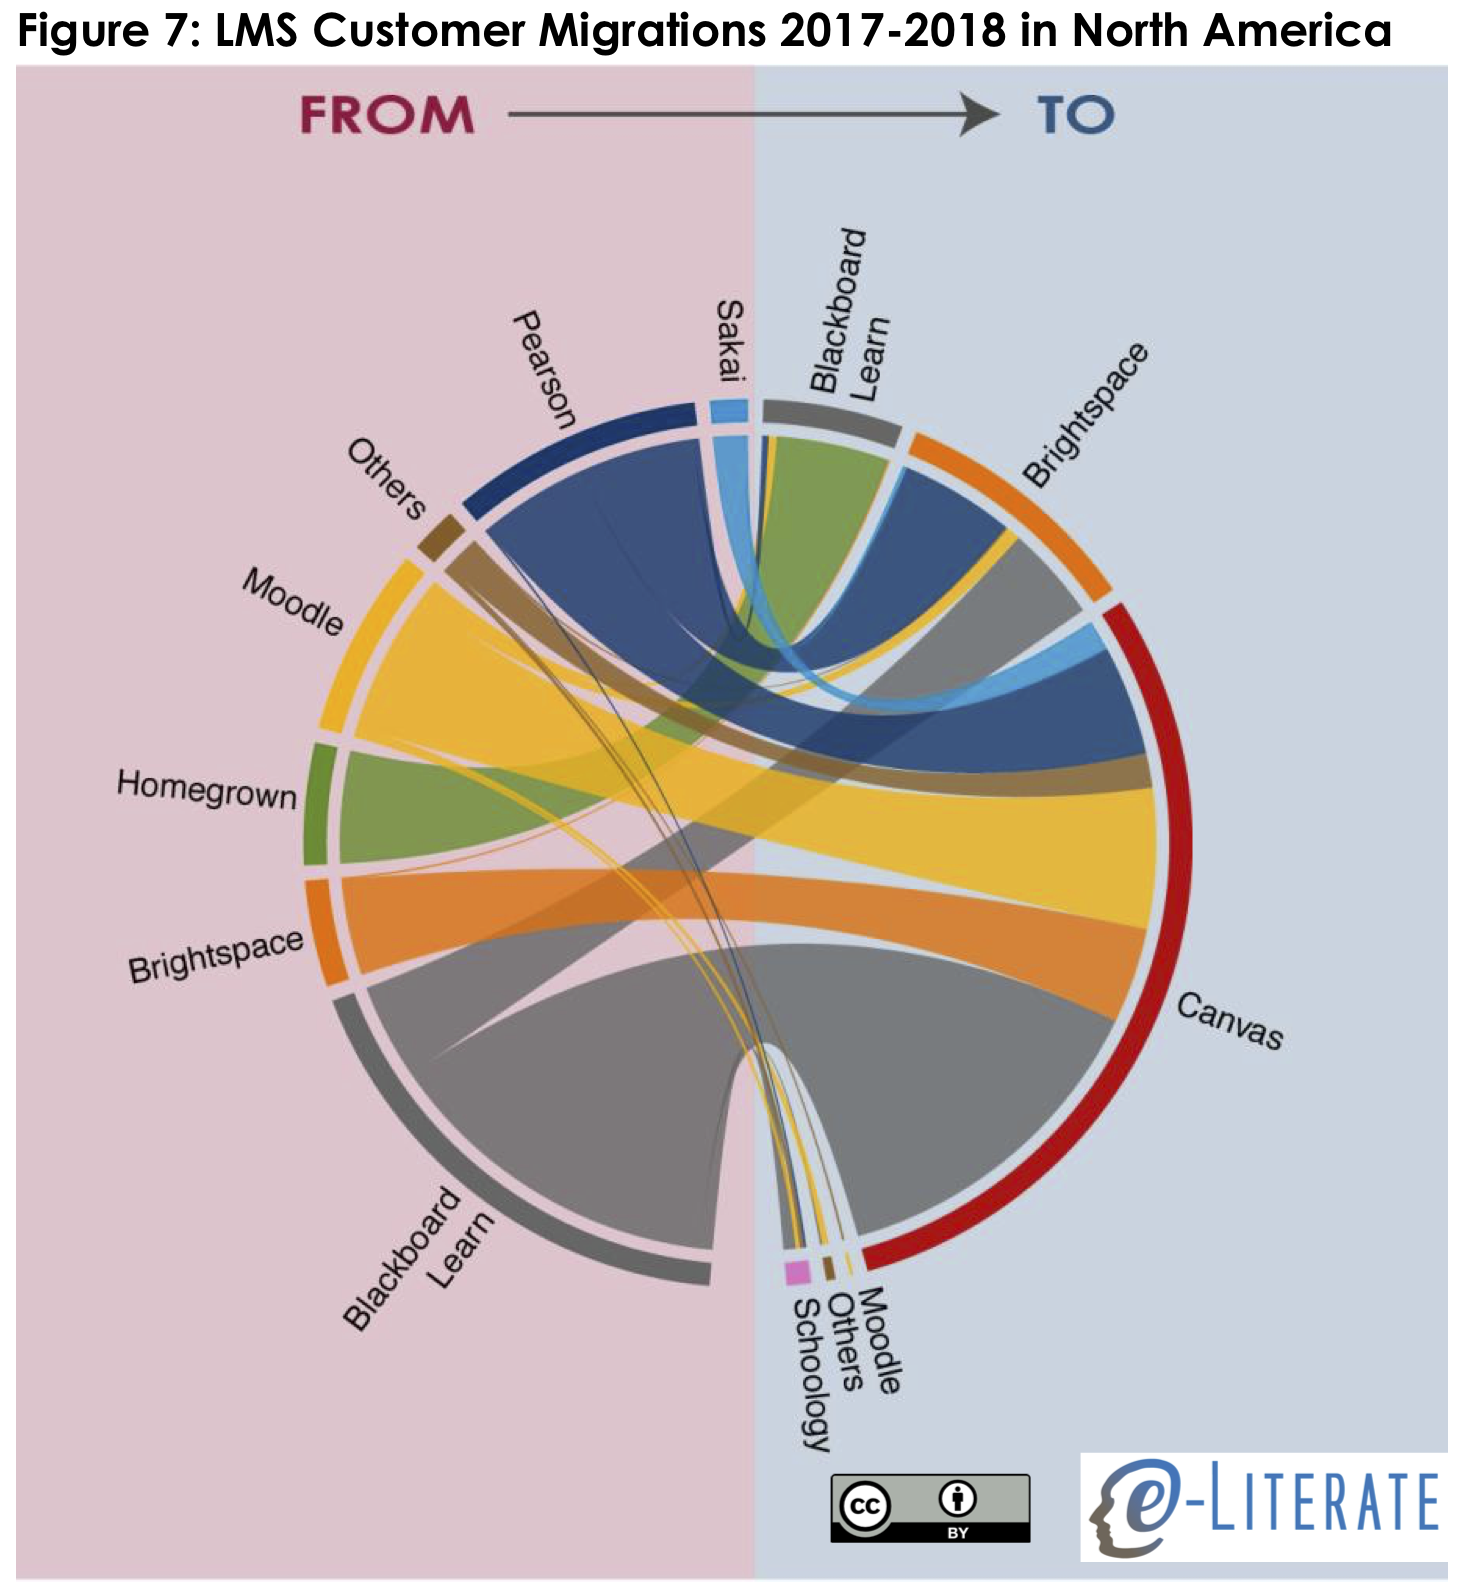
    The second reason is Instructure. While D2L is in a solid second place for new implementations worldwide (schools migrating from one LMS to another), they have also lost a number of clients in North America – almost all to the Canvas LMS. In our recent LMS Market Analysis report, we showed a transition graphic with higher ed LMS migrations from 2017 – 2018.

    LMS Migrations 2017-18 Higher Ed

    The third reason is that it is very difficult to be a third competitor in terms of customer mindshare. The academic LMS market has tended to have a narrative of a major competitor and an upstart. Blackboard and WebCT in the early and mid 2000s, Blackboard and Moodle in the late 2000s, and Blackboard and Canvas through much of the 2010s. It is difficult for a company like D2L to break through this narrative and be top of mind for institutions from day one of an evaluation.

    While D2L has challenges in market position and introduction of a new data and analytics approach, they are completing the transition to a SaaS platform company and focusing on flexibility and services.

  • OPM Readings: New policy briefing from UCT and other useful coverage

    OPM Readings: New policy briefing from UCT and other useful coverage

    Over the past eight days there have been a series of valuable articles covering Online Program Management (OPM) and the broader Online Program Enablement (OPE) markets. ((See this post to better understand the OPE concept.)) All four articles provide useful historical and academic environment context to better understand market dynamics.

    University of Cape Town Policy Briefing

    Laura Czerniewicz and Sukaina Walji from the University of Cape Town’s Centre for Innovation in Learning and Teaching (CILT) released Issues for universities using private companies for online education this week as a policy briefing for “universities who are thinking of using – or already using – private companies to develop or expand their online programmes or courses” ((I’ll stick with the South African English spelling in this section.))

    Rather than just focusing on the OPM market itself, Czerniewicz and Walji place the subject into the broader context of “marketisation, digitisation, unbundling and austerity climates.” This placement is valuable, as it frames the appropriate questions that colleges and universities should address when considering OPM or OPE vendor support.

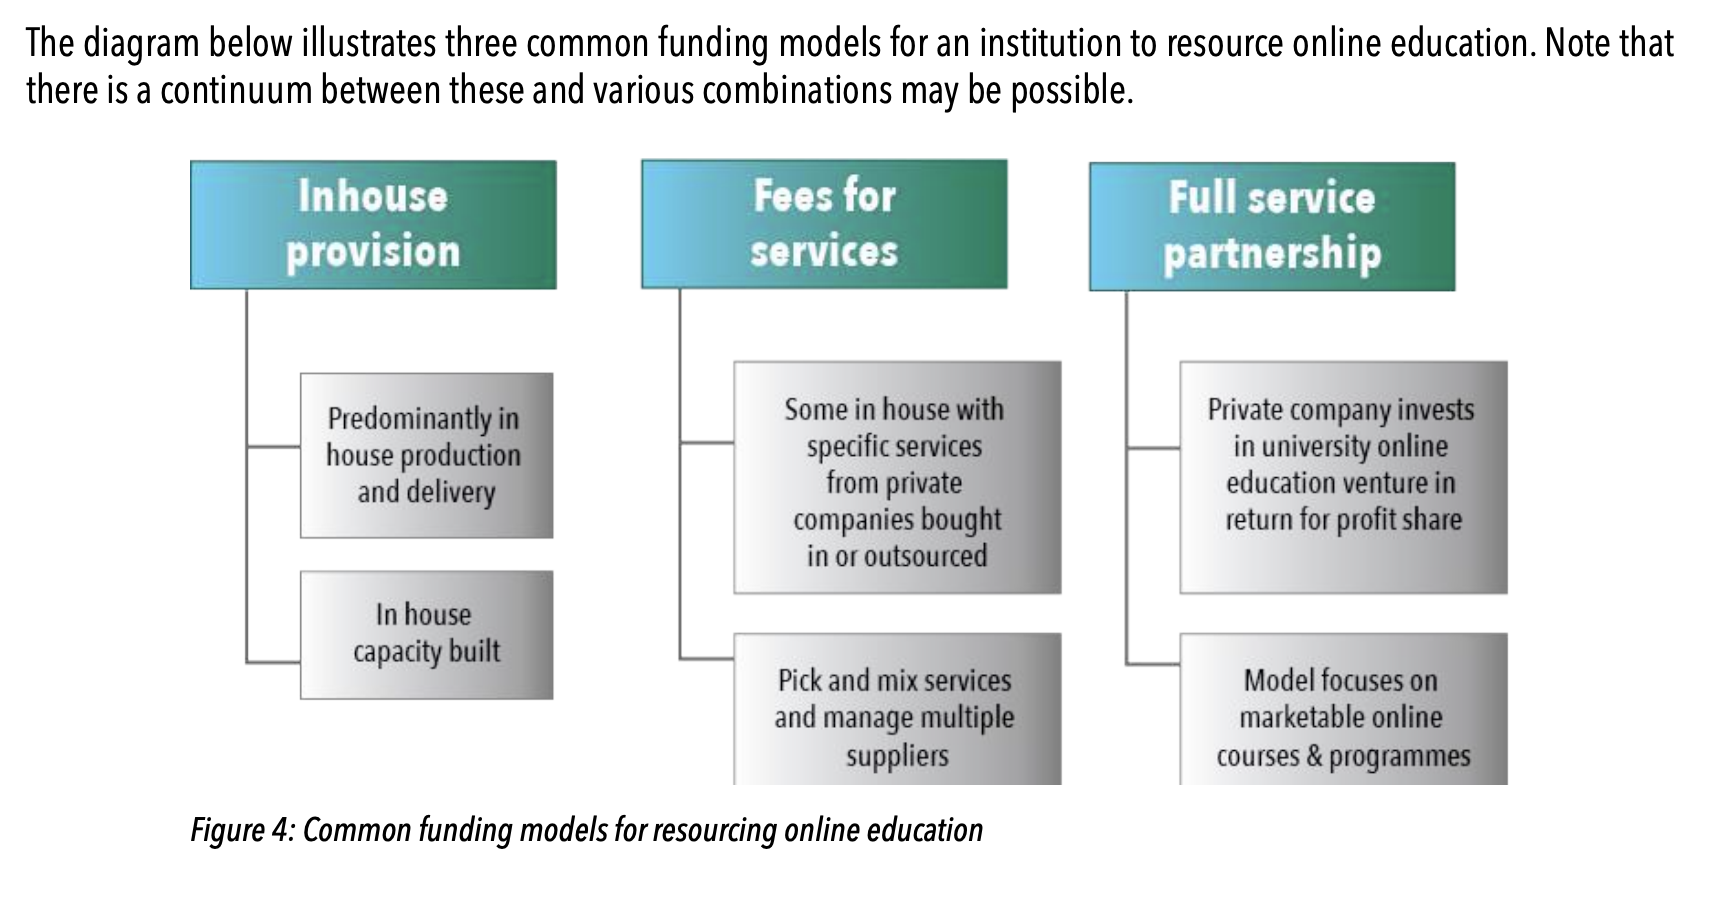
    After addressing why the OPM / OPE movement is becoming so important now – from an international perspective with some global south viewpoitns  – the briefing addresses the various funding models involved. The note in the description about these models being on a continuum with various combinations possible is crucial.

    Three common funding models - inhouse provision, fees for services, and full service partnership

    The briefing including a Strengths, Weaknesses, Opportunities, Threats (SWOT) analysis for the full-service OPM scenario and for an inhouse / fees-for-service scenario as well as use cases for different institution types. It is well-worth reading the whole report.

    EdSurge Debate on OPMs

    Last week EdSurge ran a two-article series on OPMs that missed the SNL’s Point / Counterpoint opportunity and instead tried the nuanced argument method.

    Dan, you pompous ass

    In the first post “How OPMs are the Modern Enrollment Managers”, Randy Best and Harris Pastides from Academic Partnerships described OPMs as a follow-on to the enrollment management companies that emerged in the 1970s, with OPMs partially taking credit for moving away from the for-profit sector.

    These OPMs, like enrollment management consultants decades before, assist universities in providing access to time-pressed, place-bound students for whom online education is the only choice for earning a degree. In doing so, OPMs shifted leadership in the market for online education from for-profit institutions, which dominated the landscape in the early days, to nonprofit institutions.

    After addressing four myths about OPMs, Best and Pastides position full-service revenue-sharing OPMs against the new movement of fee-for-service OPM / OPE providers.

    Given the evolution of OPMs, perhaps the time has come for a new name to describe them. They are not just managers, but partners with universities. They don’t just oversee programs, but perform operations critical to the overall success and reputation of the institution. And their efforts often result in the expansion of overall enrollment. In many ways, they should be called Enrollment Growth Partners.

    Some players in the OPM space who are not traditional comprehensive providers are trying to adopt the mantle of the future with fee-for-service or unbundled offerings. But fee-for-service simply shifts the cost and financial risk to universities. Meanwhile, by unbundling services—say by separating recruitment and retention—outside partners become solely focused on getting students in the door rather than keeping them through graduation.

    Michael wrote the second post “The ‘O’ in ‘OPM’ Could Stand for ‘Outsourcing’”, where instead of taking the simple pro / con approach to the debate, he argued for some nuance in our analysis. In particular, he took issue with the quoted description above.

    Michael’s historical context story differed from Best and Pastides, describing John Sperling’s history creating the University of Phoenix and how the current context for bundling and revenue models.

    The essential OPM characteristics of bundling and revenue sharing, both of which Pastides and Best tout as almost inherently good, contain trade-offs just like any other proposed solution to a complex problem. They balance growth opportunity against a range of risks, including risk that the up-front costs of launching the program would not be repaid, or that the universities could not execute well on essential aspects of the project (like student recruitment), or that they would let down the students by failing to maintain good quality of technology platform support or service at scale.

    There’s nothing inherently bad about managing these trade-offs through a full-service, bundled revenue sharing agreement. But there’s nothing inherently superior about the approach either. For example, universities that are more worried about the risk of failing to grow fast enough than they are about minimizing the expense of using an external vendor are often well served by finding a high-quality OPM partner, while universities with different risk profiles may come to different yet equally appropriate conclusions.

    Both posts are worth reading, and it is interesting to see the same issue described here and in the UCT briefing – about colleges and universities managing trade-offs when deciding which model is appropriate when selecting private partners to help with online programs.

    Education Dive

    Education Dive is running a three-part series on the issues involved with federal rule-making debates, and the first deep dive is “As traditional colleges grow online, OPM relationships shift”, describing the broadening market while traditional schools and systems like SUNY look to develop a strategy for online education.

    The State University of New York (SUNY) is one of several public systems looking to raise its profile online. An early pioneer with its Open SUNY platform, the 64-campus system in July issued a request for information about how it could “take the next step in creating a comprehensive environment” for online learning within and beyond New York state. [snip]

    The document, which Education Dive obtained, mentions a desire to “leapfrog competition” and “challenge current leaders in the field.”

    The article explores several of the OPM-related topics as well as motivations for traditional institutions developing online strategy, based on a series of interviews that included Michael. The key theme of the article described how the OPM market is changing, and the boundaries between online and face-to-face education are blurring.

    Soliciting OPM services for ground-based and hybrid programs can help colleges present a unified face in the market when they offer both on-campus and online versions of a program. Wiley, for example, provides full-service marketing support targeting prospective students for George Mason’s online and campus-based MBAs. That includes SEO, paid search, online advertising and social media.

    “The dialogues (are) more and more moving toward broadening the services to be more than just about the fully online student (but) to be about the student at the university no matter what their modality,” [co-president of Wiley Education Services and Learning House] Hillman said.

    That could lead to an uptick in blended and hybrid experiences, [co-founder and CEO of iDesign] Riter predicts, where learners navigate instruction online and on campus.

    “Over time there’s going to be less difference between online and face-to-face education,” he said. “It’s just going to be education, and even face-to-face residential education that exists today is going to be much more technologically infused.”

    It’s good to see four separate articles all worth reading about the emerging and broadening OPM market, with useful context.

  • Blackboard Updates: Learn SaaS progress and LMS market news

    Blackboard Updates: Learn SaaS progress and LMS market news

    Blackboard had a lot of news to share two weeks ago when we spoke with CEO Bill Ballhaus and senior teaching and learning executives. The updates addressed efforts to streamline the business, customer retention, and customer acquisition. Blackboard ((Disclosure: Blackboard is a subscriber to our LMS Market Analysis service.)) was upbeat about their current position and prospects going forward, but we see a mixed picture.

    Ballhaus said that Blackboard’s efforts to simplify the business were paying off and leading to greater focus on their core teaching and learning businesses. While the company was built as an enterprise software amalgamation based on 20+ corporate acquisitions, Ballhaus described how management is looking forward to becoming a Software as a Service (SaaS) business with a simpler focus. While the executives declined to comment on current M&A activity, Blackboard appears to be trying to sell its CashNet and Transact products that are part of the same business line focused on campus ID and payment processing, for up to $800 million and $720 million respectively ((Although it is possible that both of these reports are referring to the same combined transaction – CashNet and Transact together. This explanation makes more sense to me.)). Remembering that Blackboard reportedly tried but failed to sell the entire company for ~$3 billion in 2015, there is no guarantee that they will actually sell either unit or get the desired prices. [Update 3/7: Blackboard did end up selling entire Transact business unit , including CashNet, to PE firm Reverence Capital for a reported $720m.] But if they do succeed, the profits from either sale will help the company pay down and manage its debt. And it will back up the claims of focusing the company on core teaching and learning business.

    The claim of the company looking forward to being a pure-SaaS business is largely based on their ability to migrate the flagship Learn LMS client base over to the AWS-enabled Learn SaaS offering. Blackboard leadership believes that the ongoing migrating effort has been a critical factor in improving their customer retention numbers, an argument that we made last summer.

    The third issue, which is related to the first two, is that we believe that the migration to Learn SaaS might be a better indicator – at least in the short run – than Ultra adoption of whether a school plans to stick with Blackboard. Whether or not the school enables Ultra base navigation or any courses in the Ultra Experience.

    When a school moves to Learn SaaS, they tend to sign contract extensions for 1 – 3 years to cover the new services. And the migration to Learn SaaS does not suffer from the vague terminology issues – a school either uses Learn deployed on SaaS (through AWS) or they don’t.

    Ballhaus went so far as to say that Blackboard’s improvements in client retention was the primary factor in the overall market slowdown last year. While we certainly feel that Blackboard has benefited from the slowdown and has improved client retention lately, we are not convinced on the cause and effect dynamics. By tracking the public proclamations of Learn SaaS adoptions, we see an interesting linear trend leading to the current ~25% of Learn clients being on SaaS.

    Learn SaaS Adoptions Over Time

    Blackboard continued to present the importance of their broad product portfolio combined with their experience. Ballhaus stressed that the LMS is necessary but not sufficient as a strategy for the company. Blackboard management sees Blackboard at an inflection point in 2019 in a good way, and they stressed that their big focus will now be on data and analytics offerings. Remember this paragraph when we get to the Instructure update post.

    Early in February Blackboard announced what could be their biggest LMS win since we broke the news of University of Phoenix selecting Blackboard Learn Ultra in late 2015 (a migration that is scheduled to be complete by this summer). From the press release about Galileo Global and their 100,000+ student system:

    Blackboard today announced that Galileo Global Education, a leading international provider of higher education and Europe’s largest higher education group, will roll out Blackboard Learn with the Ultra experience as the common Learning Management System (LMS) for its network of 37 schools with 80 campuses across 10 countries. Blackboard Learn Ultra was selected over other cloud-based solutions for the ease of use, the powerful features, and the unparalleled level of support provided by Blackboard.

    On the surface, this is a big win for Blackboard, but the story comes with a caveat regarding its relevance to the LMS market. What was not shared during our call with Blackboard executives is that they share their private equity owner (Providence) with Galileo as described in late 2017.

    Laureate Education, Inc. (NASDAQ:LAUR), the world’s largest global network of higher education institutions, and Galileo Global Education, a company under the umbrella of Providence Equity, a leading global asset management firm, have signed an agreement for the sale of Laureate’s institutions in Italy and Cyprus for a total transaction value of Euro 225 million (USD 263 million at the current exchange rate).

    Two or three schools within Galileo were already on Blackboard Learn, a few on Moodle, and the majority on Homegrown or not really using an LMS previously. Unless we can get independent confirmation about the nature of the selection (was it truly competitive or was it earmarked for Blackboard as long as they met minimum requirements), I would not extrapolate this news to show broader movements in the market.

    Blackboard also presented some data around roughly 200 new LMS customer acquisitions in 2018 (“new logos”) for both Open LMS (the rebranded Moodlerooms) and Learn.

    • The majority of the reported wins, roughly 120 based on interview, are for Open LMS, showing continued growth for this under-the-radar Blackboard product. These numbers are impressive, but we note that last year the company reported 223 Moodlerooms “new logos” in 2017. It will be interesting to track over time if this deceleration is primarily driven by the general market slowdown vs. fallout from the cancelled Moodle Partner agreement.
    • For the Learn LMS, Blackboard is reporting ~80 new logos in 2018, of which 52% are in higher education. If accurate, this would be a significant turnaround for the company; however, our data do not show this level of new wins for Blackboard unless you include Galileo as roughly 30 “new logos”. We asked Blackboard to back up that number with specifics such as sample listings to see if we have holes in our data, but Blackboard declined to provide further information due to “privacy reasons”. During the same time period, according to our data, Blackboard has lost more than 100 institutions, more than three fourths moving to Canvas and the remainder moving to D2L Brightspace.

    In the end, Blackboard is making steady progress with Learn SaaS deployments and contract extensions, benefiting from the LMS market slowdown, and winning their biggest new LMS account since 2015. We are not convinced that Blackboard is causing the slowdown or that their new Learn momentum goes beyond Galileo Global, but there are signs of progress worth sharing.

    Update 2/27: Fixed description of CashNet and Transact, which are part of the same business line, and added footnote.