
e-Literate

Present is Prologue

Tag: completion rate

  • e-Literate TV Preview: Essex County College and changing role of faculty

    As we get closer to the release of the new e-Literate TV series on personalized learning, Michael and I will be posting previews highlighting some of the more interesting segments from the series. When we first talked about the series with its sponsors, the Bill & Melinda Gates Foundation, they agreed to give us the editorial independence to report what we find, whether it is good, bad, or indifferent.

    In this video preview (about 4:18 in duration), we hear from two faculty members who have first-hand experience in using a personalized learning approach as well as a traditional approach to remedial math. We also hear from students on what they are learning about learning. In our case studies so far, the real faculty issue is not that software is being designed to replace faculty, but rather that successful implementation of personalized learning necessarily changes the role of faculty. One of our goals with e-Literate TV is to allow faculty, staff and students to describe direct experiences in their own words. Take a look.

    Stay tuned for the full episodes to be released on the In The Telling platform ((ITT is our partner in developing this series, providing video production as well as the platform.)). You can follow me (@PhilOnEdTech), Michael (@mfeldstein67), or e-Literate TV (@eLiterateTV) to stay up to date. You can also follow the e-Literate TV YouTube channel. We will also announce the release here on e-Literate.

  • The Four Student Archetypes Emerging in MOOCs

    The Four Student Archetypes Emerging in MOOCs

    Update (3/10): Patterns and descriptions have been updated based on feedback in a new post.

    As discussed in my last post, the focus on “completion rates” in MOOCs is somewhat misplaced, as open education is not simply an extension of traditional education. As several others have noted, not every student is attempting to complete a course, and in fact different students have different goals while participating in the same open course. This holds true for both cMOOCs and xMOOCs.

    Does this mean that we should throw out the completion rate data? No. As Katy Jordan described quite well in the comments:

    A lot of people have asked whether completion rates are the right way of framing the success of a MOOC; I agree that there is much more to the potential positive impacts of MOOCs for students than completion rate but, at the moment, completion rate is what the providers are measuring most consistently.

    In my mind, we should augment the models we use to evaluate MOOCs rather than throw the baby out with the bathwater. The challenge, therefore, is to move beyond the simplistic view of one type of student with one type of goal (course completion), and find patterns of student behavior that will give additional insight into the different goals and therefore different measures we should have in evaluating whether MOOCs are effective.

    (more…)

  • The Most Thorough Summary (to date) of MOOC Completion Rates

    How many times have you heard the statement that ‘MOOCs have a completion rate of 10%’ or ‘MOOCs have a completion rate of less than 10%’? The meme seems to have developed a life of its own, but try to research the original claim and you might find a bunch of circular references or anecdotes of one or two courses. Will the 10% meme hold up once we get more data?

    While researching this question for an upcoming post, I found an excellent resource put together by Katy Jordan, a graduate student at The Open University of the UK. In a blog post from Feb 13, 2013, Katy described a new effort of hers to synthesize MOOC completion rate data – from xMOOCs in particular and mostly from Coursera.

    Via a combination of thinking about ‘what makes a successful MOOC?’, and looking for a topic for my final project on the Infographics MOOC, I decided to try to pull together the various statistics floating around online about MOOC completion rates. I’m trying to see if any differences emerge on the basis of platform or the assessment methods used.

    My draft graph synthesising everything I’ve found so far can be found here: http://www.katyjordan.com/MOOCproject.html

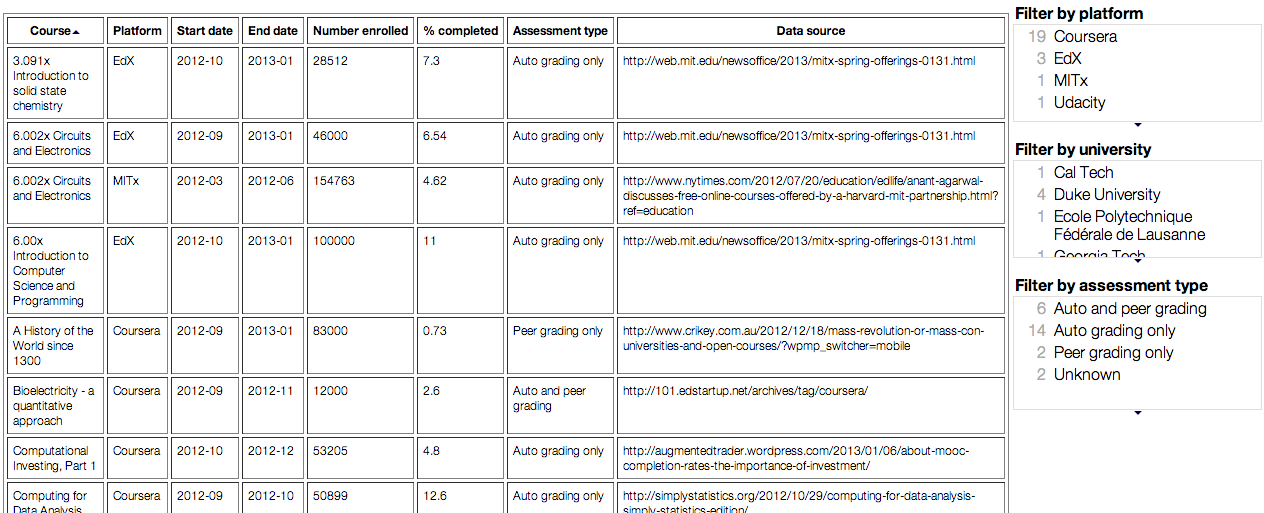
    What Katy has done so far is compile completion rate data from 24 MOOCs – 19 from Coursera, 3 from edX, 1 from Udacity and 1 from MITx (a precursor to edX). The data is available in a table format or in a graph.

    table


    (more…)