e-Literate

Present is Prologue

Tag: D2L

  • D2L Steps Up for EEP

    I’m delighted to announce that D2L has become the Empirical Educator Project’s first official Foundational Sponsor. The major principle behind sponsorship in EEP has always been that we only accept sponsors who have something to contribute in addition to money. The same is true for Foundational Sponsors. D2L is offering more to the academic participants in the Empirical Educator Project than just money and free resources. They have both demonstrated through participation to-date that they are good participants and offered enough value in future participation to earn pride of place. Their behavior is a model for other commercial participants in the educational community to emulate.

    To begin with, D2L VP of Market Research Kenneth Chapman, who I’ve known almost as long as I’ve been in EdTech, has been incredibly supportive of our work to-date. He arranged an integration demo to support Carnegie Mellon University’s OpenSimon announcement at our last summit. He’s sent staff to CMU’s LearnLab summer school as a follow-up. He’s made his people available for our work and has consistently and actively looked for ways to collaborate. Ken’s leadership and enthusiasm convinced me that I wanted to deepen the relationship between D2L and EEP.

    In terms of what D2L is offering as a Foundational Sponsor going forward, as I wrote earlier in this post, there’s the money (and contributions of financial value) and the participation. Let’s address the material part of the contribution first. D2L has committed to sponsoring EEP for the next three years. They have also offered up Brightspace as the EEP online community space for that period of time. This second part is going to be increasingly important as EEP work starts to become year-round and as we prepare to open up at least some of that work—both sharing and participation—to the general public. And D2L has offered up the help of its support team, including superstar Ben Campbell, to help us get the site set up and to teach us how to take maximum advantage of the affordances of the platform.

    By themselves, as generous as those offers are, they wouldn’t be enough to earn D2L a place as an EEP Foundational Sponsor. What sealed the deal was D2L’s interest in increased participation. I can’t share details yet, but at a high level, there are two aspects. First, they are actively interested in offering up Brightspace as a laboratory for experimentation. One natural place where that collaboration may go, as mentioned in D2L’s press release, is integration with Carnegie Mellon University’s OpenSimon software. As I mentioned further up in the post, there has already been a little work done in this regard, and there is plenty more to explore.

    At least as important is D2L’s offer to help bring the work and contributions of the EEP participants to the Brightspace user community. I’m really, really excited about the direction that this part of the conversation is taking and can’t wait to share more details as we nail them down.

    After EEP’s summit this spring, Bart Epstein, the CEO of the Jefferson Education Exchange and a passionate advocate for the kind of efficacy work that EEP is attempting to promote, offered up a note of reasonable skepticism in EdSurge’s coverage of the event and the contributions announced at it:

    When Tesla says that it’s making its battery patents available for free, you can be sure that all of the other car companies have incentives to invest time in reading and understanding those battery patents to read them and see if they can use them,” he said. “But when CMU opens up this software, it’s unclear who is out there that is saying, ‘Oh, there’s something in there that I want.’ We just don’t know how much impact it will have.

    Bart Epstein

    Nowhere is this concern more valid than in higher education. There are probably billions of dollars’ worth of intellectual property contributions that, practically speaking, are languishing on university servers where nobody knows that they exist, what they are good for, or how to use them. If we want to bridge this divide specifically in terms of new knowledge that could actually help students succeed in the real world, then we have to go beyond publishing papers and releasing open source software and OER (as important as those activities are). We have to develop an ecosystem and a culture for the diffusion and uptake of this knowledge.

    I invited D2L to be EEP’s first official Foundational Sponsor because their participation and other contributions will support our work in achieving this ambition.

    Stay tuned for more information as this collaboration continues to evolve.

  • D2L: Continuing emphasis on services and completion of move to SaaS model

    D2L: Continuing emphasis on services and completion of move to SaaS model

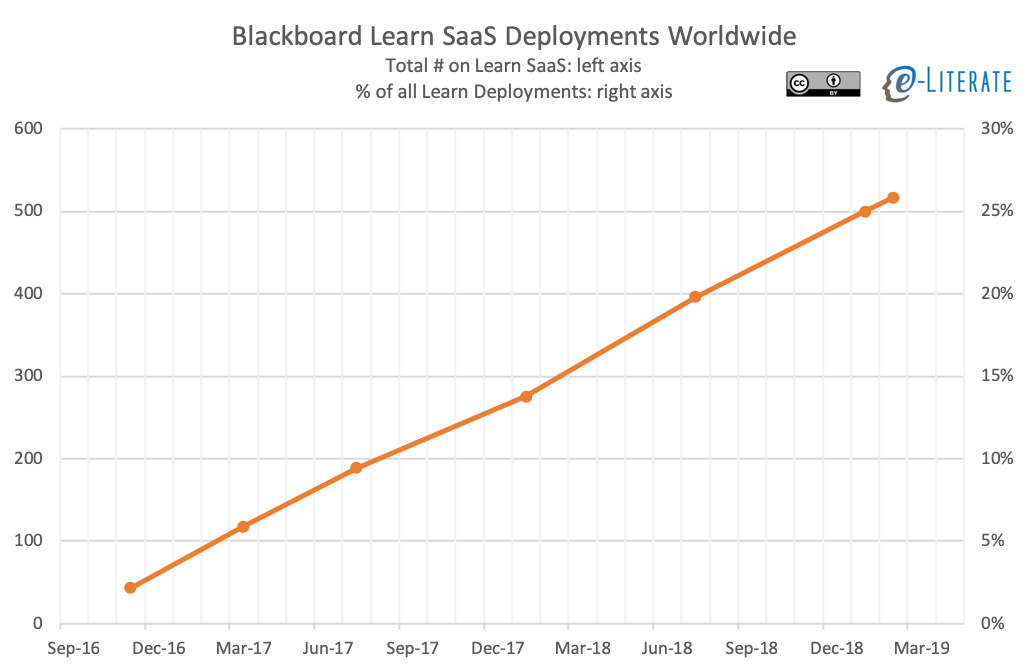
    In last week’s post on Blackboard, I shared the roughly linear progression of migration of the Learn LMS to a software-as-a-service (SaaS) model – a move that we believe is more important than is the Learn Ultra user experience. If you take into account percentages of total Learn deployments, you see that Blackboard has roughly 25% of Learn clients on SaaS after starting in late Fall 2016, increasing by approximately 10% per year. ((Each point is taken from Blackboard public release of information either directly to us at e-Literate or in press releases.))


    Blackboard Learn SaaS Deployments over time

    Blackboard is not the only LMS company migrating to the cloud, however, and D2L  ((Disclosure: D2L and Blackboard and Instructure are all subscribers to our LMS Market Analysis service.)) has taken a more aggressive bet on SaaS for their Brightspace LMS platform (also based on AWS), as described in Summer 2018.

    While we heard grumblings from multiple clients during the transition – especially through early 2017 – D2L clearly made some hard choices and and is aggressively moving to the cloud, not just as an option, but as their primary delivery model. According to David Koehn, VP of Product Management at D2L:

    • All new Brightspace implementations are on AWS cloud;
    • Virtually all current Brightspace implementations use Continuous Delivery; and
    • Approximately 50% of current customers are already on the AWS version of cloud deployment; and
    • By the end of 2018, a large majority of customers will be on cloud deployment.

    Last Fall I spent time at D2L’s Kitchener, Ontario headquarters getting an update on the company’s progress on a number of initiatives. D2L executives described that all but roughly a dozen Brightspace clients are now on SaaS deployment, and by the end of 2019 they should be fully a SaaS platform company.

    Why is percentage of total deployments important? Two reasons are that the move to 100% SaaS deployment enables the movement to a single version of code, dramatically simplifying regression testing and enabling more rapid development of new designs, while also taking advantage of modern technology stacks. As described in the Summer 2018 post:

    David Koehn also pointed out that the real driver for the AWS cloud move by D2L is to enable a redesign of the user experience [branded Daylight] and to provide improved scalability and reliability. In other words, the cloud deployment is a means to the Daylight end.

    The downside, of course, is that pure SaaS deployments largely leads to a reduction in customization capabilities. Companies like D2L and Blackboard that are moving from an enterprise model to a cloud model are betting that they can build in appropriate configuration options (rather than customized code) and leverage third-party integrations to overcome this challenge. But to get the full advantage of SaaS, a company needs to do the entire move.

    I further spent some time in London and had the opportunity to talk with D2L’s London-based leadership team that covers EMEA and Latin America regions. D2L leaders in London presented a transparent and honest appraisal of the company’s current market position in Europe and Latin America, and where they see the biggest opportunities. For starters, D2L acknowledged that Instructure’s system-wide wins for the Canvas LMS in the Nordic countries had largely blocked opportunities for expansion in that region. Other areas, however, have been much more promising. They are doing well particularly in the Benelux countries (Belgium, Netherlands and Luxembourg) with Ghent University in Belgium being an example of a recent, large (45,000 student) implementation. There have been important wins in the UK and Ireland, and activity in Spain seems to be picking up some momentum. Germany continues to be a challenging place to get a foothold partially due to university funding that favors in-house staff maintaining open source systems.

    In Latin America, D2L was open about cutting back investment in the region in 2017, particularly in Brazil, largely due to economic uncertainties and limited growth opportunities. They now see activity picking up in the region and have been investing to take advantage of the market potential.

    In both Europe and Latin America, the provision of professional services beyond the LMS platform, as well as willingness to add requested features, appears to be a differentiator for D2L, especially in comparison to Instructure. D2L has shown a much greater willingness to roll up their sleeves and collaborate on instructional design, course building, and online pedagogy using internal staff, almost in an Online Program Enablement model. It surprised me during my Fall HQ visit to see just how well-established is the content creation team that helps schools redesign courses and even design front-end web sites for online programs. We have heard similar messages from D2L customers and even from a consulting firm that works directly with Canvas and Brightspace customers.

    To a degree, none of this post is different from our Summer 2018 coverage other than updating on progress, so why has D2L not made more of a market share increase in the past year? I suspect there are three reasons. One is that D2L has done a better job updating their product line and introducing new services than they have done in fixing issues with current customers, particularly around data and analytics. During my Fall HQ meetings, when the D2L team was describing their new data and analytics approach called the Brightspace Data Platform, I pointed out that while this appears to be an improved approach, it does not acknowledge that D2L has been touting its data and analytics capabilities for years. There are leftover frustrations from customers based on previous attempts that did not match client expectations.

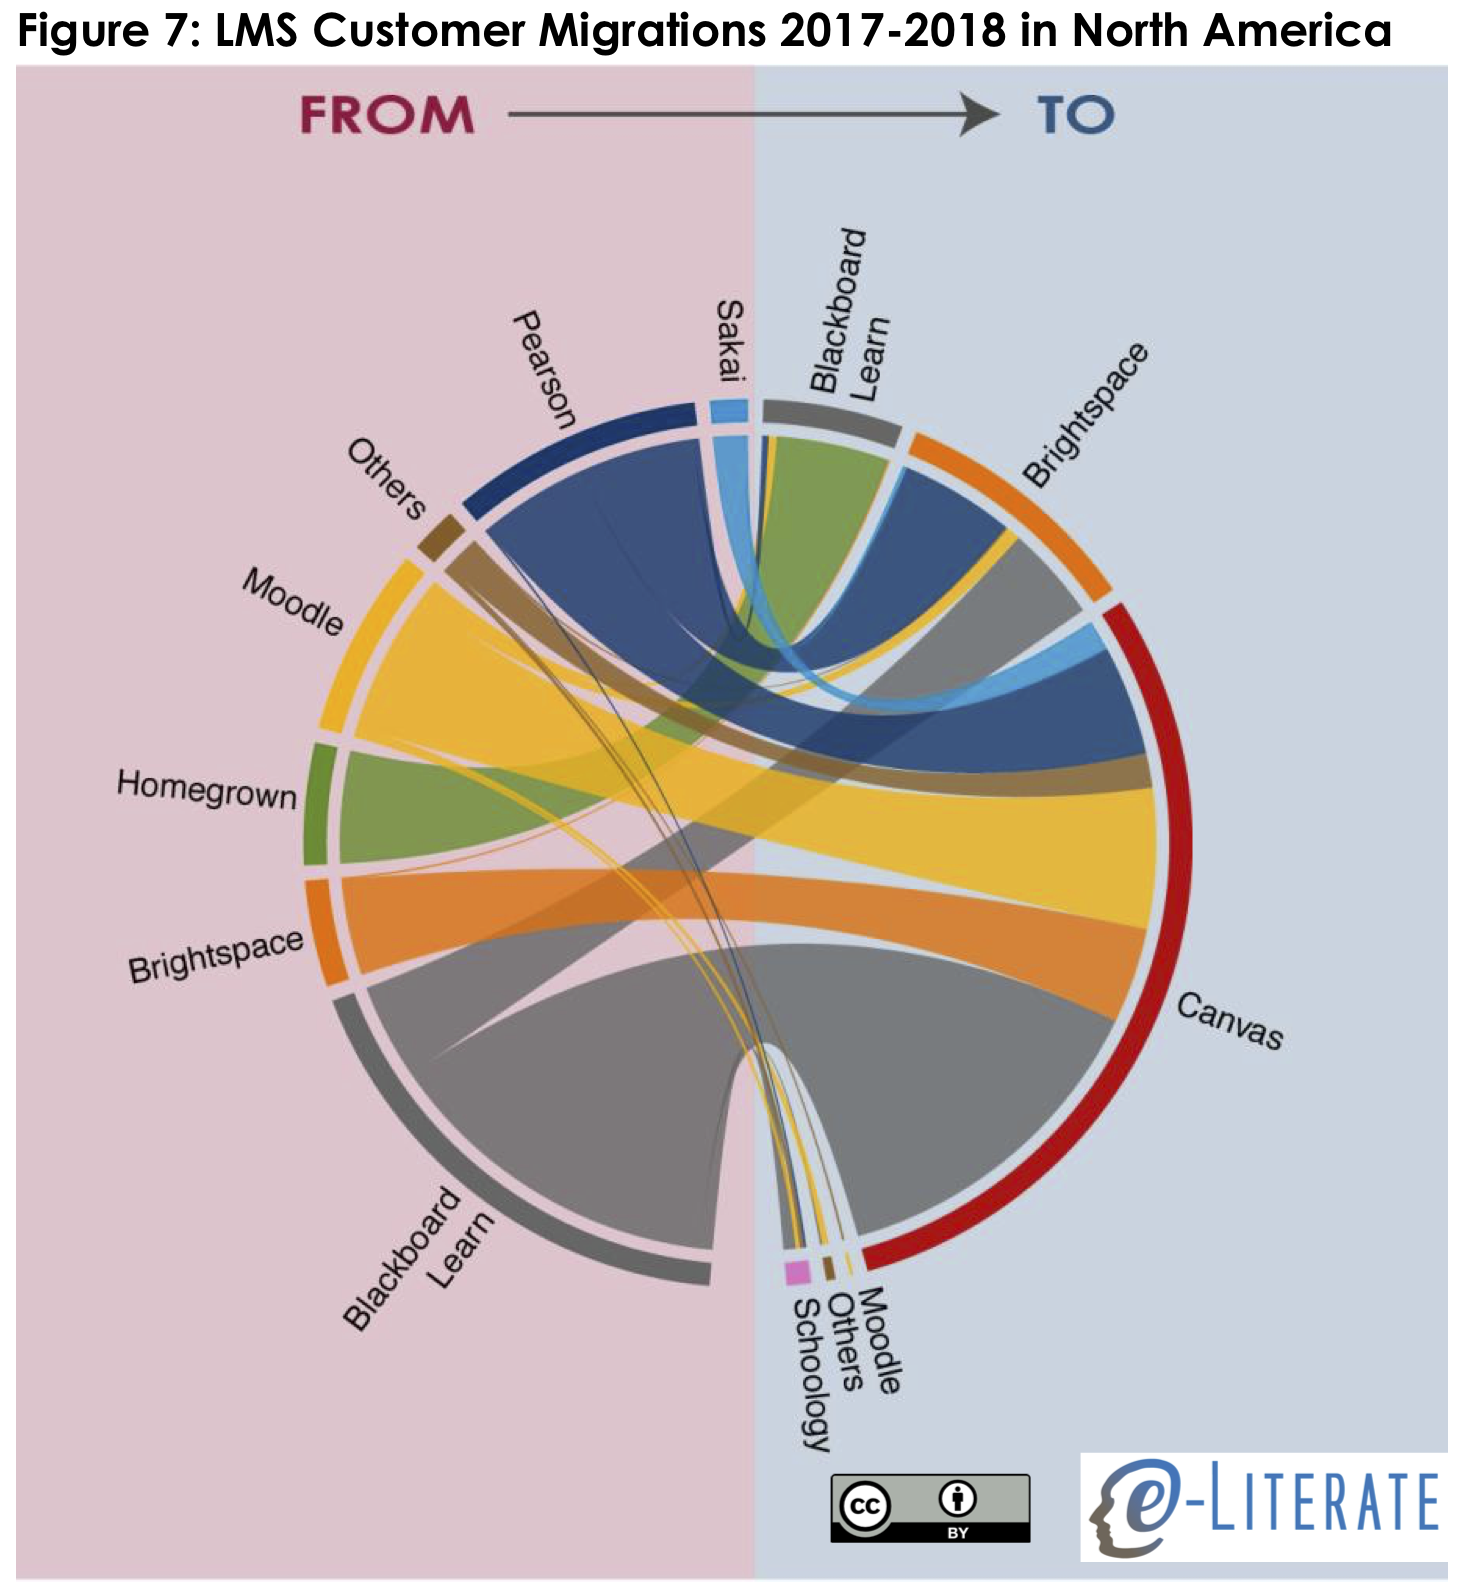
    The second reason is Instructure. While D2L is in a solid second place for new implementations worldwide (schools migrating from one LMS to another), they have also lost a number of clients in North America – almost all to the Canvas LMS. In our recent LMS Market Analysis report, we showed a transition graphic with higher ed LMS migrations from 2017 – 2018.

    LMS Migrations 2017-18 Higher Ed

    The third reason is that it is very difficult to be a third competitor in terms of customer mindshare. The academic LMS market has tended to have a narrative of a major competitor and an upstart. Blackboard and WebCT in the early and mid 2000s, Blackboard and Moodle in the late 2000s, and Blackboard and Canvas through much of the 2010s. It is difficult for a company like D2L to break through this narrative and be top of mind for institutions from day one of an evaluation.

    While D2L has challenges in market position and introduction of a new data and analytics approach, they are completing the transition to a SaaS platform company and focusing on flexibility and services.

  • Is Microsoft or Google your next LMS? The view from BETT

    Is Microsoft or Google your next LMS? The view from BETT

    The following is a guest post from Jason Cole, a longtime colleague and freelance consultant who recently moved back to London. Previously, Jason was Vice Chancellor for IT at the Peralta Community College District, and before that was CEO and Board Chair at Remote-Learner. [ed]

    I recently spent a day at BETT (formerly known as the British Educational Training and Technology show), the UK’s largest educational technology show. The show tends to skew towards the primary and further education market (k-12 and community college in the US), but there is also significant higher education presence. If you are looking for a US equivalent, its more akin to ISTE than EDUCAUSE.

    For those who haven’t been to BETT, it can be a bit overwhelming. There are over 34,000 attendees and 900 exhibitors from 138 countries. The massive show floor hosts everyone from national trade organizations from Denmark, Spain, UAE and Egypt to little ed tech startups that will probably evaporate in a few years.

    Everything is in one giant exhibition hall, with auditoriums scattered amongst the vendor booths. You can hear the noise of the conference space everywhere, even in the main event auditorium.

    For all of the activity, what was noticeable was the absence of the major LMS vendors besides Instructure Canvas. The company sponsored talks and roundtable lunches, but it didn’t have a traditional marketing booth. Their presence and sponsorship, however, meant they were the only LMS vendor anyone was talking about. D2L, Moodle, the UK Moodle partners, and Blackboard had no discernible presence. WebAnywhere is now focused on the SchoolJotter product and corporate Totara market. Synergy had small table in the back with one small Moodle Partner badge. Why – is BETT just a bad bet for lead generation and branding for the LMS providers? The large schools presence may mean less traffic for the higher ed (HE) focused LMS providers. But there are HE attendees, and Moodle had a strong schools presence. Some might argue the limitations of GDPR make lead generation difficult in European shows, but the presence of 900 exhibitors seems to imply there is some return on investment.

    On the other side of the spectrum, Google and Microsoft had large crowds in their large multi-plot booths. Each company had case study talks by users, how-to’s for teachers, and partner ecosystem mini-booths. Most of the hands-on presentations by these two tech giants were near capacity when I checked in throughout the day, as were most of the case study discussions.

    Every presentation in the Microsoft booth had real-time captioning displayed directly above the slides, and every presentation had real-time translation into multiple languages. Microsoft is obviously confident in both services, and from what I could see these services were remarkably accurate.

    It may have been the (AI-recommended) Microsoft Kool-aid ((Somehow an AI tied to a screen with a camera judged my reactions to three pictures, and estimated my age and gender and then labelled me an “Empowerer”. It’s recommendation was a rather refreshing apple cucumber drink with Spirulina distributed for free by two attendants. I have no idea why empowerers need cucumber, nor was there any falsifiable alternatives to getting a different flavour. Would the Innovator beverage make me more creative? Ah, the joys of inscrutable machine logic!)), but it appears Google and Microsoft are edging their way into the LMS space. Their presence at a K-12 focused show suggests they are finding traction at the younger grades. But as their education offerings grow in sophistication, and their ecosystem advantages start to accelerate, I believe a more concerted push in the higher ed space is inevitable.

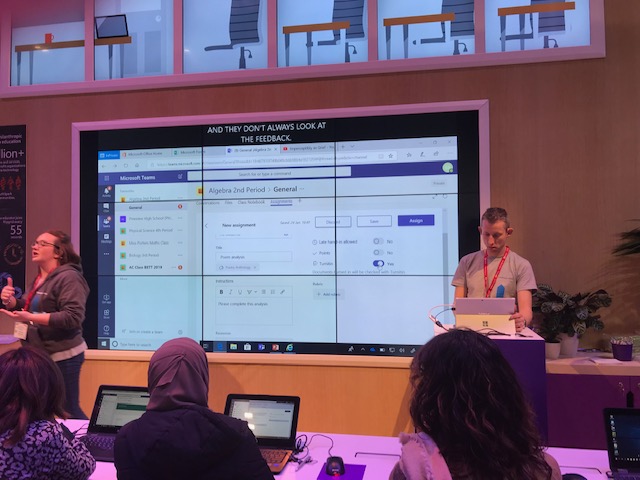
    When Microsoft makes their push, the learning system won’t look like an LMS, but it will look like Teams. Teams is Microsoft’s central communication application for business, rolling in Skype and other business lines. There is an education version for teachers. Students with courses in Teams access their materials, communicate with the instructor and each other, and collaborate using Office and other tools online.

    View of Microsoft Teams demo

    The early indicator of Microsoft’s intent is their recently released Assignments for Teams for Education. Assignments gives teachers an easy to use tool to create either quizzes (using Forms) or submissions (using the Office suite). The student work can be graded using either a straight score or a rubric. Students see the results in their Teams, and teachers can download the grades for all the Assignments to Excel. It’s an interesting feature that signals a definite intent from Microsoft to meet the needs of teachers in the education version.

    Teams is not ready to replace or compete with the LMS yet, but it isn’t terribly far away. The Teams interface for classrooms needs some reorganization, it needs a centralized grade book that isn’t reliant on export to Excel, and it needs a slightly better authoring experience to combine the features together in learning modules. Teams and Sharepoint would also need a clear content strategy enable integration with publisher tools and content. But none of these challenges are impossible, and some Microsoft partners already have pieces of the solution.

    The ecosystem around Teams and Office will give Microsoft an increasingly interesting story. Microsoft is rapidly integrating service platforms for email, calendar, business logic, business intelligence, AI, device management, and cloud services into the Teams platform. There is enormous potential for educational organizations to leverage these capabilities to deliver a unified student experience. The “learning management” features move into the background, while students interact with a single application and message flow.

    While the potential is there, there are a few hurdles on the way. Moving into the learning and teaching side of the HE market requires a different channel strategy than the current focus on the productivity and infrastructure side of the house. Microsoft relies on a combination of direct account management and partner sales in a complex selling process. The Microsoft partners who would need to engage in the sales process and own customer relationship tend not to have academic sales experience, nor do they have the brand recognition of Canvas, Moodle, D2L and Blackboard among faculty. Given the sales costs and margins, a higher education focused Microsoft partner would have difficulty achieving scale. I would watch for more bottoms up adoption, pressure from students coming to HE from Google and Microsoft schools, and adoption outside of the traditional HE context as early indicators of a market shift.

    Other observations:

    • By sheer number of vendors, apparently every school in the EU is going to have a robotics lab and a maker space in the next few years. Lots of Arduino, 3D printers, and so… many… robots.
    • A few VR and AR vendors were making a splash (and inducing large scale motion sickness) with headsets and learning simulations.
    • Newton Rooms, modular, pre-packaged hands on science learning rooms, designed in Norway are one of my new favourite things.
  • State of Higher Ed LMS Market for US and Canada: 2018 Year-End Edition

    State of Higher Ed LMS Market for US and Canada: 2018 Year-End Edition

    This is the eleventh year I have shared the LMS market share graphic, commonly known as the squid graphic, for US and Canadian higher education. This past year we at e-Literate shifted our LMS Market Analysis reports from Spring / Fall to Mid-Year / End-of-Year to better allow analysis of entire years. With the release of our end-of-2018 report last week to subscribers, it’s time for us to look at updates on the institutional LMS market for North America (US and Canada) higher education. Note that our coverage for the market analysis includes Europe, Latin America, Oceania (Australia, New Zealand, and surrounding island countries) as well as emerging coverage of the Middle East.

    We present the following data “by institutions”, with market share as a percentage of the total number of institutions using each LMS as a primary system, and “by enrollments”, where we scale the institutions by its total enrollment. The latter better captures the business of the LMS market, since most licensing deals are based the number of students.

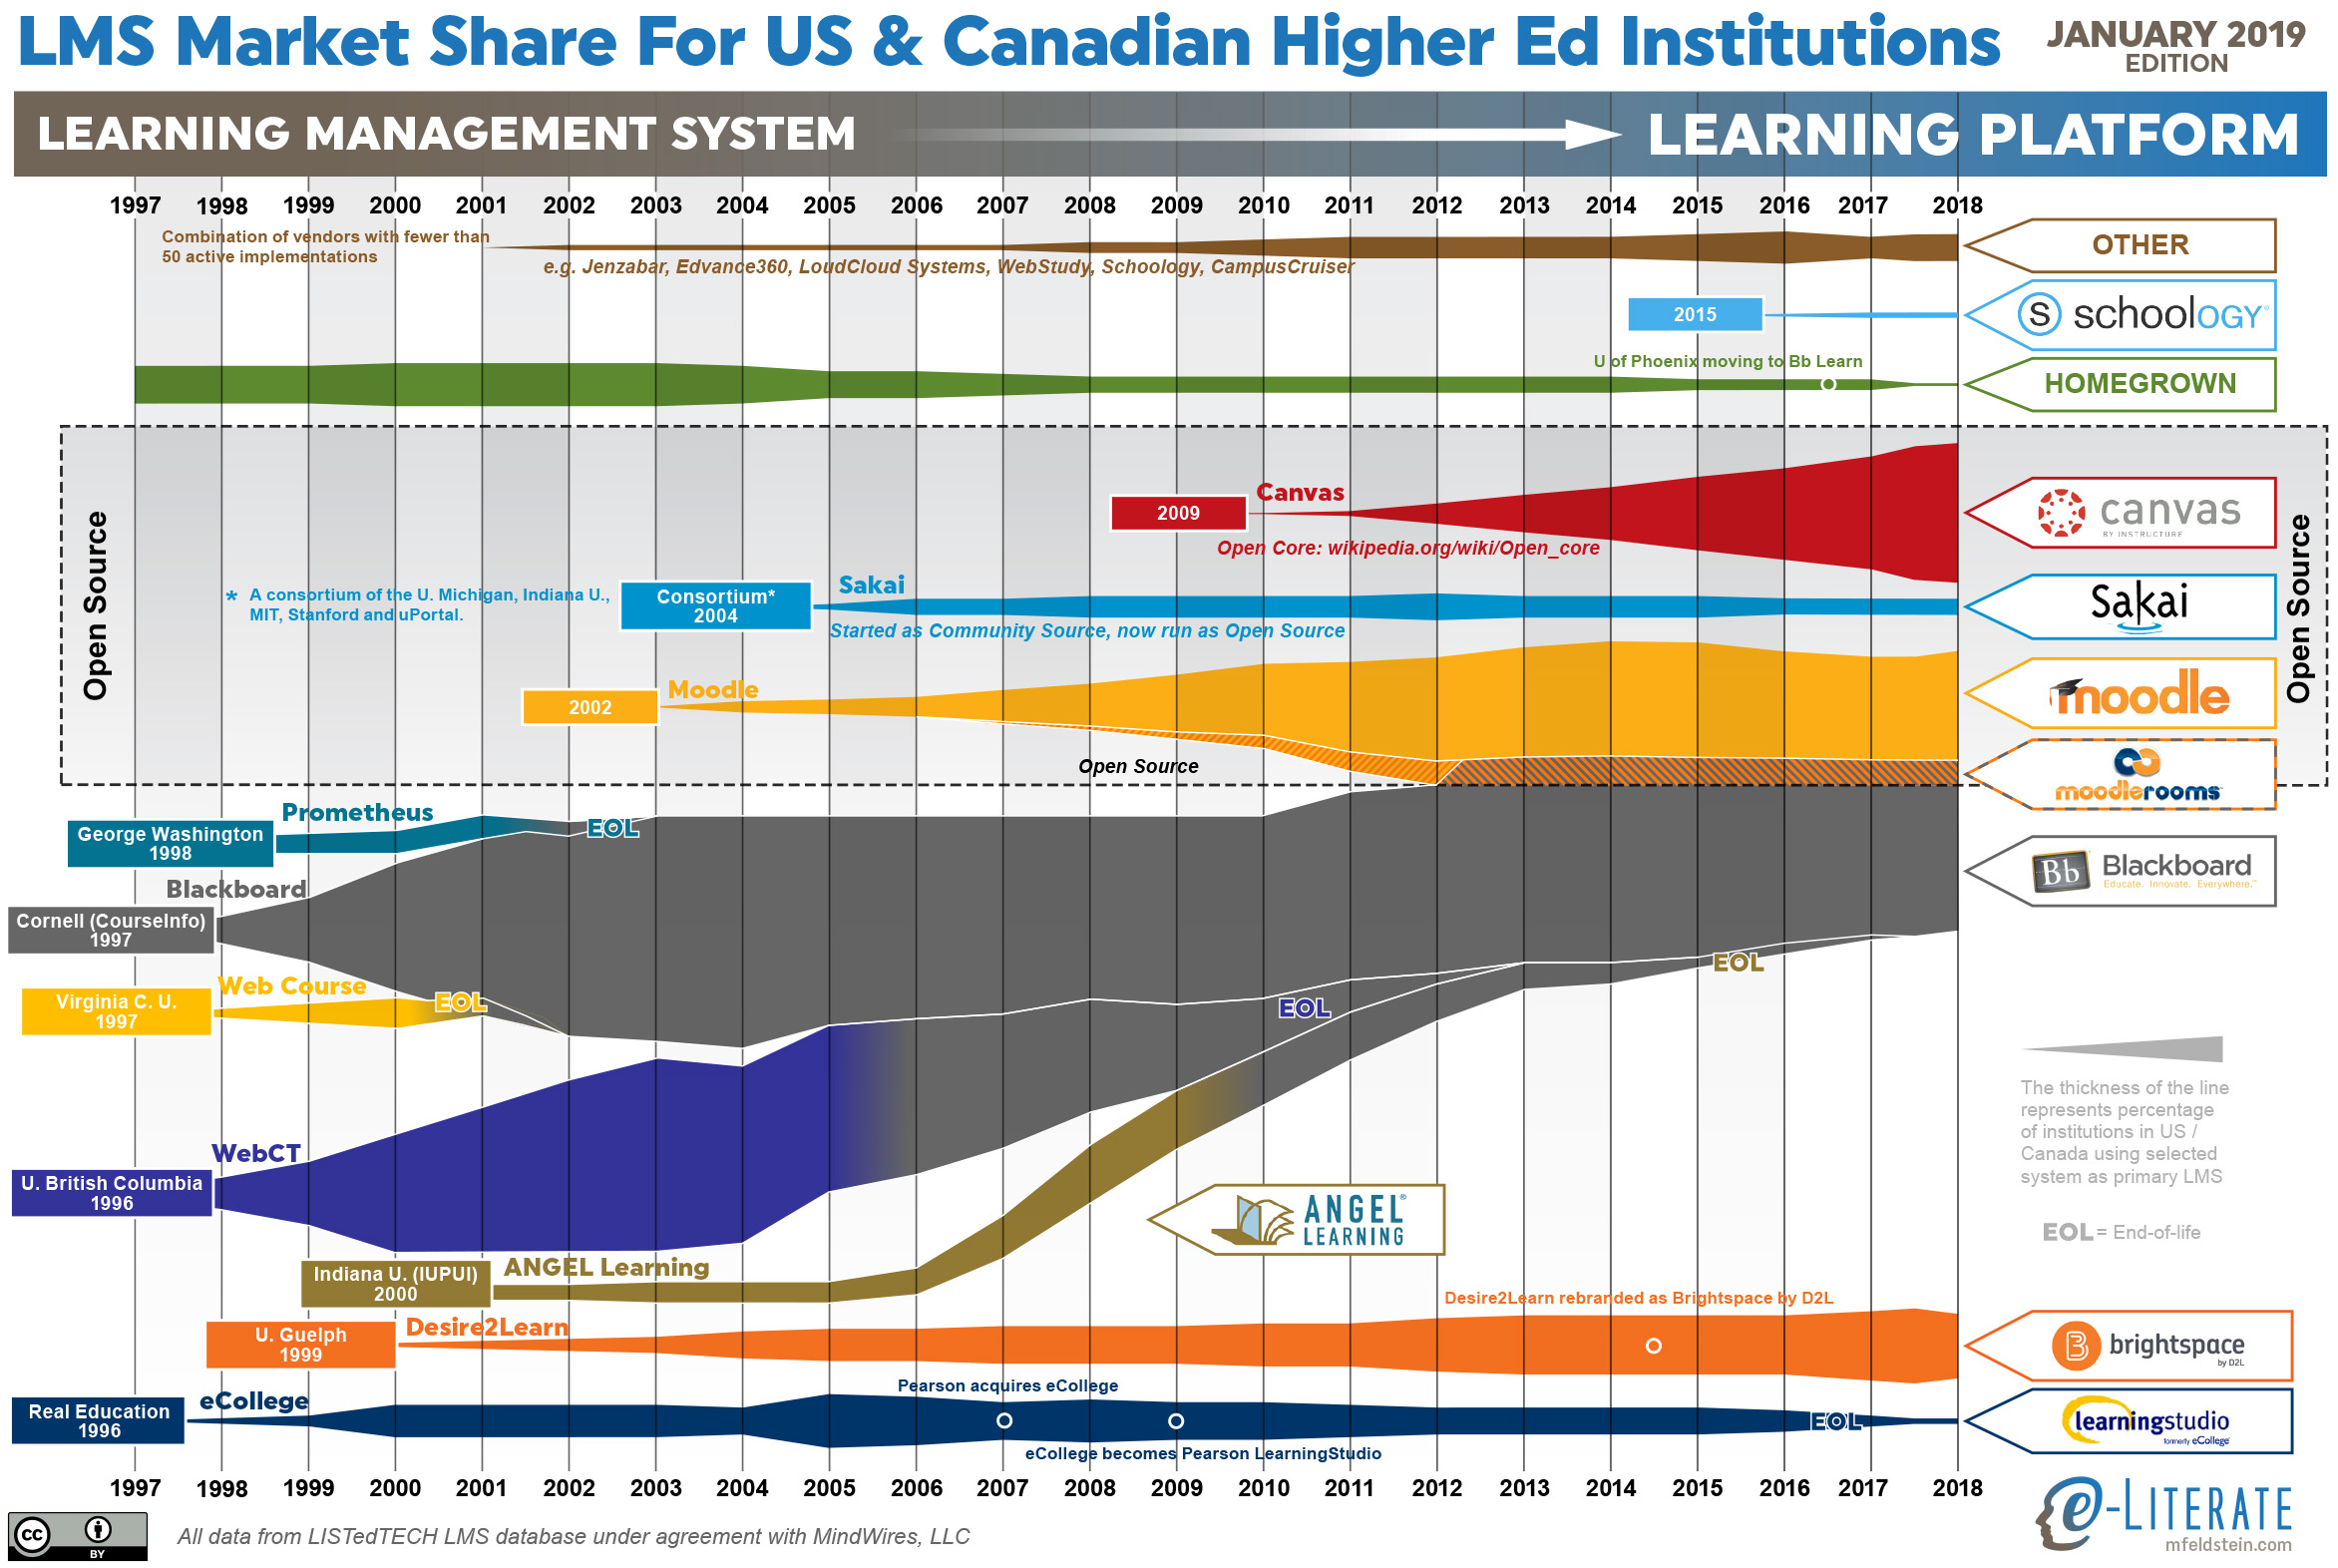
    But first, let’s look at an updated LMS market share graphic, commonly known as the squid graphic, for US and Canadian higher education. The original idea remains – to give a picture of the LMS market in one page, highlighting the story of the market over time. The key to the graphic is that the width of each band represents the percentage of institutions using a particular LMS as its primary system.

    Higher ed LMS market share for US and Canada, January 2019

    This year there are two inter-related trends that deserve a broader explanation -the LMS market slowed down with less activity overall, and Canvas and Blackboard continue to be neck-and-neck in the top spot of this market.

    We recently described the overall market activity slowdown in that there are fewer LMS formal evaluations taking place since mid 2018, with initial data pointing to a 20 – 25% drop from a year earlier. This slowdown seems to be a type of plateau rather than a continuing trend, and we are watching to see if it is temporary or not.

    Last summer we shared the symbolic passing of the torch where Canvas surpassed Blackboard in US market share, which was the first time Blackboard was not the top system since the market emerged two decades ago. What is interesting is that half a year later, the two systems are still neck-and-neck. In the US Canvas is still slightly ahead, and in North America (adding in Canada), Blackboard remains in the top spot by 0.4% (26.8% to 26.4%). Why is Canvas not continuing to extend its lead? Looking at the underlying data, there seems to be three reasons to consider:

    • The overall market slowdown means that there are fewer deals for Canvas to win lately.
    • Blackboard continues its University of Phoenix implementation, which still includes dozens of campuses despite its enrollment drop.
    • The shutdown in December of the for-profit Education Corporation of America (Virginia College and Brightwood College systems) meant that Canvas lost several dozen campuses.

    The latter two points should fully play out in the next three months, possibly making this a one-time change in trends, but it is important to call this situation out.

    Some other notes:

    • The market continues to consolidate around the Big Four – Blackboard, Canvas, D2L Brightspace, and Moodle.
    • The Homegrown option for LMS usage is going away, at least in a statistical sense. Only a handful of schools even consider this option.
    • D2L shares the challenge of having picked up several large for-profit systems that are closing campuses and therefore hurting market share. In D2L’s case, the biggest one is the former EDMC schools – the Art Institutes, Argosy University, and South University – that were sold out of bankruptcy to a non-profit entity and have closed dozens of campuses over the past year. These losses offset many of D2L’s wins in 2018.
    • Moodle had a few new wins in North America.

    Sticking with North America, we can also show LMS market share scaled by the enrollment of each institution, giving a different measure worth considering.

    NA LMS Market Share by Enrollment

    We’ll share more information on other global regions in the coming months.

  • Contrasting LMS Adoption Patterns in Four English-Speaking Countries

    Contrasting LMS Adoption Patterns in Four English-Speaking Countries

    The article is Cross-posted at LISTedTECH.

    One of the trends we have been covering is the gradual consolidation of global LMS markets in higher education around “the Big Four”, Moodle, Blackboard, Canvas, and D2L Brightspace. While there are market similarities in terms of this consolidation along with the broader move to the cloud, it would be a mistake to view various global regions as having the same same trends overall, even in a subset of English-speaking countries.

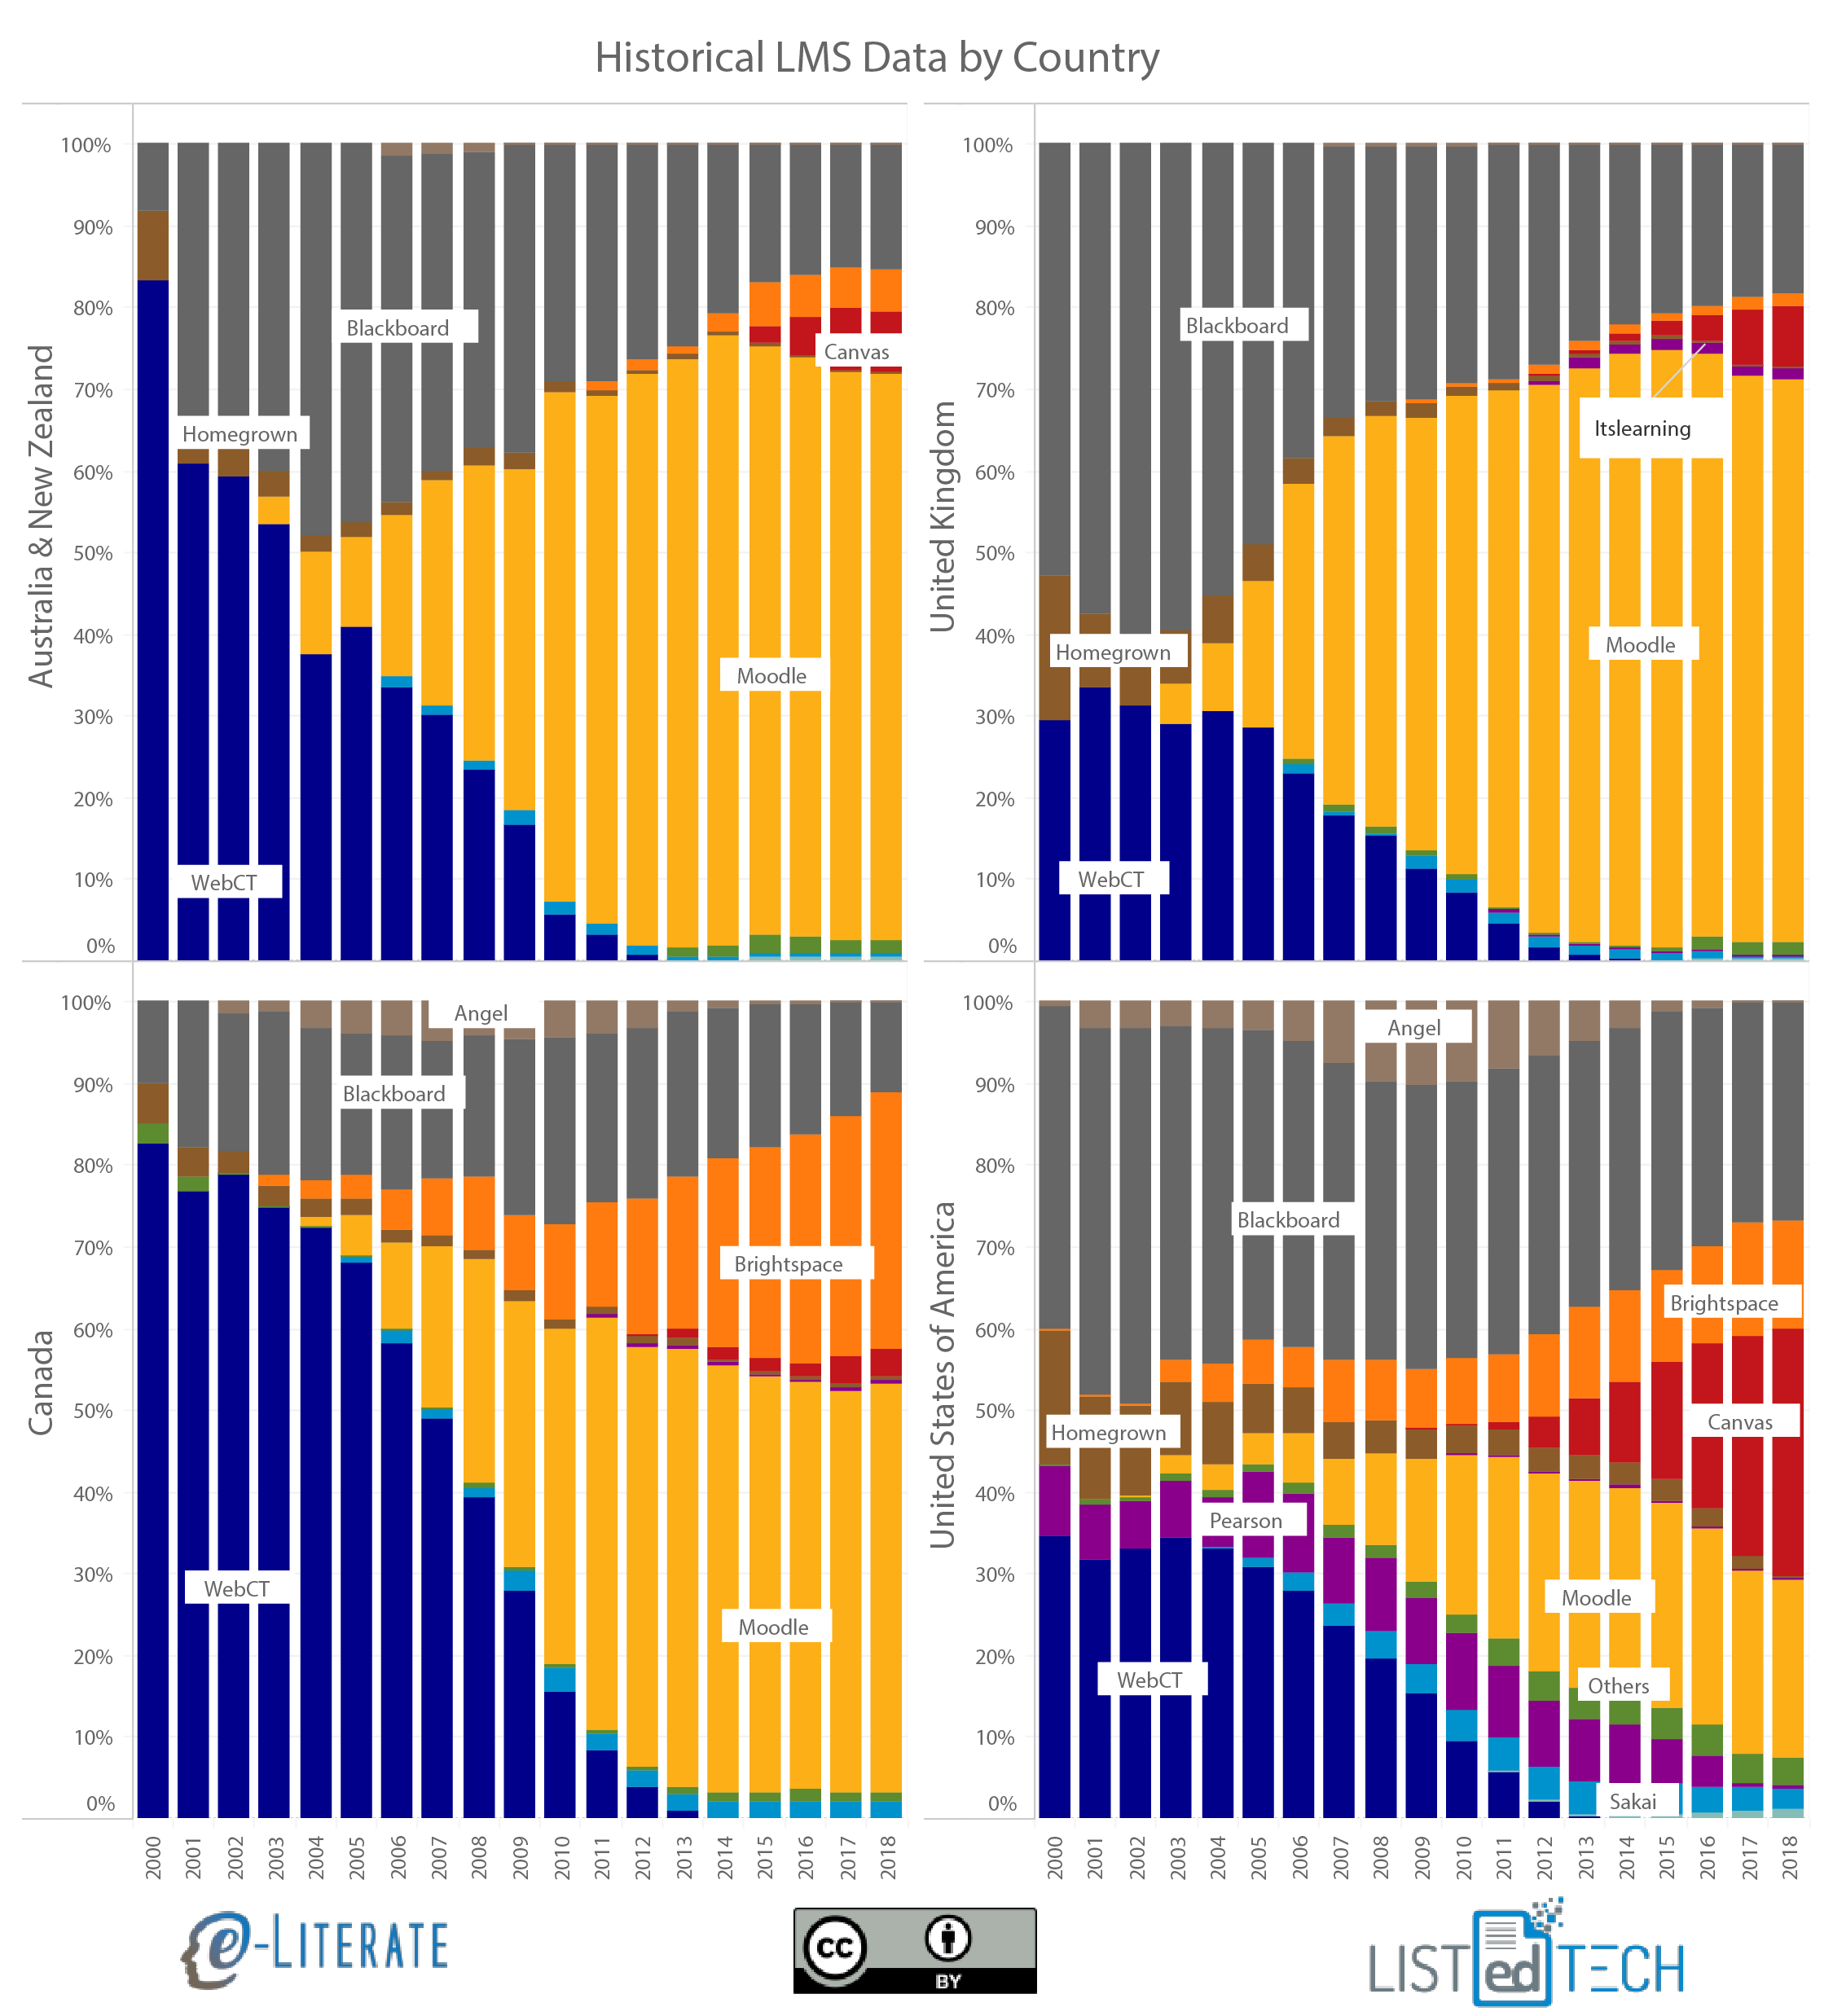
    By taking a step back and looking at institutional market share per country per year since 2000 (i.e. the percentage of higher education institutions having a particular LMS as their primary system), different adoption patterns become more apparent. In this case we’re looking at Australia / New Zealand (see note below), the United Kingdom, the US, and Canada. Note ahead of time that Blackboard acquired WebCT in 2004 and ANGEL in 2009 – this view separates out the product lines regardless of ownership, thus “Blackboard” means “Blackboard Learn / Academics Suite”. Also note that his is just one subset of the global market intended to show different patterns.

    Historical LMS adoption in US, Canada, UK, Australia & New Zealand

    • While the very early market was practically a duopoly, the preference for WebCT vs. Blackboard varied significantly.
    • Australia and New Zealand have a rich history of homegrown LMS development, including CECIL (University of Auckland in New Zealand), which some argue was the very first web-based LMS. There was still quite a bit of Homegrown LMS activity in the early 2000s along with a strong early preference for WebCT over Blackboard. Australia is the home country for Moodle (Perth), yet it lagged the UK in terms of late 2000s adoption of that system.
    • The UK showed a preference for Blackboard over WebCT, while also having significant Homegrown LMS adoptions early in the 2000s. Starting in 2003 we see the most rapid shift towards Moodle of any of these four countries, followed by a more recent move towards Canvas starting in 2013, starting with the Birmingham University adoption.
    • Canada is the home country for both WebCT (Vancouver, British Columbia) and D2L Brightspace (Kitchener, Ontario), and accordingly we see the highest percentages for both systems. This country also shows the slowest market gains for Canvas compared to the other three. Overall, early in the market, Homegrown solutions were much more common.
    • The US – home country to Blackboard, Pearson, Canvas, and Sakai –  is seen as an outlier by not having Moodle as the dominant system in terms of installed base. Pearson LearningStudio, formerly eCollege, was quite important in the US market, largely due to its position in the for-profit sector. And this is the leading country in terms of Canvas installed base and growth.

    There are other patterns to see in the data, but the overall point is to note how different adoption patterns can be in the LMS market, even for a subset of English-speaking countries since 2000. ((Disclosure: Blackboard, D2L, Moodle HQ, Instructure are all subscribers to our LMS Market Analysis service.))

    Update 27 Nov: We have duplicated the x axis to show on both levels for clarify. The data is based on number of institutions and represent running totals of active implementations where we have implementation / decommission dates – approximately 75% of all known active systems. The current totals used for each country are approximately 200 for Australia, 250 for Canada, 700 for the UK, and 3,500 for the US.

    Update 30 Nov: In an embarrassing mistake I credited CECIL to Australia when it was based at the University of Auckland in New Zealand. We have since updated the graphic to include both countries combined and edited the description of that region’s Homegrown activity. The article now combines Australia and New Zealand and treats as one country for the purposes of this analysis.

  • North American Higher Ed LMS Market Share by Enrollments: A consolidating market

    North American Higher Ed LMS Market Share by Enrollments: A consolidating market

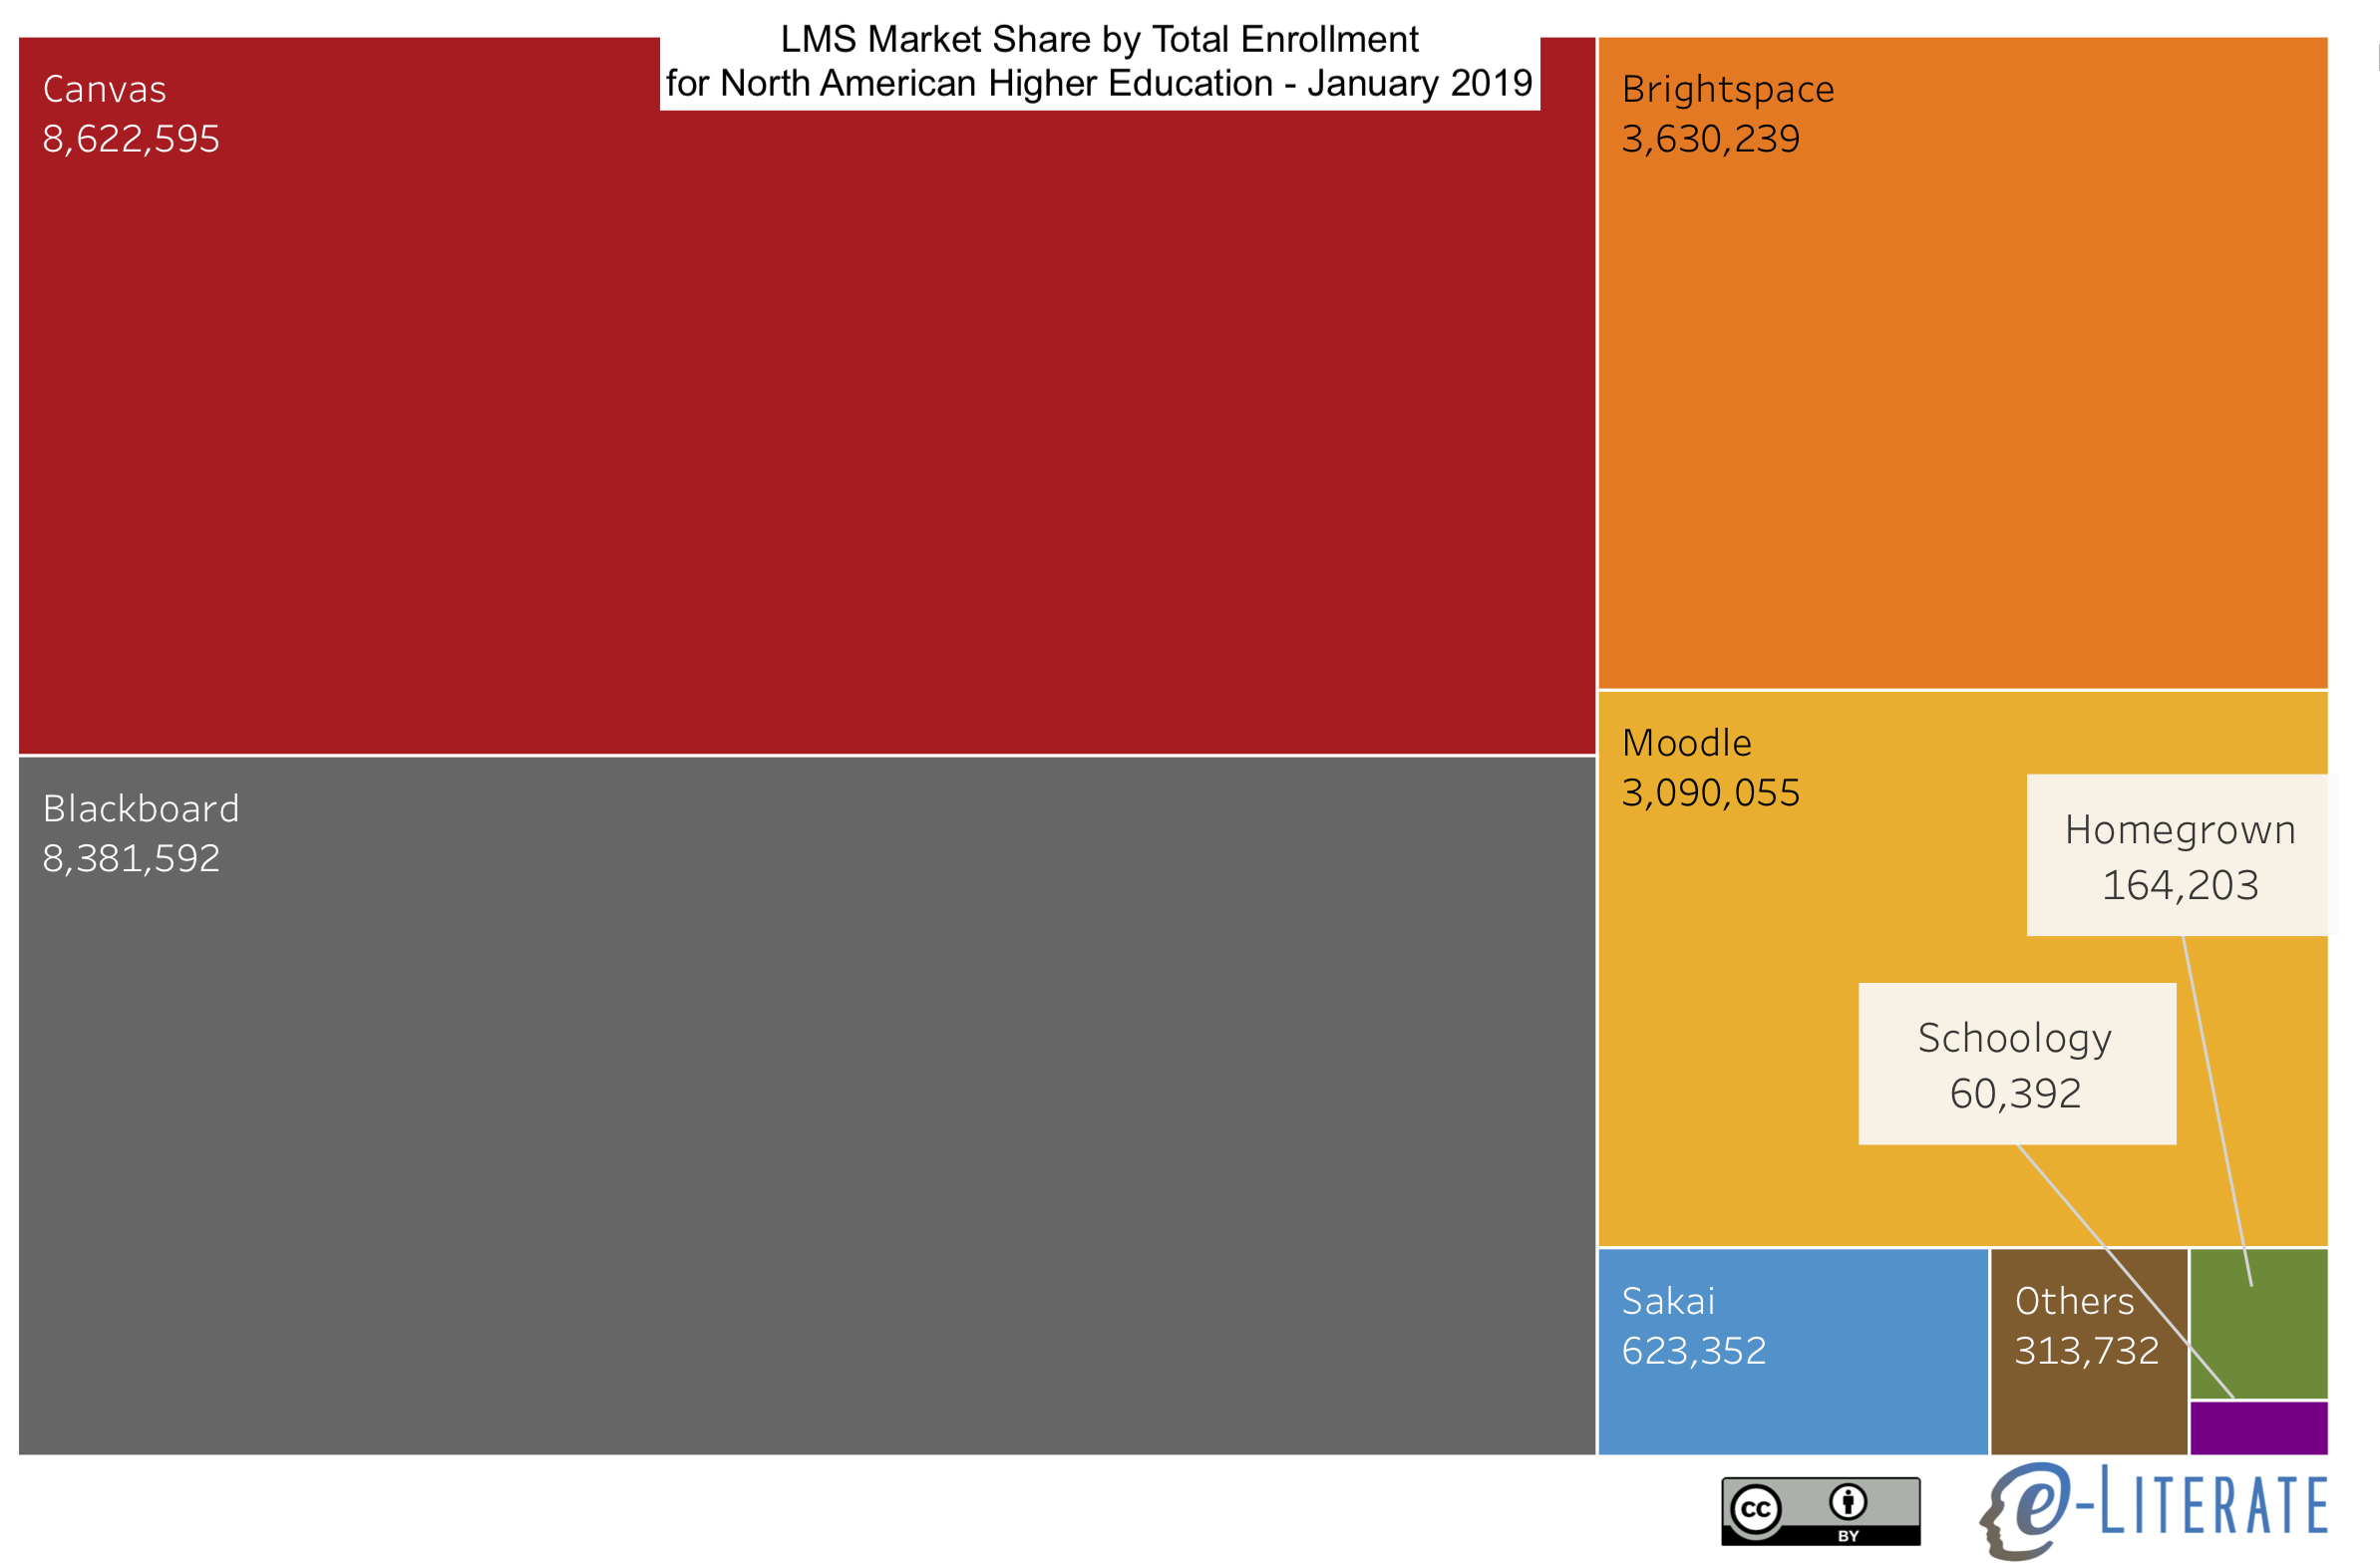
    We have published market share data measured by total institutional enrollment instead of institutional count in several posts at e-Literate over the years, within the twice-annual reports of our LMS Market Analysis service, and for several of our premium subscribers of the same service. In July of this year we reported that Canvas had overtaken Blackboard as the market leader in US higher education in terms of institutional adoptions as well as scaled by enrollment. These last two posts got a fair amount of media and vendor attention.

    What we have realized, however, is that we have not made this information on market share by enrollment easy to access in one place. LMS company revenue tends to be based on the total enrollment of adopting institutions, thus this enrollment-based measure provides a more direct connection to company finances. Given the increased importance of LMS provider business models and revenue to the future trends of the market, we are sharing the information more broadly.

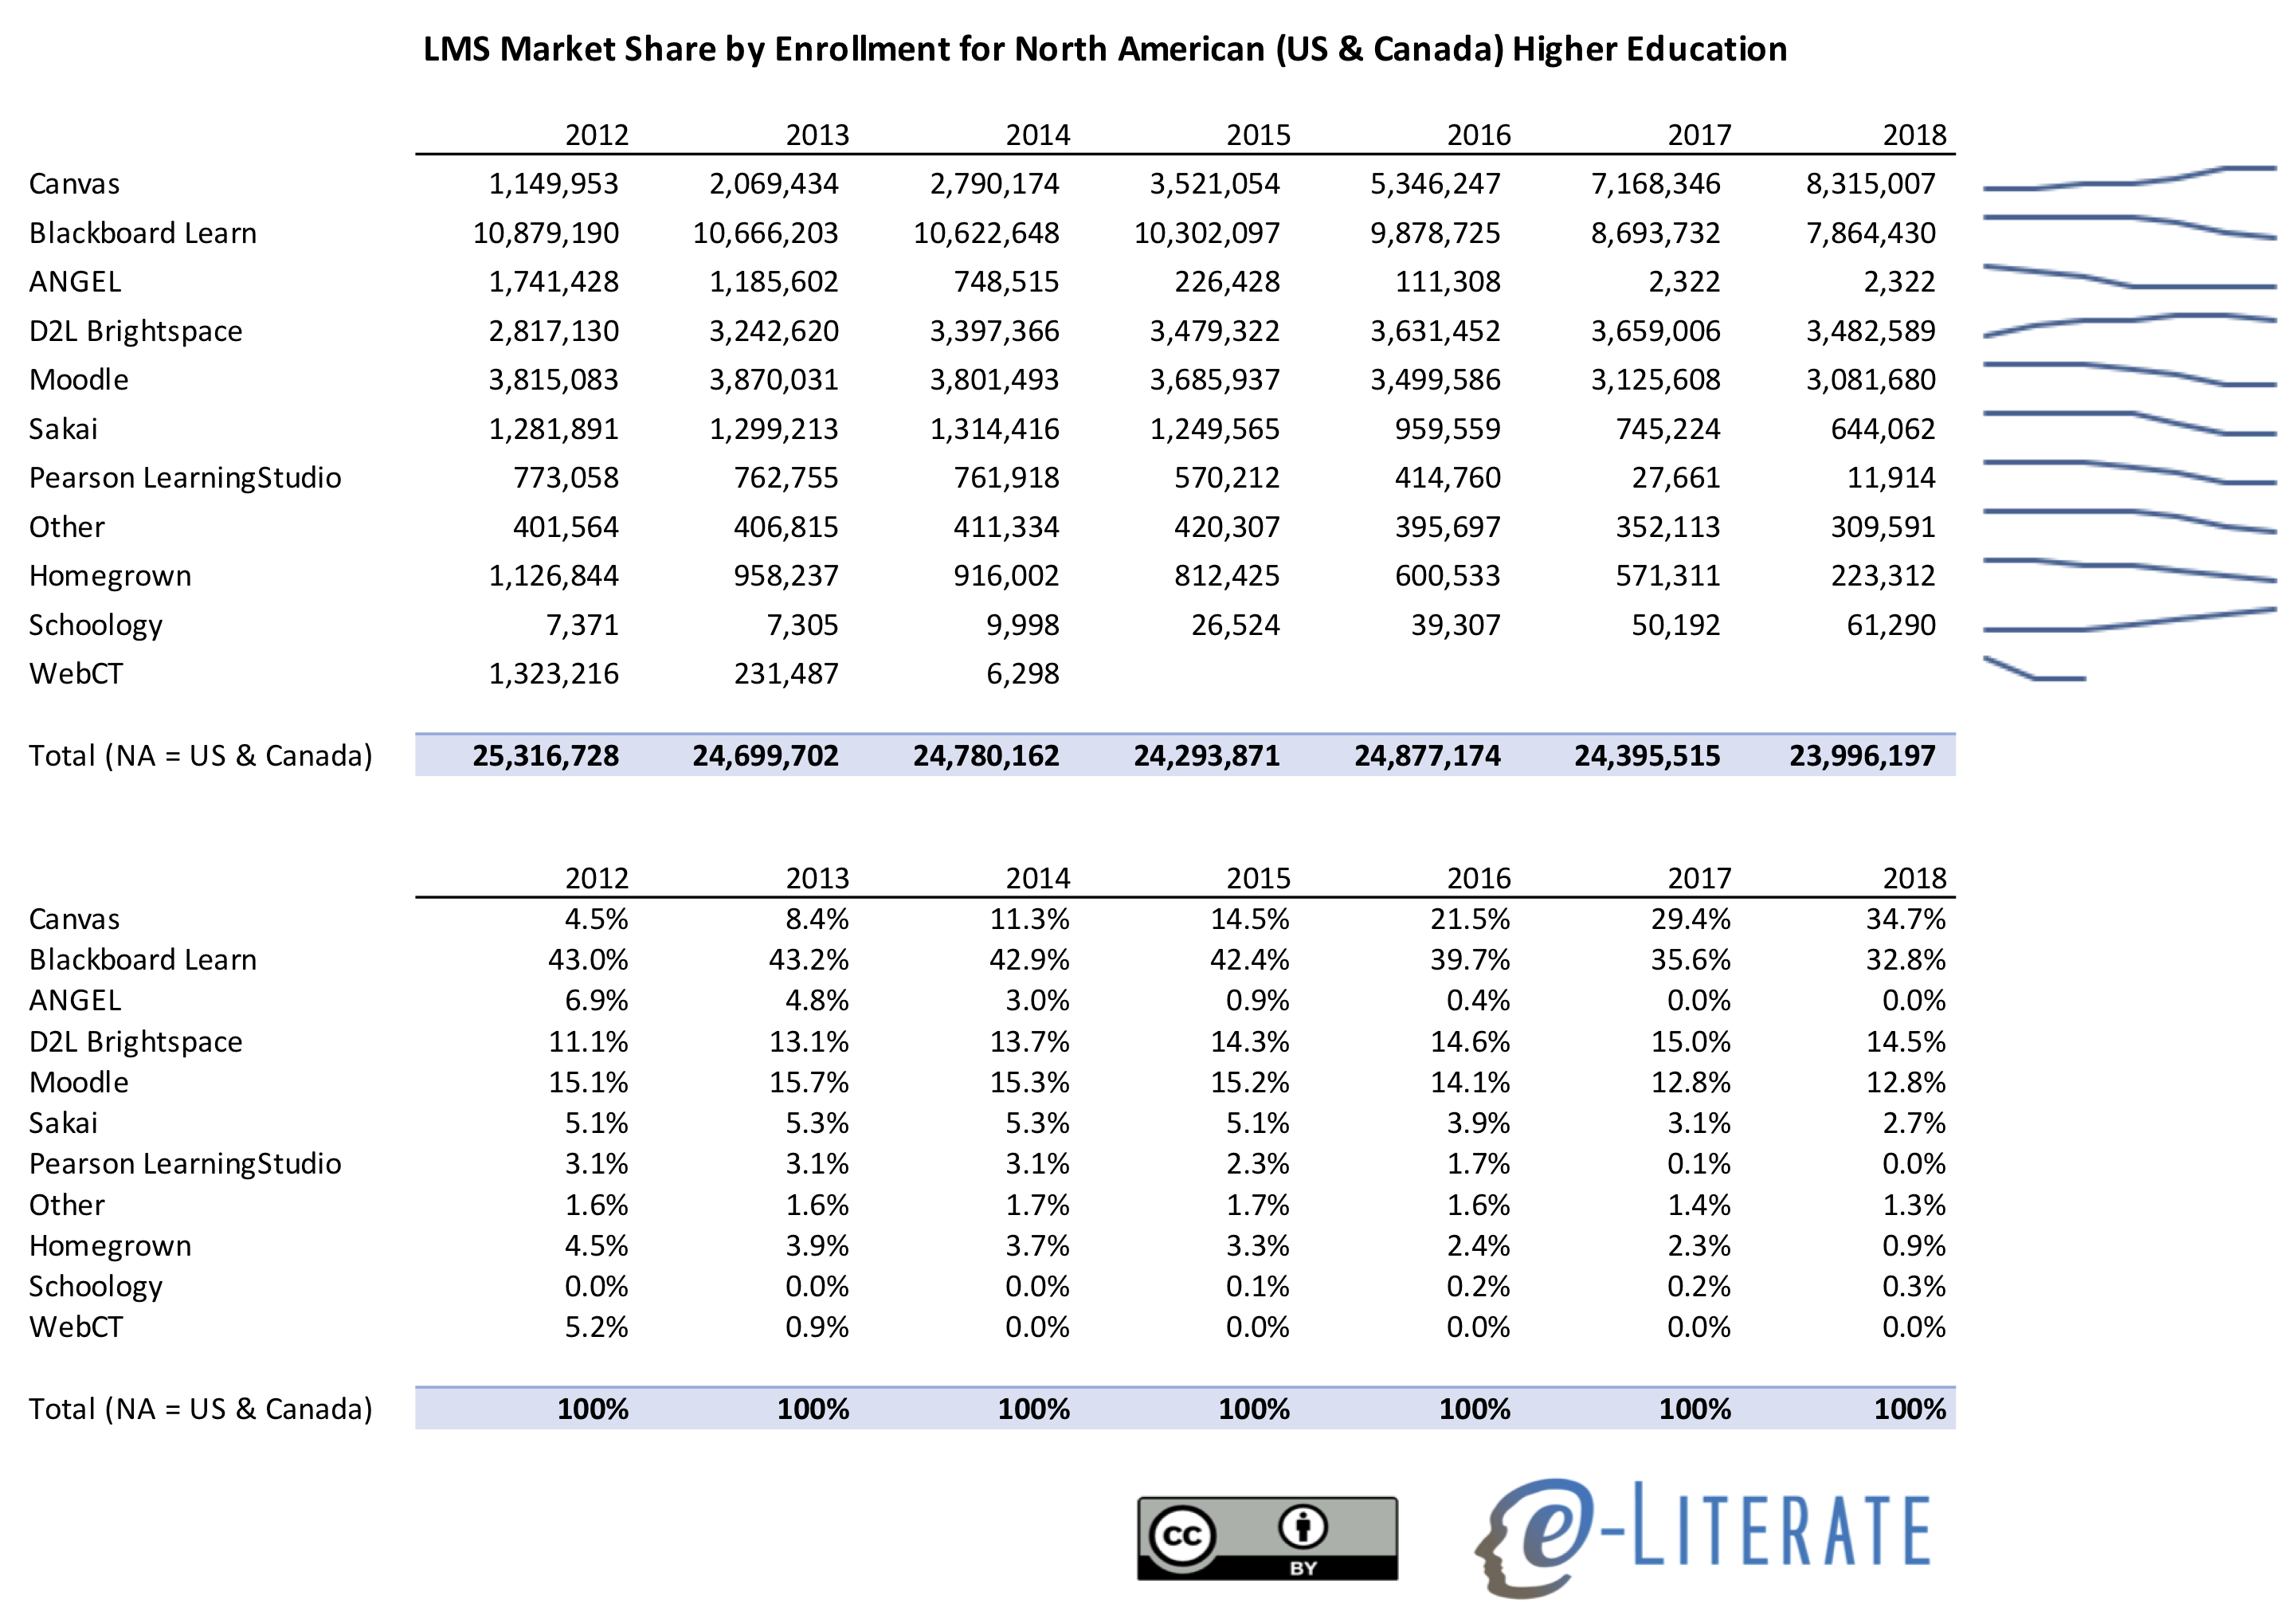
    In this view below we share North American (US and Canada combined) total enrollment for LMSs that are primary – that is, available for the entire institution. Total enrollment in this case means the institutional student count, but it does not imply that all students at that institution actually have courses using the LMS (see comment below from John Fritz). It is important to note that during an LMS transition there is often a period of time (6 – 18 months) where two systems overlap, with both available to the school. Therefore the total market share enrollments will be somewhat higher than actual total enrollments, as a subset of LMS-transitioning institutions will be counted twice.

    You can download a spreadsheet version here.

    LMS Market Share by Enrollment NA HE

    Some notes on the data worth considering:

    • Canvas has not just surpassed Blackboard Learn in this updated view, 35% to 33% – it has also expanded its lead as the most-adopted LMS in North American higher ed markets (while Moodle has clear lead worldwide in total installed base).
    • D2L Brightspace has been in third place for NA HE markets since 2016 when viewing by enrollments.
    • Moodle is fourth and has been dropping in recent years.
    • The top view of total enrollments adds in the effect of changing enrollments – both at a national level and an institutional level.
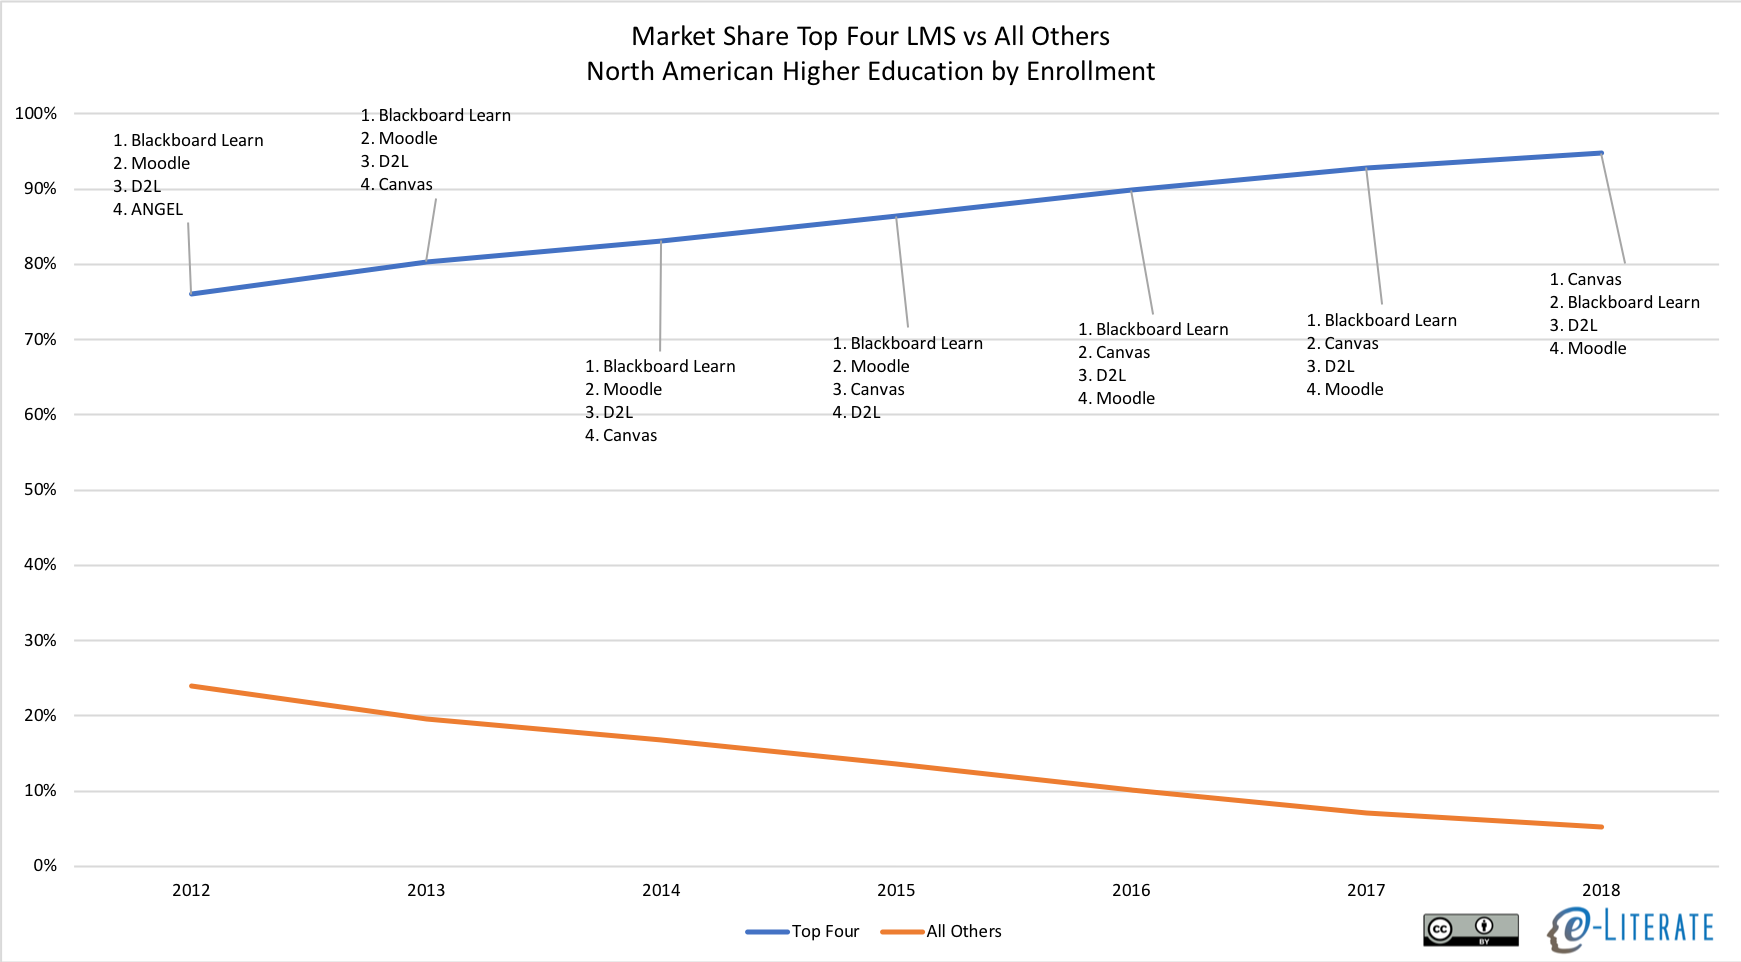
    • In the past five years, the LMS Market for North American higher ed has become increasingly dominated by “the Big Four” (Instructure Canvas, Blackboard Learn, D2L Brightspace, Moodle) for institution-wide adoptions; the aggregate market share of year’s top four systems moving from 80% to 95% in past five years.

    This last point deserves more analysis. There are other systems gaining new institutional clients (think Schoology here, or think CBE-specific platforms like Motivis), but they are mostly picking up either small schools or being adopted for specific programs and not for the entire institution.

    Consolidation of NA HE LMS Market

    Expect more coverage as we enter ed tech fall conference season.

    Update 8/3: Added sentence in third paragraph to clarify usage of total enrollment terminology.

  • Response to MoodleNews: Some considerations for critical reading of market sizing claims

    Response to MoodleNews: Some considerations for critical reading of market sizing claims

    There is an interesting post at MoodleNews titled “Open Source LMS Alive And Well: Moodle Breaks World Higher Ed Records, Tops North America, Grows Everywhere” looking at some of our recent LMS market data, focusing primarily on what the data reveal about open source systems such as Moodle, Sakai, Claroline, and Chamilo.

    Open Source LMS Alive And Well Moodle Breaks World Higher Ed Records, Tops North America, Grows Everywhere

    We welcome the usage of our data posted at e-Literate for these purposes, ((That’s why the blog is available for use under a Creative Commons Attribution license.)) but there are some misunderstandings evident in the MoodleNews post that we see too often in critical readings of market sizing reports. Unfortunately the misreadings can cloud otherwise valuable analytical reporting.

    The latest e-Literate report on “active LMS” shows Moodle as the incontrovertible LMS leader in global Higher Ed for primary and secondary systems, including North America.

    Incontrovertible seems quite strong, and we at e-Literate try to be very careful in our language and we rarely use words like incontrovertible or unequivocal. ((For the record, in the 14 year history of e-Literate, the former has been used one time and the latter five times.)) The reason is that for most people reading the data is a translation exercise. There is a need to understand the level of confidence the reader should have and what the limits of the claims are.

    It is useful that MoodleNews called out the global nature of data and measure of primary and secondary systems.

    Assuming it uses data provided by self-reporting service LISTedTECH from the last month, it shows dominance in every region, unsurmountable everywhere but the US, and healthy growth rates. The report mentions the “LMS long tail” as well as “the Big Four” (Moodle, Blackboard, Instructure Canvas and D2L Brightspace) but by their own accounting a more accurate distinction would be “the big one.”

    The data set used from our partners LISTedTECH is not a self-reporting service. Read this post for more information on the multiple channels of data collection used.

    But unsurmountable comes out of the blue. The whole point of doing reports like we do is that we don’t know for certain what the future trends will be, and we gather the data to reduce uncertainty. A while back, many would have said that Blackboard has an insurmountable dominance in North America, but we have seen major changes that would have made those claims invalid.

    I can see the argument for describing Moodle as “the big one” as an alternate description to “the Big Four”.

    LISTedTECH sample (apparently totaling 12,879 active LMS) lists 1,419 active Moodle sites in Higher Ed for North America, self-acknowledged as their most complete dataset. It appears that the advantages in Canada compensate for Instructure Canvas’ growth in the US. In July, it had listed 1,000 sites only for Higher Ed in the US.

    The first sentence is a good example of characterizing the data in a useful way, as it gives the reader a sense of the data set while also clarifying usage in a specific global region.

    Unfortunately the article then jumps into some confusing claims based on misreading the data descriptions. The June 2017 post captured percentage of primary systems at degree-granting institutions for each of four global regions with North America = US and Canada combined, the July 2018 post captured primary LMS in … US colleges and universities, and the August 2018 post captured total counts of both primary and secondary system usage in six global regions. We chose this latter method for the August post due to the frequency of long tail and open source LMS systems being used as secondary systems (i.e. some other LMS is the campus standard, or primary system). There is little basis for concluding that Moodle’s advantages in Canada compensate for Instructure Canvas’ growth in the US.

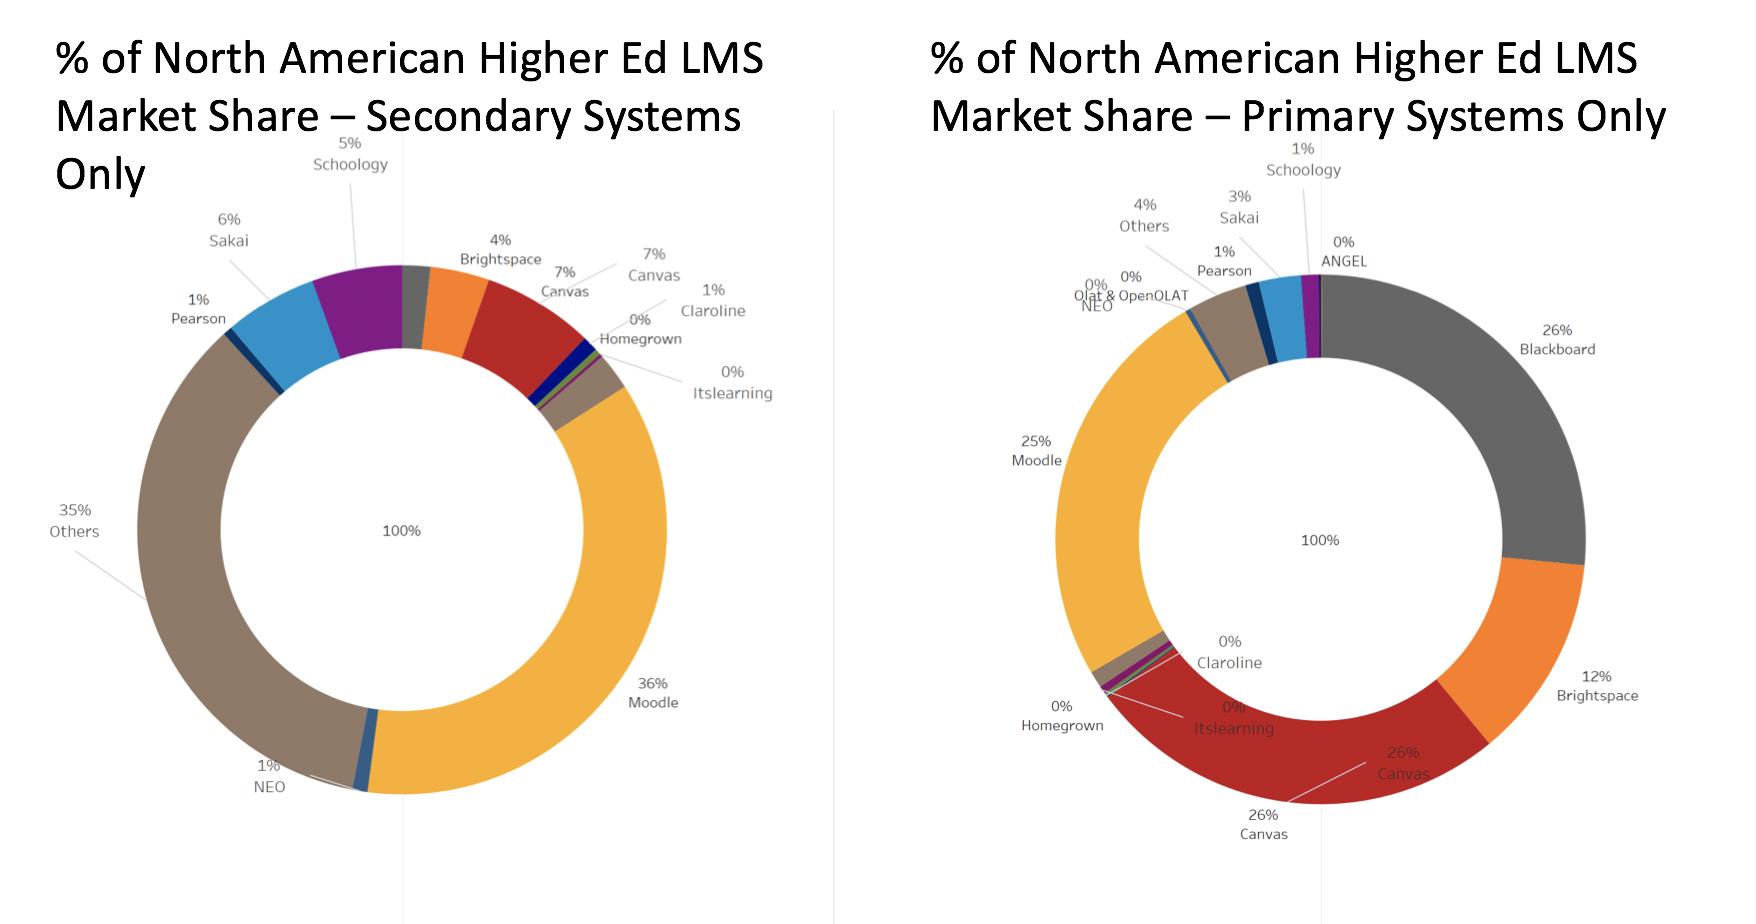
    The larger point here is that there are lots of ways to slice and dice data that end up with similar-lookinggraphs that represent different things – it’s important to read the legends and surrounding text carefully. To give a sense on the issue of primary vs. secondary systems  for North America, consider the difference shown below. ((Graphic shown as clarification, not present in articles referenced by MoodleNews.))

    With MoodleNews’ natural focus on Moodle, it would be accurate to note that Moodle is used quite frequently as a secondary system.

    For comparison, official stats at moodle.net set the total figure at 11,490 as of writing. 9,776 for the US, the biggest Moodle nation; 1,714 for Canada. Moodle does not offer discriminated site data for Higher Ed only.

    This is a helpful comparison and description with a different data set.

    Unfortunately, I need to be careful with further quotations. MoodleNews does not use a creative commons license and clearly limits usage based on the site’s terms of use. So the remainder of this post will have to be limited to short descriptions.

    There is a useful section looking at Moodle’s shares in six different global regions. The main caution I would add comes from our November 2017 post describing the data.

    Market share information provided in percentages and trends are more reliable than absolute counts outside of North America. When we do provide absolute numbers, we advise caution for readers or subscribers to not over-interpret the absolute numbers, at least without us providing additional details to keep the data in context.

    But in this case, MoodleNews also included the percentages for each region, which is helpful.

    The next four paragraphs all focus on market trends (year over year comparisons) that cannot be supported by the data (see above).

    At the end of the MoodleNews post, there is some valuable commentary about other (non-Moodle) open source LMS system and the origins and deployments across various regions.

    Given these clarifications, I would also add the the MoodleNews title has some serious flaws.

    All-in-all, it’s good to see valuable discussions spawned from our CC-BY licensed posts. But readers should be cautios when trying to understand market sizing data and make comparisons and trends analysis carefully.

    Update 8/26: Please see comment from Martin Dougiamas clarifying that MoodleNews “is not associated or affiliated with the Moodle organisation in any way”.