e-Literate

Present is Prologue

Tag: data

  • The Cengage-MHE Merger and Data Danger

    The Cengage-MHE Merger and Data Danger

    EdSurge has a good piece up about the U.S. Public filing submitted by the Scholarly Publishing and Academic Resources Coalition (SPARC) with the U.S. Department of Justice opposing the merger between Cengage and McGraw-Hill. In addition to the expected fare about pricing and reduced competition, there is a surprisingly fulsome argument about the dangers of the merger creating an “enormous data empire.”

    Given that the topic at hand is an anti-trust challenge with the DoJ, I’m going to raise my conflict of interest statement from its normal place in a footnote to the main text: I do consulting work for McGraw-Hill Education and have consulting and sponsorship relationships with several other vendors in the curricular materials industry. For the same reason, I am recusing myself from providing an analysis of the merits of SPARC’s brief.

    Instead, I want to use the data section of their brief as a springboard for a larger conversation. We don’t often get a document that enumerates such a broad list of potential concerns about student data use by educational vendors. SPARC has a specific legal burden that they’re concerned with. I’ll briefly explain it, but then I’m going to set it aside. Again, my goal is not to litigate the merits of the brief on its own terms but rather explore the issues it calls out without being limited by the antitrust arguments that SPARC needs to make in order to achieve their goals.

    Let’s break it down.

    When is bigger worse?

    While I’m sure that PIRG’s concerns about the data are genuine, keep in mind that they have been fighting a long-running battle against textbook prices, and that the primary framing of their brief is about the future price of curricular materials. Their goal is to prevent the merger from going through because they believe it will be bad for future prices. Every other argument that they introduce to the brief, including the data arguments, they are introducing at least in part because they believe it will add to their overall case that the merger will cause, in legal parlance, “irreparable harm.” As such, that has to be the standard for them. It’s not whether we should be worried about misuse of data in general, but about whether this merger of the data pools of two companies makes the situation instantly worse in a way that can’t be undone. That’s pretty high bar. Each of their data arguments needs to be considered in light of that standard.

    But if you’re more concerned with the issues of collecting increasingly large pools of student data in general, and if you can consider solutions other than “stop the merger,” then there is a more nuanced conversation to be had. I’m more interested in provoking that conversation.

    What can be inferred from the data

    One question that we’re going to keep coming back to throughout the post is just how much can be gleaned from the data that the publishers have. This is a tough question to answer for a number of reasons. First, we don’t know exactly everything that all the publishers are gathering today. SPARC’s doesn’t provide us with much help here; they don’t appear to have any inside information, or even to have spent much time gathering publicly available information on this particular topic. I have a pretty good idea of what publishers are collecting in most of their products today, but I certainly don’t have a comprehensive knowledge. And it’s a moving target. New features are being added all the time. I can speak a lot more confidently about what is being gathered today than on what may be gathered a year from now. The further out in time you go, the less sure you can be. Finally, while publishers—like the rest of us—have thus far proven to be relatively bad at extrapolating useful holistic knowledge about students from the data that publishers tend to have, that may not always prove to be the case. So with those generalities in mind, let’s look at SPARC’s first claim:

    Like most modern digital resources, digital courseware can collect vast amounts of data without students even knowing it: where they log in, how fast they read, what time they study, what questions they get right, what sections they highlight, or how attentive they are. This information could be used to infer more sensitive information, like who their study partners or friends are, what their favorite coffee shop is, what time of day they commute from home to school, or what their likely route is.

    How much of that “more sensitive information” that SPARC claims can be inferred really logical to fear right now? Most of the scary stuff they speculate about here is location-related. Unless the application page specifically asks the student’s permission to use geolocation and the student grants it—I’m sure you’ve had web pages ask your permission to know your location before—then the best it can do is know the student’s IP address, which is a pretty crude location method. None of the place-based information is really accessible via any data that is collected through any courseware that I’m aware of today. The only exception I know of is attendance-taking software. How much of an additional privacy risk it is to know the attendance habits of students who are already known to have registered for a class in virtue of the fact that they are taking and using the curricular materials associated with the class is an open question.

    The other risk SPARC references specifically is knowledge of social connections. There are products that do facilitate the finding of study partners. Actually, the LMS market, which is roughly as concentrated as the curricular materials market, may have much more exposure to this particular concern.

    While I certainly wouldn’t want these data to be leaked by the stewards of student learning information, I suspect there is much better quality data of this sort that is more easily obtainable from other sources. Even in the worst case, if they got misappropriated and merged with consumer data sets, the incremental value of this information relative to what someone with ill intent could learn from the average person’s social media activity strikes me as pretty limited.

    Of course, the information value is a separate question from the responsibility of care. Students are responsible for the information that they post on their social media accounts. Educators and educational institutions have a responsibility of care for data in products that they require students to use. That said, we should think about both the responsibility of care and the sensitivity of particular data. Generally speaking, I don’t see the kind of location and and personal association data that publisher applications are likely to have as particularly sensitive.

    Anyway, continuing with SPARC’s brief:

    “We now have real time data, about the content, usage, assessment data, and how different people understand different concepts,” said Cengage CEO Michael E. Hansen in an interview with P​ublishers Weekly​.135 McGraw-Hill claims that its SmartBook program collects 12 billion data points on students. Pearson now allows students to access its Revel digital learning environment through Amazon’s Alexa devices—which have been criticized for gathering data by “listening in” on consumers.

    Once gathered, these millions of data points can be fed into proprietary algorithms that can classify a student’s learning style, assess whether they grasp core concepts, decide whether a student qualifies for extra help, or identify if a student is at risk of dropping out. Linked with other datasets, this information might be used to predict who is most likely to graduate, what their future earnings might be, how a student identifies their race or sexual orientation, who might be at risk of self-harm or substance abuse, or what their political or religious affiliation might be. While these types of processes can be used for positive ends, our society has learned that something as seemingly innocent as an online personality test can evolve into something as far-reaching as the Cambridge Analytica scandal. The possibilities for how educational data could be used and misused are endless.

    I realize that this is a rhetorical flourish in a document designed to persuade, but no, the possibilities really aren’t endless. If you can’t train a robot tutor in the sky by having it watch you solve more geometry problems, then you can’t bring Skynet to sentience that way either. I don’t want to minimize real dangers. Quite the opposite. I want to make sure we aren’t distracted by imaginary dangers so that we can focus on the real ones.

    I’m particularly concerned by the Cambridge Analytica sentence. “Something as seemingly innocent as an online personality test can evolve into something as far-reaching…”. The implication seems to be that Cambridge Analytica inferred enormous amounts of information from an online personality test. But that’s not what happened. The real scandal was that Cambridge Analytica used the personality test to get users to grant them permission to enormous amounts of other data in their profile. The kind of deeply personal data that people put in Facebook but don’t tend to put in their online geometry courseware. I don’t see how that applies here.

    Of course, the data that these companies collect in the future may change, as may our ability to infer more sensitive insights from it. Writ large, we don’t have to make the kind of cut-and-dry, snapshot-in-time decision that a legal brief necessarily advocates. Rather than making a binary choice between either blithely assuming that all current and future uses of student educational data in corporate hands will be fine or assuming the dystopian opposite and denying students access to technology that even SPARC acknowledges could benefit them, the sector should be making a sustained and coordinated investment in student data ethics research. As new potential applications come online and new kinds of data are gathered, we should be pro-actively researching the implications rather than waiting until a disaster happens and hoping we can up the mess afterward.

    Data permission creep

    SPARC next goes on to argue that since (a) students are a captive audience and essentially have no choice but to surrender their rights if they want to get their grades, (b) professors, who would be the ones in a position to protect students’ rights, don’t have a good track record of protecting them from textbook prices, and (c) nobody has a good track record of reading EULAs before clicking away their rights, there is a good chance that, even if the data rights students give agree to give away are reasonable today, there is a high likelihood that they will creep into unreasonableness in the future:

    Students are not only a “captive market” in terms of the cost of textbooks, they are a captive market in terms of their data. The same anticompetitive behavior that arose in the relevant market for course materials is bound to repeat itself in the relevant market for student data.

    As the market shifts toward inclusive access fees and all-access subscriptions, students increasingly will be required to use digital course materials as a condition of enrolling in a course. Even if a student is not automatically subscribed, they may be enrolled in a course using digital homework, where a portion of a student’s grade depends on purchasing an access code, accepting the terms of use, and potentially surrendering data in the process of completing assignments. This is a new dimension of the principal-agent problem. In the same way that it is a foregone conclusion that students will need to purchase assigned materials regardless of the price, it is also a foregone conclusion that they will need to accept the terms of use.

    The graph of textbook prices since 1980 in Section 1.1 illustrates what can happen when publishers engage in coordinated pricing practices in a market where consumers have little power, as we discussed in Section 4.1. The same problem could repeat itself in terms of the ever expanding permissions granted under terms of use. Just as professors are sometimes unaware when the price of a textbook goes up, they may not be aware when the terms of use change in a way that may be unacceptable to their students.

    Therefore, there is potential for publishers to inflate the permissions they require students to grant in exchange for using a digital textbooks in the same way that they have inflated prices through coordinated behavior. Students will not only be paying in dollars and cents, but also in terms of their data.

    I find the permissions creep argument to be compelling for several reasons. First, the question of whether people should have a right to control how their data are used is separable from the question of known harm that abuse of those data could cause. Students should have right to say how their data can be used and shared, regardless of whether that use is deemed harmful by some third party.

    Second, there is an argument that SPARC missed here related to human subjects research. Currently, universities are required by law to get any experimentation with human subjects, including educational technology experiments, approved by an IRB. This includes, but is not limited to, a review of informed consent practices. Companies have no such IRB review requirement under current law. Companies with more data, more platforms, and bigger research departments can conduct more unsupervised research on students. For what it’s worth, my experience is that companies that do conduct research often try to do the right thing. But that should be small comfort, for a number of reasons.

    First, there is no generally agreed upon definition of what “the right thing” is, and it turns out to be very complicated. When is an activity research “on” students, and when is it “on” the software? If, for example, you move a button to test whether doing so makes a feature easier to find, but awareness of that feature turns out to make a difference in student performance, then would the company need IRB approval? If the answer “yes,” and “IRB approval” for companies looks anything remotely like what it does inside universities today, then forget about getting updated software of any significance any time soon. But if the answer is “no,” then where is the line, and who decides? There is basically no shared definition of ethical research for ed tech companies and no way to evaluate company practices. This is not only bad for the universities and students but also for the companies. How can they do the right thing if there is no generally accepted definition of what the right thing is?

    Second, if IRB approval specifically means getting the approval of one or more university-run IRBs, and particularly if it means getting the approval of the IRB of every university for every student whose data will be examined, universities have not yet made that remotely possible to accomplish. Nor could they handle the volume. I believe that we do need companies to be conducting properly designed research into improving educational outcomes, as long as there is appropriate review of the ethical design of their studies. Right now, there is no way of guaranteeing both of these things. That is not the fault of the companies; it’s a flaw in the system.

    Fixing the student privacy permission problem would be hard to do in a holistic way. Some further legislation could potentially help, but I’m not at all confident that we know what that legislation should require at this point. I’ve written before about how federated learning analytics technical standards like IMS Caliper could theoretically enable a technical solution by enabling students to grant or deny permission to different systems that want access to their data, similarly to the way in which we grant or deny access to apps that want access to data on our phones. But that would be a long and difficult road. This is a tough nut to crack.

    The research problem is also tough, but not quite as tough as the privacy permission problem. I’ve been speaking to some of my clients about it in an advisory capacity and working on it through the Empirical Educator Project. It is primarily a matter of political will at this point, and the pressure to solve this problem is rising on all sides.

    More data means more privacy risk

    For our purposes, I won’t quote the entirety of SPARC’s argument on this topic, but here’s the nub of it:

    It is common sense that the more data a company controls, the greater the risk of a breach. Recent experience demonstrates that no company can claim to be immune to the risk of data breaches, even those who can afford the most updated security measures. The size or wealth of a company has proven no obstacle to potential hackers, and in fact larger companies may become more tempting targets. Allowing more student data to become concentrated under a single company’s control increases the risk of a large scale privacy violation.

    As a case in point, Pearson recently made the news for a major data breach. According to reports, the breach affected hundreds of thousands of U.S. students across more than 13,000 school and university accounts. Pearson reports that no social security numbers or financial information was compromised, but this is not the only kind of data that can cause damage. Compromising data on educational performance and personal characteristics can potentially affect students for the rest of their lives if it finds its way to employers, credit agencies, or data brokers.

    While state and federal laws provide some measure of privacy protection for student records, including limiting the disclosure of personally identifiable information, they do not go far enough to prevent the increased risk of commercial exploitation of student data or protect it from potential breaches.

    While we should be very concerned about student data privacy, I don’t think the number of data points an education company has about a student is a good measure of the threat level. Again, a merged Cengage/McGraw-Hill would not have the same kind of data that Facebook would. We have to think very specifically about these data because they are quite different from data on the consumer web. The number of hints a student asked for in a psychology exercise or the number of algebra problems a student solved do not strike me as data that are particularly prone to abuse. These sorts of information bits comprise the bulk of the data that such companies have in their databases today. There may very well be extremely serious data privacy issues lurking here, but they will not be well measured by the volume of data collected (in contrast with, say, Google).

    The point about the gaps in the laws is a much more serious one. Everybody has known for years, for example, that FERPA is badly inadequate. It is only getting worse as it ages. The Fordham paper cited by SPARC has some good suggestions. Now, if only we had a functioning Congress….

    Algorithms

    Again, I’ll excerpt the SPARC filing for our purposes:

    Algorithms are embedded in some digital courseware as well, including the “adaptive learning” products of the merging companies and some of their competitors. These algorithms can be as simple as grading a quiz, or as complex as changing content based its assessment of a student’s personal learning style….

    While algorithms can produce positive outcomes for some students, they also carry extreme risks, as it has become increasingly clear that algorithms are not infallible. A recent program held at the Berkman Klein Center for Internet and Society at Harvard University concluded categorically that “it is impossible to create unbiased AI systems at large scale to fit all people.” Furthermore, proprietary algorithms are frequently black boxes, where it is impossible for consumers to learn what data is being interpreted and how the calculations are made—making it difficult to determine how well it is working, and whether it might have made mistakes that could end in substantial legal or reputational consequences.

    Let’s disambiguate a little here. There are two senses in which an algorithm could be considered a “black box.” Colloquially, educators might refer to an adaptive learning or learning analytics algorithm that way if they, the educators using it, have no way of understanding how the product is making the recommendations. If an algorithm is proprietary, for example, the vendor might know why the algorithm reaches a certain result, but the educator—and student—do not.

    Within the machine learning community, “black box” means something more specific. It means that the results are not explainable by any humans, including the ones who wrote the algorithm. In certain domains, there is a known trade-off between predictive accuracy and the the human interpretability of how the algorithm arrived at the prediction.

    Both kinds of black boxes are very serious problems for education. In my opinion, there should be no tolerance for predictive or analytic algorithms in educational software unless they are published, peer reviewed, and preferably have replicated results by third parties. Educators and qualified researchers should know how these products work, and I do not believe that this an area where the potential benefits of commercial innovation outweigh the potential harm. Companies should not compete on secret and potentially incorrect insights about how students learn and succeed. That knowledge should be considered a public good. Education companies that truly believe in their mission statements can find other grounds for competitive advantage. This is another area that EEP is doing some early work on, though I don’t have anything to announce on it just yet.

    The second kind of black box—algorithms that are published and proven to work but are not explainable by humans—should be called out as such and limited to very specific kinds of low-stakes use like recommending better supplemental content from openly available resources on the internet. We should develop a set of standards for identifying applications in which we’re confident that not understanding how the algorithm arrives at its recommendation does not introduce a substantial ethical risk and does produce substantial educational benefit. If the affirmative case can’t be made, then the algorithm shouldn’t be used.

    Data monopolies

    I’m going to be a little careful with this one because, again, I am recusing myself from commenting on the merits of the brief, and this particular data topic is hardest to address while skirting the question before the DoJ. But I do want to make some light comments on the broader question of when combining different educational data sets is most potent and therefore most vulnerable to abuse.

    From SPARC:

    One lesson learned from the rise of technology giants like Facebook is that preventing platform monopoly from forming is far simpler than breaking one up. Given the vast quantity of data that the combined firm would be in a position to capture and monetize, there is a real potential for it to become the next platform monopoly, which would be catastrophic for student privacy, competition, and choice.

    For decades, the college course material market has been split between three giants. There is a large difference between a market split three ways and a market split two ways. As these companies aggressively push toward digital offerings and data analytics services, a divided market will limit the size and comprehensiveness of the datasets they are able to amass, and therefore the risk they pose to students and the market. So long as publishers are competing to sell the best products to institutions, and there is significantly less risk of too much student data ending up in one company’s hands.

    I won’t characterize the danger of combining publisher data sets beyond what I’ve already covered in this post. What I want to say here is that the bigger opportunity for potential insights, and therefore the bigger area of concern for potential abuse, may be when combining data sets from different kinds of learning platforms. I haven’t yet seen evidence that combining data across courseware subjects yields big gains in understanding regarding individual students. But when you combine data from courseware, the LMS, clickers, the SIS, and the CRM? That combination of data has great potential for both benefit and harm to students because it provides a much richer contextual picture of the student.

    Irreparable harm

    While nothing in this post is intended to comment directly on the matter before the DoJ, the phrase that frames the anti-trust argument—”irreparable harm”—is one that we should think about in the larger context. I believe we have an affirmative obligation to students to develop and employ data-enabled technologies that can help them succeed, but I also believe we have an affirmative obligation to proceed in a way that prioritizes the avoidance of doing damage that can’t be undone. “First, do no harm.” We should be putting much more effort into thinking through ethics, designing policies, and fostering market incentives now. I don’t see it happening yet, and it’s not even entirely clear to me where such efforts would live.

    That should trouble us all.
  • Christensen Scorecard: Data visualization of US postsecondary institution closures and mergers

    Christensen Scorecard: Data visualization of US postsecondary institution closures and mergers

    In 2013, Harvard Business professor Clayton Christensen made a bold prediction based on his ubiquitous innovation theory that maybe half of all postsecondary institutions could close within 10-15 years.

    (source: https://youtu.be/KYVdf5xyD8I, starting at 6:25)

    The scary thing is that 15 years from now, maybe half of the universities will be in bankruptcy, including the state schools. But in the end, I’m excited to see that happen.

    Christensen then doubled down on his predictions in 2017, humorously saying it might take nine years instead of ten.

    (source: https://youtu.be/4ljlUOV-Uj4, starting at 1:04:42)

    Q. Do you still believe, as you’ve said before, that as many as half of colleges and universities will be bankrupt or closed within a decade?

    A. Um, yes. [snip] Whether the providers get disrupted within a decade — I might bet that it takes nine years rather than 10. Maybe I’m too scared about the Harvard Business School to be rational about it. But we should worry.

    There have been plenty of articles written about these claims, but it has been frustrating that very few back up their analysis with data. One exception is Derek Newton’s article critiquing the claims in Forbes, titled “No, Half Of All Colleges Will Not Go Bankrupt”.

    Look at the numbers. In the 2013-14 year, there were 3,122 four-year colleges according to the Department of Education. In 2017-18, the most recent data, there were 2,902 – a drop of about 7% over four years. That could be disruptive. But numerically, all of school closures since Christensen made his 2013 forecast were four-year, for-profit schools, which fell from 769 in 2013 to 499 in 2017 – a drop of 270. Of all the colleges, at all levels, that have closed since 2013, 95.5% of them were for-profit institutions.

    Another exception is Michael Horn’s explanation of the predictions (he co-authored the New York Times op-ed from 2013, titled “Innovation Imperative: Change Everything”, that included the initial prediction). This 2018 post “Will half of all colleges really close in the next decade?” also sought to go back to original, more nuanced claims of 25% closures and mergers at the Christensen Institute.

    Translation? Our predictions may be off, but they are directionally correct.

    To that I emphasize one more piece of nuance. Ultimately we are really predicting a failure rate, made up of a combination of closures, mergers or acquisitions, and bankruptcies in which a college or university has the opportunity to restructure itself. Not all universities that “fail” will disappear. [snip]

    From 2004–2014, “Closures among four-year public and private not-for-profit colleges averaged five per year from 2004-14, while mergers averaged two to three,” according to Moody’s. Moody’s predicted in 2015 that that closure rate—out of 2,300 institutions—would triple by 2017, and the merger rate would double.

    Assuming that were true, and say that the rate held steady for 15 years, that would take out roughly 13% of existing higher education institutions right there.

    Thanks to our partners with our LMS Market Analysis service, LISTedTECH, we can now provide data visualizations to better evaluate the validity or likelihood of these claims. For the first time that I’m aware of, we have visualizations showing combined closures and mergers over time, broken down by sector and degree-type, and showing data 2-3 years in advance of IPEDS publications.

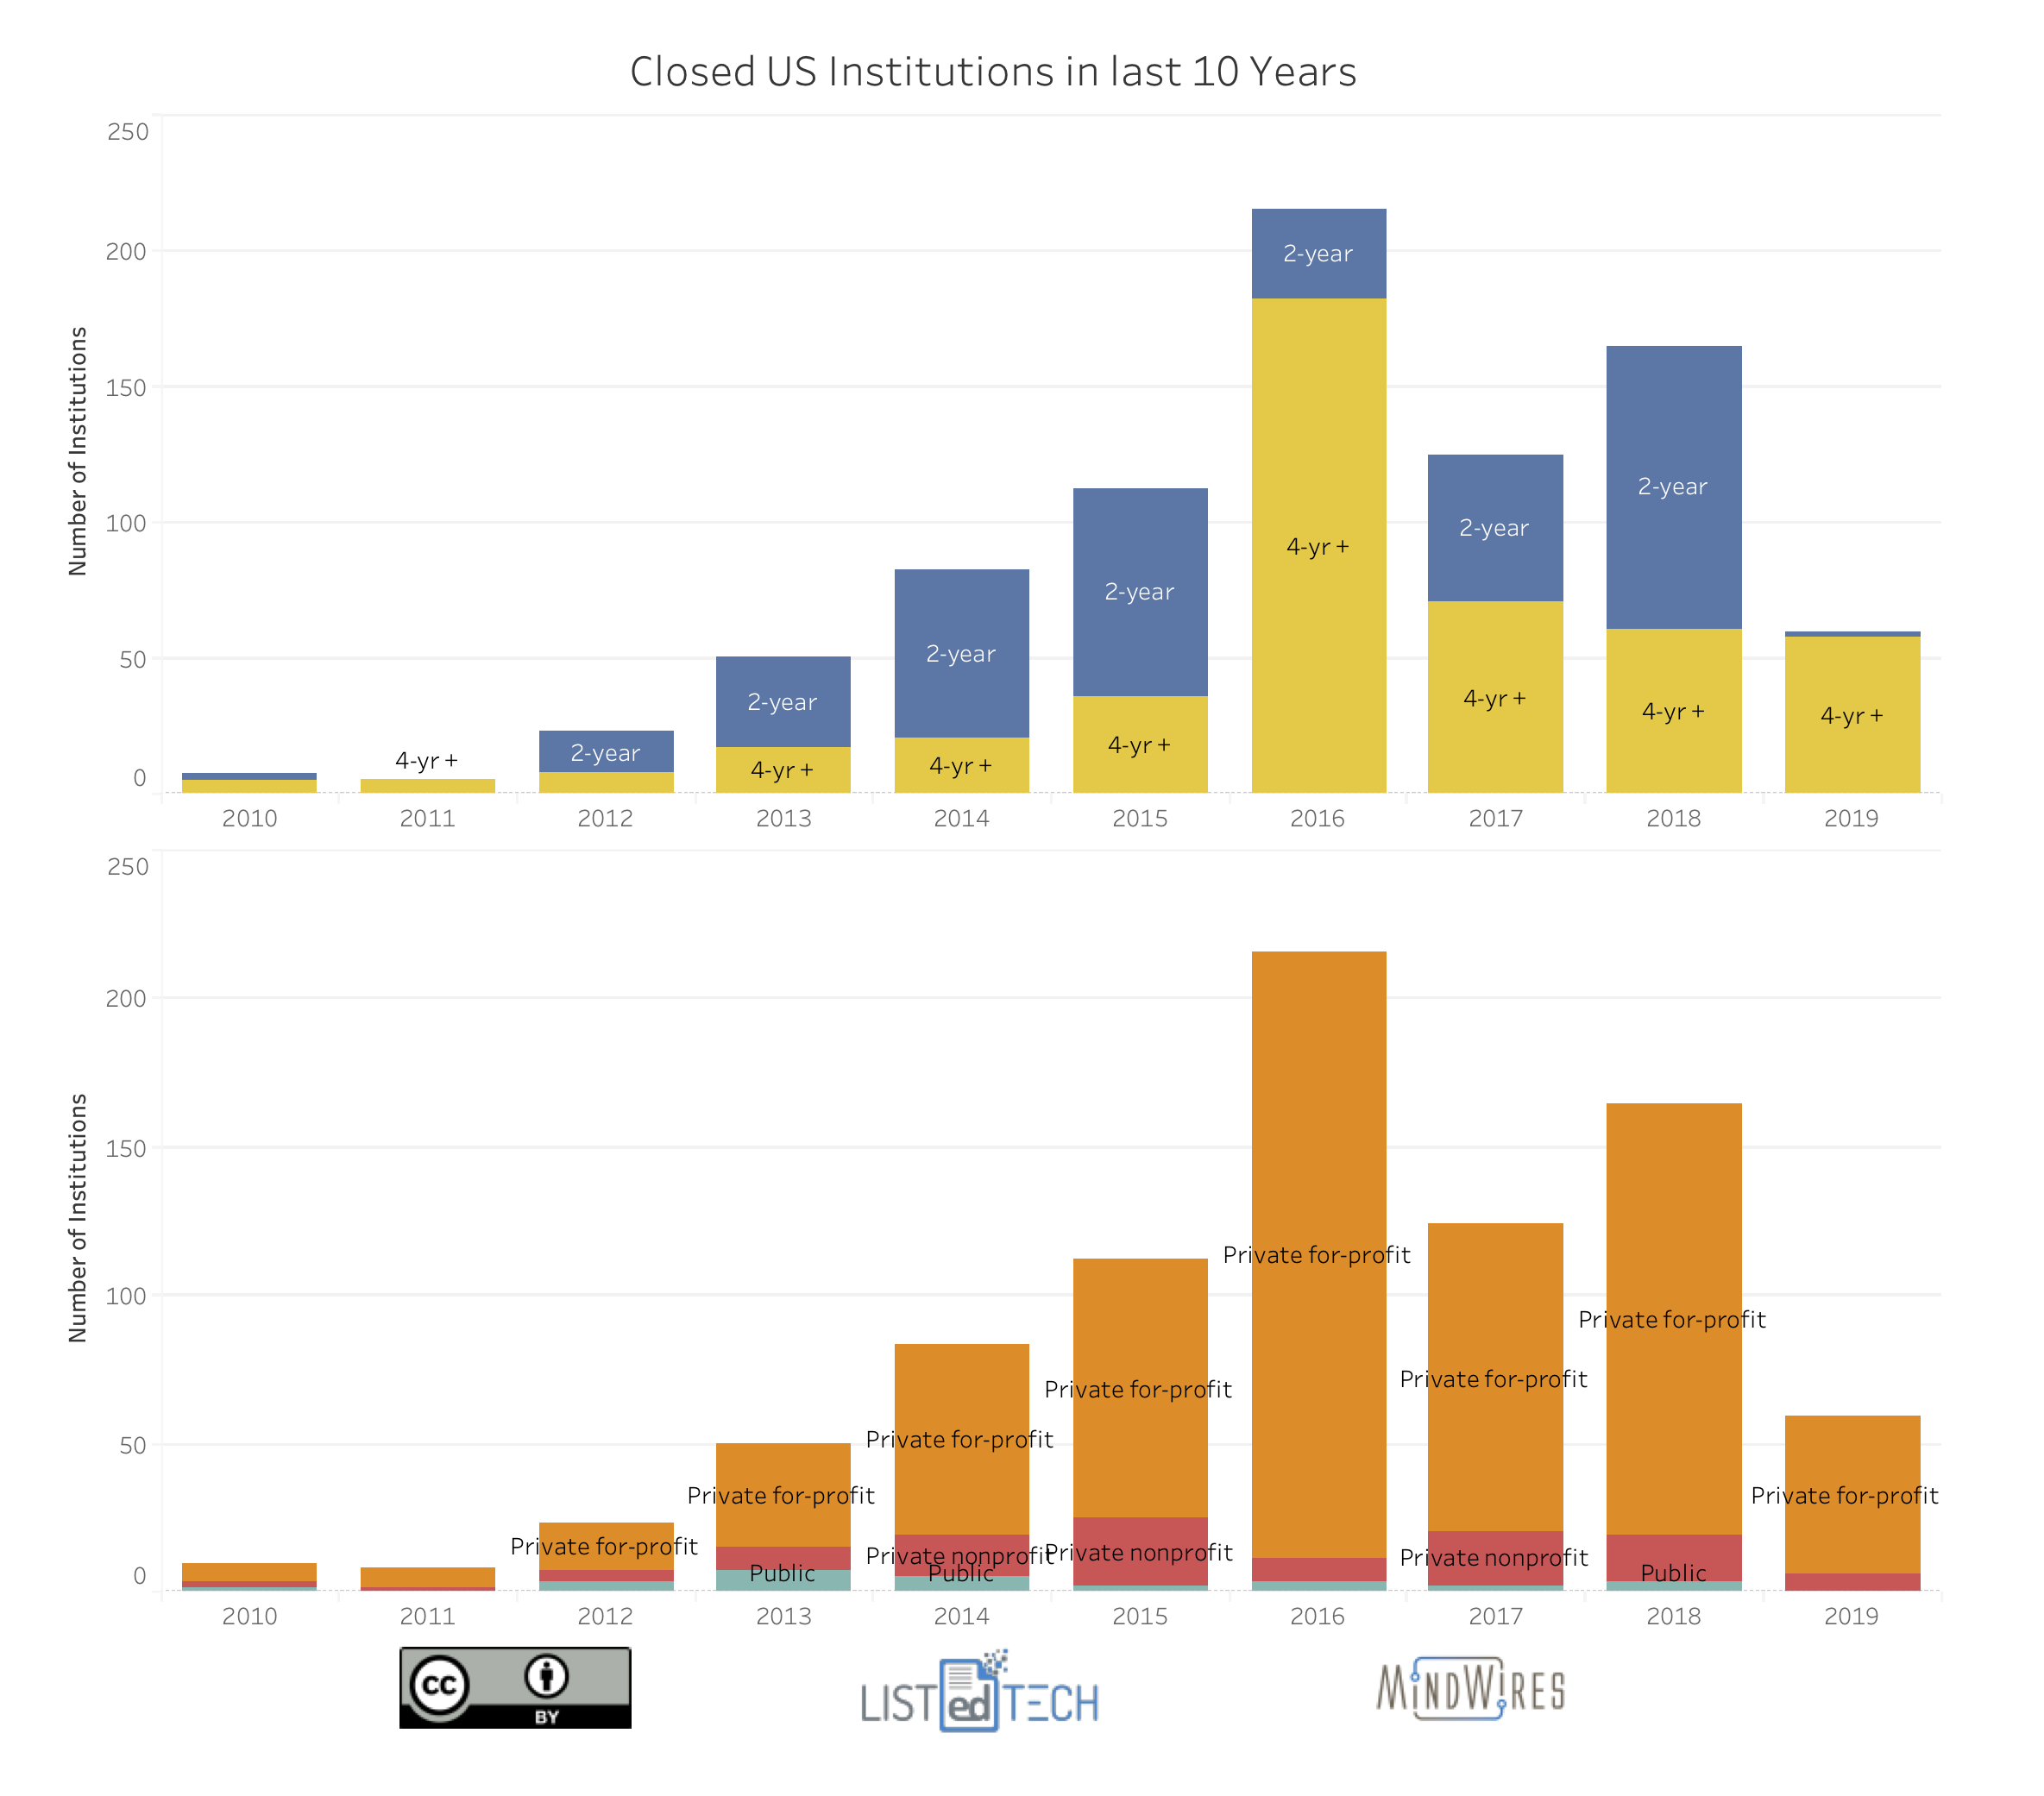
    The LISTedTECH data shown below tracks known closures and mergers, which have then been checked against both IPEDS and Federal Student Aid data sets. There are translation issues in all three data sets, so the data will not match 100% – probably more at the 80 – 90% confidence level. The first view shows combined closures and mergers per year, broken out by control and whether they are classified as 2-year or 4-year degree-granting institutions.

    Closed US higher ed schools over past decade

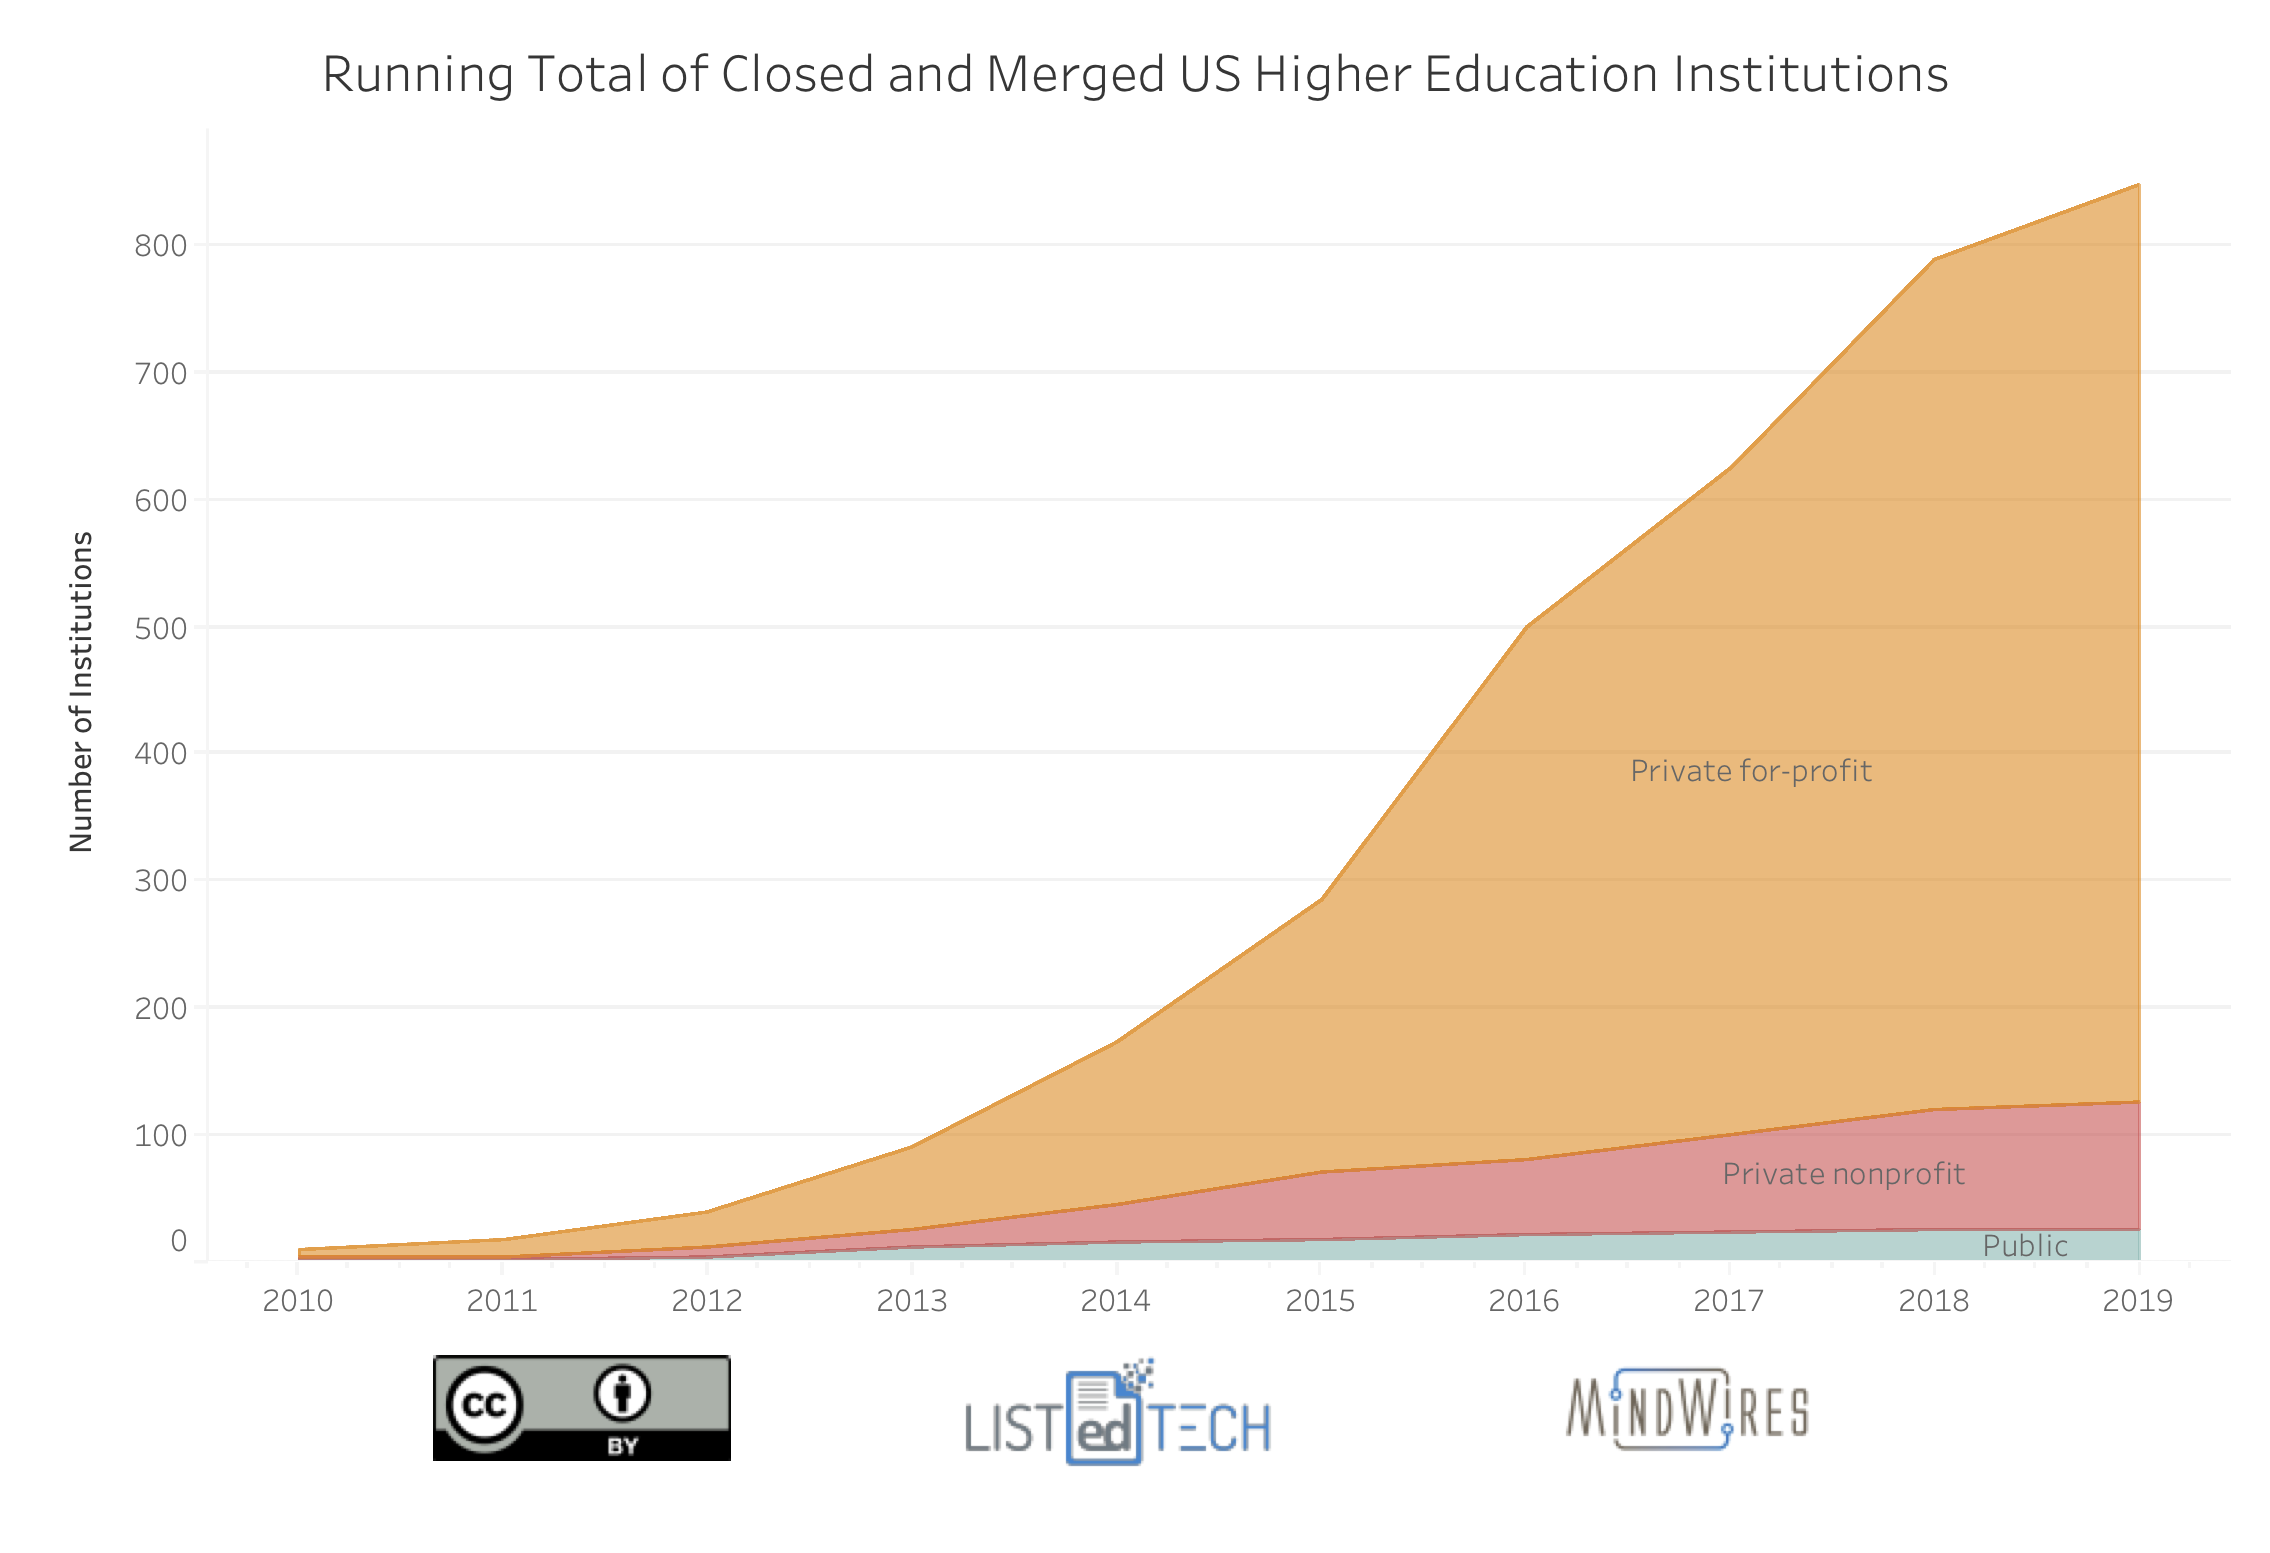
    As Derek Newton and Michael Horn pointed out, the vast majority of closures were from the for-profit sectors. Part of the dynamic at play is that when a large for-profit chain meets its demise (e.g. Corinthian Colleges, ITT, Westwood Colleges) or has a massive downturn (e.g. University of Phoenix) literally dozens of individual institutions close, whereas when a small private nonprofit college in New England closes, it is one school. Add to the that the massive drop in for-profit enrollments since 2012.

    The public sector data in 2013 and 2014 is largely driven by reorganizations in the University System of Georgia.

    Also note that the 2019 data only includes the first quarter.

    If we want to track the Christensen (and Horn) predictions, however, we need to view this data as a running total.

    Running total of closed and merged US higher ed institutions

    Let’s zoom out to capture the timeline of the most recent predictions of a decade from 2017, and let’s add the rough levels indicated (using bold row from this IPEDS table to define number of institutions).

    Running total of closed US institutions with trend lines

    If you include all degree-granting institutions (i.e. for-profits as well as private nonprofits and publics), then the current trends lines show that the 50% closure prediction by 2027 certainly seems feasible. Note, however, is that there are less than 1,000 for-profit institutions remaining as of Fall 2017 IPEDS data, and the rate of for-profit closures cannot continue more than another 8-10 years (best case / worst case, take your pick).

    There are quite a few stories recently about private nonprofit small-school closures, but the data thus far don’t show a rapid acceleration of closures. Some perspective is useful here.

    If you ignore the for-profit sectors, then the trend line for private nonprofit and public institution closures + mergers remains far below that needed to hit the 25% level described by Horn or the 50% level described by Christensen. None of this is to say that the trends moving forward will be linear, however. The rate of private nonprofit and public closures and mergers would need to at least triple to hit the more conservative level of 25% within a decade, a possibility that I would not reject out of hand. And it turns out that Moody’s was wrong – the rate of closures and mergers in this group did not triple from 2015 – 2017. Nevertheless, the data could get worse.

    We’ll share more information on this new data, but hopefully these visualizations provide a better sense of the trends on college closures and mergers.

  • Postscript on College Rankings Revisited: Description of methods

    Postscript on College Rankings Revisited: Description of methods

    There has been a lot of interest in Tuesday’s guest post by Steve Lattanzio from MetaMetrics on an alternate approach to college rankings that relies on algorithmic analysis of thousands of variables from the College Scorecard instead of typical cherry-picking of variables and subjective analysis. There have been some good questions posted on social media and blog comments asking for more information on the algorithms or assumptions behind the algorithms.

    While we linked to a corresponding article with more results and more detail on the methodology, we should have made that link more obvious. That article gives a much deeper description of the assumptions and methods used, including references to assumptions behind the theory and underpinnings of the approach. We have updated the Tuesday post with a direct link and include links in this postscript.

    The article “A New School of Thought for Our Thoughts on Schools” describes the challenge:

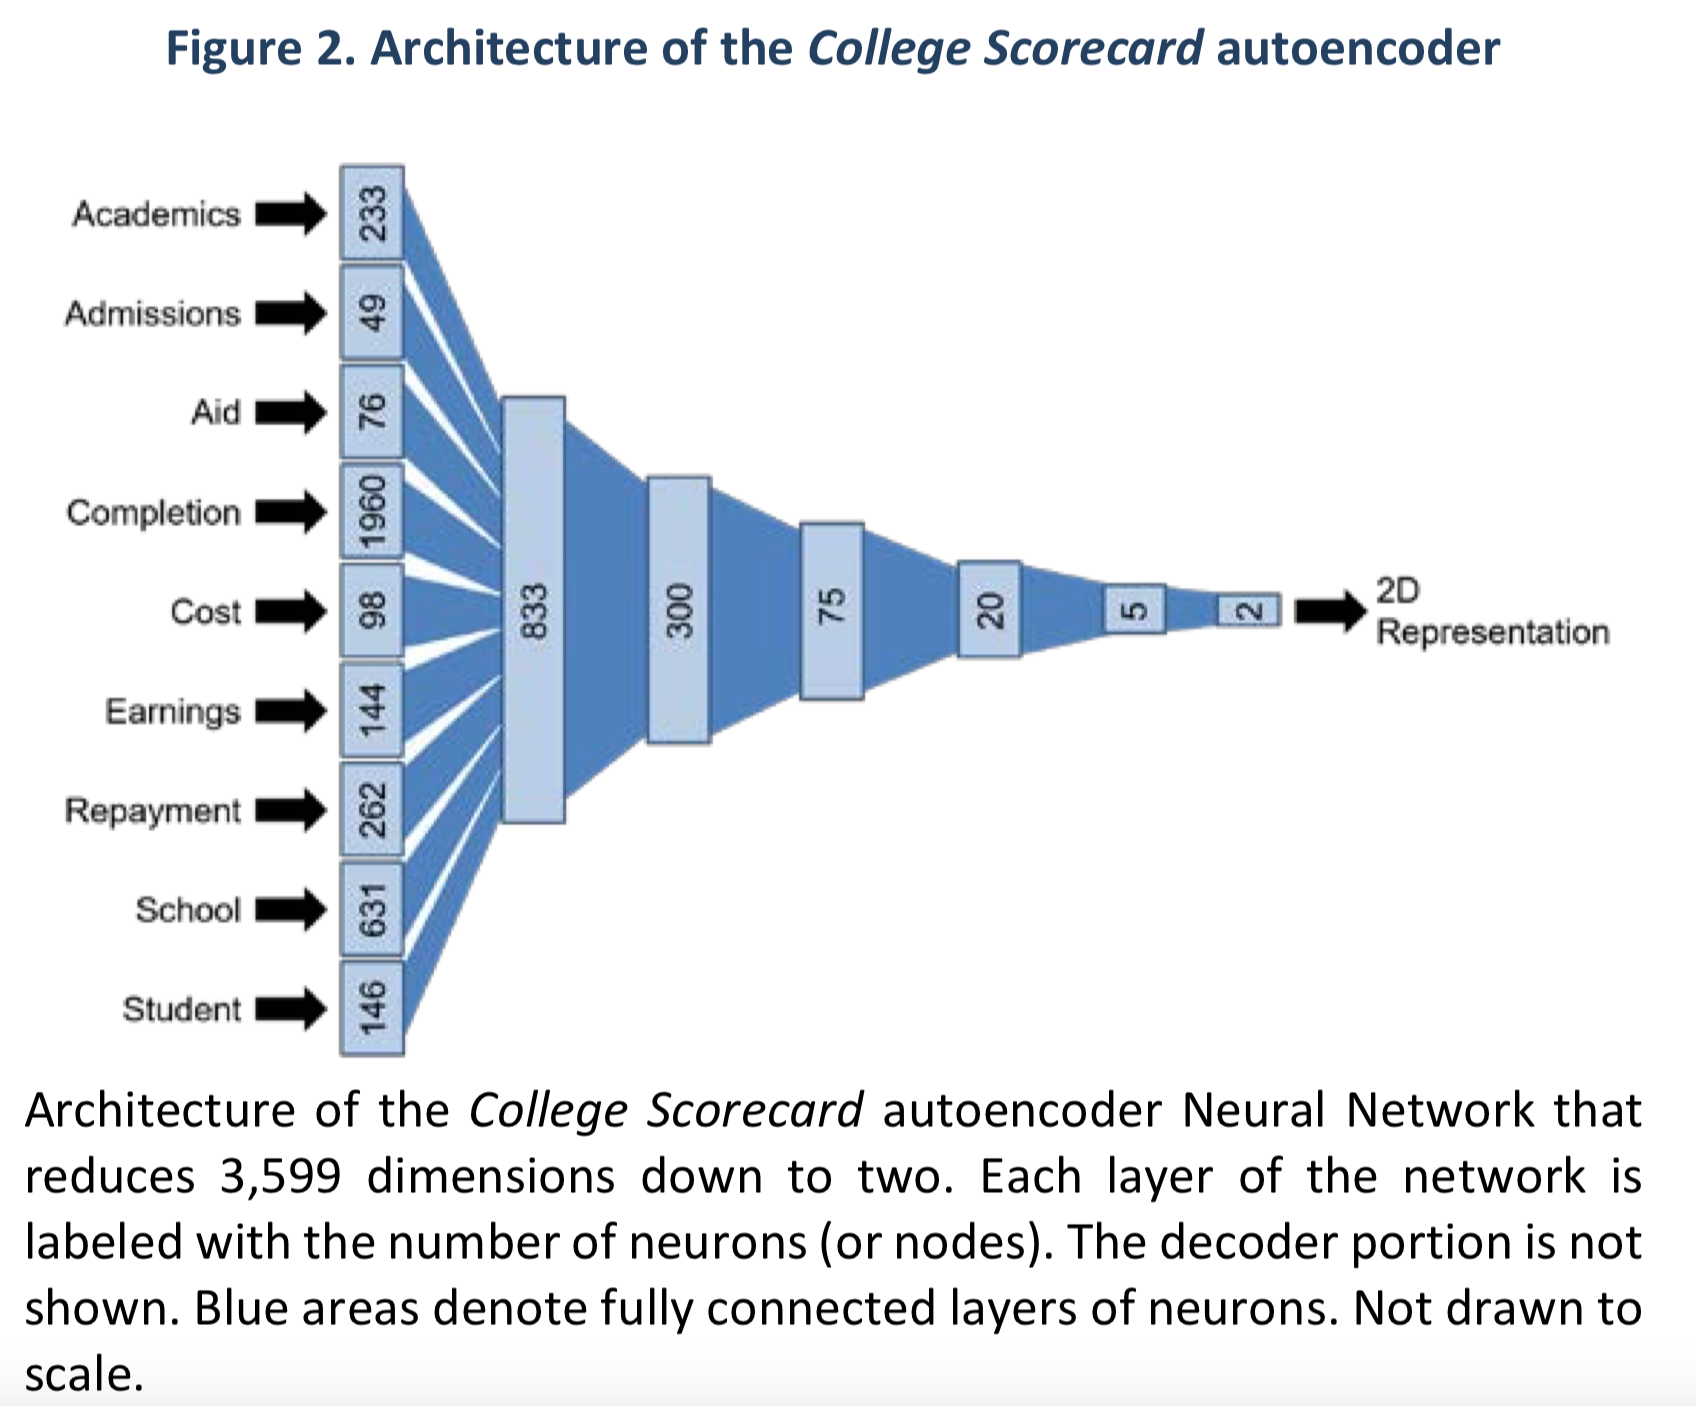
    The solution that we propose is to use neural networks to perform representational learning on the data. In other words, instead of manually going through the dataset and engineering a handful of features, we propose to use neural networks to automatically encode (autoencode) the information, including information about where data are missing, in a smaller dimensional space. Similar to principal components analysis (PCA), auto-encoding via neural networks is a dimension-reducing technique, but is more apt at handling variables that are nonlinearly related. In fact, it could be thought of as a more generalized version of PCA. Of course, such compression is lossy, but much of the information lost will be uninteresting noise and redundancies.

    The approach breaks up the 3,599 variables into a discrete number of categories, which then goes through successive layers of the neural network to generate a 2D representation.

    I won’t pretend to answer all questions by this summary, but instead I want to point out the source for describing this additional detail.

    Through all of this discussion, I want to remind readers that Steve in the original post was quite deliberate about what is not being claimed by this research.

    Out of an abundance of concern that the results of this experiment would be misrepresented, we’ll immediately point out that we make no claim that the rankings in this piece are the proper method for ranking these institutions, and we caution anyone from thinking of them as such.

    The real goal is further described in the New School article’s concluding paragraph:

    The methodology described in this paper and the pedagogical use-cases provide a rich framework for advanced analytics of post-secondary education—something that the consequence of the industry and the unwieldiness of the data demands. It is our hope that a future proliferation of similar work will promote further transparency in the post-secondary school market, more holistic approaches to data use, and ultimately more complete, fairer, and objective metrics that empower students to make the best decisions.

  • College Rankings Revisited: What Might an Artificial Intelligence Think?

    College Rankings Revisited: What Might an Artificial Intelligence Think?

    This post is from guest contributor Steve Lattanzio from MetaMetrics. While we do not tend to cover college rankings at e-Literate, we do care about transparency in usage of data as well as understanding opportunities where technology and data might inform students, faculty, administrators and the general educational community. The following post is an interesting exploration in the usage of the full set of College Scorecard data in a way that is understandable and usable. For people wanting a deeper description of the algorithms and assumptions, please see this corresponding article. For access to an interactive table to explore results, see this post.- ed

    Emphasis on might.

    Ranking colleges has become a bit of a national pastime. There are many organizations that publish “overall” rankings for our institutions of higher education (such as Forbes, Niche, Times Higher Education, and US News & World Report), each with their own methodologies.

    We don’t typically get the complete and precise picture of how these rankings are constructed. The common assertion by critics is that these methodologies, which are definitely subjective, are also quite arbitrary. They may seem complex, often relying on many different variables, but at the end of the day experts and other higher education authorities are making a set of choices about what data should be used and how to weigh those variables. What if those experts were just tweaking what variables to include and how to weigh them until they got results that “feel right” or meet some other criteria they had in mind? Some methodologies go a bit further and outright include human judgments, sounding the fudge-factor alarm. Furthermore, there is reason to be concerned about the fact that none of these rankings exist in a vacuum—it’s very possible that they are, to some extent, reflections of each other (see “herding” in the polling industry). At the same time and counter to herding, there’s a desire to provide a unique twist to rankings which leads to a lack of consensus about what the underlying construct should be behind overall college rankings.

    Against this backdrop, we now have access to ever-increasing amounts of data about our colleges. Newly released datasets like the College Scorecard present a vast trove of data to the public, enabling all sorts of new analytics. But while this provides an apparently more objective foundation for analysis, leveraging all of the data can be challenging.

    This led MetaMetrics to consider whether we could apply some more current machine learning methods to overcome these issues, the type of methods that we employ everyday in our K-12 research. Was it possible to have a computer algorithm take in a bunch of raw data and, through a sufficiently black-box approach, remove decision points that allow ratings to become subjective? Forgive me the gratuitous use of such a buzzword, but could an artificial intelligence discover a latent dimension hidden behind all the noise that was driving data points such as SAT scores, admission rates, earnings, loan repayment rates, and a thousand other things, instead of combining just a few of them in a subjective fashion?

    Out of an abundance of concern that the results of this experiment would be misrepresented, we’ll immediately point out that we make no claim that the rankings in this piece are the proper method for ranking these institutions, and we caution anyone from thinking of them as such. It is merely an alternative that we present that might be similar enough to other rankings to validate them, or different enough to invalidate them or this ranking. It is also possible that ranking colleges is an exercise in futility.

    The data

    Choosing a college is likely to be one of the most consequential decisions, financially and otherwise, of a postsecondary education consumer’s life. In an attempt to bring transparency to higher education and empower young Americans to make a more informed choice, the Obama administration created the College Scorecard in 2015.

    The College Scorecard contains thousands of variables for thousands of schools going back almost two decades. It’s a great initiative that allows someone to look at all of the usual suspects, such as average SAT scores, along with very specific things, such as the “percent of not-first-generation students who transferred to a 4-year institution and were still enrolled within 2 years.” The catch, however, is that there is a lot of missing data and only a minority of the possible data elements actually exist. It’s fairly straightforward to search, filter, or sort by specific fields of information for specific schools, but it’s not really clear how you could utilize all of the data. Consequently, most analytic efforts with the College Scorecard are likely to gravitate towards the archetypal and complete variables you would find in a much less ambitious dataset anyway. Our goal is to take advantage of all of the data available in the College Scorecard.

    The algorithm

    Traditional statistical analyses work best with clean and complete data that have nice linear relationships. These analyses are also going to have trouble handling too many variables at once. But cleaning and curating specific variables in the dataset present more opportunities for humans to unduly (wittingly or not) impact the final results.

    We also find ourselves lacking an independent variable to model. That is, we aren’t trying to predict one piece of data from a bunch of other data. We built an algorithm to find something not directly observable in the data that’s a driving force behind a lot of the directly observable things in the data. In machine learning, such a task is considered to be “unsupervised learning.”

    To tackle this problem, we use neural networks1 to perform “representational learning” through the use of what is called a stacked autoencoder. I’ll skip over the technical details, but the concept behind representational learning is to take a bunch of information that is represented in a lot of variables, or dimensions, and represent as much of the original information as possible with a lot fewer dimensions. In a stacked neural network autoencoder, data entering into the network is squashed down into fewer and fewer dimensions on one side and squeezed through a bottleneck. On the other side of the network, that squashed information is unpacked in an attempt to reconstruct the original data. Naturally, information is lost during this process, but it’s lost in a deliberate fashion as the AI learns how it can combine the raw variables into new, more efficient, variables that it can push through a bottleneck consisting of fewer channels and still reconstruct as much of the original data as possible. To be clear, the AI isn’t figuring out which subset of variables it wants to keep and which it wants to discard; it is figuring out how to express as much of the original data as possible in brand new meta-variables that it is concocting by combining the original data in creative ways. As noise and redundancies are squeezed out over the many layers of the deep neural network, the hope is that a set of underlying dimensions – ones that represent the most important, overarching features of the data – emerge from the chaos, with one being a candidate for overall college quality.

    The results

    The nature and context of the representational learning problem dictates how far you can reasonably compress a dataset. In this case, it’s reasonable to compress to as few dimensions as possible where the meanings of the dimensions are still interpretable and we retain some amount of broad ability to reconstruct the original data.

    It turns out that we were able to compress all of the information down to just two dimensions, and the significance of those two dimensions was immediately clear.

    One dimension has encoded a latent dimension that is related to things such as the size of the school and whether it is public or private (in fact, the algorithm decided there should be a rift mostly separating larger public institutions from smaller schools). The other dimension is a strong candidate for overall quality of a school and is correlated with all of the standard indicators of quality. It seems as if the algorithm learned that for higher education, if you must break it down into two things, is best broken down into two dimensions that can loosely be described as quantity and quality.

    Below are the top 20 colleges according to the AI and the resultant two dimensions.

    1.

    Duke University

    11.

    College of William and Mary

    2.

    Stanford University

    12.

    University of Southern California

    3.

    Vanderbilt University

    13.

    Wesleyan University

    4.

    Cornell University

    14.

    Yale University

    5.

    Brown University

    15.

    Massachusetts Institute of Technology

    6.

    Emory University

    16.

    Northwestern University

    7.

    University of Virginia

    17.

    Bucknell University

    8.

    University of Chicago

    18.

    University of Pennsylvania

    9.

    Boston College

    19.

    Santa Clara University

    10.

    University of Notre Dame

    20.

    Carnegie Mellon University

    Top 20 Colleges in the United States, according to our AI.2,3

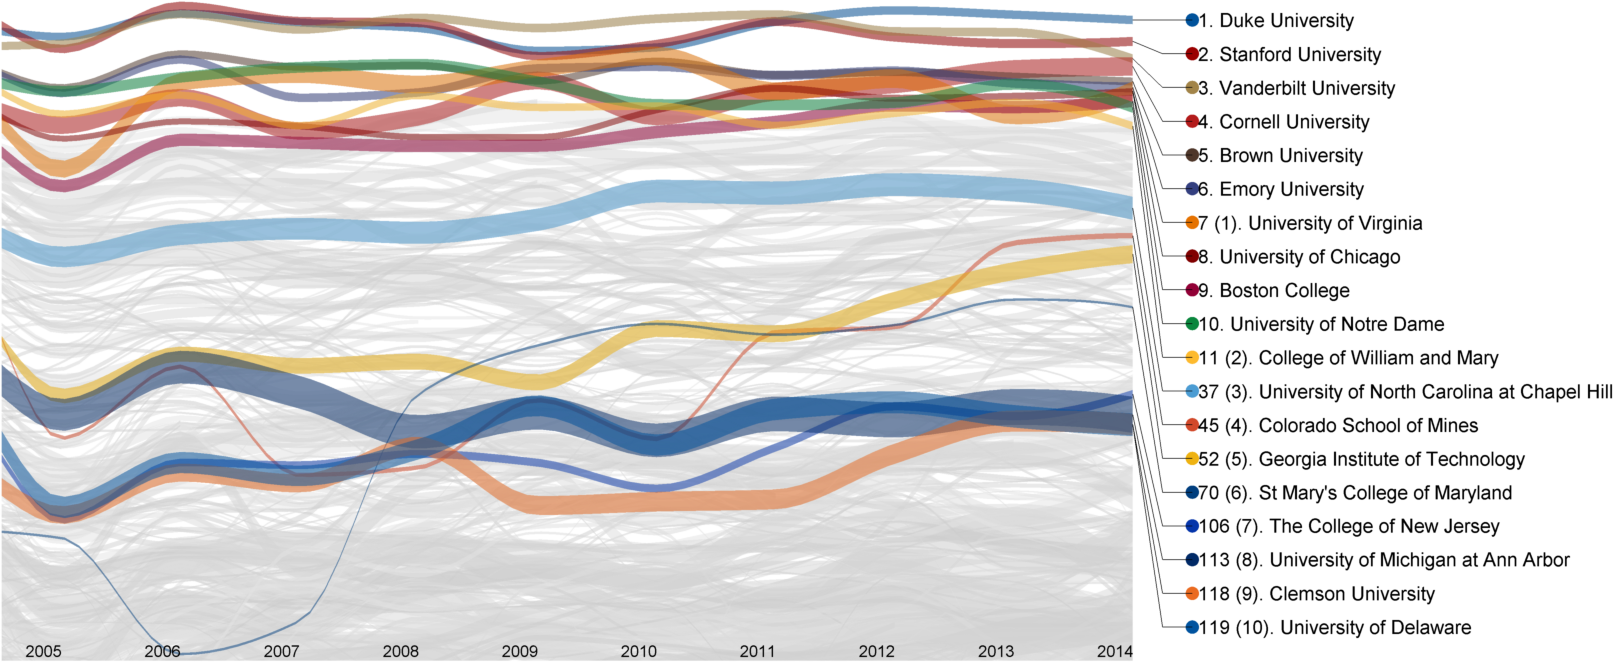
    Visualization of AI-based college rankings

    College quality between 2005-2014 for the top 10 private and top 10 public schools as of 2014. The line thickness is proportional to the size of the student population.

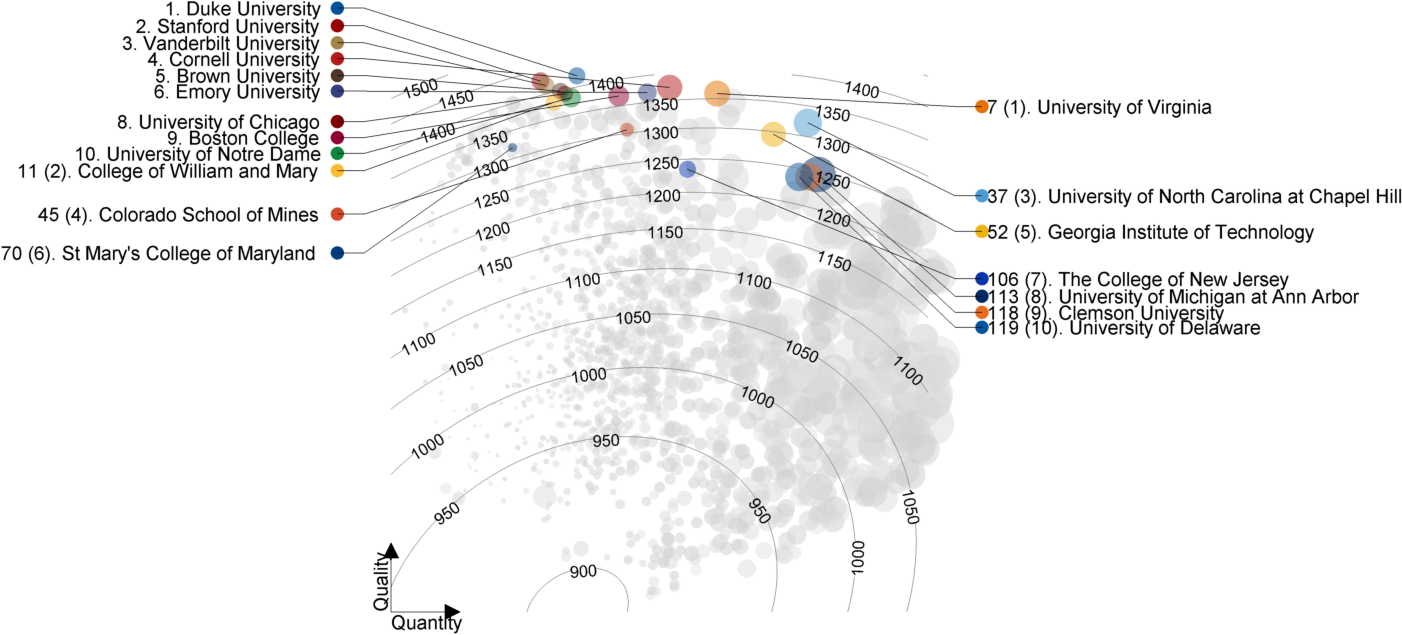
    Chart of quality vs quantity

    College quality versus quantity for the top 10 private and top 10 public schools in 2014. Circle area is proportional to the size of the student population. Approximate SAT score contour lines are superimposed.

    Most of the schools in the top 20 are present in the top 20 in at least one of the published rankings listed earlier. Seven schools—University of Virginia (7), Boston College (9), William and Mary (11), Wesleyan (13), Bucknell University (17), and Santa Clara University (19)—are the newcomers. Of those, the first four schools are reasonably close to being ranked in the top 20 in at least one other ranking, while the latter two are more surprising.

    The most conspicuous name is 19th ranked Santa Clara University, a private school of about 5,000 undergraduate students located in Silicon Valley. It is typically ranked in the low 100s (the consensus still places it in the top 10% of all schools) with its best ranking of 64 by Forbes. However, it is impressing the AI and likely disproportionately benefits from a more holistic use of the data instead of using only the typical metrics used to differentiate top schools.

    The most conspicuously missing names are the Ivy League schools Harvard (ranked 31st by the AI), Princeton (51), Dartmouth (23) and Columbia (26) along with Caltech (74) and Rice (25). It seems like blasphemy to rank Harvard and Princeton, arguably the most prestigious colleges in the United States, so far down. Caltech at 74 is probably the most jarring of all. However, we take this opportunity to remind you that the AI is not developing a metric strictly of prestige, reputation, the academic caliber of students, or earnings potential of its graduates, but something else that is different, but related.

    Duke, Stanford, and Vanderbilt are at the top of the rankings and in any given year any one of them can take the top spot according to the AI. All three schools are often, if not always, ranked in the top 20 in other published rankings. Duke sometimes makes the top five while Stanford does so more often.

    Although it goes against our human instincts, not too much weight should be given to the exact ranking of the top schools—relative to the variation in the rest of the field, the differences in quality are small and it’s very tight at the top.

    The caveats and more

    Throwing things through a black box is often a double-edged sword. You can avoid certain errors and biases that occur in human thinking, but algorithms often come with their own—or at least what we would consider—errors and biases. To an algorithm, data is data, and it’s all fair-game to use to meet some end. What if the neural network believes higher tuition rates, because they are associated with other favorable school characteristics, places a school higher on the dimension that encodes those things? A human would know that higher costs, without commensurate changes in other metrics, should count against a school. Sure, if corresponding quality was not reflected in other metrics, it’s likely the algorithm would mostly ignore the tuition data, but it might not actually lower the resulting quality output. That’s something humans bring to the table with their broad and vast real-world knowledge.

    Even more concerning, what if it uses racial demographics to do the same? Unsurprisingly, an algorithm that’s agnostic to what data it is fed has the potential to be politically and socially insensitive. One may think the solution is to just curate what goes into the black box, but there are often proxies for the same information that the algorithm can exploit. This is a commonly cited, controversial hazard of black box machine learning algorithms that should always be kept in mind.

    Additionally, these results are based on data aggregated across entire schools. Each student applying to or attending a school has a unique situation. There is much variation in a student population and the programs offered within a school. A single measure or ranking applied to a whole school does not tell you everything you need to know to make the best college decision, but it can provide some valuable context and some level of accountability for the schools themselves.

    Of course, there is the axiom that an analysis can only be as good as the data, and while the AI should be relatively robust to sporadic random data errors, systematic errors are another story.

    There are many more nuanced and technical caveats for this type of analysis. It is not perfect and the rankings should not be viewed as infallible. But when viewed among other college rankings, its validity is undeniable. It’s not merely a measure of prestige, and it addresses most of the concerns of critics of college rankings, while undoubtedly raising some new ones. However, the results somewhat “feel right.” The renowned “sabermetricianBill James was credited with saying, “If you have a metric that never matches up with the eye test, it’s probably wrong. And if it never surprises you, it’s probably useless. But if four out of five times it tells you what you know, and one of out five it surprises you, you might have something.’’ I think we might have something.

    Whether you are researching schools to apply to, are curious about your own alma mater, or generally curious, full results can be found in an interactive table, along with other (possibly more useful and less controversial) results that are generated from this type of methodology (such as discovering “hidden” Ivy League schools, value-add metrics, and relatedness of schools).

    Footnotes

    1. We actually train an ensemble of neural networks and average for more reliable results.
    2. These rankings are as of 2014, the last year of the College Scorecard that has sufficient data.
    3. Wake Forest University is in the top 20 between the years 2004-2009, but has insufficient data afterwards.
    Steve Lattanzio is a Research Engineer at MetaMetrics Inc., working in AI, machine learning, natural language processing, and data science. MetaMetrics is an education research company and are the developers of The Lexile® Framework for Reading and The Quantile® Framework for Mathematics.
    Update 1/17: Fixed mistake on ranking of Dartmouth, Columbia, and Cal Tech in text description.
    Update 1/19: Added direct link in introduction to article with more details.
  • Fall 2016 IPEDS First Look: Continued growth in distance education in US

    Fall 2016 IPEDS First Look: Continued growth in distance education in US

    The National Center for Educational Statistics (NCES) just released its Integrated Postsecondary Education Data System (IPEDS) report and data on postsecondary enrollment in the US for the Fall 2016 term. This federal data has been tracking distance education (DE) since Fall 2012, and with the new release we get our first look at trends through last year. Accompanying the data is a report by NCES with summary data tables. For the following tables and chart, I took the same approach as the report, by simply filtering for US-only institutions participating in Title IV federal financial aid programs.

    Please note that this is a broader definition, with more schools included, that our previous analysis at e-Literate and the Digital Learning Compass report. Those posts and analysis further filter for 2-year and 4-year degree-granting institutions.

    When viewing data from this first look at 6,677 institutions and administrative units, please note the following:

    • For the most part distance education and online education terms are interchangeable, but they are not equivalent as DE can include courses delivered by a medium other than the Internet (e.g. correspondence course).
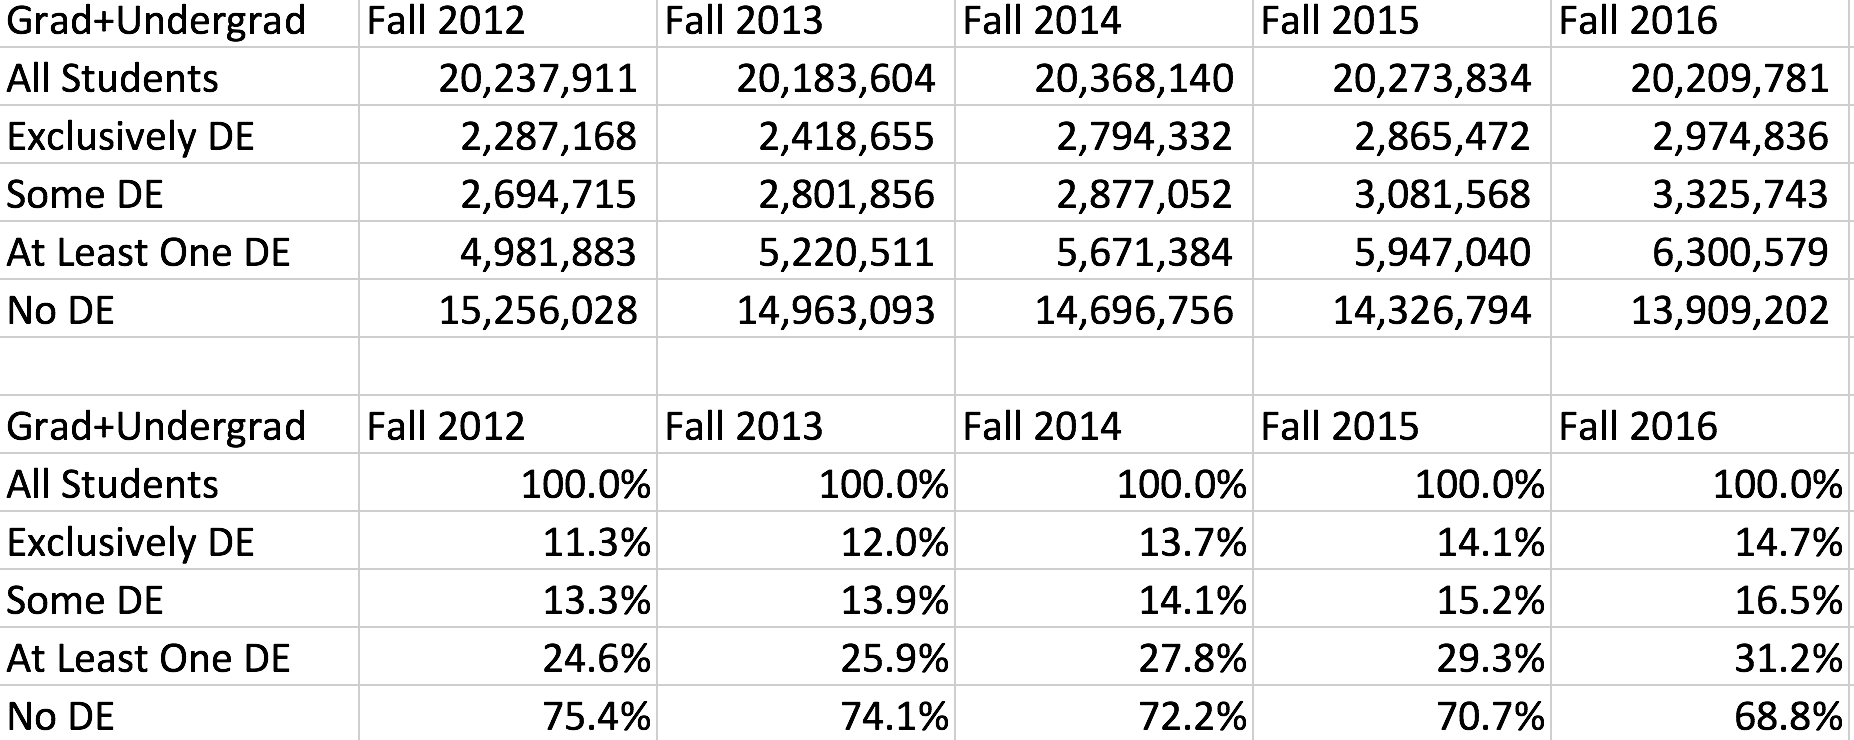
    • Exclusively DE means students who take all their courses online.
    • Some DE means students who take some but not all of their courses online.
    • At Least One DE is a combination of the above two categories, showing students who take at least one of their courses online.
    • No DE means students not taking any online courses.
    • The data totals used in the report are slightly off (0.07%) from what is in the data set that is the basis for my tables and chart below. I have not figured out this discrepancy yet, but it is immaterial for the big picture.

    For this first post, I am showing totals – institutions in all sectors, and a combination of student enrollment from graduate and undergraduate (4-year, 2-year, and less than 2-year) programs. I’ll break down by sector and level of study and even state in future posts.

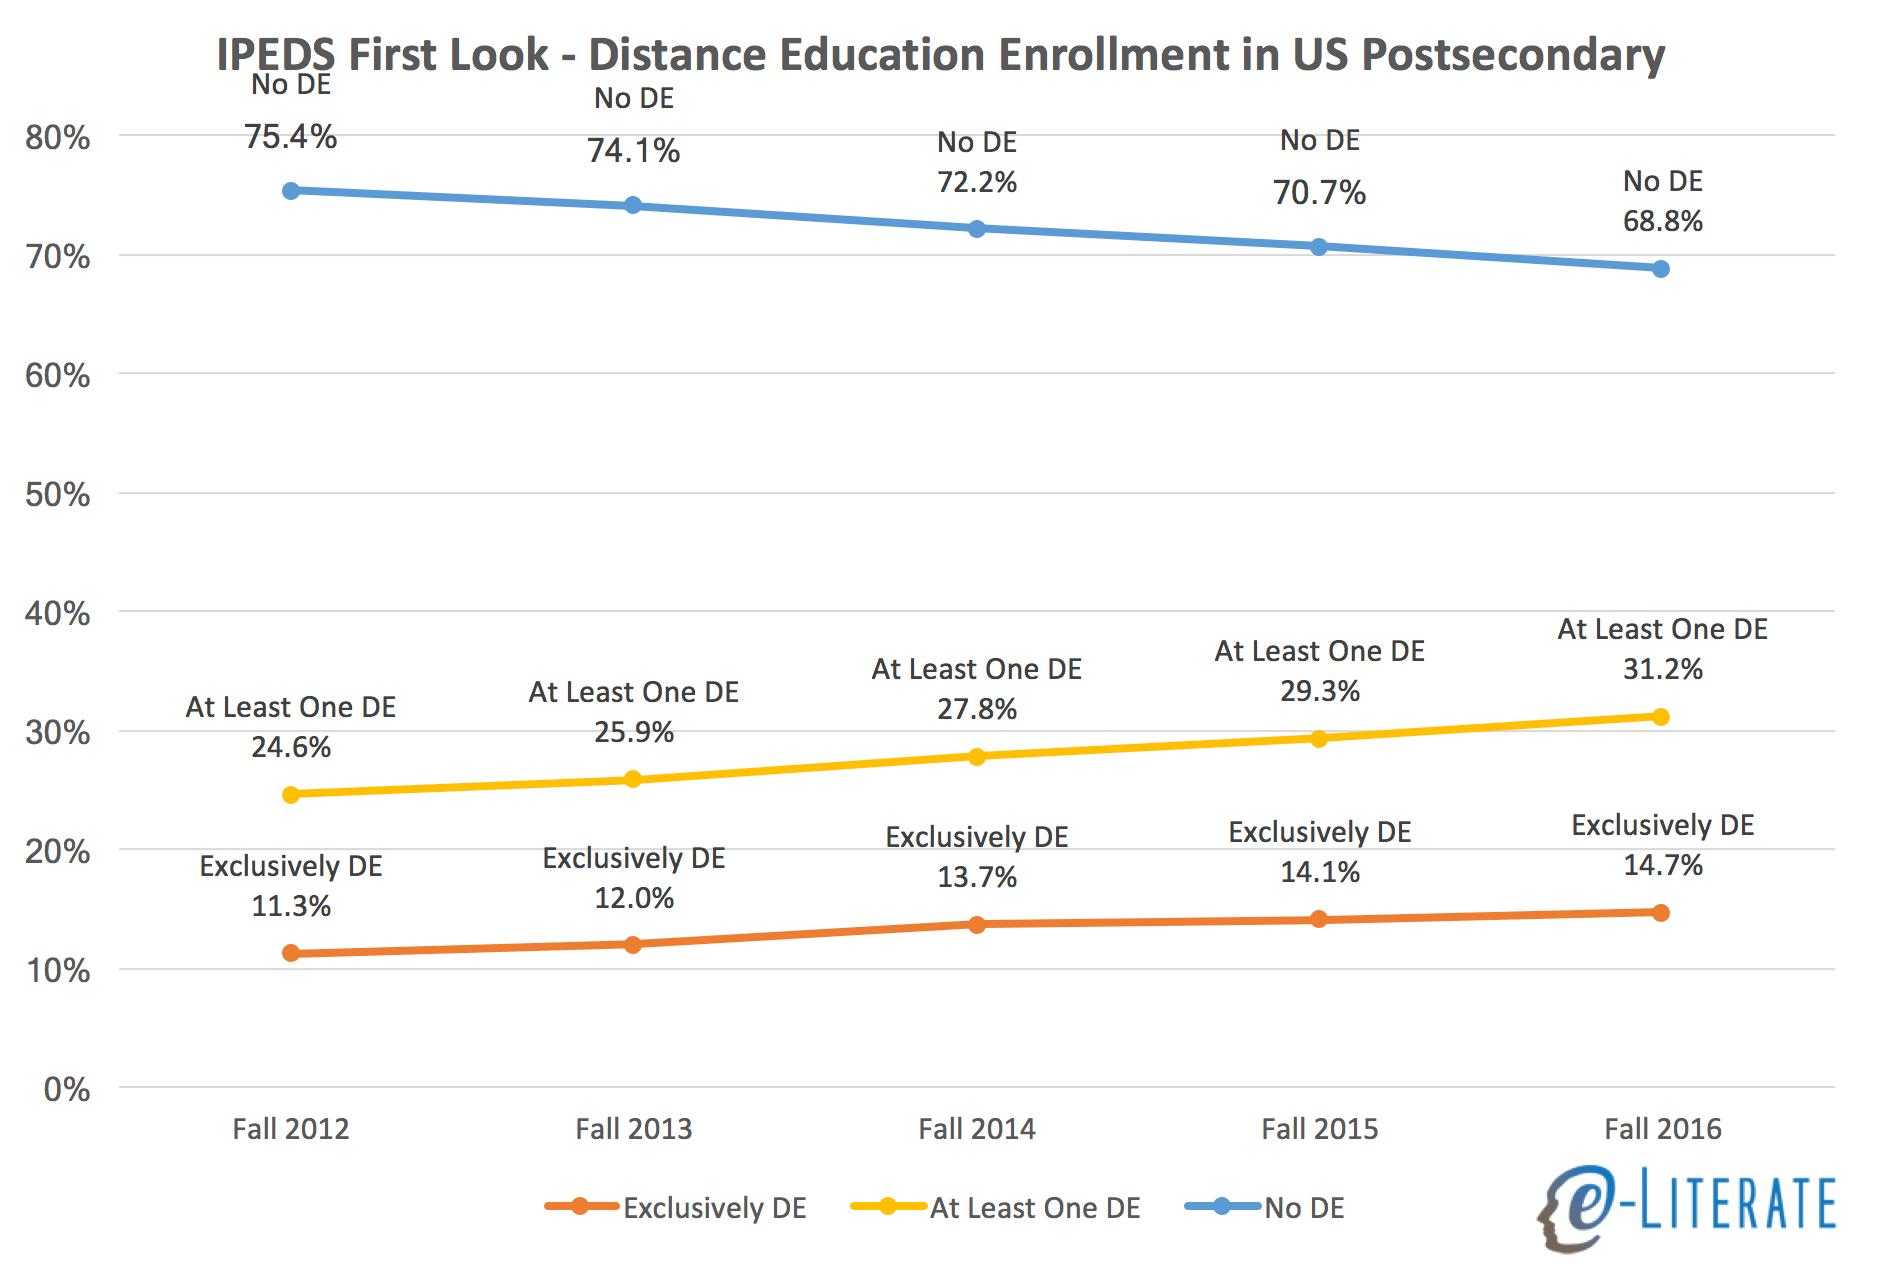
    With all those caveats in mind, here are data from Fall 2012 through 2016.

    Some observations of this data for Fall 2016:

    • There appears to be an small but noticeable acceleration in the growth of DE, going from 1.5% increase in percentage of students taking at least one online course from Fall 2014 to 2015, and a 1.9% increase from Fall 2015 to 2016. Although not shown in these tables, the acceleration appears in both undergraduate and graduate programs.
    • In the four-year period from Fall 2012 to Fall 2016, the share of students taking at least one online course increased by 27% (from 24.6% to 31.2%).
    • Note that this broad view of students (US, Title IV as only filters) does not capture the decrease in total enrollment shown in other IPEDS reports or National Student Clearinghouse reports.

    We’ll look deeper into the data and apply more consistent filtering to allow comparisons to our previous analysis. And we’ll break down by level of study, sector, and home state of institutions.

  • Fall 2014 IPEDS Data: Interactive table ranking DE programs by enrollment

    Last week I shared a static view of the US institutions with the 30 highest enrollments of students taking at least one online (distance ed, or DE) course. But we can do better than that, thanks to some help from Justin Menard at LISTedTECH and his Tableau guidance.

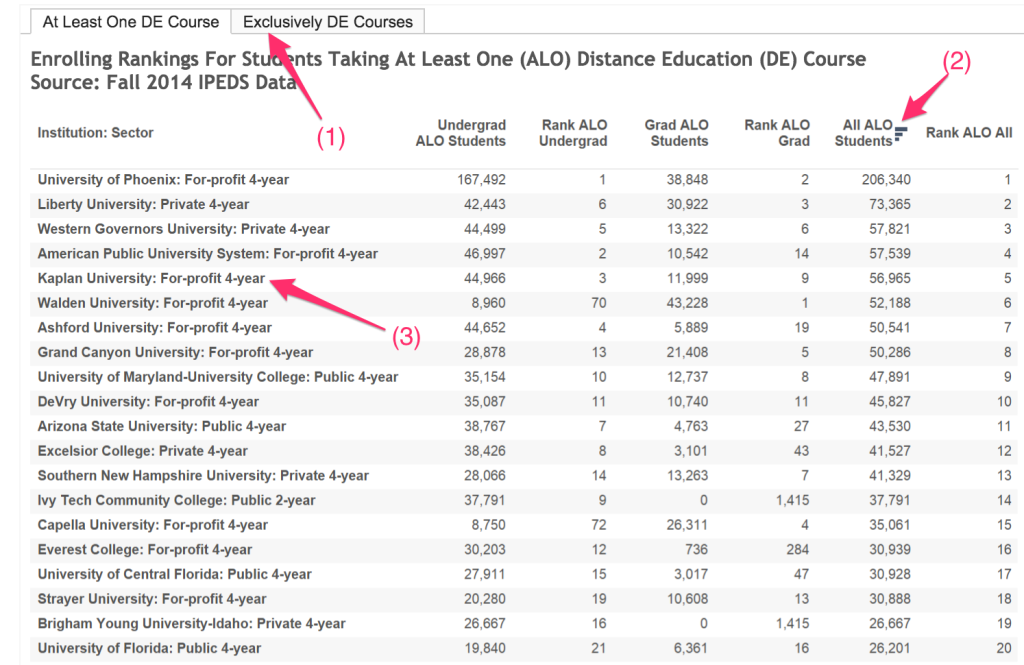
    The following interactive chart allows you to see the full rankings based on undergraduate, graduate and combined enrollments. And it has two views – one for students taking at least one online course and one for exclusive online students. Note the following:

    Tableau hints

    • (1) shows how you can change views by selecting the appropriate tab.
    • (2) shows how you can sort on any of the three measures (hover over the column header).
    • (3) shows the sector for each institution by the institution name.

    (more…)

  • Fall 2014 IPEDS Data: Top 30 largest online enrollments per institution

    The National Center for Educational Statistics (NCES) and its Integrated Postsecondary Education Data System (IPEDS) provide the most official data on colleges and universities in the United States. This is the third year of data.

    Let’s look at the top 30 online programs for Fall 2014 (in terms of total number of students taking at least one online course). Some notes on the data source:

    • I have combined the categories ‘students exclusively taking distance education courses’ and ‘students taking some but not all distance education courses’ to obtain the ‘at least one online course’ category;
    • Each sector is listed by column;
    • IPEDS tracks data based on the accredited body, which can differ for systems – I manually combined most for-profit systems into one institution entity as well as Arizona State University[1];
    • See this post for Fall 2013 Top 30 data and see this post for Fall 2014 profile by sector and state.

    Fall 2014 Top 30 Largest Online Enrollments Per Institution (more…)