e-Literate

Present is Prologue

Tag: data

  • Instructure Dodges A Data Bullet

    Last week’s EDUCAUSE conference was relatively news free, which is actually a good thing as overall ed tech hype levels have come down. Near the end of the conference, however, I heard from three different sources about a growing backlash against Instructure for their developing plans for Canvas Data and real-time events. “They’re Blackboarding us”, “the honeymoon is over”, “we’re upset and that is on the record”. By all appearances, this frustration mostly by R1 institutions was likely to become the biggest PR challenge for Instructure since their 2012 outage, especially considering their impending IPO.

    The first complaint centered on Instructure plans to charge for daily data exports as part of Canvas Data, which Instructure announced at InstructureCon in June as:

    a hosted data solution providing fully optimized data to K-12 and higher education institutions capturing online teaching and learning activity. As a fundamental tool for education improvement, the basic version of the service will be made available to Canvas clients at no additional cost, with premium versions available for purchase.

    What that last phrase meant was that monthly data access was free, but institutions had to pay for daily access. By the EDUCAUSE conference, institutions that are part of the self-organized  “Canvas R1 Peers” group were quite upset that Instructure was essentially selling their own data back to them, and arguments of additional infrastructure costs were falling flat. (more…)
  • Fall 2013 IPEDS Data: Top 30 largest online enrollments per institution

    The National Center for Educational Statistics (NCES) and its Integrated Postsecondary Education Data System (IPEDS) provide the most official data on colleges and universities in the United States. Last year they released data on distance education (essentially online courses) starting with the Fall 2012 term. Last week they released new data for the Fall 2013 term.

    Let’s look at the top 30 online programs for Fall 2013 (in terms of total number of students taking at least one online course) while showing both 2012 and 2013 data. Some notes on the data source:

    • I have combined the categories ‘students exclusively taking distance education courses’ and ‘students taking some but not all distance education courses’ to obtain the ‘at least one DE’ category;
    • The ‘All Students’ category combines those taking DE course with those taking no DE courses;
    • I have highlighted in red the not-for-profit sectors;
    • IPEDS tracks data based on the accredited body, which can differ for systems – I manually combined most for-profit systems into one institution entity as well as Arizona State University ((ASU splits into various entities although the online programs are coordinated.)); and
    • Please note that along with Russ Poulin from WCET we have identified some significant problems with IPEDS data validity – see this article for more information.

    (more…)

  • LISTedTECH: New wiki site and great visualizations

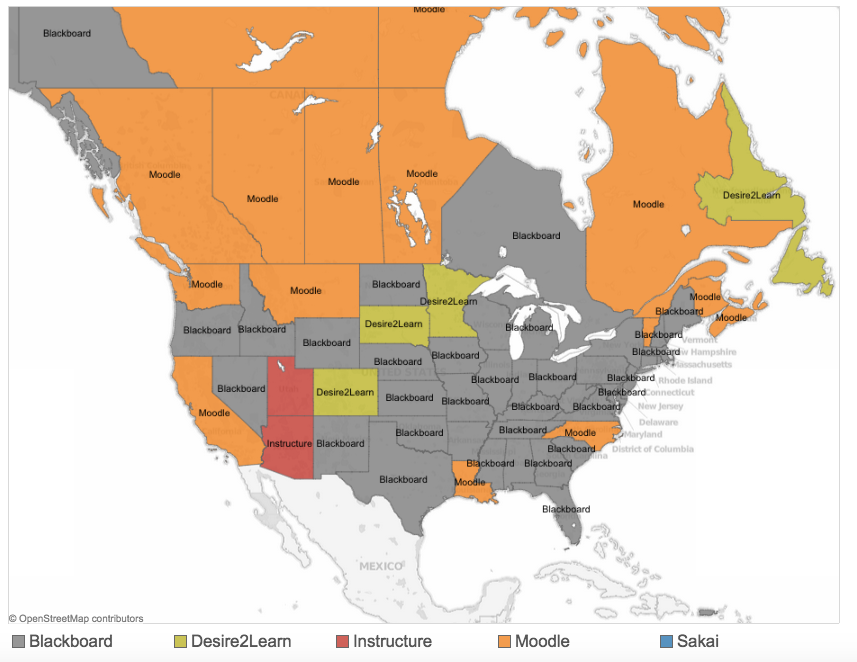
    Last year I wrote about a relatively new site offering very interesting data and visualizations in the ed tech world. LISTedTECH was created by Justin Menard, who is Business Intelligence Senior Analyst at University of Ottawa. First of all, the site is broader in scope than just the LMS – there is a rich source of data & visualizations on MOOCs, university rankings, and IPEDS data. Most of the visualizations are presented by Tableau and therefore interactive in nature, allowing the user to filter data, zoom in on geographic data, etc. Since e-Literate is not set up for full-page visualizations, I have included screen shots below, but clicking on the image will take you to the appropriate LISTedTECH page.

    Top_Learning_Management_System__LMS__by_State_or_Province_-_LISTedTECH

    (more…)

  • New LMS Market Data: Edutechnica provides one-year update

    In Fall 2013 we saw a rich source of LMS market data emerge.

    George Kroner, a former engineer at Blackboard who now works for University of Maryland University College (UMUC), has developed what may be the most thorough measurement of LMS adoption in higher education at Edutechnica (OK, he’s better at coding and analysis than site naming). This side project (not affiliated with UMUC) started two months ago based on George’s ambition to unite various learning communities with better data. He said that he was inspired by the Campus Computing Project (CCP) and that Edutechnica should be seen as complementary to the CCP.

    The project is based on a web crawler that checks against national databases as a starting point to identify the higher education institution, then goes out to the official school web site to find the official LMS (or multiple LMSs officially used). The initial data is all based on the Anglosphere (US, UK, Canada, Australia), but there is no reason this data could not expand.

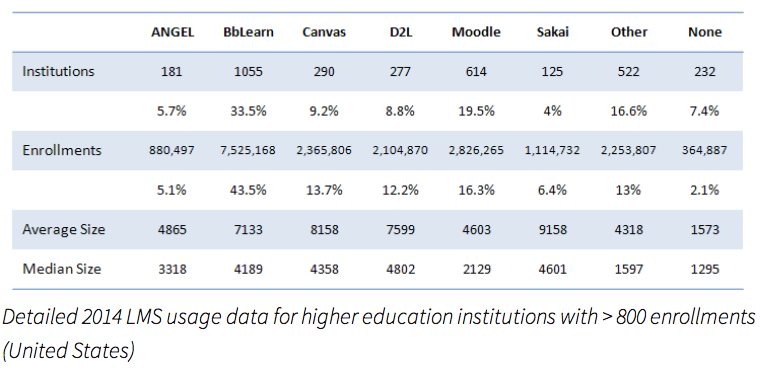
    There is new data available in Edutechnica’s one-year update, with year-over-year comparisons available as well as improvements to the methodology. Note that the methodology has improved both in terms of setting the denominator and in terms of how many schools are included in the data collection.

    The Fall 2014 data which now includes all schools with more than 800 enrollments:

    (more…)

  • New Internet Trends Presentation: Mary Meeker gets education partly right

    Mary Meeker from Kleiner Perkins Caufield Byers (KPCB) has released her annual Internet Trends presentation, which has taken on a life of its own. Her data is very useful to see macro trends and the significance of Internet-related technology. Even in the non-education sections, the presentation should be very useful to education.

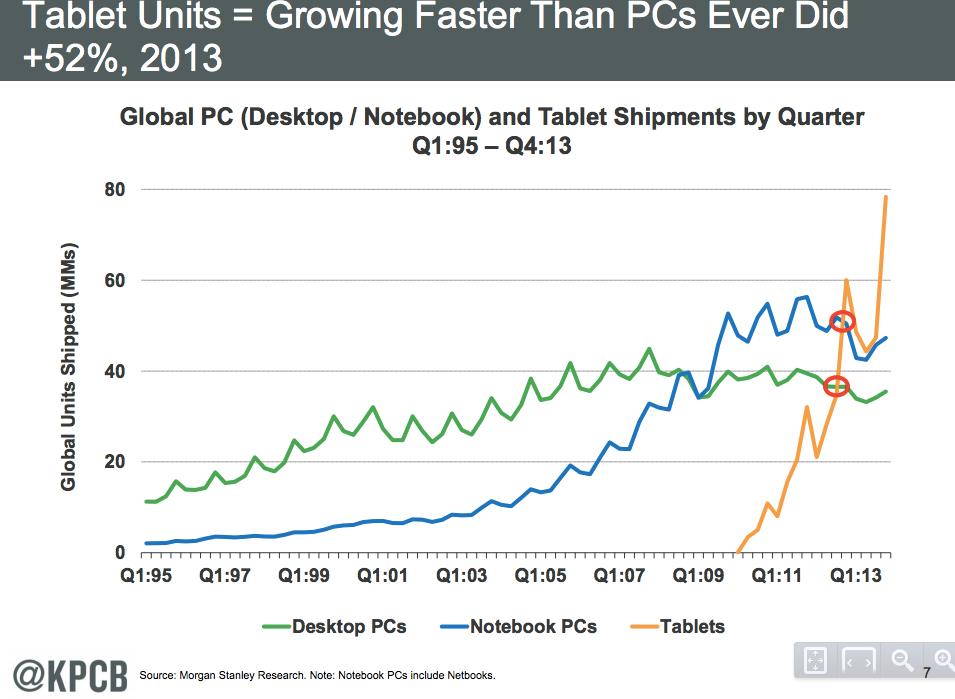
    One interesting perspective is that tablets continue their massive growth. Anecdotally, I am not seeing such a strong uptick in tablet usage by students on campuses, but the overall growth is worth exploring further. It would be interesting to see more longitudinal data specifically on tablet usage on campus.

    Tablet growth

    Another mobile perspective to keep watching is the rising percentage of web usage by mobile devices (smart phones and tablets), which jumped from 14% to 25% in just the past year. If your campus or technology company does not have a mobile strategy, then you are missing what students (and even faculty and staff) are actually experiencing on the web. (more…)

  • New look at LMS data for US small colleges

    Last fall I mentioned two new non-survey data sources available to track LMS adoption within higher ed. While surveys for subjective, attitudinal information still make sense, surveys of hard data are losing their value over time. Analyses of automatically collected system data place less of a burden on the organizations providing the information, and these analyses also allow a more agile approach to refining the data collection and viewing from different angles. Today Edutechnica released a new report on LMS adoption that demonstrates these benefits.

    When we provided our initial analysis of LMS usage in fall of 2013, one point of feedback that we heard loud and clear is that because our data only included institutions with greater than 2000 enrollments, we excluded a fair number of community colleges, career colleges, and liberal arts colleges. To the credit of those who provided this feedback, they were absolutely correct. Three-quarters of all recognized higher education institutions in the United States have fewer than 2500 FTE – a critical demographic as the majority of universities in the US are of this size or smaller. To more fairly represent LMS usage we needed to include data on smaller schools.

    We are now excited to be able to provide analysis of a data set for institutions with greater than 1000 students.

    The team presents the raw data for schools above 1,000 FTE, calling out some of the differences from their earlier report. But one key view they provided is looking at institutional LMS adoption per school enrollment size.

    Seeing Moodle’s increased usage prompted us to investigate Moodle further. An interesting thing happens below 2500 FTE; Moodle actually exceeds Blackboard’s market  share.  Only after this point do the demographic segments diverge. (more…)

  • Response from Babson Survey author on differences with IPEDS

    I have written a series of posts on the new IPEDS data, including two that showed how this data seems to be quite different from the pervasive Babson Survey Research Group (BSRG) data (formerly known as the Sloan Survey). In particular, there were two findings, one on the number of students taking online courses:

    And no, there aren’t 7.1 million [from Babson] US higher ed students taking at least one online course. There are closer to 5.5 million [from IPEDS] as of Fall 2012.

    and one on the number of institutions offering online education:

    The big difference that should be obvious is that the Babson data shows less than half the number of institutions with no online offerings than the IPEDS data – 15% compared to 31%.

    Who has an online offering?

    I have been in contact with Jeff Seaman, one of the two authors of the BSRG reports, to get his analysis on the differences, including sharing my spreadsheets used for analysis of the two data sets. Jeff has graciously reviewed the data and provided the following analysis of why BSRG data is so different from IPEDS data.

    (more…)