e-Literate

Present is Prologue

Tag: enrollment

  • Fall 2014 IPEDS Data: Top 30 largest online enrollments per institution

    The National Center for Educational Statistics (NCES) and its Integrated Postsecondary Education Data System (IPEDS) provide the most official data on colleges and universities in the United States. This is the third year of data.

    Let’s look at the top 30 online programs for Fall 2014 (in terms of total number of students taking at least one online course). Some notes on the data source:

    • I have combined the categories ‘students exclusively taking distance education courses’ and ‘students taking some but not all distance education courses’ to obtain the ‘at least one online course’ category;
    • Each sector is listed by column;
    • IPEDS tracks data based on the accredited body, which can differ for systems – I manually combined most for-profit systems into one institution entity as well as Arizona State University[1];
    • See this post for Fall 2013 Top 30 data and see this post for Fall 2014 profile by sector and state.

    Fall 2014 Top 30 Largest Online Enrollments Per Institution (more…)

  • Fall 2013 IPEDS Data: Top 30 largest online enrollments per institution

    The National Center for Educational Statistics (NCES) and its Integrated Postsecondary Education Data System (IPEDS) provide the most official data on colleges and universities in the United States. Last year they released data on distance education (essentially online courses) starting with the Fall 2012 term. Last week they released new data for the Fall 2013 term.

    Let’s look at the top 30 online programs for Fall 2013 (in terms of total number of students taking at least one online course) while showing both 2012 and 2013 data. Some notes on the data source:

    • I have combined the categories ‘students exclusively taking distance education courses’ and ‘students taking some but not all distance education courses’ to obtain the ‘at least one DE’ category;
    • The ‘All Students’ category combines those taking DE course with those taking no DE courses;
    • I have highlighted in red the not-for-profit sectors;
    • IPEDS tracks data based on the accredited body, which can differ for systems – I manually combined most for-profit systems into one institution entity as well as Arizona State University ((ASU splits into various entities although the online programs are coordinated.)); and
    • Please note that along with Russ Poulin from WCET we have identified some significant problems with IPEDS data validity – see this article for more information.

    (more…)

  • Cal State Online: Public records shed light on what happened

    Last month I shared the system announcement that the Cal State Online (CSO) initiative is finished. Despite the phrasing of “re-visioning” and the retention of the name, the concept of a standalone unit to deliver and market online programs for the system is gone. Based on documents obtained by e-Literate through a public records request: ((CSU officials did not respond to requests to be interviewed for this story. The offer is still open if someone would like to comment.))

    • The original concept of “a standardized, centralized, comprehensive business, marketing and outreach support structure for all aspects of online program delivery for the Cal State University System” was defined in summer 2011, formally launched in Spring 2013, and ultimately abandoned in Fall 2013;
    • CSO was only able to enroll 130 full-time equivalent students (FTES) in CY2013 despite starting from pre-existing campus-based online programs and despite minimum thresholds of 16,700 FTES in the Pearson contract;
    • CSO was able to sign up only five undergraduate degree-completion programs and two master’s programs offered at four of the 23 Cal State campuses;
    • Faculty groups overtly supported investments in online education but did not feel included in the key decision processes;
    • Pearson’s contract as a full-service Online Service Provider was in place for less than one year before contract renegotiations began, ultimately leading to LMS services only; and
    • The ultimate trigger to abandon the original model was the $10 million state funding for online education to address bottleneck courses.

    That last one might seem counter-intuitive without the understanding that CSO did not even attempt to support matriculated Cal State students in state-funded programs.

    Terminology note: CSO measured course enrollments as “one student registered in one online course”, such that one student taking two courses would equal two course enrollments, etc. Internally CSO calculated 10 course enrollments = 1 FTES.

    Below is a narrative of the key milestones and decisions as described by the public documents. I’ll share more of my thoughts in a future post.

    2011

    (more…)

  • Postscript to “This Time Is Different: Enrollment and Employment Divergence”

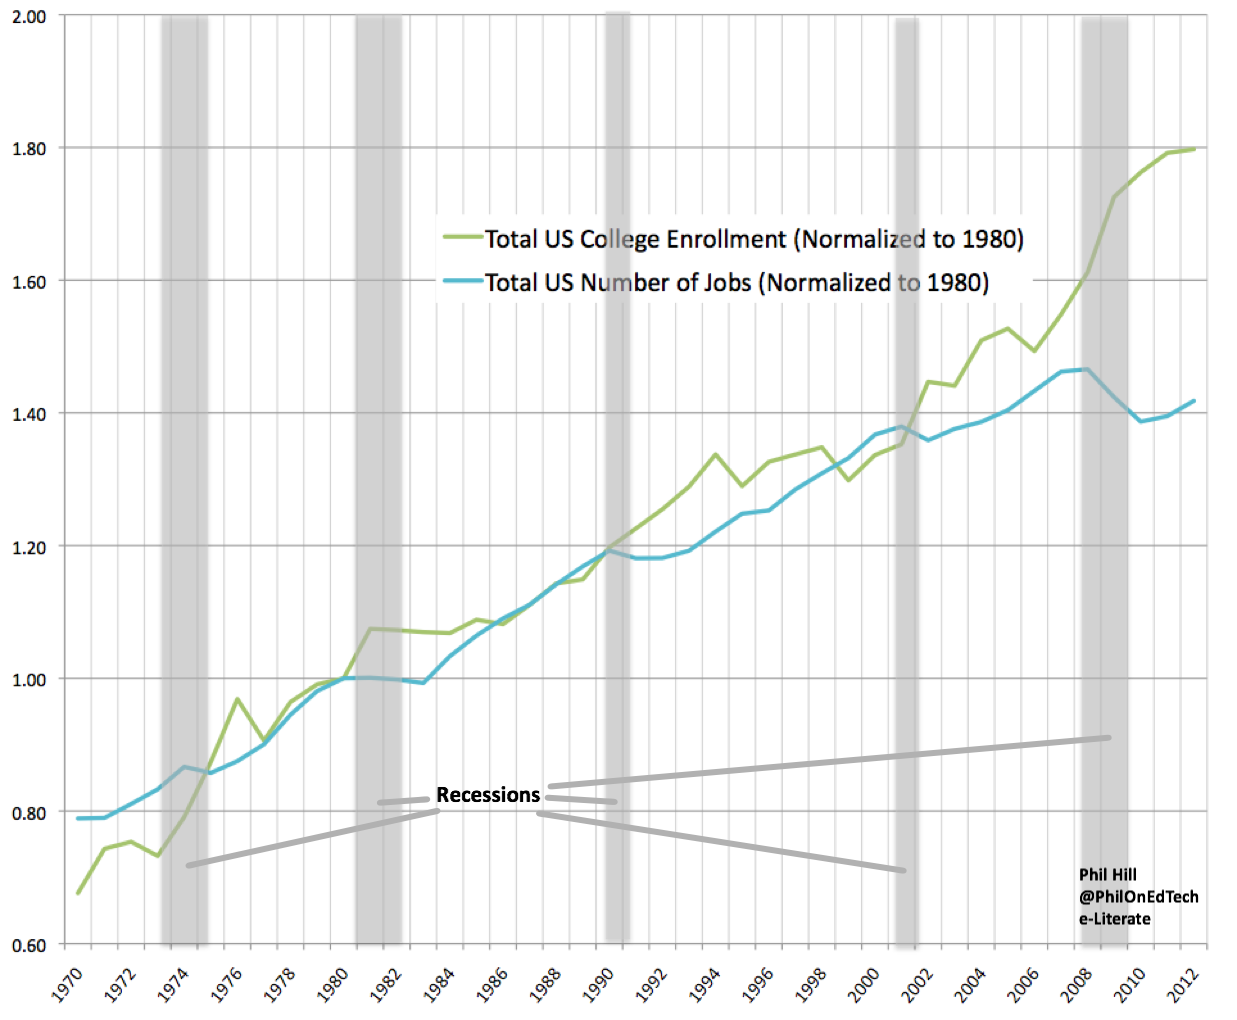
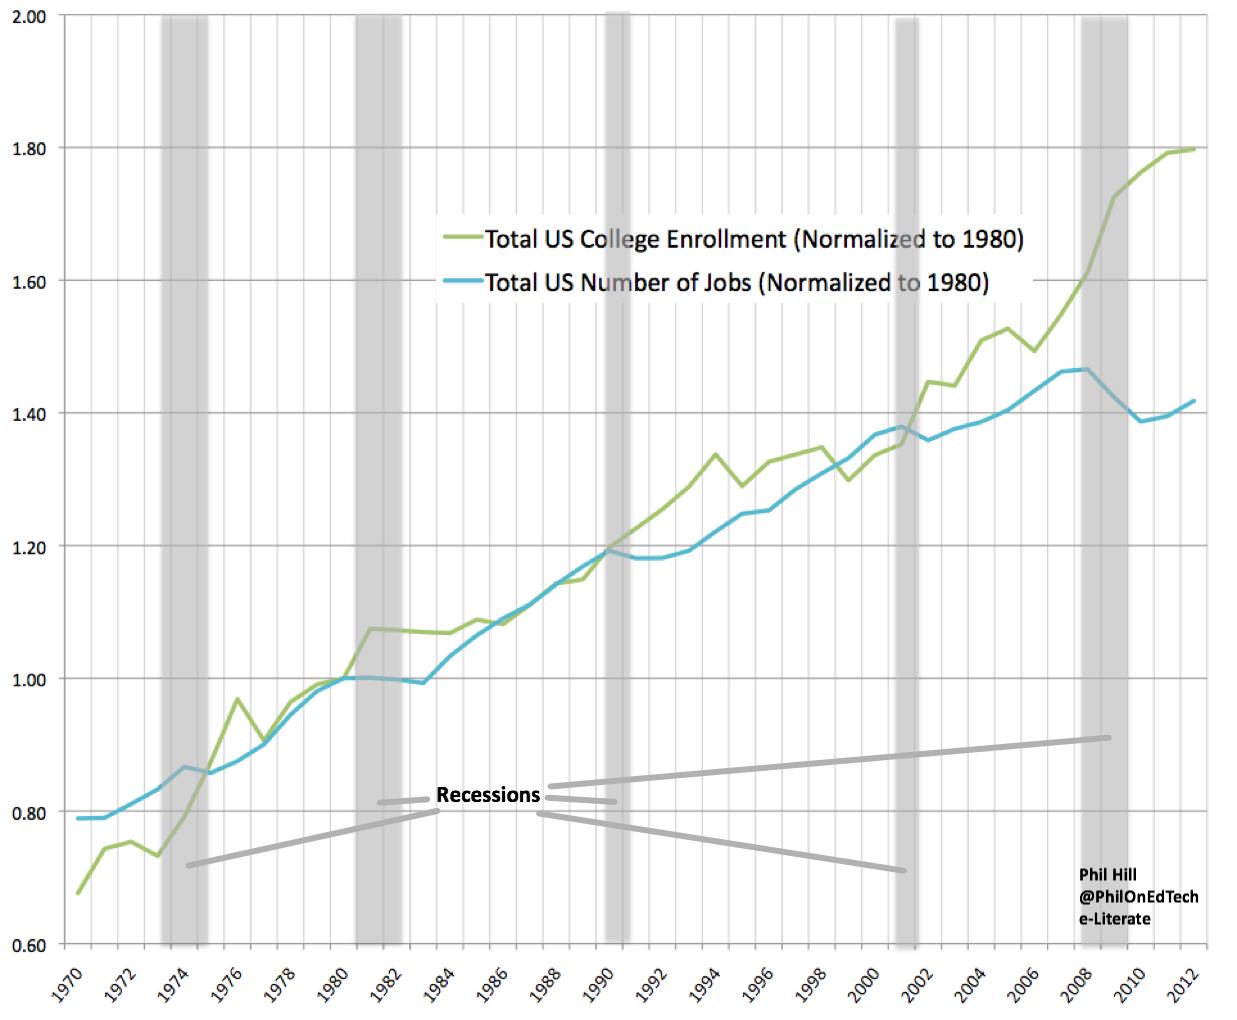
    In a post two days ago, I showed US data comparing enrollment and employment trends. The salient feature of the data that I called out was the significant divergence of the two trend lines since 2006.

    When you look at the data from 1970 – 2012, the results could explain some significant pressures experienced by higher education institutions. In a nutshell – this time is different, we are in uncharted territory.

    There are two related comments that I would like to address, both of which ask the question of whether the mix of full-time vs. part-time enrollment explains part of the divergence noted.

    The first (excerpted) comment is from Thomas Warger under the original post:

    I have to wonder how much of the gap you show here can be attributed to the increased availability of pay-as-you-go higher education–opportunities to take a few credits at a time at a community college or an online provider? Does “normalized for 1980″ factor for this relatively new phenomenon?

    The second comment is from Stephen Downes in his OLDaily blog:

    I don’t agree with the proposition that “this time it’s different.” Here’s what Phil Hill writes: “The conventional wisdom holds that enrollment jumps when employment drops, and the data does show some divergence followed a few years later by a correction. What is different this time is A) the magnitude of the divergence and B) the start of the divergence fully two years before the recession started in 2008.” I think the apparent spike in enrollments is created by a lot of part-time and online learning, and that it is a bit illusory. It’s also caused by echo-boom effects, as the population born between 1982-1995 is in post-secondary education between 2002-1015, give or take. If (and it’s a big if) employment improves, I would expect a dramatic drop in (traditional) enrollment.

    What’s really different is that world population is reaching a breaking point, climate change is disrupting food supplies and other industry, resource depletion has become a significant problem, and (by contrast) worldwide prosperity, literacy and general awareness has led to an increasingly restive global population. There is moreover a chronic economic imbalance, with increasingly large quantities of wealth simply being hoarded instead of invested (it’s an amount that if deployed would makemoney itself meaningless). U.S. demographic trends – which could be rendered obsolete with one major wave of immigration – are irrelevant in the face of these wider forcess.

    (more…)

  • This Time Is Different: US Enrollment and Employment Divergence

    When looking at long-term trends for higher education, it is useful to step back and look at the big picture. With this goal in mind, consider the comparison of post-secondary enrollment in degree-granting programs to the total number of jobs (both based on the US). The enrollment data is based on the National Center of Education Statistics (NCES) and the employment data is based on the Bureau of Labor Statistics and its Current Population Survey (CPS). To get the big picture I decided to keep this simple – combining full-time and part-time enrollment, and combining full-time and part-time employment. To see the trends, I normalized both data series to 1980.

    When you look at the data from 1970 – 2012, the results could explain some significant pressures experienced by higher education institutions. In a nutshell – this time is different, we are in uncharted territory.

    (more…)