e-Literate

Present is Prologue

Tag: higher education

  • Instructure Releases 4th Security Audit, With a Crowd-sourcing Twist

    In the fall of 2011 I made the following argument:

    We need more transparency in the LMS market, and clients should have access to objective measurements of the security of a solution. To paraphrase Michael Feldstein’s suggestions from a 2009 post:

    • There is no guarantee that any LMS is more secure just because they say they are more secure
    • Customers should ask for, and LMS vendors should supply, detailed information on how the vendor or open source community has handled security issues in practice
    • LMS providers should make public a summary of vulnerabilities, including resolution time

    I would add to this call for transparency that LMS vendors and open source communities should share information from their third-party security audits and tests.  All of the vendors that I talked to have some form of third-party penetration testing and security audits; however, how does this help the customer unless this information is transparent and available?  Of course this transparency should not include details that would advertise vulnerabilities to hackers, but there should be some manner to be open and transparent on what the audits are saying. [new emphasis added]

    Inspired by fall events and this call for transparency, Instructure (maker of the Canvas LMS) decided to hold an public security audit using a white hat testing company, where A) the results of the testing would be shared publicly, and B) I would act as an independent observer to document the process. The results of this testing are described in two posts at e-Literate and by a post at Instructure.

    Instructure has kept up the process, this year with a crowd-sourcing twist: (more…)
  • Babson Study of Online Learning Released

    Babson Survey Research Group (BSRG) just released its annual survey of online learning in US higher education (press release here). This year they have moved from use of survey methodology for the online enrollment section to use of IPEDS distance education data. Russ Poulin from WCET and I provided commentary on the two data sources as an appendix to the study.

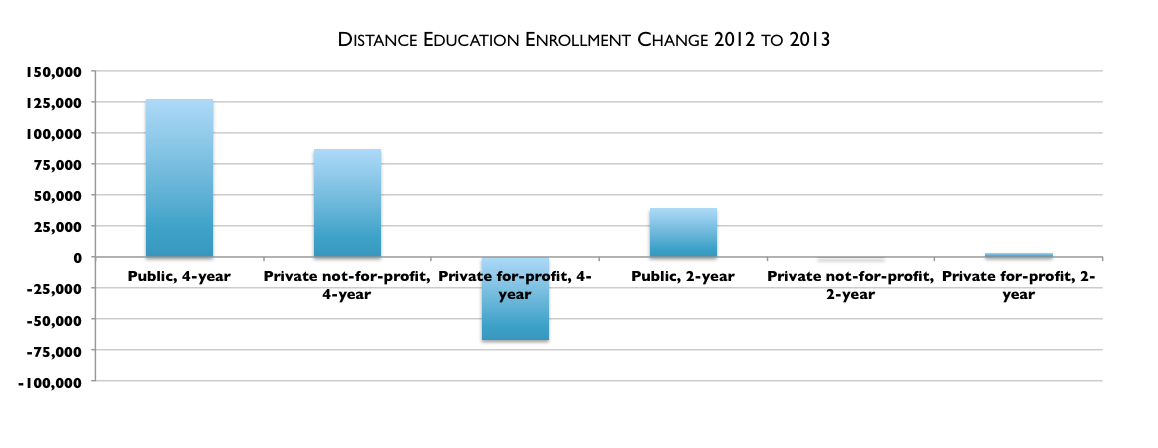
    The report highlights the significant drop in growth of online education in the US (which I covered previously in this e-Literate post). Some of the key findings:

    • Previous reports in this series noted the proportion of institutions that believe that online education is a critical component of their long-term strategy has shown small but steady increases for a decade, followed by a retreat in 2013.
    • After years of a consistently growing majority of chief academic officers rating the learning outcomes for online education “as good as or better” than those for face-to-face instruction, the pattern reversed itself last year.
    • This report series has used its own data to chronicle the continued increases in the number of students taking at least one online course. Online enrollments have increased at rates far in excess of those of overall higher education. The pattern, however, has been one of decreasing growth rates over time. This year marks the first use of IPEDS data to examine this trend.
    • While the number of students taking distance courses has grown by the millions over the past decade, it has not come without considerable concerns. Faculty acceptance has lagged, concerns about student retention linger, and leaders continue to worry that online courses require more faculty effort than face-to-face instruction.

    BSRG looked at the low growth (which I characterized as ‘no discernible’ growth’ due to noise in the data) and broke down trends by sector.

    Growth by sector

    (more…)

  • GAO Report: Yes, student debt is growing problem

    In case anyone needed additional information to counter the Brookings-fed meme that “Americans who borrowed to finance their education are no worse off today than they were a generation ago”, theU.S. Government Accountability Office (GAO) released a report yesterday with some significant findings. As reported at Inside Higher Ed by Michael Stratford:

    More than 700,000 households headed by Americans 65 or older now carry student debt, according to a report released Wednesday by the U.S. Government Accountability Office. And the amount of debt owed by borrowers 65 and older jumped from $2.8 billion in 2005 to $18.2 billion last year. [snip]

    Between 2004 and 2010, for instance, the number of households headed by individuals 65 to 74 with student loan debt more than quadrupled, going from 1 percent to 4 percent of all such families. During that same period, the rate of borrowing among Americans under 44 years old increased between 40 and 80 percent, even though borrowing among that age group is far more prevalent than it is among senior citizens.

    I have been highly critical of the Brookings Institutions and their report and update. This new information from the GAO goes outside the selective Brookings data set of households headed by people aged 20 – 40, but it should be considered by anyone trying to draw conclusions about student debt holders.

    Noting that Brookings analysis is based on “Americans who borrowed to finance their education” and the GAO report is on student debt holders, it is worth asking if we’re looking at a similar definition. For the most part, yes, as explained at IHE:

    While some of the debt reflects loans taken out by parents on behalf of their children, the vast majority — roughly 70 to 80 percent of the outstanding debt — is attributable to the borrowers’ own education. Parent PLUS loans accounted for only about 27 percent of the student debt held by borrowers 50 to 64 years old, and an even smaller share for borrowers over 65.

    Go read at least the entire IHE article, if not the entire GAO report.

    Student debt is a growing problem in the US, and the Brookings Institution conclusions are misleading at best.

  • Brookings Institution analysis on student debt becoming a farce

    I have previously written about the deeply flawed Brookings Institution analysis on student debt with its oft-repeated lede:

    These data indicate that typical borrowers are no worse off now than they were a generation ago …

    Their data is based on the triennial Survey of Consumer Finances (SCF) by the Federal Reserve Board, with the report based on 2010 data. With the release of the 2013 SCF data, Brookings Institution put out an update this week on their report, and they continue with the lede:

    The 2013 data confirm that Americans who borrowed to finance their educations are no worse off today than they were a generation ago. Given the rising returns to postsecondary education, they are probably better off, on average. But just because higher education is still a good investment for most students does not mean that high and rising college costs should be left unquestioned.

    This conclusion is drawn despite the following observations of changes from 2010 – 2013 in their own update:

    • The share of young (age 20 – 40) households with student debt rose from 36% to 38%;
    • The average amount of debt per household rose 14%;
    • The distribution of debt holders rose by 50% for debt levels of $20k – $75k and dropped by 19% for debt levels of $1k – $10k; and
    • Wage income is stagnant and same level as ~1999, yet debt amounts have risen by ~50% in that same time period (see below).

    (more…)

  • On ECAR data and ed tech purgatory

    Recently I wrote a post about many ed tech products being stuck in pilots without large-scale adoption.

    In our consulting work Michael and I often help survey institutions to discover what technologies are being used within courses, and typically the only technologies that are used by a majority of faculty members or in a majority of courses are the following:

    • AV presentation in the classroom;
    • PowerPoint usage in the classroom (obviously connected with the projectors);
    • Learning Management Systems (LMS);
    • Digital content at lower level than a full textbook (through open Internet, library, publishers, other faculty, or OER); and
    • File sharing applications. [snip]

    This stuck process ends up as an ed tech purgatory – with promises and potential of the heaven of full institutional adoption with meaningful results to follow, but also with the peril of either never getting out of purgatory or outright rejection over time.

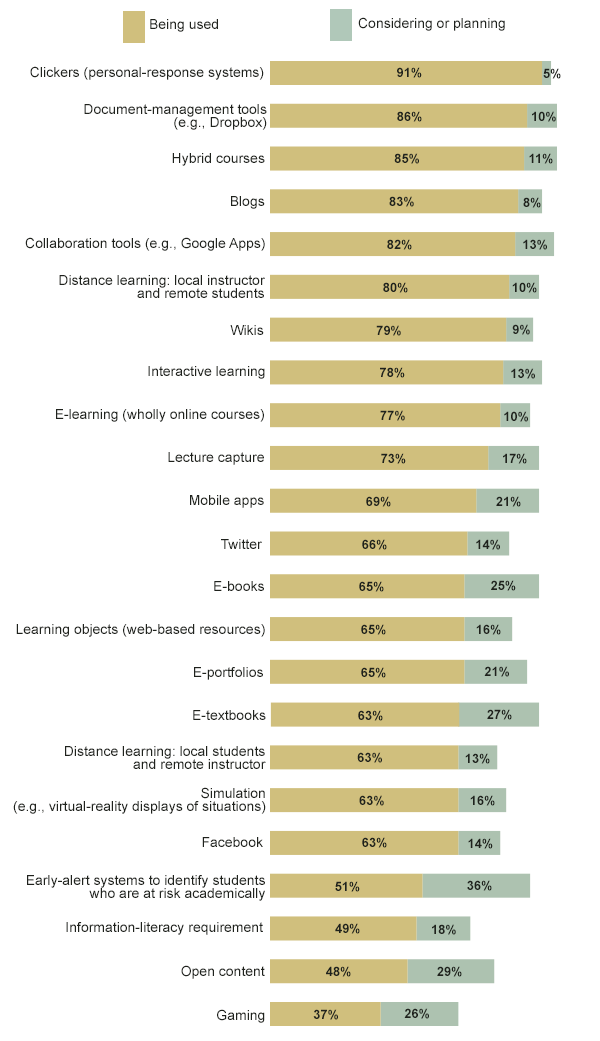
    With the Chronicle’s Almanac coming out this week, there is an interesting chart that on the surface might contradict the above information, showing ~20 technologies with above 50% adoption.

    Note: Data are drawn from responses by a subset of more than 500 of the nearly 800 institutions that participated in a survey conducted from June to October 2013. Reported statistics are either an estimated proportion of the population or an estimated median. Source: Educause Center for Analysis and Research
    Note: Data are drawn from responses by a subset of more than 500 of the nearly 800 institutions that participated in a survey conducted from June to October 2013. Reported statistics are either an estimated proportion of the population or an estimated median.
    Source: Educause Center for Analysis and Research [ECAR]
    The difference, however, is that ECAR (through The Chronicle) asked how many institutions have different ed tech products and our survey asked how many courses within an institution use different ed tech products.

    There are plenty of technologies being piloted but few hitting the mainstream, and adoption within an institution is one of the key indicators to watch.

  • Pilots: Too many ed tech innovations stuck in purgatory

    Steve Kolowich wrote an article yesterday in the Chronicle that described the use of LectureTools, a student engagement and assessment application created by faculty member Perry Sampson at the University Michigan. These two paragraphs jumped out at me.

    The professor has had some success getting his colleagues to try using LectureTools in large introductory courses. In the spring, the software was being used in about 40 classrooms at Michigan, he says.

    Adoption elsewhere has been scattered. In 2012, Mr. Samson sold LectureTools to Echo360 ((Disclosure: Echo360 was a recent client of MindWires)), an education-technology company, which has started marketing it to professors at other universities. The program is being used in at least one classroom at 1,100 institutions, according to Mr. Samson, who has kept his title of chief executive of LectureTools. But only 80 are using the software in 10 or more courses.

    93% of LectureTools clients use the tool for less than 10 courses total, meaning that the vast majority of customers are running pilot projects almost two years after the company was acquired by a larger ed tech vendor.

    We are not running out of ideas in the ed tech market – there are plenty of new products being introduced each year. What we are not seeing, however, are ed tech innovations that go beyond a few pilots in each school. Inside Higher Ed captured this sentiment when quoting a Gallup representative after the GSV+ASU EdInnovations conference this year: (more…)

  • Federal Reserve Board backs up e-Literate in criticism of Brookings report on student debt

    I have been very critical of the Brookings Institution report on student debt, particularly in my post “To see how illogical the Brookings Institution report on student loans is, just read the executive summary”.

    D’oh! It turns out that real borrowers with real tax brackets paying off off real loans are having real problems. The percentage at least 90 days delinquent has more than doubled in just the past decade. In fact, based on another Federal Reserve report, the problem is much bigger for the future, “44% of borrowers are not yet in repayment, and excluding those, the effective 90+ delinquency rate rises to more than 30%”.

    More than 30% of borrowers who should be paying off their loans are at least 90 days delinquent? It seems someone didn’t tell them that their payment-to-income ratios (at least for their mythical average friends) are just fine and that they’re “no worse off”.

    Well now the Federal Reserve Board themselves weighs in on the subject with a new survey, at least as described by an article in The Huffington Post.  I have read the Fed report and concur with HP analysis – it does argue against the Brookings findings.

    Among the emerging risks spotlighted by the survey is the nation’s $1.3 trillion in unpaid student debt, suggesting that high levels of student debt are crimping the broader economy. Nearly half of Americans said they had to curb their spending last year in order to make payments on student loans, adding weight to the fear among federal financial regulators that the burden of student debt on households will depress economic growth for years to come.

    Some 35 percent of survey respondents who are paying back student loans said they had to reduce their spending by “a little” over the past year to keep up with their student debt payments. Another 11 percent said they had to cut back their spending by “a lot.”

    The Fed’s findings appear to challenge recent research by a pair of economists at the Brookings Institution, highlighted in The New York Times and cited by the White House, that argues that households with student debt are no worse off today than they were two decades ago.

    (more…)