e-Literate

Present is Prologue

Tag: LMS market

  • Instructure: Plans to expand beyond Canvas LMS into machine learning and AI

    Instructure: Plans to expand beyond Canvas LMS into machine learning and AI

    It’s common knowledge that Instructure has shifted its focus to place more emphasis on its growth in corporate learning markets than in the educational markets that have fueled the company growth to date. We covered the initial news about their introduction of the corporate learning LMS, Bridge, four years ago.

    While Instructure has excelled on maintaining product focus and simplicity of user experience, this move outside of education raises the question about whether they can maintain company focus. The corporate market is very different than the education market – different product needs, fragmented vendor market, different buying patterns. Many companies have tried to cross over between education and corporate learning, but most have failed. Blackboard, D2L and Moodle have made a footprint in the corporate space using one product for both markets. Instructure’s approach is different.

    As noted, the other Big Four LMS vendors are also targeting corporate learning (or professional ed, or workplace, pick your name). D2L and Blackboard are using the same platforms in both markets (Brightspace for D2L, Learn and Open LMS for Blackboard), while Moodle released Workplace, a set of plugins on top of core Moodle. Instructure, however, has different products for educational and corporate markets.

    That is old news. What is more interesting is to understand Instructure’s emerging strategy given the new executive team. Thanks to the nature of Instructure being a publicly-traded company, we are getting more insight that should set expectations for educational customers. As CEO Dan Goldsmith said during an investor conference a week ago:

    We really changed the company, as I came in nine months ago and then took over as CEO January 1st of this year. We’re initiating the second chapter in the journey of Instructure.

    I should first note that the audience for these calls is the investment community, so naturally Instructure executives focused more on financial performance and projections that they would in academic meetings. But there is a lot to learn here.

    In some ways, the changes to operations of Instructure are welcome and are already helping them manage corporate finances. In other ways, however, that second chapter reads a lot like Blackboard. Moving beyond the LMS, willing to bet on corporate acquisition, expecting big focus on data and analytics, and continuing challenges in completing products.

    Operational Improvements

    One of the ongoing criticisms of Instructure, particularly by their competitors, is that they continue to lose money and are buying growth. While these observations are accurate, as long as Instructure keeps growing, they have never been at risk of running out of money or having their losses significantly impact their operations. Under the new leadership, Instructure has been much more aggressive in managing expenses, with a big milestone described on the conference call by CFO Steve Kaminsky [emphasis added].

    Turning to the expense side. With our focus on operational excellence during the second half of 2018, we’ve changed the mindset of our leadership team and the entire organization about how we approach the business and fund investment. We focused on disciplined investments for balancing profitable growth has been put in place and is reflected in the outlook we provided today. On the cash side, we have a strong cash position to support our important strategic objectives for both Canvas and Bridge. And looking forward to 2019, we anticipate being approximately free cash flow neutral for the full year.

    Beyond simple finances, we have seen some operational changes for international operations as well. The global regions (EMEA, Latin America, APAC) all have more autonomy now, including control over country-specific marketing and product management. The non-US operations have moved beyond being regional sales and support offices into more aggressive engines of growth. In Europe and other regions, the management team has more autonomy is deciding which countries are worth investment for expanding markets, and when. From the Feb 25th investor presentation:
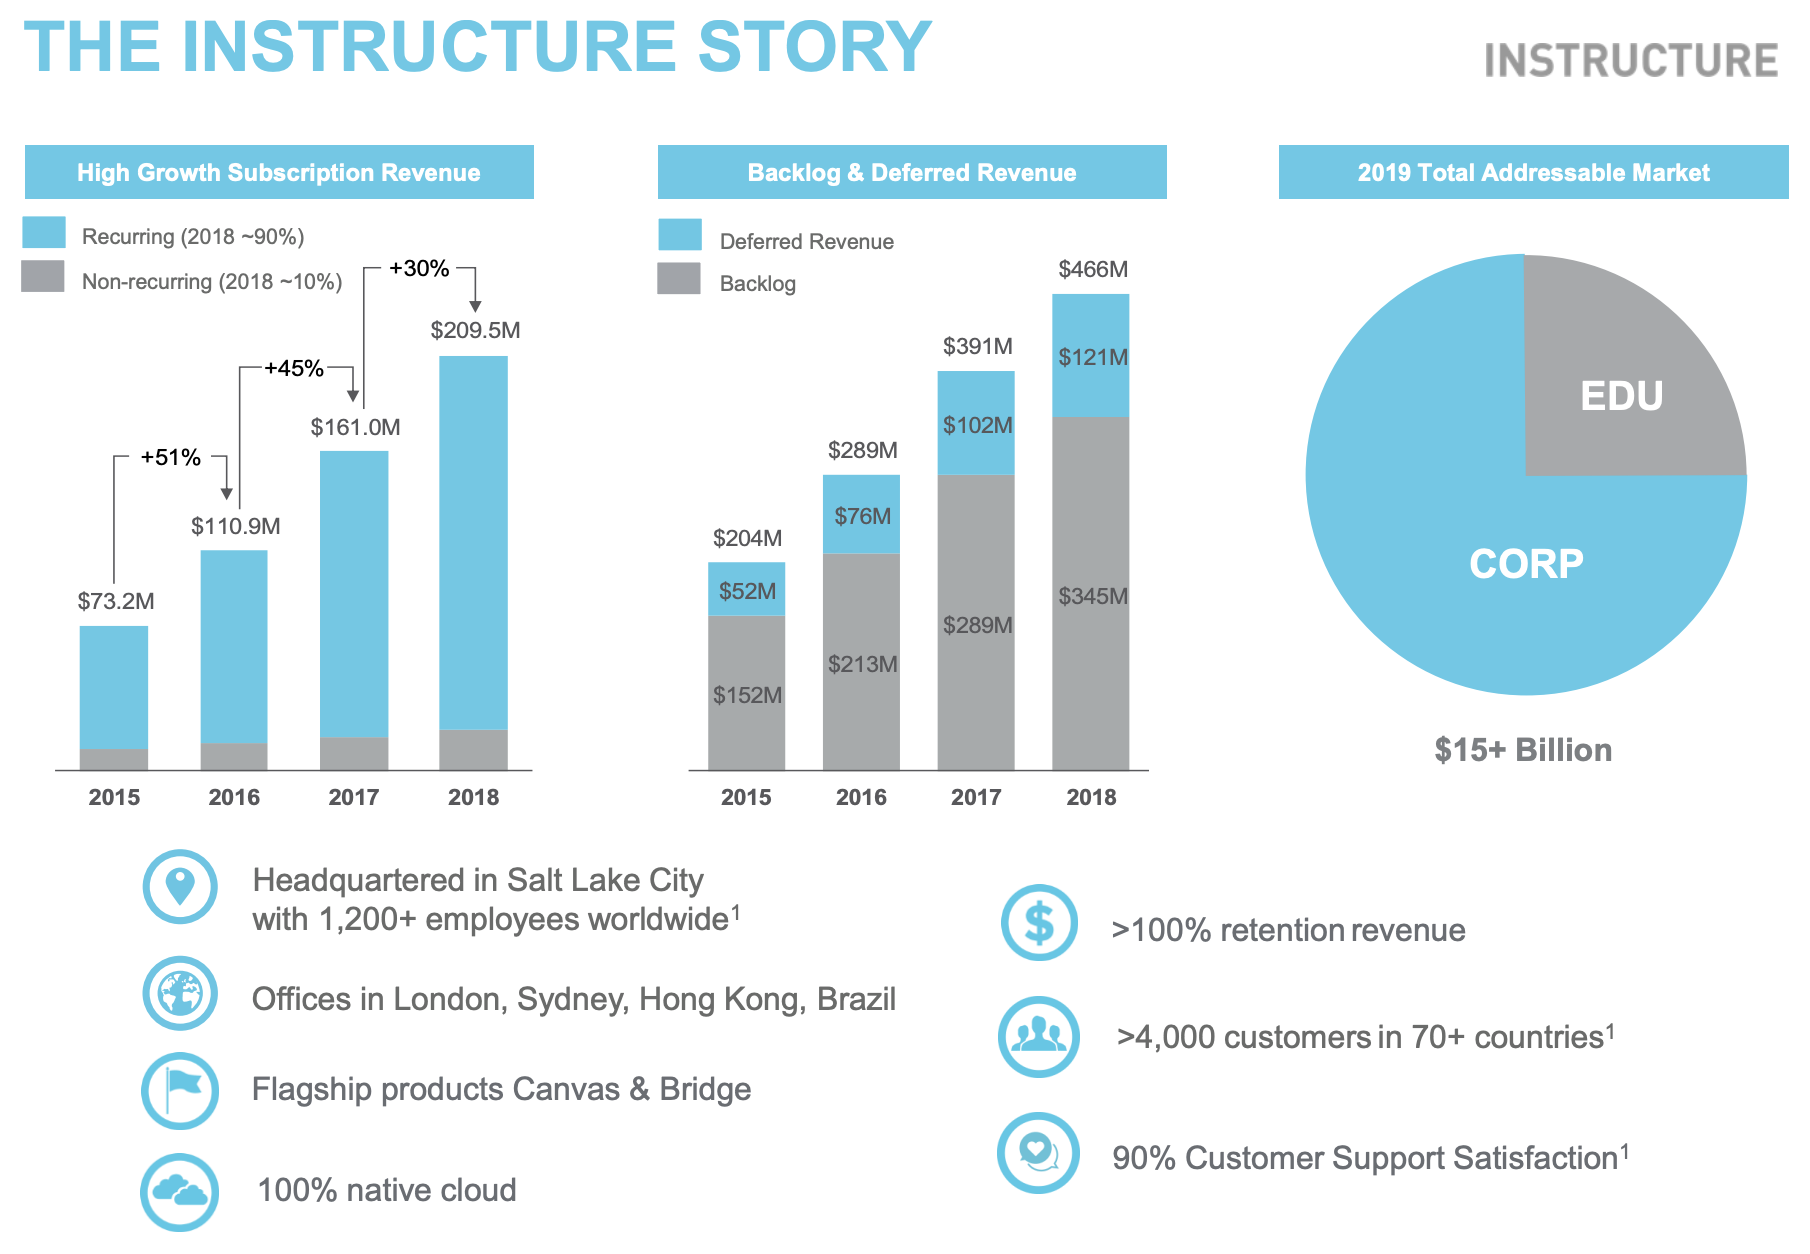
    The Instructure Story

    With the improving operations, Instructure has reduced their operating losses from 57% of revenue to 10% of revenue in the past three years.
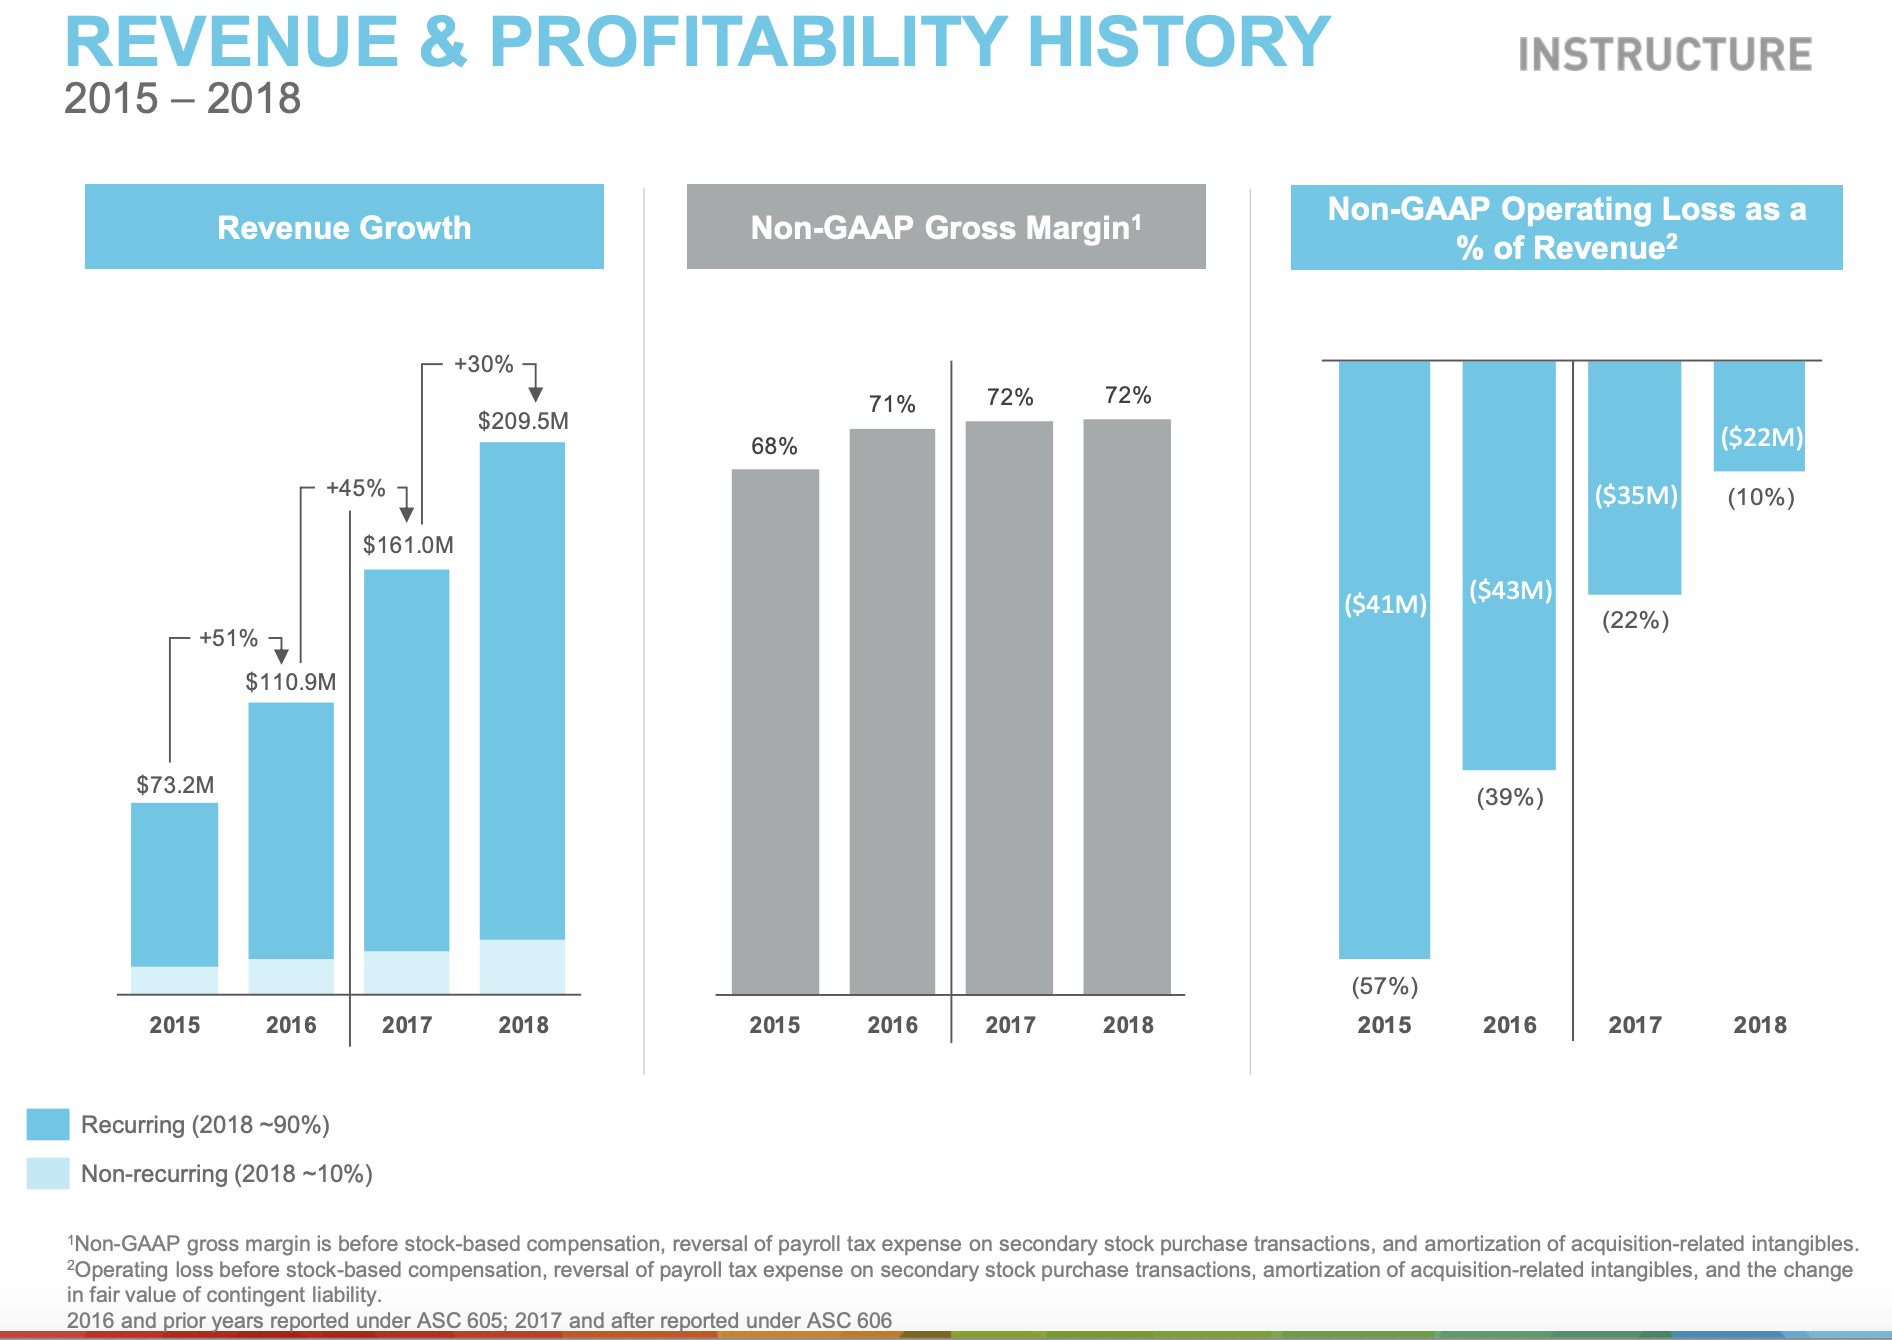
    Investor conference slide

    Moving Beyond the LMS

    On the same day as Instructure’s earnings call and release of FY2018 financial results, the company announced the acquisition of Portfolium for $43 million, a small startup focusing on “ePortfolio network, student-centered assessment, job matching capabilities, and academic and co-curricular pathways”. We interviewed Instructure staff the same day as the earnings call and noted a different message. In our initial call, the Portfolium acquisition was positioned primarily as a way to improve how Instructure can handle structured assessments in the education market – think CBE, mastery learning, with ePortfolios not as the goal but as the necessary infrastructure. During the earnings call, however, the positioning was more about bridging educational and corporate markets and expanding total addressable market (TAM).

    Today, we’ve taken a great stride towards enabling that transition with our expected acquisition of Portfolium, a successful long time Canvas partner. Portfolium vision is to help each person realize their full potential by connecting learning with opportunity, through e-portfolios, program and course level assessments, career pathways and by matching students to job opportunities. Portfolium will join Instructure with a wealth of shared customers, such as Virginia Tech, Santa Clara University and Swinburne University in Australia. This acquisition is a great match in vision and culture and represents our first major step into the Student Success market. And while Portfolium’s current offerings provide an excellent solution, more importantly, they establish the first Bridge between academia and the corporate world that aligns precisely with Instructure’s vision.

    Instructure now views itself as a company with a suite of products, and they are much more open to using corporate M&A to build this portfolio.

    Emphasis on Data & Analytics

    The second initiative announced on the earnings call was DIG, a strategic move with data and analytics.

    I am also pleased to share with you an early insight into our second growth initiative focused on analytics, data science and artificial intelligence. The code name for this initiative is DIG. And this technology platform combined with the most comprehensive SaaS database on the educational experience uniquely positions us to deliver meaningful value to our customers. And from a growth perspective, DIG has the potential to double our TAM in education.

    Instructure started ramping up their data and analytics efforts (again) about a year ago, although the focus was described at the time as being about internal analytics – that is, making Canvas a better and more valuable LMS product. From what I have heard the product validation for DIG are consistent with this message – dashboards, surfacing useful data within a workflow, etc. But that was not how DIG is being sold during the conference call [emphasis added].

    We’ve been working on the scaffolding for [DIG] for well over a year now. I mentioned in our remarks that we already have product validation towards out there in the market. We have instructors and students consuming output from some of the initial experiments with DIG. And we anticipate later this year obviously to make more announcements around specific products and offerings and how we bring them into the market. DIG ultimately is a platform first and foremost based upon machine learning and artificial intelligence. I believe that any multi tenant SaaS company born in the cloud has the opportunity once they hit a certain market share. And in fact, it may even be incumbent upon those organizations to partner with the industry and evolve that industry with new insights and predictive modeling using AI and ML. That’s what DIG is at its heart.

    This is brand new behavior for Instructure as a company. Previously the company was reticent to talk much about non-released products, but now they are talking not just about a new initiative, they are touting buzzwordy machine learning and artificial intelligence and predictive modeling well before any of those capabilities exist or are in customer hands. Goldsmith further clarified the DIG plans during the investor conference discussion [starting at 9:00, emphasis added].

    We already have analytical capabilities in our Canvas platform. I want to be really clear and delineate the difference between an analytics and reporting capability, and a machine learning and AI platform. [snip]

    We have the most comprehensive database on the educational experience in the globe. So given that information that we have, no one else has those data assets at their fingertips to be able to develop those algorithms and predictive models.

    Goldsmith then described an example of predicting a student’s expected performance in a class and how that prediction reliability goes up over time. Then we get the vision.

    What’s even more interesting and compelling is that we can take that information, correlate it across all sorts of universities, curricula, etc, and we can start making recommendations and suggestions to the student or instructor in how they can be more successful. Watch this video, read this passage, do problems 17-34 in this textbook, spend an extra two hours on this or that. When we drive student success, we impact things like retention, we impact the productivity of the teachers, and it’s a huge opportunity. That’s just one small example.

    Our DIG initiative, it is first and foremost a platform for ML and AI, and we will deliver and monetize it by offering different functional domains of predictive algorithms and insights. Maybe things like student success, retention, coaching and advising, career pathing, as well as a number of the other metrics that will help improve the value of an institution or connectivity across institutions. [snip]

    We’ve gone through enough cycles thus far to have demonstrable results around improving outcomes with students and improving student success. [snip] I hope to have something at least in beta by the end of this year.

    Wow. Robot tutor in the sky – meet the new kid on the block.

    The most generous interpretation I have is that they are being sloppy in their terminology and casually throwing out machine learning and AI to eager investors, while the reality could be more mundane but useful sharing of useful data to help instructors or administrators.

    If I had to guess, however, I would suggest that Instructure has its sights set on additional corporate acquisitions over the next year or two to try and back up these expectations. I hope they realize they are not the first company to believe that AI on top of their best-in-world data will deliver success for all.

    The message is also clear that Portfolium and DIG are intended to increase TAM. This means separate product categories with separate pricing in addition to Canvas. Either that or offering Canvas at different pricing levels to include add-on product bundles.

    Challenges in Completing Products

    We noted the modernization efforts behind Quizzes.Next, the next generation quizzing and test engine for Canvas, as well as the big schedule miss. In short, Quizzes.Next was announced at InstructureCon 2016 as being available within a few months. 12 months later at InstructureCon 2017 it entered limited beta, and at InstructureCon 2018 it entered general availability. But the story is not over. Quizzes.Next is still not at feature parity with the original quiz engine, as noted by Indiana University.

    Instructure has released a new quizzing tool for Canvas called Quizzes.Next. Quizzes.Next offers several new features and question types, but is missing many features from the current Quizzes tool on which many instructors depend. Both tools will continue to be available until Quizzes.Next has achieved feature parity with Canvas Quizzes. The original Canvas Quizzes tool will eventually be retired, but Instructure has not yet announced the timeline.

    If you read the Canvas Community page comparing features, it is clear that feature parity is not imminent. The transparency is impressive, however, and from what we are hearing customers are still giving Instructure some leeway because of trust. But Quizzes.Next and its delivery is a continuing problem, not least of which is the reduction in R&D spending growth for Canvas, described by CFO Steve Kaminsky on the call.

    Regarding the R&D investment, we don’t really break that out. But what we can tell you qualitatively is while we are doing some incremental investments on the Canvas side and DIG is a good example of that, the lion share of the growth in R&D is going into Bridge.

    What to Expect

    Instructure is at a crossroads. While they continue to grow, especially in education markets, and while they report improving financial performance, Instructure is entering uncharted territory (for them) in this second chapter. It is remarkable that they have not lost a major educational LMS customer in the 8+ years since Canvas was first selected by the Utah Education Network, but there are some warning signs that should not be ignored and some risky expectations being set.
  • D2L: Continuing emphasis on services and completion of move to SaaS model

    D2L: Continuing emphasis on services and completion of move to SaaS model

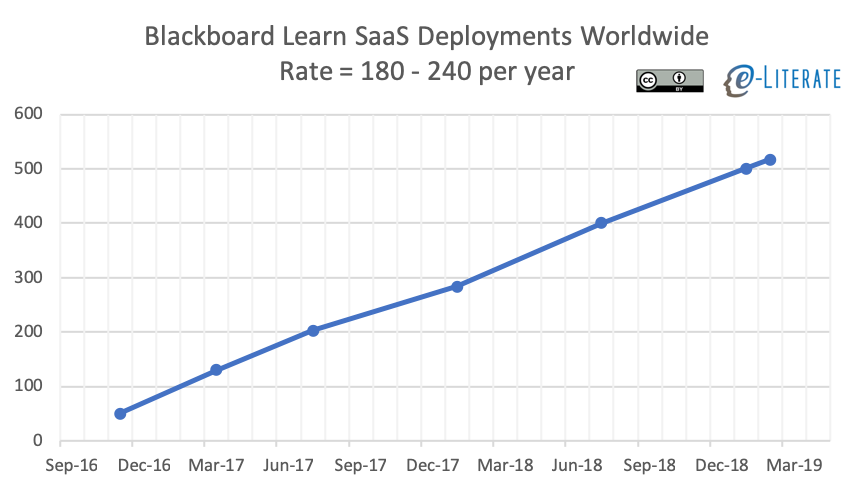
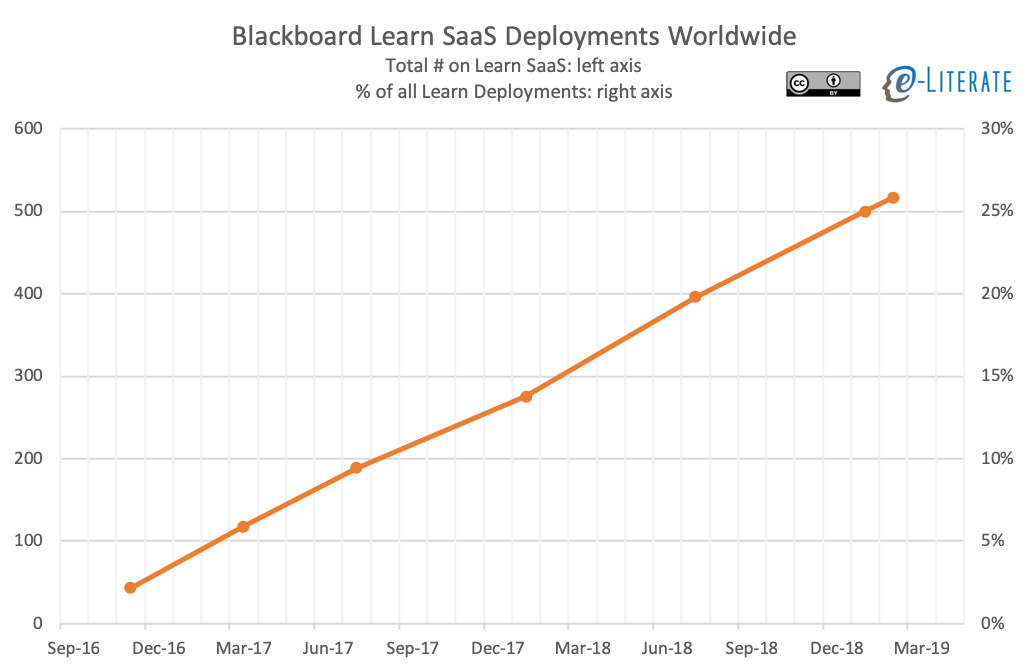
    In last week’s post on Blackboard, I shared the roughly linear progression of migration of the Learn LMS to a software-as-a-service (SaaS) model – a move that we believe is more important than is the Learn Ultra user experience. If you take into account percentages of total Learn deployments, you see that Blackboard has roughly 25% of Learn clients on SaaS after starting in late Fall 2016, increasing by approximately 10% per year. ((Each point is taken from Blackboard public release of information either directly to us at e-Literate or in press releases.))


    Blackboard Learn SaaS Deployments over time

    Blackboard is not the only LMS company migrating to the cloud, however, and D2L  ((Disclosure: D2L and Blackboard and Instructure are all subscribers to our LMS Market Analysis service.)) has taken a more aggressive bet on SaaS for their Brightspace LMS platform (also based on AWS), as described in Summer 2018.

    While we heard grumblings from multiple clients during the transition – especially through early 2017 – D2L clearly made some hard choices and and is aggressively moving to the cloud, not just as an option, but as their primary delivery model. According to David Koehn, VP of Product Management at D2L:

    • All new Brightspace implementations are on AWS cloud;
    • Virtually all current Brightspace implementations use Continuous Delivery; and
    • Approximately 50% of current customers are already on the AWS version of cloud deployment; and
    • By the end of 2018, a large majority of customers will be on cloud deployment.

    Last Fall I spent time at D2L’s Kitchener, Ontario headquarters getting an update on the company’s progress on a number of initiatives. D2L executives described that all but roughly a dozen Brightspace clients are now on SaaS deployment, and by the end of 2019 they should be fully a SaaS platform company.

    Why is percentage of total deployments important? Two reasons are that the move to 100% SaaS deployment enables the movement to a single version of code, dramatically simplifying regression testing and enabling more rapid development of new designs, while also taking advantage of modern technology stacks. As described in the Summer 2018 post:

    David Koehn also pointed out that the real driver for the AWS cloud move by D2L is to enable a redesign of the user experience [branded Daylight] and to provide improved scalability and reliability. In other words, the cloud deployment is a means to the Daylight end.

    The downside, of course, is that pure SaaS deployments largely leads to a reduction in customization capabilities. Companies like D2L and Blackboard that are moving from an enterprise model to a cloud model are betting that they can build in appropriate configuration options (rather than customized code) and leverage third-party integrations to overcome this challenge. But to get the full advantage of SaaS, a company needs to do the entire move.

    I further spent some time in London and had the opportunity to talk with D2L’s London-based leadership team that covers EMEA and Latin America regions. D2L leaders in London presented a transparent and honest appraisal of the company’s current market position in Europe and Latin America, and where they see the biggest opportunities. For starters, D2L acknowledged that Instructure’s system-wide wins for the Canvas LMS in the Nordic countries had largely blocked opportunities for expansion in that region. Other areas, however, have been much more promising. They are doing well particularly in the Benelux countries (Belgium, Netherlands and Luxembourg) with Ghent University in Belgium being an example of a recent, large (45,000 student) implementation. There have been important wins in the UK and Ireland, and activity in Spain seems to be picking up some momentum. Germany continues to be a challenging place to get a foothold partially due to university funding that favors in-house staff maintaining open source systems.

    In Latin America, D2L was open about cutting back investment in the region in 2017, particularly in Brazil, largely due to economic uncertainties and limited growth opportunities. They now see activity picking up in the region and have been investing to take advantage of the market potential.

    In both Europe and Latin America, the provision of professional services beyond the LMS platform, as well as willingness to add requested features, appears to be a differentiator for D2L, especially in comparison to Instructure. D2L has shown a much greater willingness to roll up their sleeves and collaborate on instructional design, course building, and online pedagogy using internal staff, almost in an Online Program Enablement model. It surprised me during my Fall HQ visit to see just how well-established is the content creation team that helps schools redesign courses and even design front-end web sites for online programs. We have heard similar messages from D2L customers and even from a consulting firm that works directly with Canvas and Brightspace customers.

    To a degree, none of this post is different from our Summer 2018 coverage other than updating on progress, so why has D2L not made more of a market share increase in the past year? I suspect there are three reasons. One is that D2L has done a better job updating their product line and introducing new services than they have done in fixing issues with current customers, particularly around data and analytics. During my Fall HQ meetings, when the D2L team was describing their new data and analytics approach called the Brightspace Data Platform, I pointed out that while this appears to be an improved approach, it does not acknowledge that D2L has been touting its data and analytics capabilities for years. There are leftover frustrations from customers based on previous attempts that did not match client expectations.

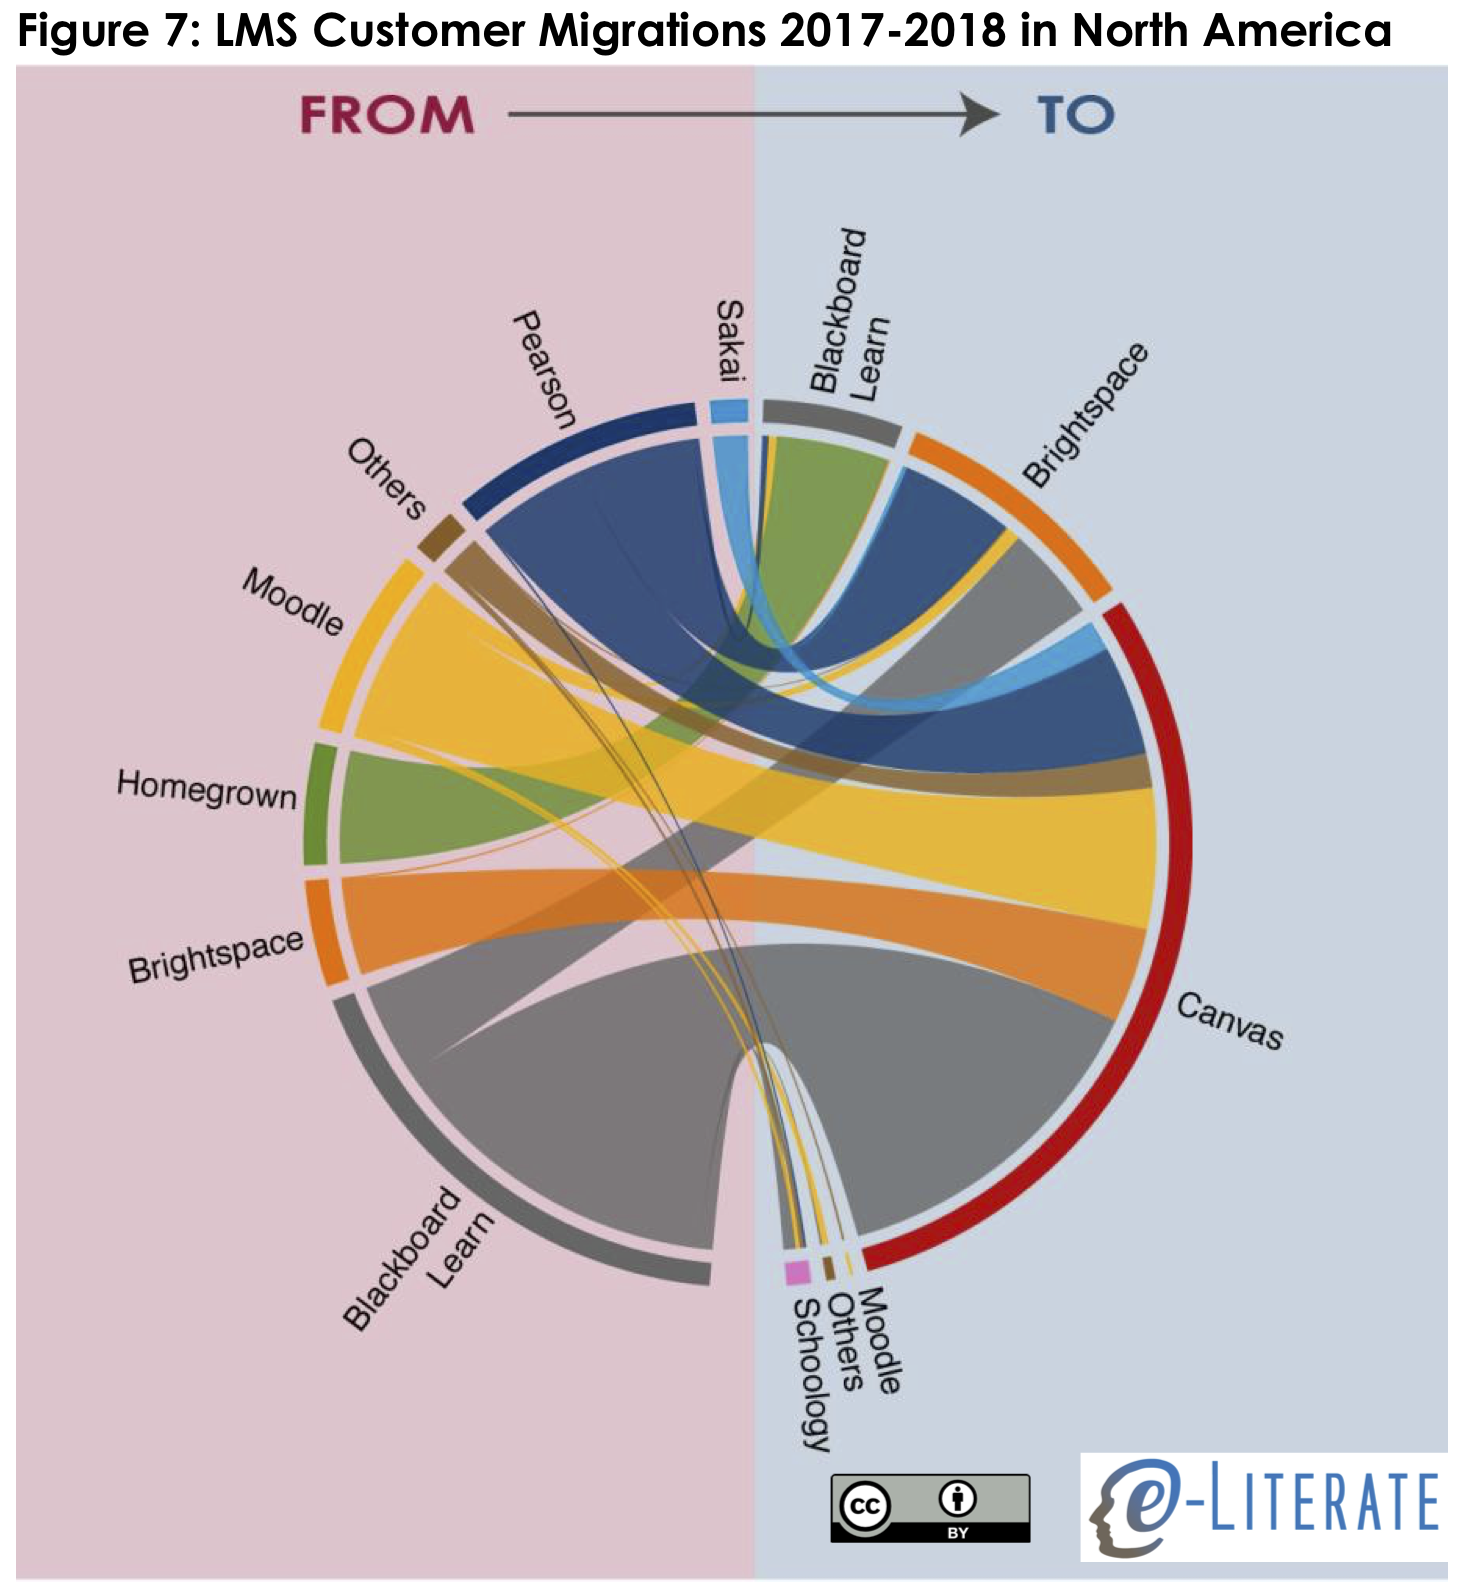
    The second reason is Instructure. While D2L is in a solid second place for new implementations worldwide (schools migrating from one LMS to another), they have also lost a number of clients in North America – almost all to the Canvas LMS. In our recent LMS Market Analysis report, we showed a transition graphic with higher ed LMS migrations from 2017 – 2018.

    LMS Migrations 2017-18 Higher Ed

    The third reason is that it is very difficult to be a third competitor in terms of customer mindshare. The academic LMS market has tended to have a narrative of a major competitor and an upstart. Blackboard and WebCT in the early and mid 2000s, Blackboard and Moodle in the late 2000s, and Blackboard and Canvas through much of the 2010s. It is difficult for a company like D2L to break through this narrative and be top of mind for institutions from day one of an evaluation.

    While D2L has challenges in market position and introduction of a new data and analytics approach, they are completing the transition to a SaaS platform company and focusing on flexibility and services.

  • Blackboard Updates: Learn SaaS progress and LMS market news

    Blackboard Updates: Learn SaaS progress and LMS market news

    Blackboard had a lot of news to share two weeks ago when we spoke with CEO Bill Ballhaus and senior teaching and learning executives. The updates addressed efforts to streamline the business, customer retention, and customer acquisition. Blackboard ((Disclosure: Blackboard is a subscriber to our LMS Market Analysis service.)) was upbeat about their current position and prospects going forward, but we see a mixed picture.

    Ballhaus said that Blackboard’s efforts to simplify the business were paying off and leading to greater focus on their core teaching and learning businesses. While the company was built as an enterprise software amalgamation based on 20+ corporate acquisitions, Ballhaus described how management is looking forward to becoming a Software as a Service (SaaS) business with a simpler focus. While the executives declined to comment on current M&A activity, Blackboard appears to be trying to sell its CashNet and Transact products that are part of the same business line focused on campus ID and payment processing, for up to $800 million and $720 million respectively ((Although it is possible that both of these reports are referring to the same combined transaction – CashNet and Transact together. This explanation makes more sense to me.)). Remembering that Blackboard reportedly tried but failed to sell the entire company for ~$3 billion in 2015, there is no guarantee that they will actually sell either unit or get the desired prices. [Update 3/7: Blackboard did end up selling entire Transact business unit , including CashNet, to PE firm Reverence Capital for a reported $720m.] But if they do succeed, the profits from either sale will help the company pay down and manage its debt. And it will back up the claims of focusing the company on core teaching and learning business.

    The claim of the company looking forward to being a pure-SaaS business is largely based on their ability to migrate the flagship Learn LMS client base over to the AWS-enabled Learn SaaS offering. Blackboard leadership believes that the ongoing migrating effort has been a critical factor in improving their customer retention numbers, an argument that we made last summer.

    The third issue, which is related to the first two, is that we believe that the migration to Learn SaaS might be a better indicator – at least in the short run – than Ultra adoption of whether a school plans to stick with Blackboard. Whether or not the school enables Ultra base navigation or any courses in the Ultra Experience.

    When a school moves to Learn SaaS, they tend to sign contract extensions for 1 – 3 years to cover the new services. And the migration to Learn SaaS does not suffer from the vague terminology issues – a school either uses Learn deployed on SaaS (through AWS) or they don’t.

    Ballhaus went so far as to say that Blackboard’s improvements in client retention was the primary factor in the overall market slowdown last year. While we certainly feel that Blackboard has benefited from the slowdown and has improved client retention lately, we are not convinced on the cause and effect dynamics. By tracking the public proclamations of Learn SaaS adoptions, we see an interesting linear trend leading to the current ~25% of Learn clients being on SaaS.

    Learn SaaS Adoptions Over Time

    Blackboard continued to present the importance of their broad product portfolio combined with their experience. Ballhaus stressed that the LMS is necessary but not sufficient as a strategy for the company. Blackboard management sees Blackboard at an inflection point in 2019 in a good way, and they stressed that their big focus will now be on data and analytics offerings. Remember this paragraph when we get to the Instructure update post.

    Early in February Blackboard announced what could be their biggest LMS win since we broke the news of University of Phoenix selecting Blackboard Learn Ultra in late 2015 (a migration that is scheduled to be complete by this summer). From the press release about Galileo Global and their 100,000+ student system:

    Blackboard today announced that Galileo Global Education, a leading international provider of higher education and Europe’s largest higher education group, will roll out Blackboard Learn with the Ultra experience as the common Learning Management System (LMS) for its network of 37 schools with 80 campuses across 10 countries. Blackboard Learn Ultra was selected over other cloud-based solutions for the ease of use, the powerful features, and the unparalleled level of support provided by Blackboard.

    On the surface, this is a big win for Blackboard, but the story comes with a caveat regarding its relevance to the LMS market. What was not shared during our call with Blackboard executives is that they share their private equity owner (Providence) with Galileo as described in late 2017.

    Laureate Education, Inc. (NASDAQ:LAUR), the world’s largest global network of higher education institutions, and Galileo Global Education, a company under the umbrella of Providence Equity, a leading global asset management firm, have signed an agreement for the sale of Laureate’s institutions in Italy and Cyprus for a total transaction value of Euro 225 million (USD 263 million at the current exchange rate).

    Two or three schools within Galileo were already on Blackboard Learn, a few on Moodle, and the majority on Homegrown or not really using an LMS previously. Unless we can get independent confirmation about the nature of the selection (was it truly competitive or was it earmarked for Blackboard as long as they met minimum requirements), I would not extrapolate this news to show broader movements in the market.

    Blackboard also presented some data around roughly 200 new LMS customer acquisitions in 2018 (“new logos”) for both Open LMS (the rebranded Moodlerooms) and Learn.

    • The majority of the reported wins, roughly 120 based on interview, are for Open LMS, showing continued growth for this under-the-radar Blackboard product. These numbers are impressive, but we note that last year the company reported 223 Moodlerooms “new logos” in 2017. It will be interesting to track over time if this deceleration is primarily driven by the general market slowdown vs. fallout from the cancelled Moodle Partner agreement.
    • For the Learn LMS, Blackboard is reporting ~80 new logos in 2018, of which 52% are in higher education. If accurate, this would be a significant turnaround for the company; however, our data do not show this level of new wins for Blackboard unless you include Galileo as roughly 30 “new logos”. We asked Blackboard to back up that number with specifics such as sample listings to see if we have holes in our data, but Blackboard declined to provide further information due to “privacy reasons”. During the same time period, according to our data, Blackboard has lost more than 100 institutions, more than three fourths moving to Canvas and the remainder moving to D2L Brightspace.

    In the end, Blackboard is making steady progress with Learn SaaS deployments and contract extensions, benefiting from the LMS market slowdown, and winning their biggest new LMS account since 2015. We are not convinced that Blackboard is causing the slowdown or that their new Learn momentum goes beyond Galileo Global, but there are signs of progress worth sharing.

    Update 2/27: Fixed description of CashNet and Transact, which are part of the same business line, and added footnote.

  • State of Higher Ed LMS Market for US and Canada: 2018 Year-End Edition

    State of Higher Ed LMS Market for US and Canada: 2018 Year-End Edition

    This is the eleventh year I have shared the LMS market share graphic, commonly known as the squid graphic, for US and Canadian higher education. This past year we at e-Literate shifted our LMS Market Analysis reports from Spring / Fall to Mid-Year / End-of-Year to better allow analysis of entire years. With the release of our end-of-2018 report last week to subscribers, it’s time for us to look at updates on the institutional LMS market for North America (US and Canada) higher education. Note that our coverage for the market analysis includes Europe, Latin America, Oceania (Australia, New Zealand, and surrounding island countries) as well as emerging coverage of the Middle East.

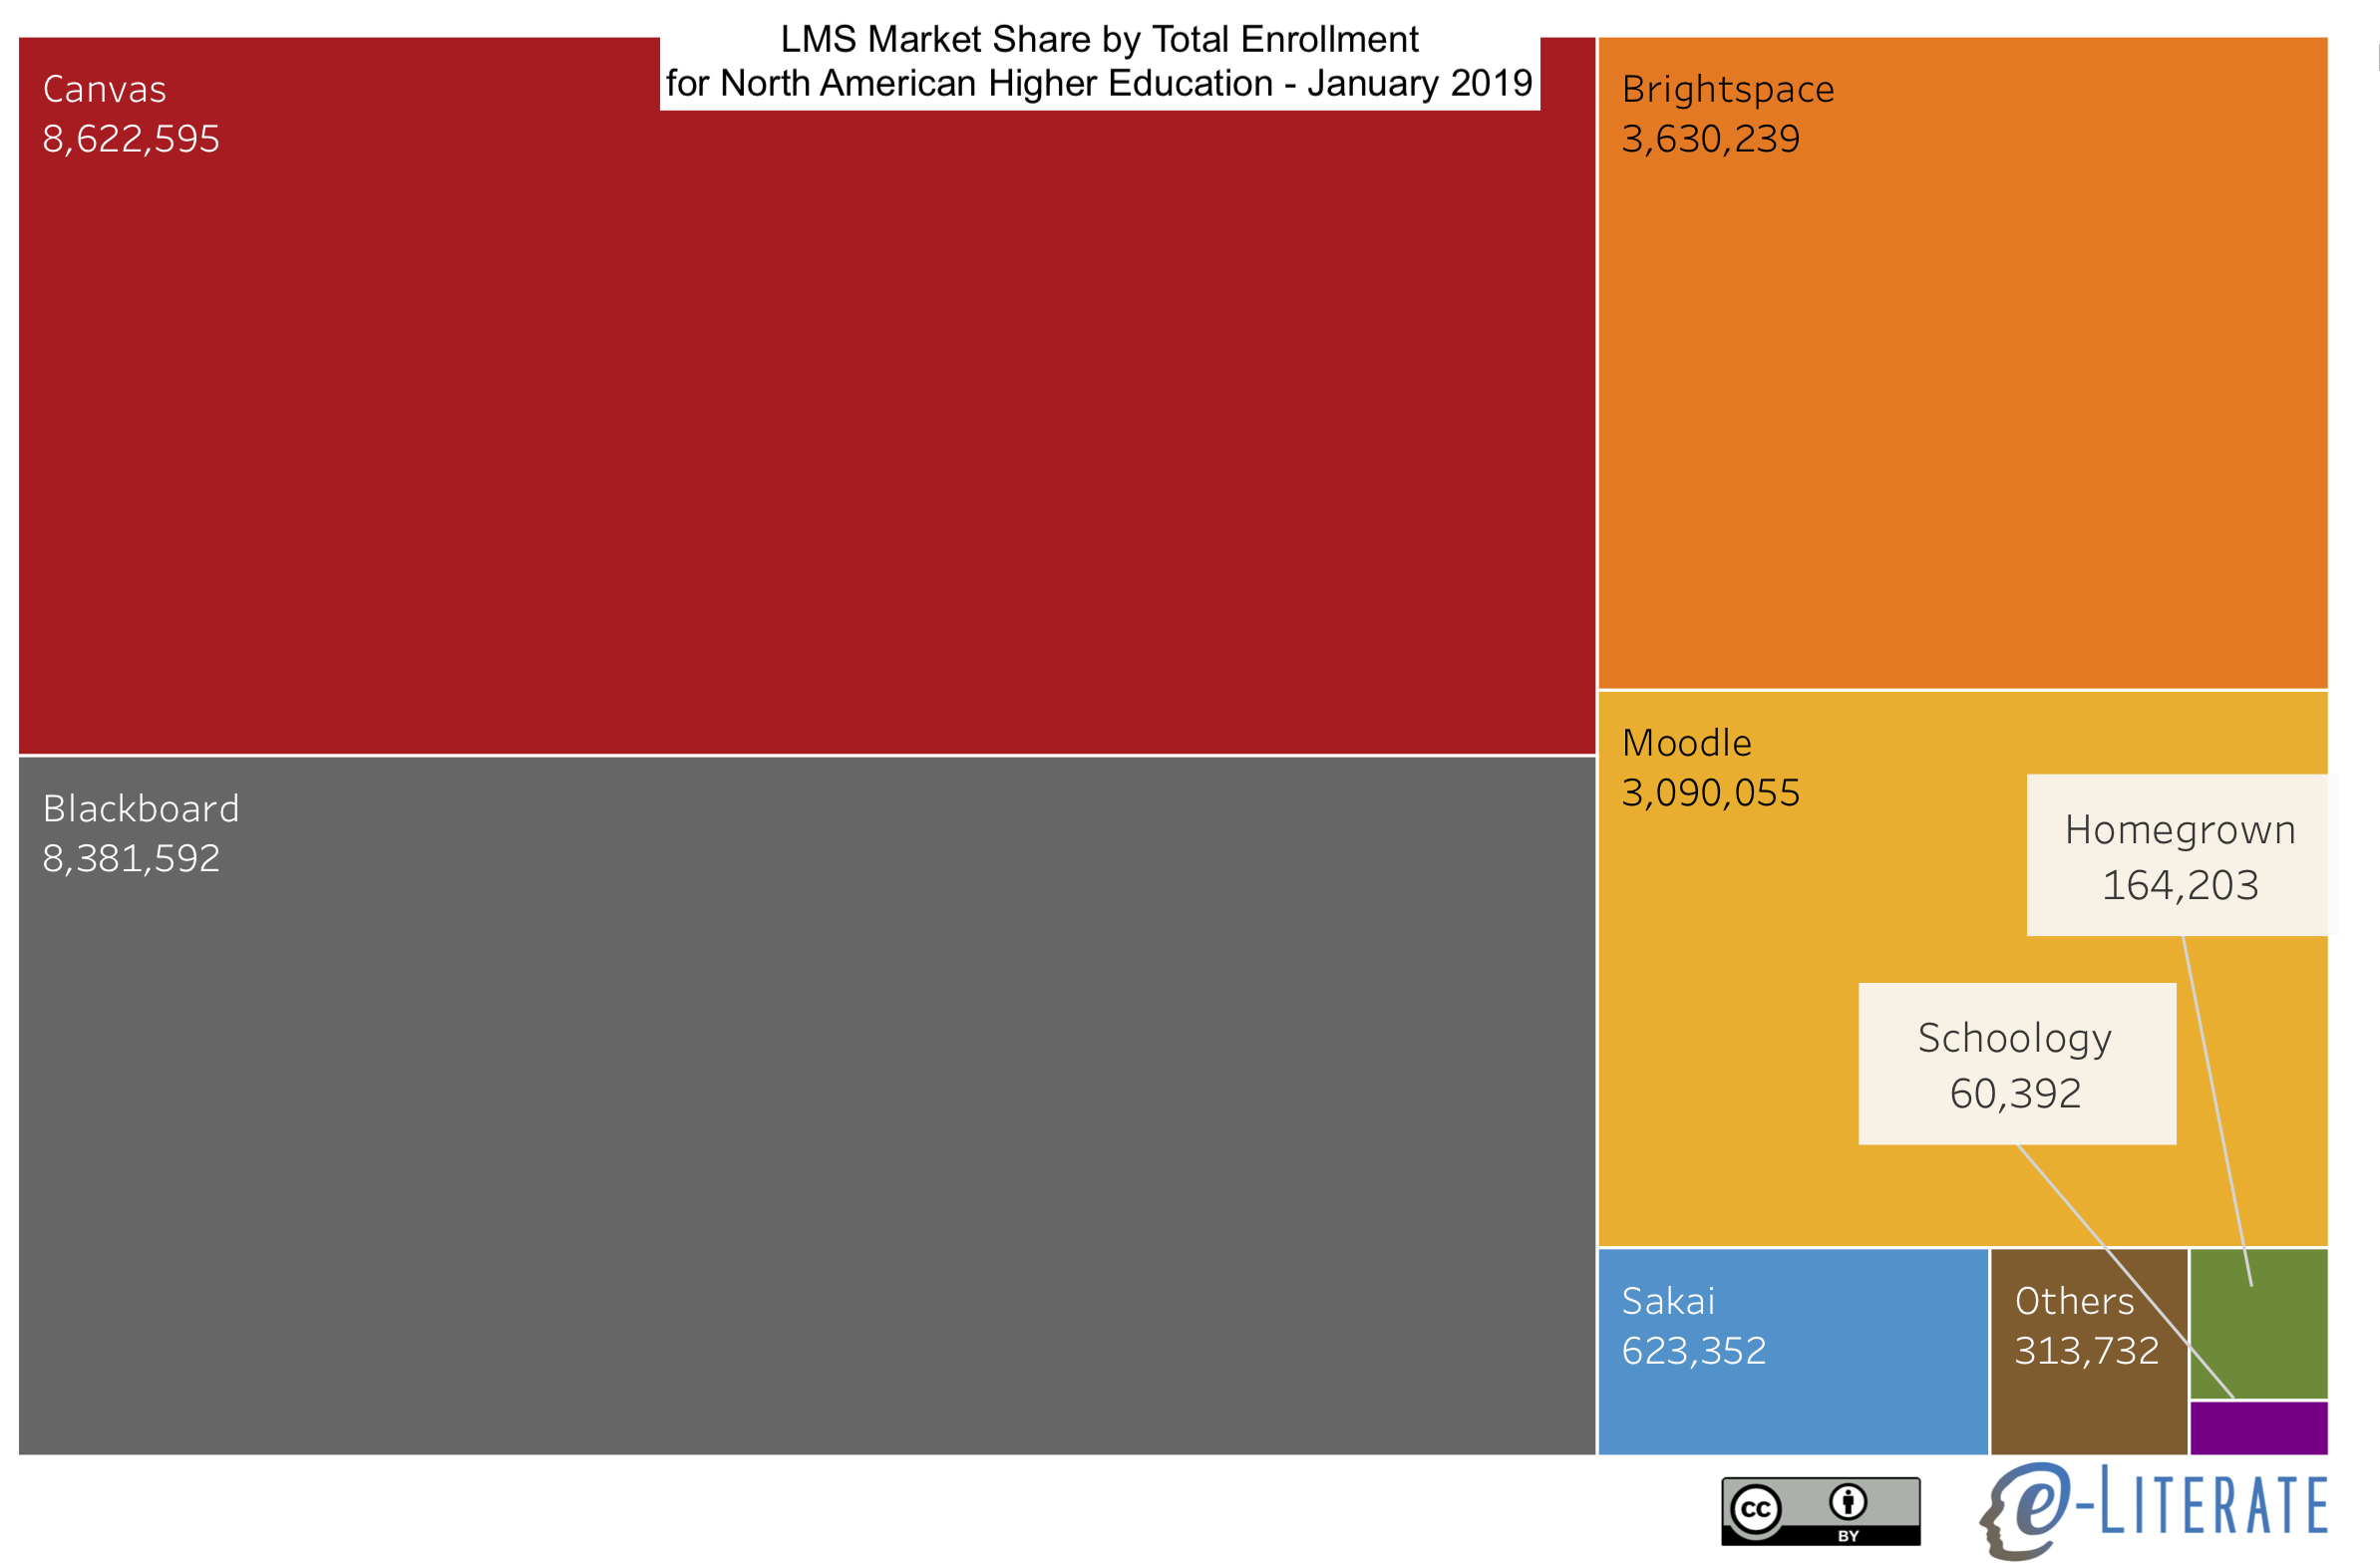
    We present the following data “by institutions”, with market share as a percentage of the total number of institutions using each LMS as a primary system, and “by enrollments”, where we scale the institutions by its total enrollment. The latter better captures the business of the LMS market, since most licensing deals are based the number of students.

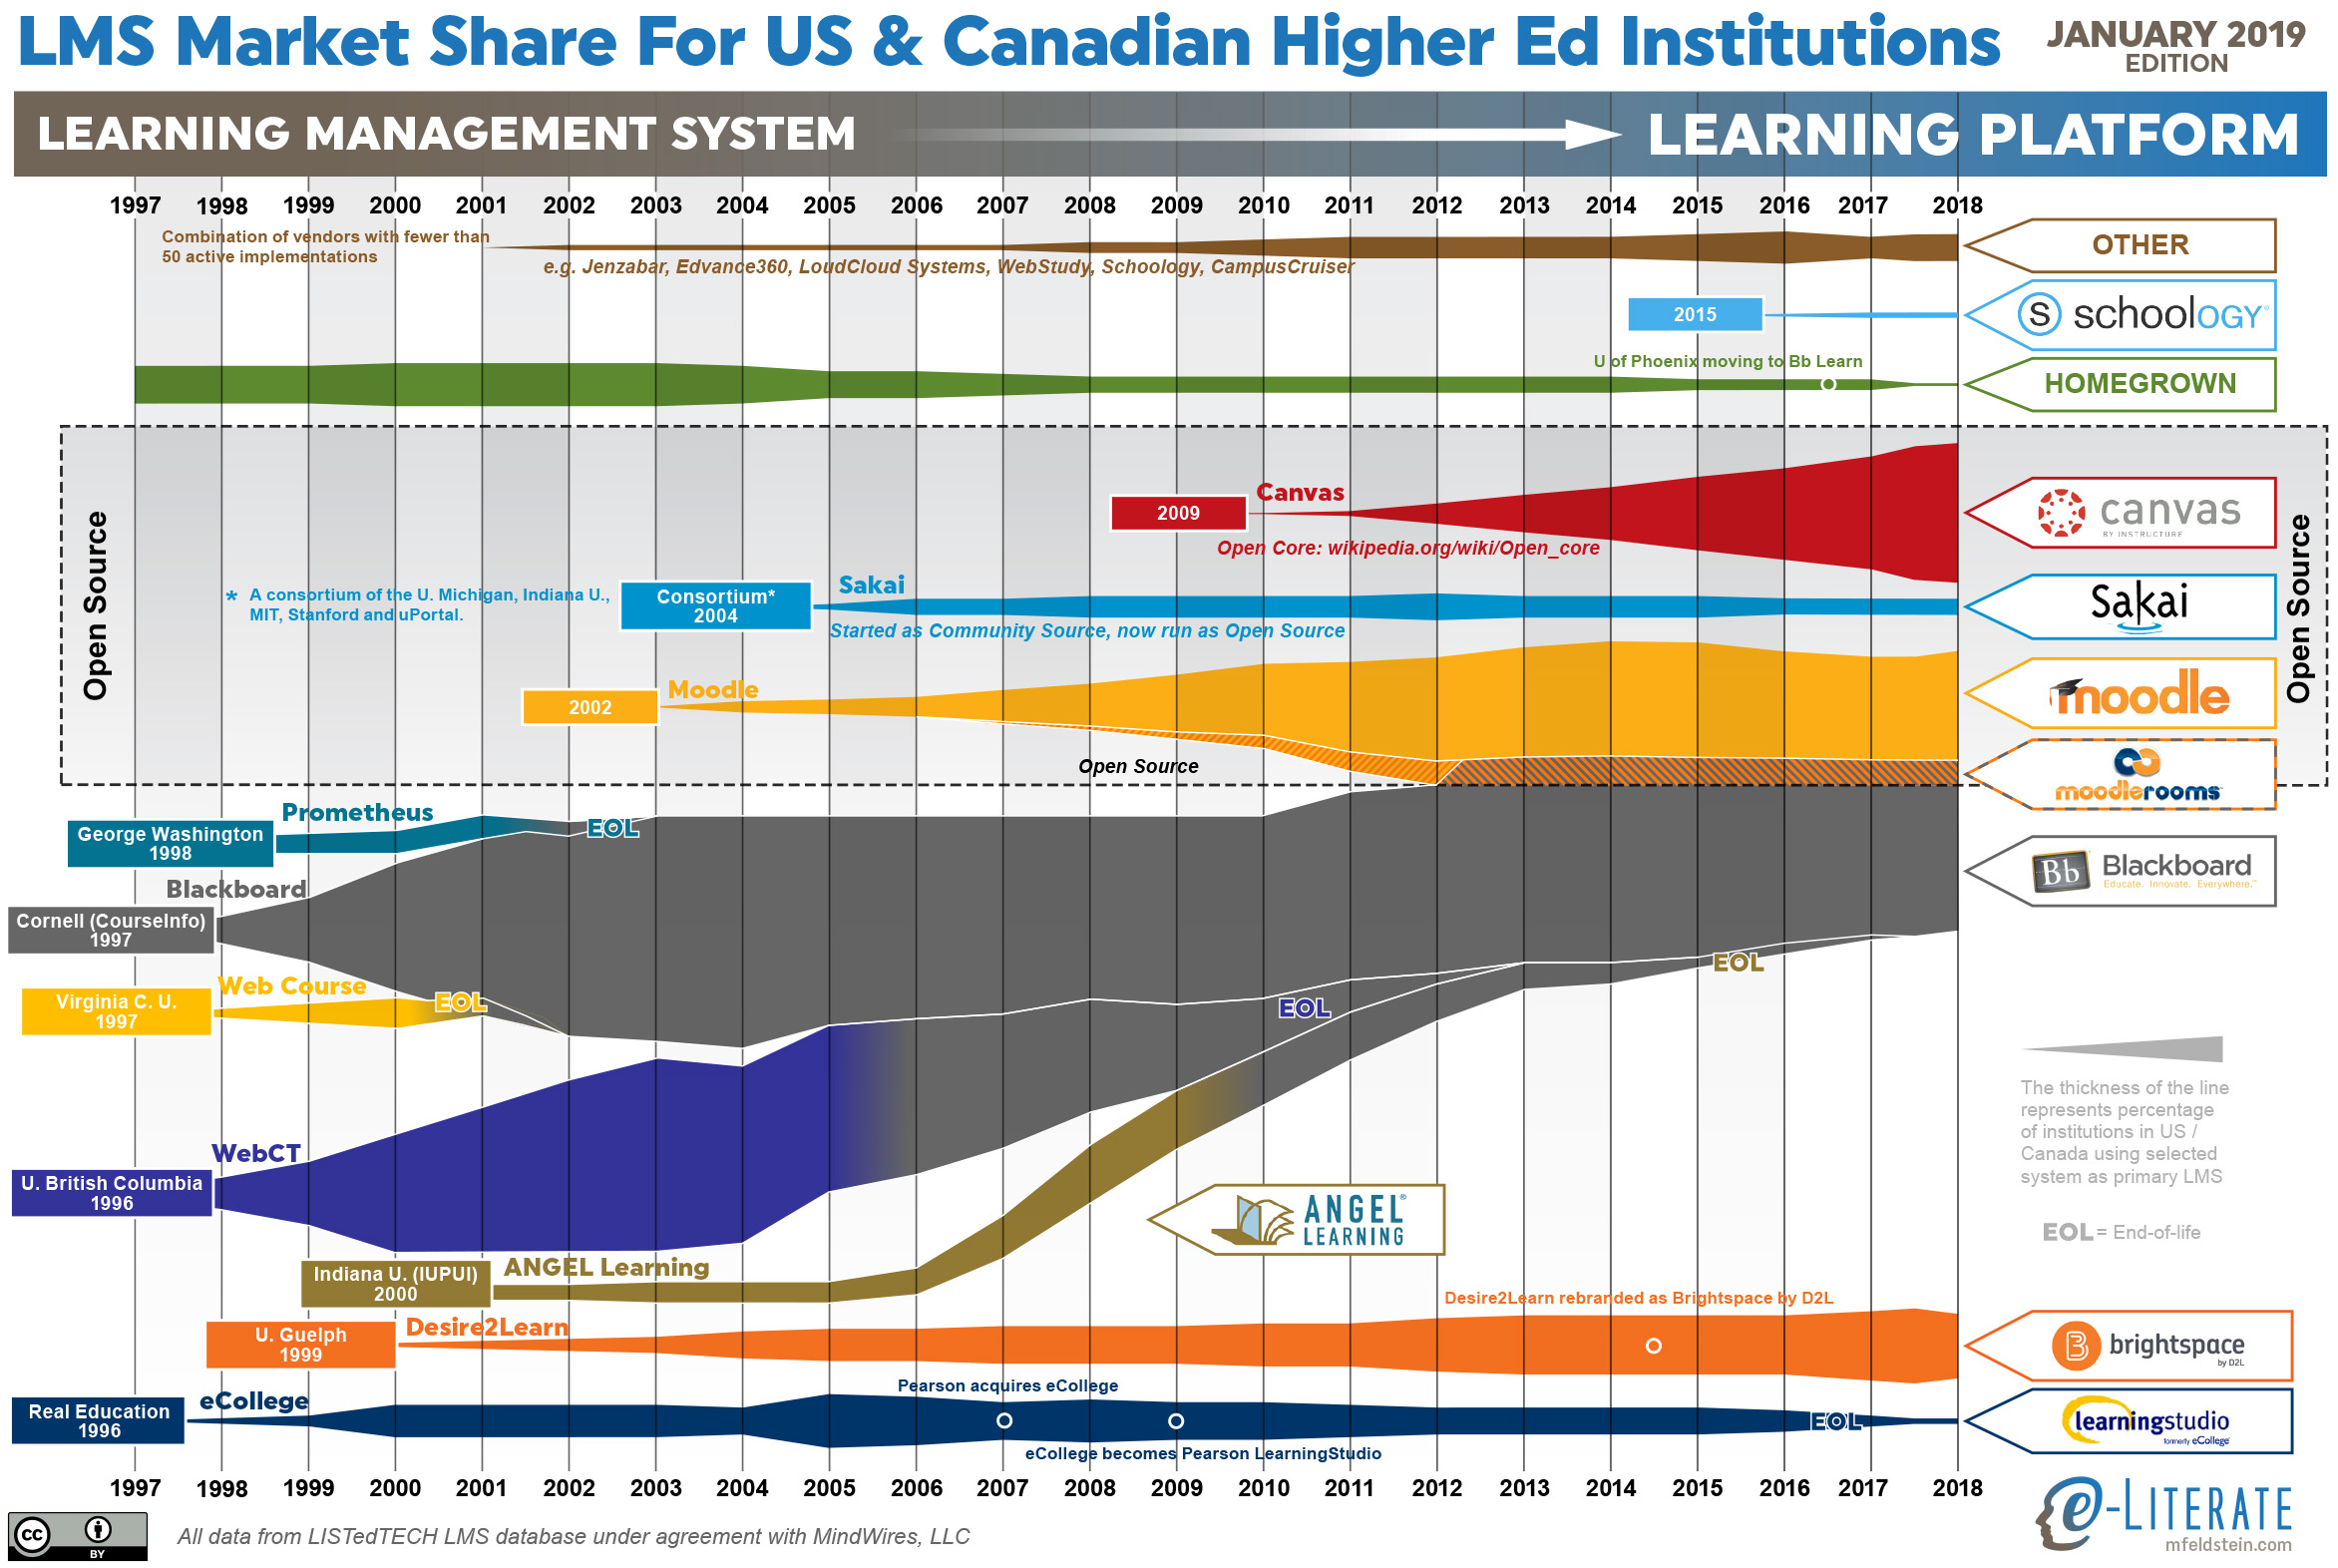
    But first, let’s look at an updated LMS market share graphic, commonly known as the squid graphic, for US and Canadian higher education. The original idea remains – to give a picture of the LMS market in one page, highlighting the story of the market over time. The key to the graphic is that the width of each band represents the percentage of institutions using a particular LMS as its primary system.

    Higher ed LMS market share for US and Canada, January 2019

    This year there are two inter-related trends that deserve a broader explanation -the LMS market slowed down with less activity overall, and Canvas and Blackboard continue to be neck-and-neck in the top spot of this market.

    We recently described the overall market activity slowdown in that there are fewer LMS formal evaluations taking place since mid 2018, with initial data pointing to a 20 – 25% drop from a year earlier. This slowdown seems to be a type of plateau rather than a continuing trend, and we are watching to see if it is temporary or not.

    Last summer we shared the symbolic passing of the torch where Canvas surpassed Blackboard in US market share, which was the first time Blackboard was not the top system since the market emerged two decades ago. What is interesting is that half a year later, the two systems are still neck-and-neck. In the US Canvas is still slightly ahead, and in North America (adding in Canada), Blackboard remains in the top spot by 0.4% (26.8% to 26.4%). Why is Canvas not continuing to extend its lead? Looking at the underlying data, there seems to be three reasons to consider:

    • The overall market slowdown means that there are fewer deals for Canvas to win lately.
    • Blackboard continues its University of Phoenix implementation, which still includes dozens of campuses despite its enrollment drop.
    • The shutdown in December of the for-profit Education Corporation of America (Virginia College and Brightwood College systems) meant that Canvas lost several dozen campuses.

    The latter two points should fully play out in the next three months, possibly making this a one-time change in trends, but it is important to call this situation out.

    Some other notes:

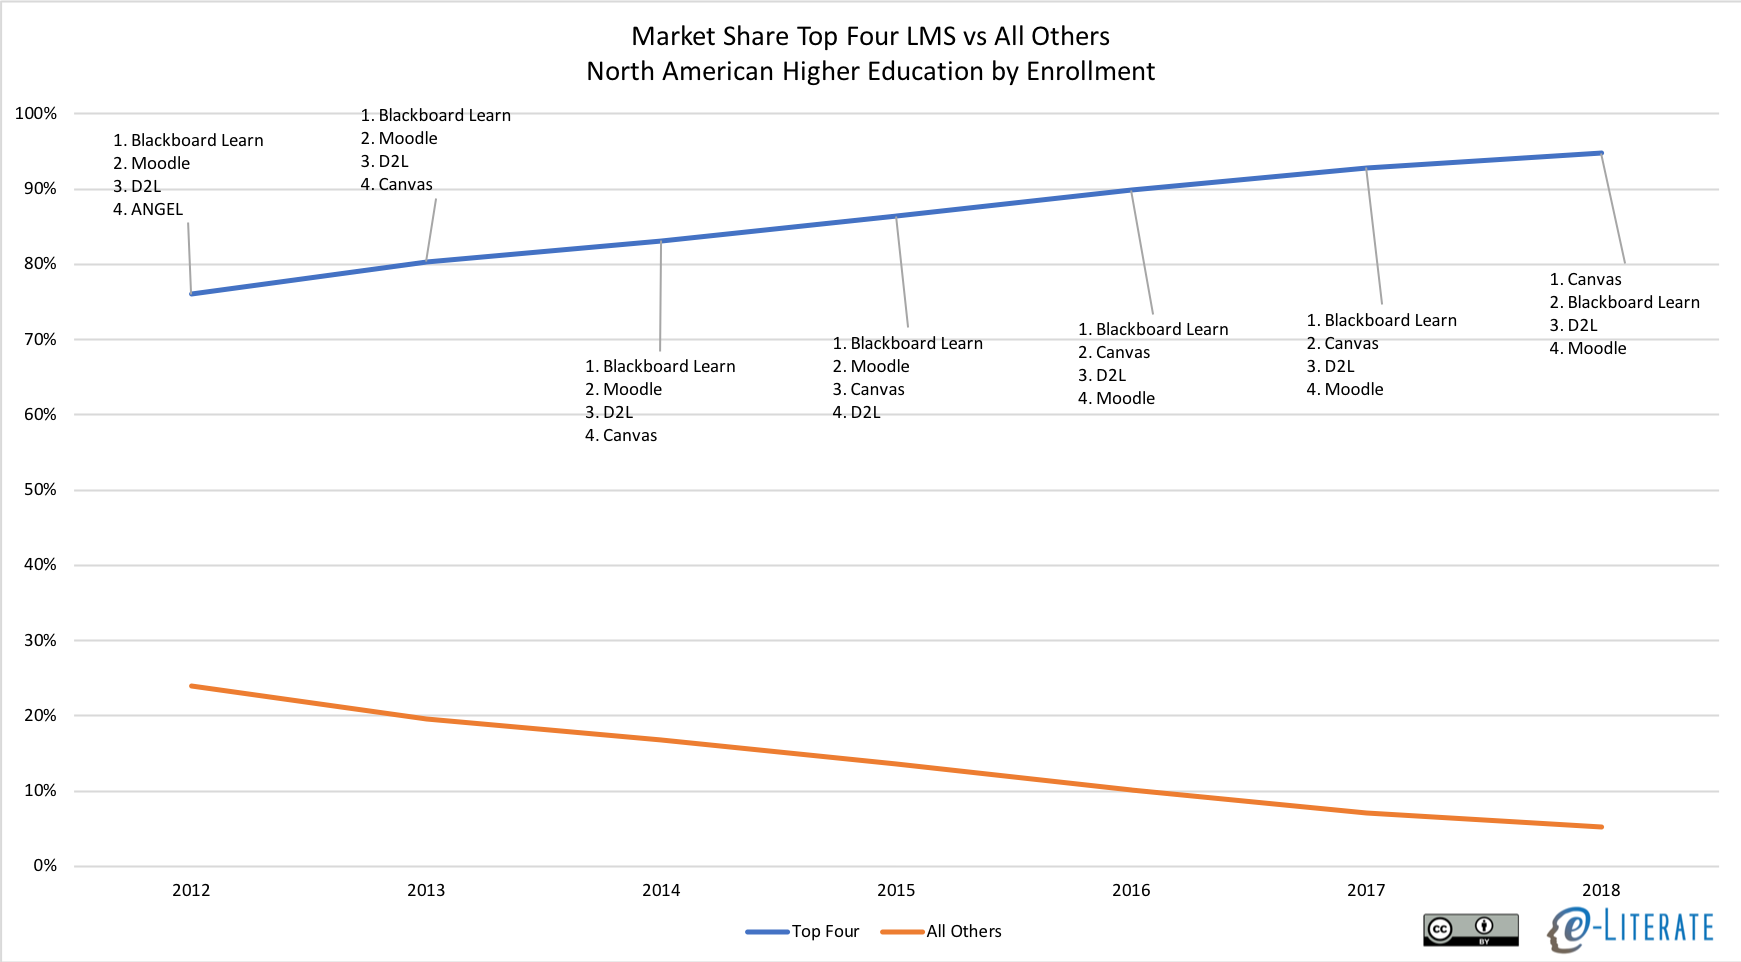
    • The market continues to consolidate around the Big Four – Blackboard, Canvas, D2L Brightspace, and Moodle.
    • The Homegrown option for LMS usage is going away, at least in a statistical sense. Only a handful of schools even consider this option.
    • D2L shares the challenge of having picked up several large for-profit systems that are closing campuses and therefore hurting market share. In D2L’s case, the biggest one is the former EDMC schools – the Art Institutes, Argosy University, and South University – that were sold out of bankruptcy to a non-profit entity and have closed dozens of campuses over the past year. These losses offset many of D2L’s wins in 2018.
    • Moodle had a few new wins in North America.

    Sticking with North America, we can also show LMS market share scaled by the enrollment of each institution, giving a different measure worth considering.

    NA LMS Market Share by Enrollment

    We’ll share more information on other global regions in the coming months.

  • Academic LMS Market Slowdown

    In one of our premium versions of the LMS Market Analysis services, targeted primarily at the investment community, we have noted since early summer (starting in June 2018) that the global LMS market appears to be slowing down for higher ed. Given our public market analysis role and given the trend now lasting more than half a year, this news seems more than just a note for investors.

    Based on CFO Steven Kaminsky’s comments during Instructure’s quarterly earnings call, we’re not the only ones noticing:

    So for renewals what we’ve seen specifically this year is fewer large deals in the multi-hundred thousand dollar range than we’ve seen in previous years. It’s a little still too early to talk about 2019, we’ll be doing that in a few months but we have seen that and when I referenced earlier that it didn’t look like we’re going to grow domestic Canvas by much of it all, that’s what I was really referring to, that’s the key driver there.

    A recent analysis note from Brian Peterson at Raymond James shared similar observations.

    Our proprietary higher-ed North American LMS tracker pointed to a notable slowdown in large deal activity in 2018, with full year levels (as defined by the number of students) down in the double digits.

    But first a note about our data to help readers determine how to interpret the description of this trend.

    Along with new implementations (changes from one LMS to another at a particular institution), we also track what we call “First Seen” data. This captures how many LMS decisions we capture in a given month, and over time this metric acts as a leading indicator of implementation changes. This data is broken down by global region (North America, Europe, Latin America, and Australia / New Zealand are currently covered), LMS provider, and enrollment band (to capture institution size).

    What we noted in Summer 2018 was a fairly dramatic drop in First Seen data, particularly in North America. Over time, we also noted a change in Trailing 12 Month data from New Implementations (total of previous 12 months for each measured month to smooth out market seasonality). For Dec 2018 T12M data, capturing the full 2018 calendar year, the activity of new implementations is roughly 20 – 25% lower than it was a year prior.

    Global academic LMS Market slowdown over past year

    Some notes on the data shown described and above:

    • Even with T12M data smoothing, the trends are still somewhat lumpy, which is the nature of academic markets.
    • The market for implementations seems to have peaked at the end of the spring 2018 academic calendar and then dropped to current levels that represent a plateau rather than ongoing downward trend.
    • To allow reasonable comparisons over time, the data above represents T12M as we knew it at the time. The data is not a full set, as it does not contain implementations we discovered more than a month after the reported month, so the key is to look at trends and not absolute levels.
    • There are other factors to consider that impact company finances, such as the ongoing enrollment declines in North America, particularly among for-profit or formerly for-profit institutions, but we now have two different variables both pointing to at least a temporary dropping of activity.

    It’s premature to determine whether the slowdown will continue or whether market activity will rise again in 2019. We have some statistical and anecdotal indicators for both cases but are not ready to predict yet.

    Hopefully this data description of market activity hasn’t been too tedious, but there are strong arguments that company financial health in 2018 / 19 for the providers will continue to have an outsized impact on the future of LMS offerings.

  • Experience Economy: Enterprise software view into persistence and future of LMS market

    Experience Economy: Enterprise software view into persistence and future of LMS market

    Earlier this month Ben Thompson from Stratechery wrote a post, analyzing SAP’s $8 billion acquisition of Qualtrics, that provides insight into the shift in value proposition of the academic LMS. The SAP explanation along enterprise software lines shows the broader shift of enterprise software extending the view of the internal operations of an organization to also include a deeper view of the end users of an organizations offerings – students in the case of the LMS.

    Thompson describes how SAP was founded in the 1970s and has a dominant position in Enterprise Resource Planning (ERP) systems that use central databases to provide customers with “a ‘real-time’ view of the state of their company” – essentially showing what the company is doing from an internal view. Customer Relationship Management (CRM) products emerged in the 1990s with the rise of ubiquitous PCs and the emerging Internet, tracking interactions with a company’s customers across time and across multiple locations – essentially showing a view of who the customers are and their interactions. Thompson then describes the challenge that modern companies face.

    Fast forward another 20 years and the world has dramatically shifted yet again: not only are computing devices and Internet access ubiquitous, but critically, that ubiquity is not confined to businesses: customers, the ultimate endpoint of any business, are today just as connected as the employees of any large enterprise.

    This can be a rather frightening proposition for large businesses: look no further than social media, where seemingly every week some terrible story about a company with poor customer service goes viral; there are an untold number of similar sob stories shared instantly with friends and family.

    This same trend applies in education, with students being just as connected as faculty and staff of a college or university.

    Thompson then quotes SAP’s CEO from a recent investor call [emphasis added]:

    There are millions of complaints every day about disappointing customer experiences. This is called the experience gap. Businesses used to have time to sort this out, but in today’s unforgiving world, the damage is immediate, disruption is imminent. This has shifted the challenge from a running a business to guaranteeing great experiences for every single person.

    Qualtrics provides a survey tool along with a sophisticated set of analytics and reporting tools based on this data – the key for SAP to understand consumer experiences. What is crucial, however, is not the standalone capabilities of Qualtrics, but the combination, again described by SAP’s CEO [emphasis added]:

    To win in the experience economy there are two pieces to the puzzle. SAP has the first one: operational data, or what we call O-data, from the systems that run companies. Our applications portfolio is end-to-end, from demand chain to supply chain. The second piece of the puzzle is owned by Qualtrics. Experience data, or, X-data. This is actual feedback in real-time from actual people. How they’re engaging with a company’s brand. Are they satisfied with the customer experience that was offered. Is the product doing what they expected? What do they feel about the direction of their employer?

    Think of it this way: the O-data tells you what happened, the X-data tells you why it happened.

    This view of enterprise software navigating the larger trends of ubiquitous technology and connectivity, leading from the what to who to why, provides clarity on many of the trends we see in the ed tech world.

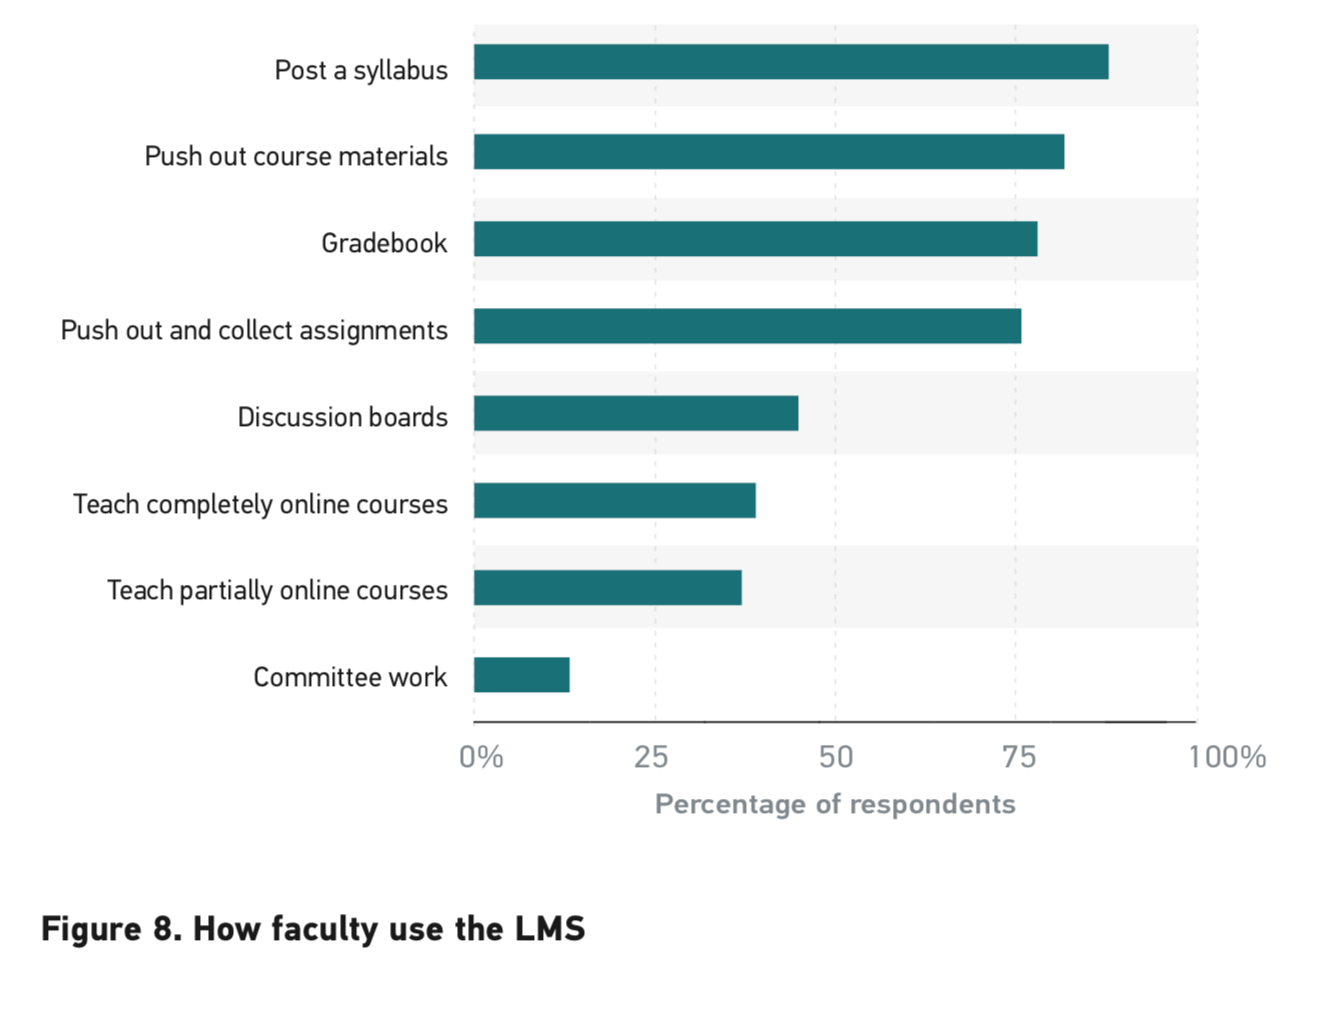
    In education, the Learning Management System (LMS) was originally and more accurately called a Course Management System, and it has historically been focused on the management of courses, primarily through announcements to class, rosters, grade book, distribution of syllabus and course content, and submission of student work. Consider this figure from the ECAR Study of Faculty and Information Technology, 2017 that mirrors several other studies in its results:

    ECAR data on faculty LMS usage

    While the modern LMS has advanced in many ways – particularly around usability, interoperability, and system reliability – the common usage of the this ERP-of-the-classroom has remained fairly steady. The dominant usage is managing the what of courses.

    The LMS provides tools to manage communications – a view of the who of courses – through inbox, discussion boards, announcements, and various conferencing apps, but of these the dominant usage is through announcements. One way communication from faculty to students. The tools are there but not the reality of holistic views of interactions with students.

    The shift in education from running a course to guaranteeing great experiences for students, to bastardize the SAP explanation, is much like the move towards experience management referred to in the Stratechery article. The movement is in its infancy, and it is likely to be measured in terms of decades, not years. Michael referred to this move in his most recent post.

    If you’re a regular e-Literate reader, you know we have a macro thesis that the higher education sector is in the early stages of an evolution from having a philosophical commitment to student success toward having an operational commitment to student success. In other words, colleges and universities are starting to approach student success systematically, not as the natural by-product of hiring good faculty but as something that every student-facing aspect of the institution needs to be optimized for.

    When you talk about student success, and great experiences, you have to go well beyond the official production of course content and grades and rosters. It doesn’t just matter what grades students get, it matters whether each student is learning, whether and when they get frustrated, and how often they’re engaging in the class. This gets to learning analytics and formative assessments and opportunities for students to quickly get help.

    None of this is new, per se, and we’ve even seen attempts at alternative learning platforms to address this richer ecosystem. Consider the learning platforms designed initially to support competency-based education (CBE) such as Motivis Learning (spun out of Southern New Hampshire University’s College for America) or Sagence Learning (formerly FlatWorld Knowledge). These systems ((Disclosure: SNHU and Motivis were past subscribers to our LMS Market Analysis service.)), often called Learning Resource Management (LRM) systems, are designed to “see a holistic view” of students and “track student engagement”. They are designed to achieve the stated goals of SAP to combine operational data and tools along with experience data and tools.

    We’ll get into more detail in future posts, but the category often labeled as adaptive courseware platforms are another example of next-generation systems that are designed to capture both operational data and experience data. These systems blur the boundaries between content and platforms and have the advantage of combining the two into a common design, which should allow deeper instrumentation of student activity during the learning process.

    These examples get to the common question of whether the LMS will survive and exist in 10 years. The original LMS concept was designed around a course, not the learner, and most usage is administrative in nature, not learning activities. Shouldn’t next-generation systems like LRMs overtake the LMS market, as these companies expand beyond just CBE programs (see this post for context)? Well, the data do not show signs of this movement, and in fact the LMS market has been consolidating around just four solutions for institutional adoption – Canvas, D2L, Blackboard, and Moodle.

    Consolidation of NA HE LMS Market

    In the meantime, most of the LMS vendors have been adding functionality, whether through extension of their platforms or strategic integrations with third party tools, that seeks to provide views of the student experience. Learning analytics and reporting capabilities, mastery learning additions, federated sharing of student activity data.

    One reason for the persistence of the primary LMS is that the LRM and courseware markets are not the ERP market. There are no SAPs in these worlds that already have ubiquitous usage. According to the Stratechery article “SAP is at the center of 77% of transactions worldwide”. The LRM typically starts out in a new CBE program with dozens, or maybe hundreds of students.

    What is dominant in higher education circles? The LMS. It is one of the few ed tech solutions used in a majority of courses across online, blended, and face-to-face modalities. What the market appears to be doing is waiting for solutions that build on top of the LMS, or even extend the LMS itself, rather than replacing the LMS. And one of the main reasons is that the LMS has already been accepted as the enterprise system for academic usage, with operational data and tools managing the what of courses. It may be that over time alternative learning platform models will build up enough market share to become a credible threat to change the broader LMS market, but the signs so far are not encouraging for those vendors.

    Qualtrics proved to be so valuable ($8 billion) because it could augment the ubiquitous SAP. SurveyMonkey, by contrast, went public as a standalone company and is worth far less ($1.8 billion, still a respectable number).

    Looking into the future, the LMS will have to provide useful analytics on student outcomes, learning, and experiences along the way. Shifting from mostly running a course to guaranteeing great experiences for students. Whether this happens within the LMS of the future or as third-party augmentations of the LMS, and whether this happens with the current top four vendors or a different set, is not known. But the move to combine operational and experience data and tools is a trend we should expect to see over the next decade, both in ERP systems like SAP and in the academic LMS market.

  • Contrasting LMS Adoption Patterns in Four English-Speaking Countries

    Contrasting LMS Adoption Patterns in Four English-Speaking Countries

    The article is Cross-posted at LISTedTECH.

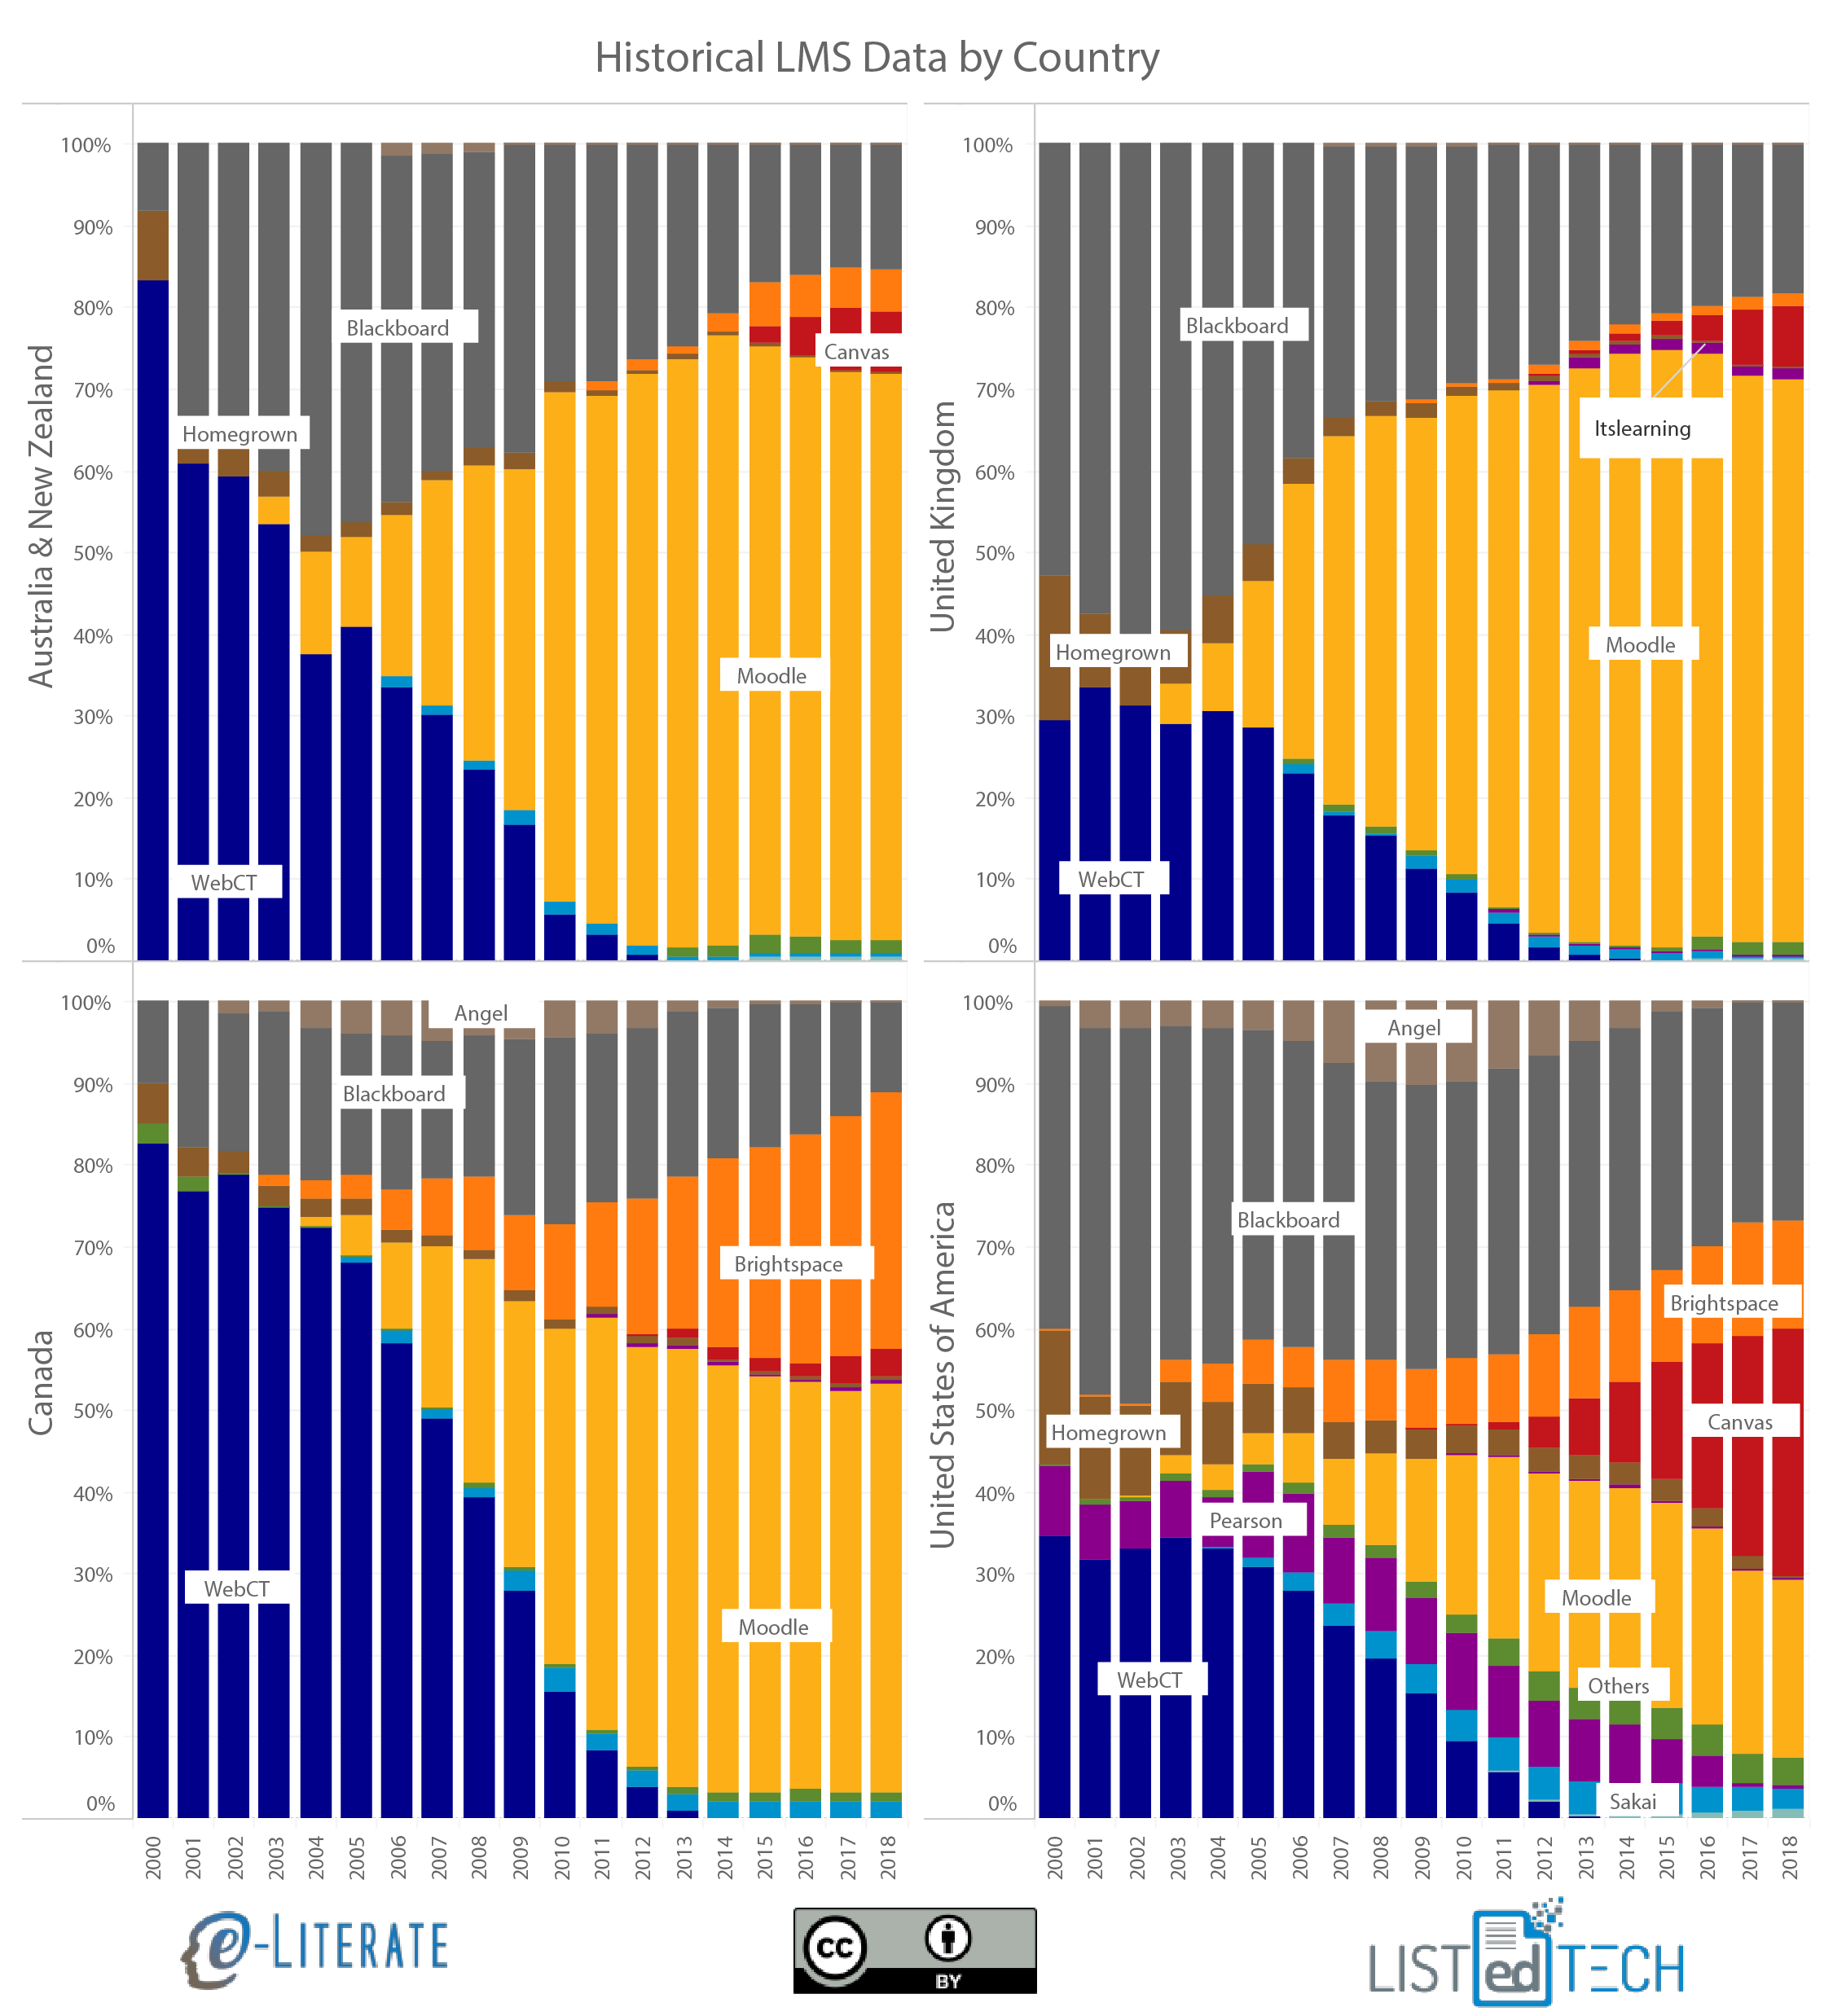
    One of the trends we have been covering is the gradual consolidation of global LMS markets in higher education around “the Big Four”, Moodle, Blackboard, Canvas, and D2L Brightspace. While there are market similarities in terms of this consolidation along with the broader move to the cloud, it would be a mistake to view various global regions as having the same same trends overall, even in a subset of English-speaking countries.

    By taking a step back and looking at institutional market share per country per year since 2000 (i.e. the percentage of higher education institutions having a particular LMS as their primary system), different adoption patterns become more apparent. In this case we’re looking at Australia / New Zealand (see note below), the United Kingdom, the US, and Canada. Note ahead of time that Blackboard acquired WebCT in 2004 and ANGEL in 2009 – this view separates out the product lines regardless of ownership, thus “Blackboard” means “Blackboard Learn / Academics Suite”. Also note that his is just one subset of the global market intended to show different patterns.

    Historical LMS adoption in US, Canada, UK, Australia & New Zealand

    • While the very early market was practically a duopoly, the preference for WebCT vs. Blackboard varied significantly.
    • Australia and New Zealand have a rich history of homegrown LMS development, including CECIL (University of Auckland in New Zealand), which some argue was the very first web-based LMS. There was still quite a bit of Homegrown LMS activity in the early 2000s along with a strong early preference for WebCT over Blackboard. Australia is the home country for Moodle (Perth), yet it lagged the UK in terms of late 2000s adoption of that system.
    • The UK showed a preference for Blackboard over WebCT, while also having significant Homegrown LMS adoptions early in the 2000s. Starting in 2003 we see the most rapid shift towards Moodle of any of these four countries, followed by a more recent move towards Canvas starting in 2013, starting with the Birmingham University adoption.
    • Canada is the home country for both WebCT (Vancouver, British Columbia) and D2L Brightspace (Kitchener, Ontario), and accordingly we see the highest percentages for both systems. This country also shows the slowest market gains for Canvas compared to the other three. Overall, early in the market, Homegrown solutions were much more common.
    • The US – home country to Blackboard, Pearson, Canvas, and Sakai –  is seen as an outlier by not having Moodle as the dominant system in terms of installed base. Pearson LearningStudio, formerly eCollege, was quite important in the US market, largely due to its position in the for-profit sector. And this is the leading country in terms of Canvas installed base and growth.

    There are other patterns to see in the data, but the overall point is to note how different adoption patterns can be in the LMS market, even for a subset of English-speaking countries since 2000. ((Disclosure: Blackboard, D2L, Moodle HQ, Instructure are all subscribers to our LMS Market Analysis service.))

    Update 27 Nov: We have duplicated the x axis to show on both levels for clarify. The data is based on number of institutions and represent running totals of active implementations where we have implementation / decommission dates – approximately 75% of all known active systems. The current totals used for each country are approximately 200 for Australia, 250 for Canada, 700 for the UK, and 3,500 for the US.

    Update 30 Nov: In an embarrassing mistake I credited CECIL to Australia when it was based at the University of Auckland in New Zealand. We have since updated the graphic to include both countries combined and edited the description of that region’s Homegrown activity. The article now combines Australia and New Zealand and treats as one country for the purposes of this analysis.