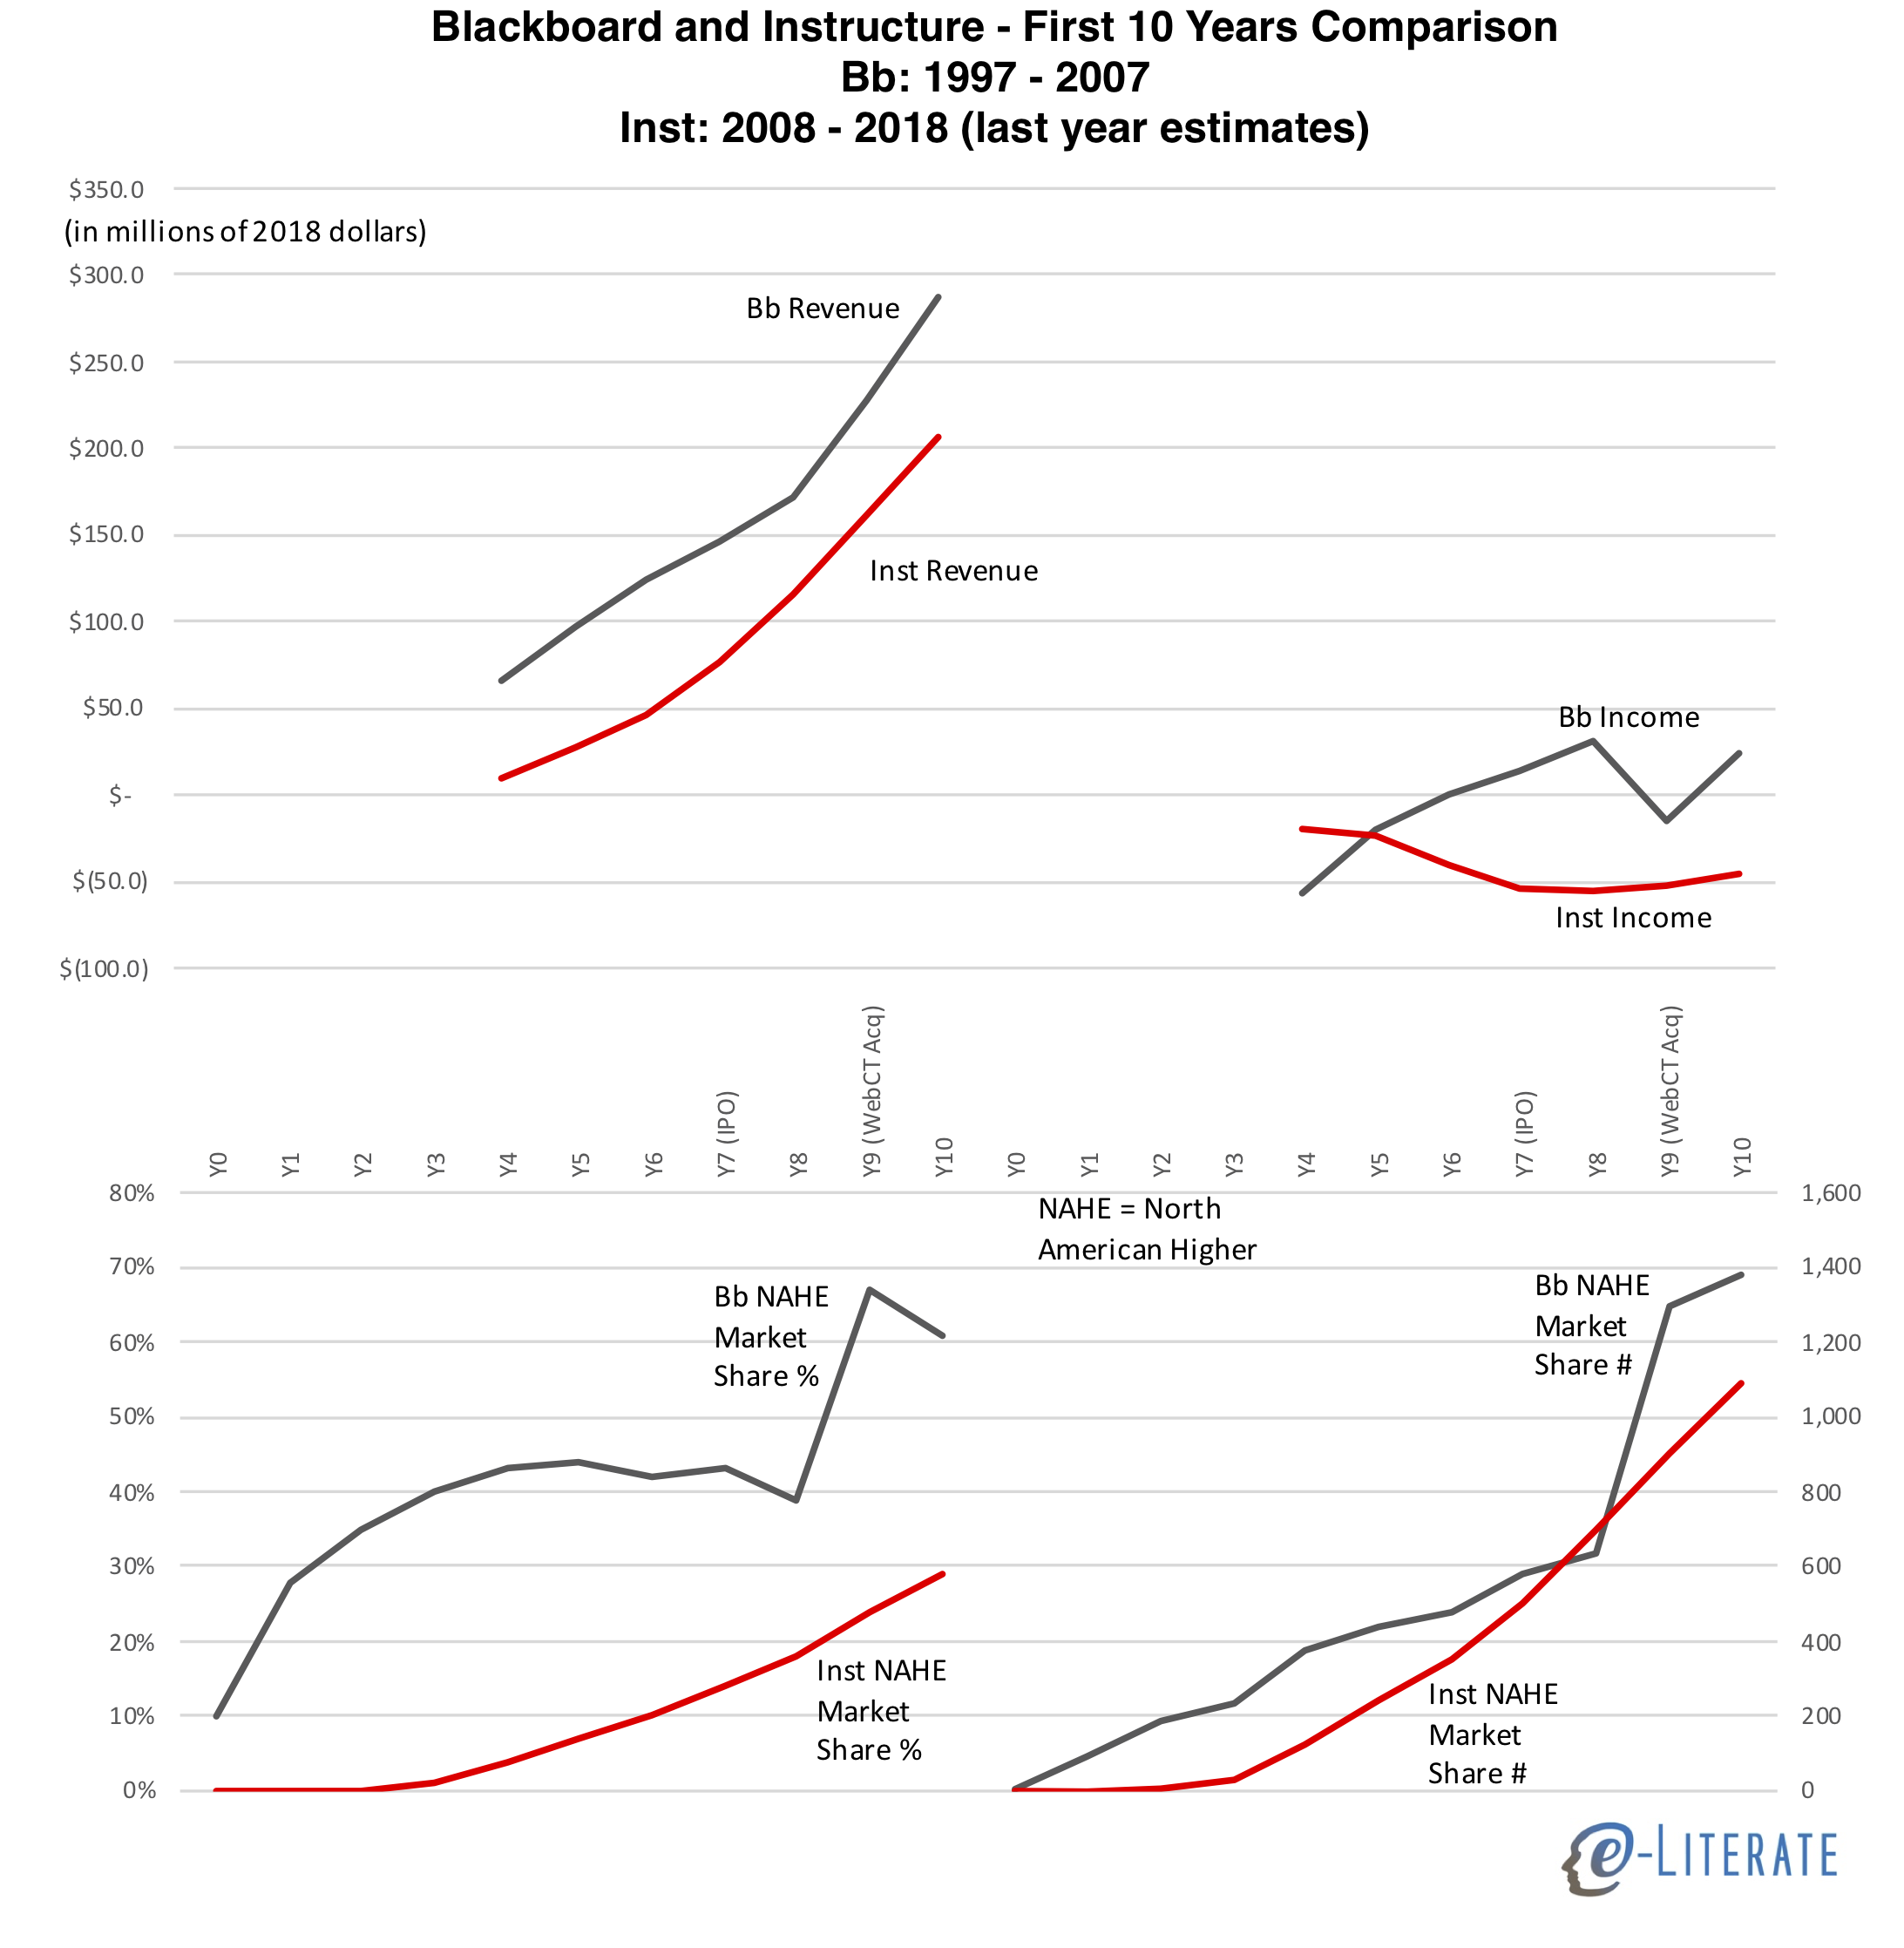
Last year Blackboard celebrated their 20th anniversary as a company, and this year Instructure celebrated their 10th. Yes, the company with Canvas, the “new” LMS solution, is a decade old. To gain historical perspective, it is interesting to compare each company’s first ten years in business in terms of primary financials – revenue and income – and performance in their core North American Higher Education market.
We can only go so far in comparing the companies on this basis, however, due to different circumstances.
Most importantly, Blackboard helped create the LMS market and therefore had significant portion of its expansion in a greenfield situation, picking up clients who had not previously used an institution-wide LMS. Canvas entered the market well after saturation, with greater than 90% of institutions already having a standard LMS.
Blackboard developed its product line pre-cloud, with on-premise hosting being the primary deployment model. Canvas was cloud-native, developed on top of AWS infrastructure.
Blackboard’s growth was heavily based on corporate acquisition of competitors – Prometheus, WebCourse, WebCT in the first decade – while Instructure’s growth has been almost exclusively organic.
Both companies sold in more than just the North American Higher Ed (NAHE) LMS market, even if that was the core. Blackboard acquired two companies in 2000 and launched a card-reader transaction business, and they played somewhat in the K-12 and corporate learning space. Instructure developed Bridge for corporate learning, Arc for video platform, and it has a heavy presence in the K-12 LMS market.
Interestingly, both companies went public in Year 7 (Blackboard in 2004, Instructure in 2015).
With that in mind, let’s compare revenue, operating income – both derived from public SEC filings and adjusted to 2018 dollars – and market share in their core NAHE market. The financial data comes from public filings, and data for 2018 for Instructure are estimates based on their outlook presented in the most recent quarterly earnings release. Market share data is based on our LMS Market Analysis service and associated financial analysis for premium subscribers.
Some notes:
Blackboard raised ~$185 million in venture financing pre-IPO while Instructure raised ~$95 million (both in 2018 dollars). Part of this difference can be attributed to the much higher costs associated with pre-cloud enterprise software deployment models.
Blackboard’s revenue was higher than Instructure’s at similar points, and their operating income was mostly positive after Year 6. Instructure has maintained a significant loss each year from operations. One way to explain this difference is that Blackboard’s used funds for corporate acquisitions, thus fueling growth, while Instructure invested funds into sales & marketing and organic growth. This is not the whole story, but it is a big difference between the two companies.
In market share represented as a percentage, Blackboard’s growth was much faster, but this was in a period where the market was developing and not all schools had a standard LMS. When viewing this market share in raw numbers, we see that Instructure’s growth would have exceeded Blackboard’s were it not for the Year 9 WebCT acquisition.
Blackboard was already showing organic market declines (in NAHE market share %) and slowdowns in raw numbers outside of the immediate WebCT acquisition of customers. Instructure’s organic growth shows no signs yet of slowing down, is less lumpy and more predictable.
In Spring 2015 Moody’s affirmed their B2 rating for Blackboard’s nearly $1.4 billion in debt as part of the company’s acquisition of Schoolwires, with a negative outlook for the ratings (meaning there was risk of a further downgrade). Three weeks ago, that downgrade took place.
(“Moody’s”) downgraded Blackboard Inc.’s Corporate Family Rating (“CFR”) by two notches to Caa1, from B2, as well as its Probability of Default Rating, to Caa1-PD, from B2-PD. Moody’s also downgraded Blackboard’s $135 million first-lien revolving credit facility and $920 million (remaining balance) first-lien term loan to B3, from B1, and its $378 million second-lien notes to Caa3, from Caa1. Moody’s also changed Blackboard’s outlook to stable, from negative.
Put in regular terminology, the previous B2 rating indicated that Blackboard ((Disclosure: Blackboard is a subscriber to our LMS market analysis service and is a sponsor for our recent Empirical Educator Project summit.)) had “the capacity to meet its financial commitments. Adverse business, financial, or economic conditions will likely impair the obligor’s capacity or willingness to meet its financial commitments.” But with the new Caa1 rating, Blackboard “is currently vulnerable, and is dependent upon favorable business, financial, and economic conditions to meet its financial commitments.”
The rationale for the downgrade is that Blackboard holds a very high amount of debt (now more than $1.4 billion) relative to its earnings, and revenue growth is not coming from its core markets.
Blackboard’s core North American Higher Education (“NAHE”) and K-12 units, representing 56% of total revenue, continue to show weakening top line results, suggesting that the success of its new Ultra user interface is still uncertain. Blackboard’s international segment, also weak, has shown modest stabilization of late. Only the campus enablement segment, consisting of recently acquired educational community communications and transaction processing services and representing a quarter of Blackboard’s revenues, has shown healthy, reliable revenue growth. Some ratings support is provided by Blackboard’s high level of revenue visibility, with three quarters of 2017 revenues coming from recurring products and services, and underpinned by its 90% renewal rates in 2017. Both of these measures, however, represent declines from prior years.
The turnaround is stalling, and the credit cards are maxed out. Blackboard has continued to cut costs, including “late-year layoffs”, and Moody’s expects “overall revenues to be flat to down slightly in 2018 as competitors have stifled market share gains”.
While this is not good news for Blackboard, the ratings action does give the ed tech community additional insight into the operations and health of the company. Blackboard total revenues are between $700 – $720 million, with earnings (EBITDA, adjusted by Moody’s) between $160 – $180 million.
And in the rationale for the ratings comes specific commentary on Learn Ultra.
Software renewals have been weaker than expected in the NAHE [North American Higher Ed] segment, as the company strives to sell its latest learning management system (“LMS”) software enhancement, Ultra, into a crowded and very competitive marketplace. Given operating seasonality tied to the academic year, the behind-schedule launch of Ultra, in mid-2016, meant that measurable revenue and EBITDA [Earnings before interest, tax, depreciation and amortization] contributions from it began to be realized only in the 2017 academic year. There are indications that Ultra is gaining traction relative to Canvas and Desire2Learn, and Moody’s believes the packaging of Ultra with transaction- and payment-processing services may support its competitive positioning. But the success of Ultra is far from certain, and the threat from existing and possibly new competitors remains high as barriers to entry, specifically for web-based software, are relatively low. Meanwhile Blackboard, with a brand new CFO, is focusing its research, sales and marketing, and product development resources in an effort to ensure Ultra’s future.
We have covered the 2014 announcement and ongoingfate of LearnUltra here at e-Literate, and claiming a “launch of Ultra, in mid-2016” is generous at best. At that point there were educator previews with no ability for institutional adoptions. Fall 2017 is the closest to what I would say is an actual launch. As of a January, 2018 meeting Michael and I had with Blackboard’s management team, they claimed dozens of schools actively piloting Learn Ultra ((I have asked several times for this list, or a subset of this list, of schools piloting Ultra to allow interviews. If and when we receive schools to interview, we will cover in another post.)), and their flagship customer University of Phoenix is beginning rollout of the LMS starting this month.
What is going well at Blackboard is the movement to a SaaS (software as a service, aka ‘the cloud’) model for the LMS – for both the traditional experience and Ultra experience. As of January there were 284 schools on Learn SaaS and 49 others in migration. In a purchase-only report, Moody’s acknowledged this strength and noted the investment that Blackboard is making in this area (more than $50 m expected in 2018).
While the company has shown good progress in migrating its legacy Learn customers onto the appropriate SaaS-based platform from which those customers may choose, in turn, to migrate to Ultra, Blackboard’s efforts to make those transitions smooth for its customers have entailed elevated capital expenditures, which will likely continue through 2019, cutting into free cash flow.
Put this all together, and 2018 is the year that Blackboard needs to transition from ‘wait until Learn Ultra is ready’ to ‘Learn Ultra had better lead to increased sales’. I have been impressed with the new management team’s transparent approach to dealing with analysts, and with their honest approach to understanding the problems they need to solve. But the company needs to deliver, and this is shaping up to be a newsworthy year for Blackboard, for good or ill. There’s a lot to watch here.
Over the past several months, we have worked with our partners at LISTedTECH as they ramp up their efforts to collect data on LMS usage in the K-12 market in the United States. This is a massive effort as the market includes more than 130,000 individual public and private schools, and more than 13,600 school districts, according to recent NCES documentation. We are aware of several private data sources with estimates on the K-12 LMS market, but there are no public sources.
Part of the challenge is that the K-12 market is messier than higher education’s and its roughly 7,200 institutions. One reason is that the general IT infrastructure in K-12 is less mature than in higher ed, and for smaller schools there are a lot of ad hoc implementations running on a local server not even in a data center. Another reason is the availability of free options such as Google Classroom, or freemium options such as that offered by Schoology and Canvas for individual faculty.
As we build up the data and improve our methods, we believe we are starting to see some interesting trends in the data worth sharing.
Our initial sample looks at 6,875 public schools from across the country in the NCES-designated primary, middle, high and other (special ed, vocational or alternative) categories. These results were analyzed over several data collection methods along with manual evaluation of that data. That said, we expect to see movement in the numbers as we collect and verify additional data, including LMS usage at private schools.
As in our analysis of the higher ed market, we are focusing on school-wide implementations of LMS platforms. At many K-12 schools, in the absence of a school-wide implementation, individual teachers opt to use an LMS for their particular classroom, often for free. We do not consider this case a school-wide adoption and therefore do not include those use cases in our data. This methodology does not fully analyze total usage of a platform like Schoology that has a freemium model, including a free option for individual teachers and an enterprise solution which is a school-wide adoption based on a fee per student model. A platform like Google Classroom likewise has usage by individual teachers as well as school-wide implementations.
Before we share the preliminary data, some caveats are in order to hopefully avoid anyone misrepresenting this information:
This is preliminary data that will likely change as we learn more. While we believe there are some broad trends already emerging, there will be refinements as we increase our coverage over time. We expect the changes to be in small adjustments to specific numbers but not in big changes to market shape.
This view is based on number of schools that have implemented an LMS, which is a different metric than district-wide implementations (where many or most of the purchasing decisions occur) or implementations scaled by student enrollments. We will add these views in the future.
This view is based on installed base (which represents total estimated deployments), which is different than new implementations in a given time period (which would measure market momentum). Again, we will add these views over time, just as we have done for the higher ed LMS market.
Due in particular to the free options available in K-12, there will be schools that have more than one LMS available at the institutional level. Google Classroom in particular is often available as an option at a school even when there is another LMS.
As is our practice at e-Literate, we’ll describe the caveats and present the data as is. As we learn more, if the relative percentages change significantly, we will share updates.
For more information on our data methods, see this post.
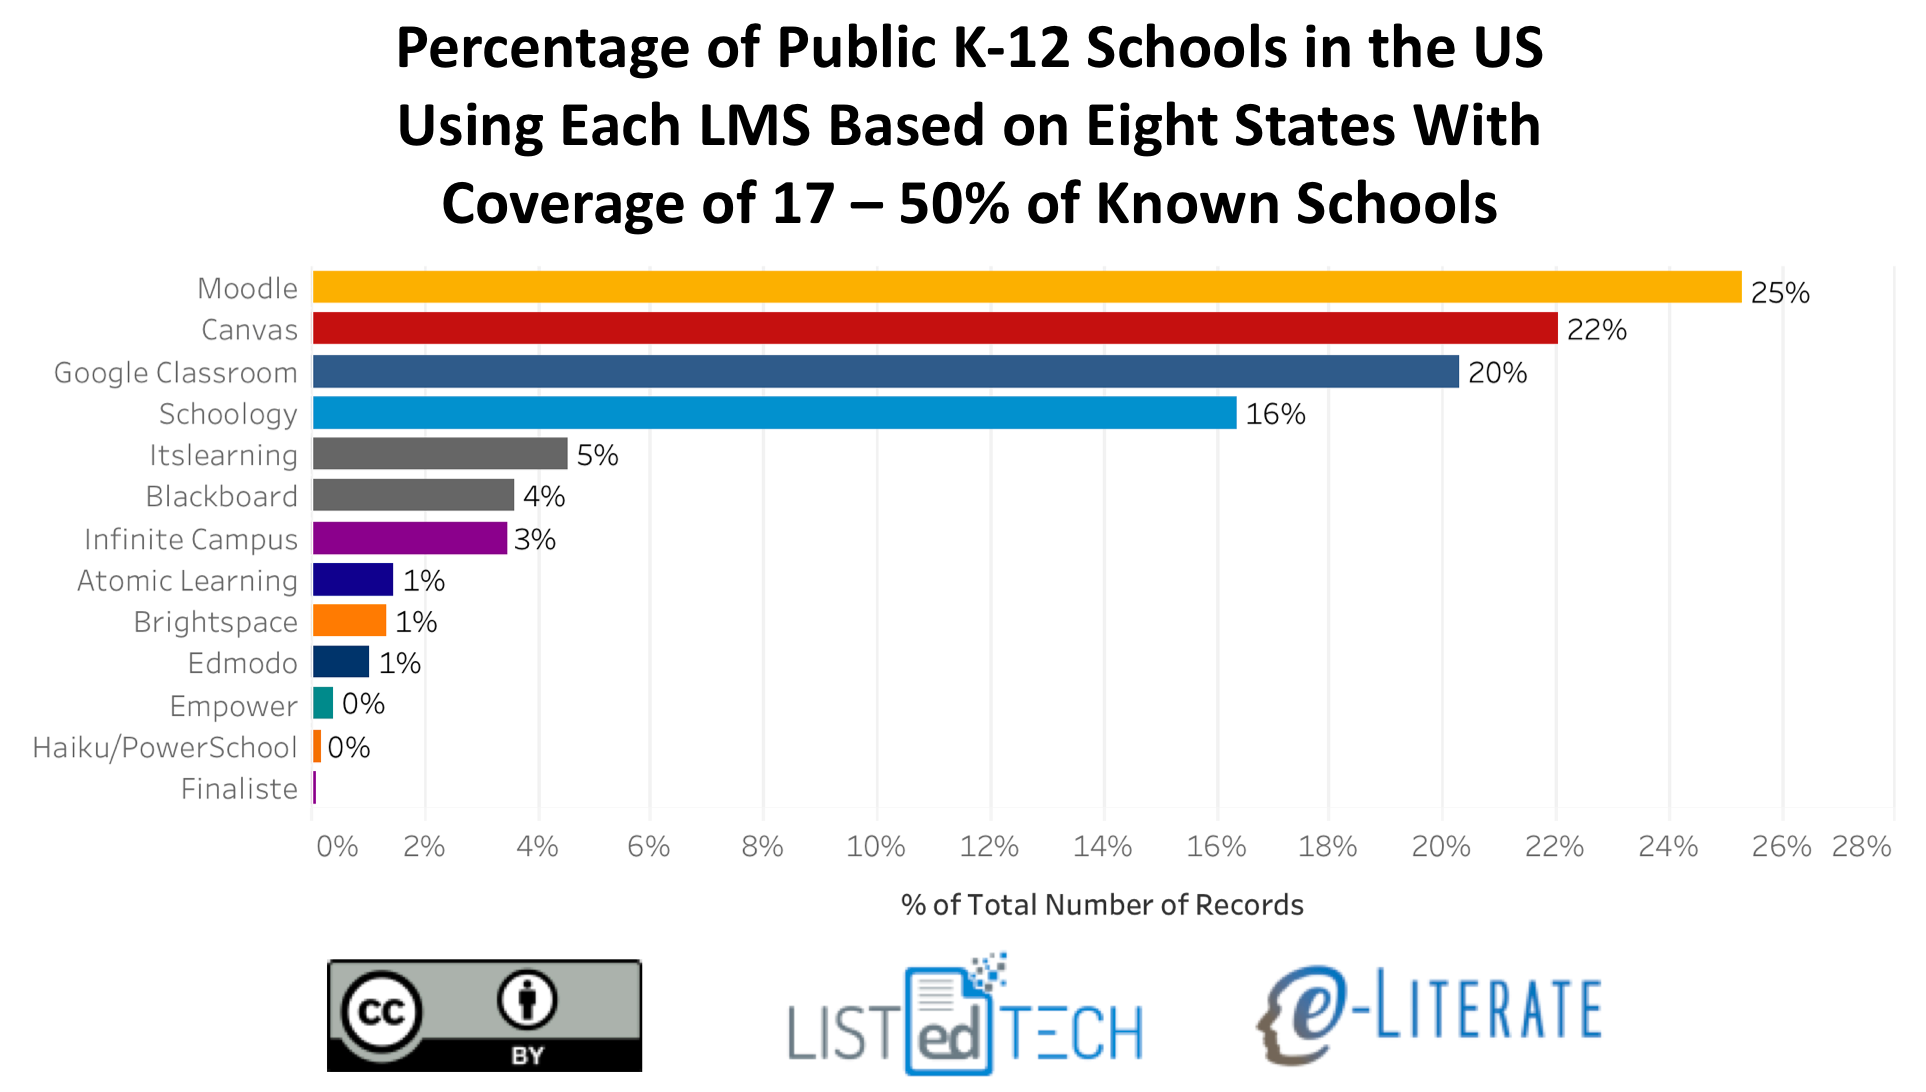
The first graph presents a view of K-12 school-wide LMS implementations in the United States for the 8 states (and DC) where we have at least 17% coverage of known schools (Alaska, Delaware, District of Columbia, Florida, Massachusetts, Minnesota, Texas, Wisconsin).
To get a sense of how representative this initial market share is, we made the same calculations across all 6,875 schools from 50 states and DC that in our data thus far. The data for each LMS matched within ~2% for each LMS (e.g. Canvas went from 22% to 24%, Moodle went from 25% to 24%) between the two views.
As in the higher education market, there appears to be four top contenders in K-12 – Moodle, Canvas, Google Classroom, and Schoology – with all others having 5% or less of market share. Moodle and Canvas are both present in the Big Four for both higher education and K-12, but in K-12 Google Classroom and Schoology are the other big players. We believe that this is the first data set showing just how widely Google Classroom has been adopted. ((Disclosure: Instructure, Schoology, Blackboard, and D2L are subscribers to our LMS Market Analysis service; Instructure and Blackboard also are sponsors for an upcoming event we are organizing.))
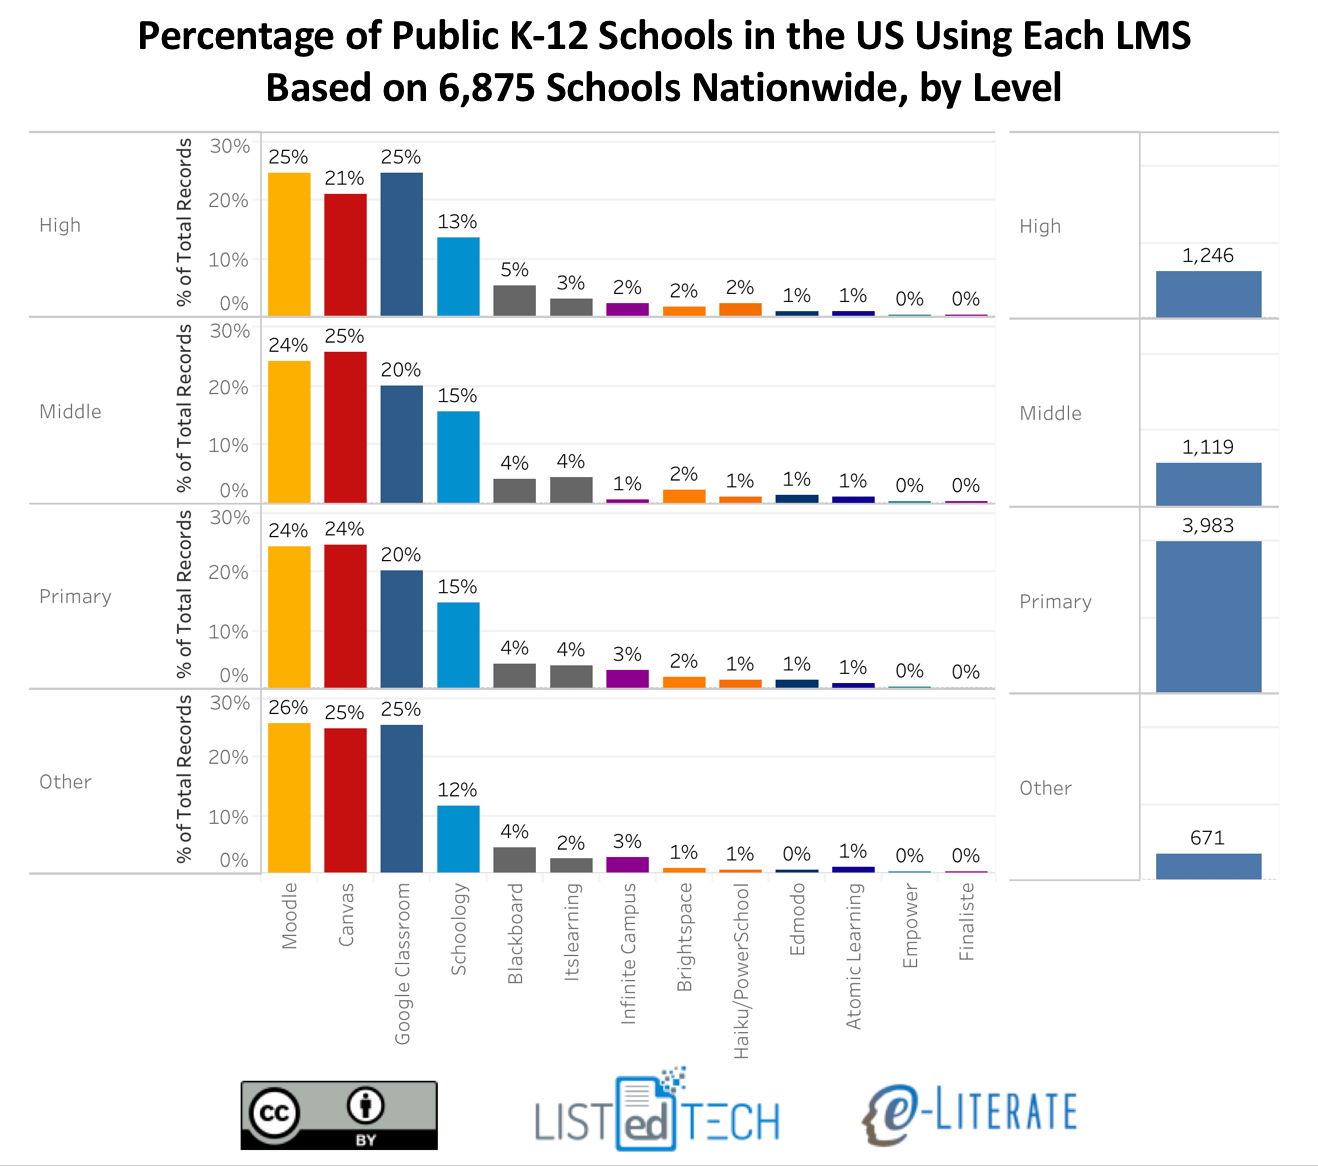
The general distribution is somewhat consistent across school levels – primary, middle, high school, and others – with some interesting smaller variations. The following view also gives a sense of our relative data coverage by level. In this case we are using all our data across the 6,875 schools. Note that totals are higher than this number due to multiple systems being available at some schools.
We hope this new data provides a broader view of the academic LMS market. We’d love to hear your feedback and questions.
Recently Martin Dougiamas of Moodle has questioned our data analysis for the LMS market. In some useful notes posted at Moodle.com on two recent Future Trends Forums hosted by Bryan Alexander:
Bryan finished the Future Trend Forum by asking for Martin’s thoughts on the recent article by Phil Hill titled: “Whither Moodle?” [edited] which speculated that Moodle’s growth is slowing down and hitting a plateau.
Martin commented that is not the case from what he is seeing and that a lot of the information contained in the article is US-based where there a lot of more LMS vendors and venture capitalists building learning platforms.
While this description from Martin is inaccurate, the issues raised are representative of some of the questions we occasionally get about our data for our LMS market analysis service. I think it would be useful to share a deeper description in public of how our partners at LISTedTECH collect and organize the underlying data.
What We Measure
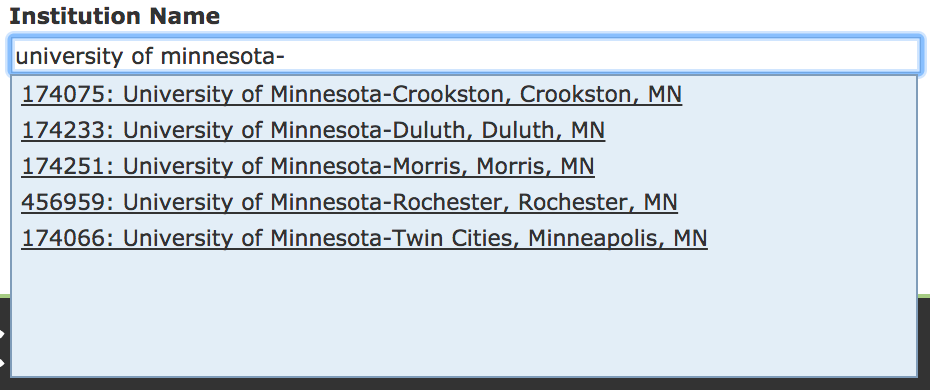
The market data are organized in a dataset that captures system usage on a per higher education institution basis. For most schools, a campus is equivalent to an institution. But there are also cases where there multiple campuses per university (e.g. University of Minnesota system with five campuses, or DeVry University with dozens of campuses) and the LMS decision is made at the system level. In these situations, one decision will lead to multiple institutions listed in the data. In the US, the definition of an institution is guided by unique identifiers in the Department of Education’s IPEDS data, and each region or even country has its own way of defining institution.
The dataset goes beyond “school X uses system Y”, as it also includes dates of implementation and decommission, usage as primary or secondary system (there may be more than one system in use at a school), and hyperlinks to the public information documenting a system selection or usage. The definition of institutions includes information about its sector (public two-year, private non-profit four-year, etc) as well as student enrollments.
How We Measure
Looking deeper at LMS selection, there are multiple layers of data gathering at different intervals. Some of the sources:
Extensive search engine notification such as Google Alerts on product keywords in multiple languages;
URL and domain scrapers looking for system information at official school websites; and
Targeted human-directed searches.
Each new data point is verified by someone using the associated hyperlinks tied to selection or usage data.
Our North American data is essentially saturated, in that we know the vast majority of degree-granting institutions based on US Department of Education data or Canadian provincial governmental data. We have well above 90% of all schools in the dataset.
For the global regions outside of North America, we are building up the dataset and do not have saturated coverage yet. For example, in Europe we estimate that we have 60 – 75% of institutions. We have less than that in Latin America and more than that in Oceania.
Where feasible, we include on-the-ground subjective coverage by visiting the global regions, testing theses, finding out unique context, and finding local sources who can provide QA to our data.
Besides our home base of North America, we have made multiple trips to Europe and Latin America thus far, and we are currently arguing about who gets to visit Australia and New Zealand.
We plan to expand coverage to additional regions as we develop at least 30% coverage of institutions and have time to do additional research to back up our analysis.
Degrees of Uncertainty
Because higher education data is lumpy and based on extended implementation times, we offer the following caveats:
Market share information provided in percentages and trends are more reliable than absolute counts outside of North America. When we do provide absolute numbers, we advise caution for readers or subscribers to not over-interpret the absolute numbers, at least without us providing additional details to keep the data in context.
We typically separate North American data from Rest of World data (Europe, Latin America, Oceania) to avoid problem of North America numbers dominating aggregates and obscuring important regional differences.
When we have system usage information but do not have accurate implementation dates (per month or quarter), we assign these system records to June. Therefore the summer data for new systems will appear artificially high. We currently have implementation dates for approximately 75% of the listed LMS records.
Put another way, annual data is more reliable (i.e. without additional data collection noise) than half-year or quarterly data. The more-granular data is provided to certain subscribers, but we take great care in attempting to describe sources of “lumpiness” in the data that should be understood for any analysis.
Overall, we have LMS data for 4,523 institutions in the US and Canada and 8,824 institutions worldwide.
Back to the Future (Trends)
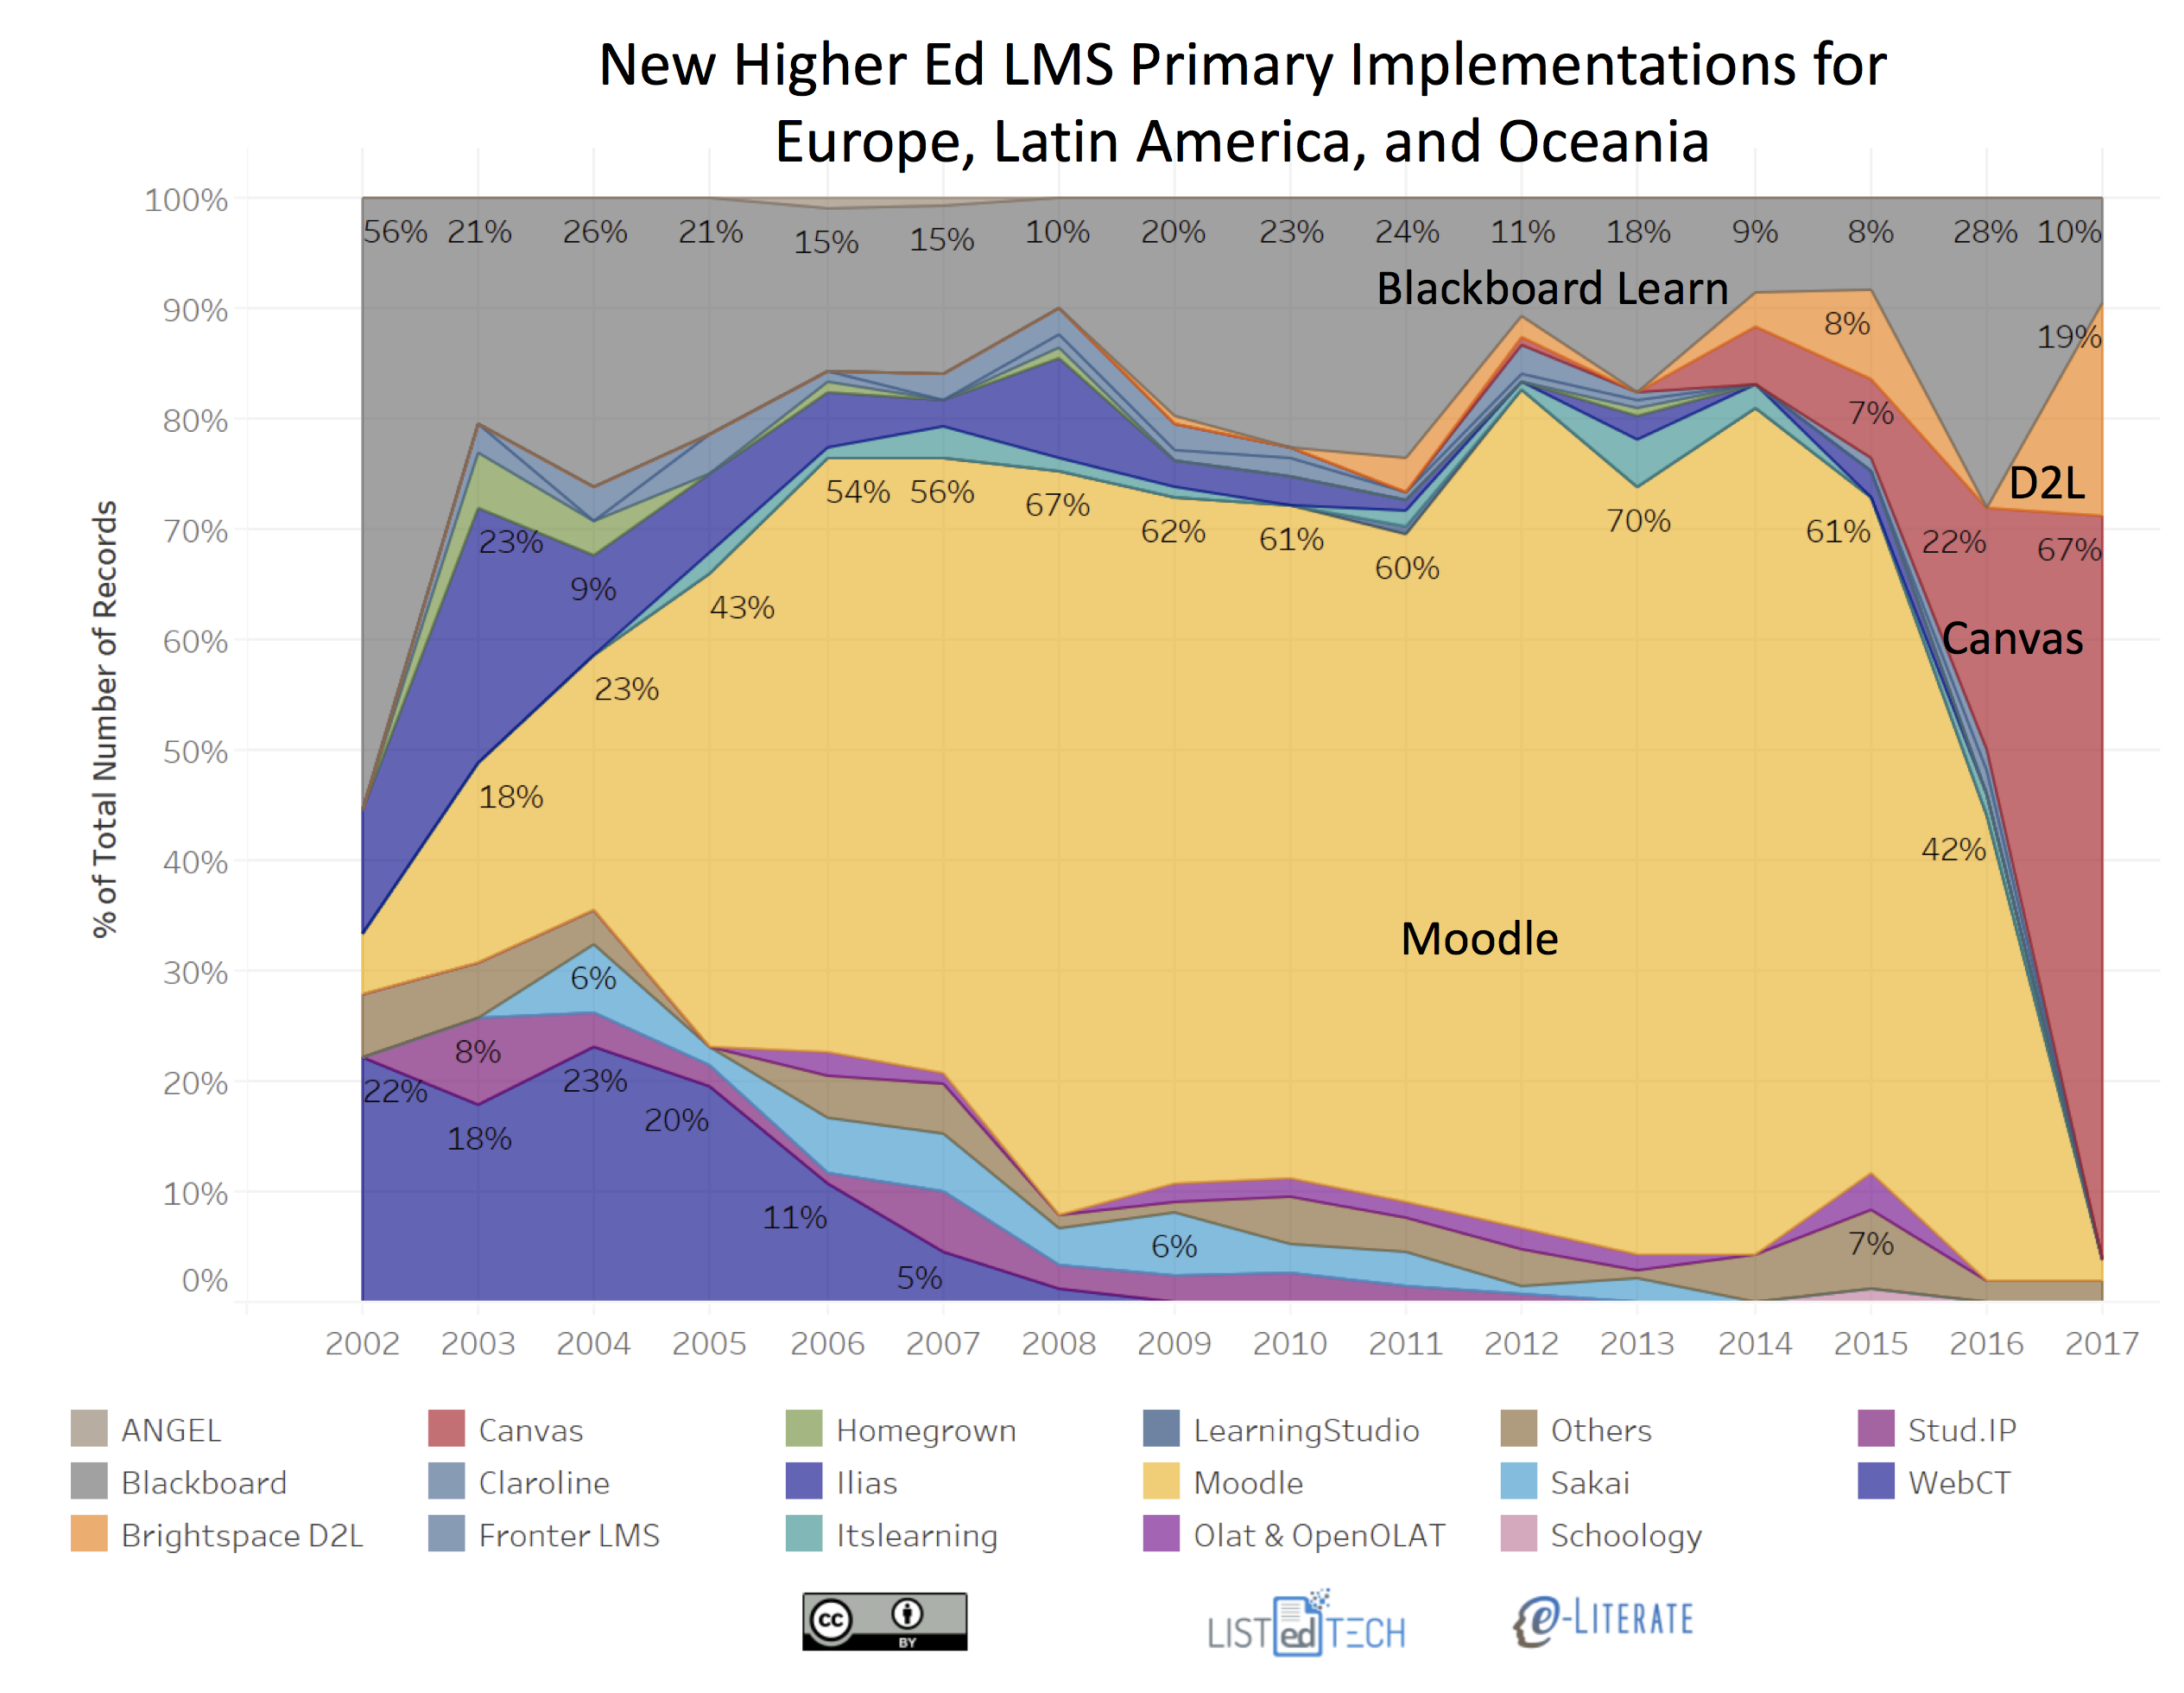
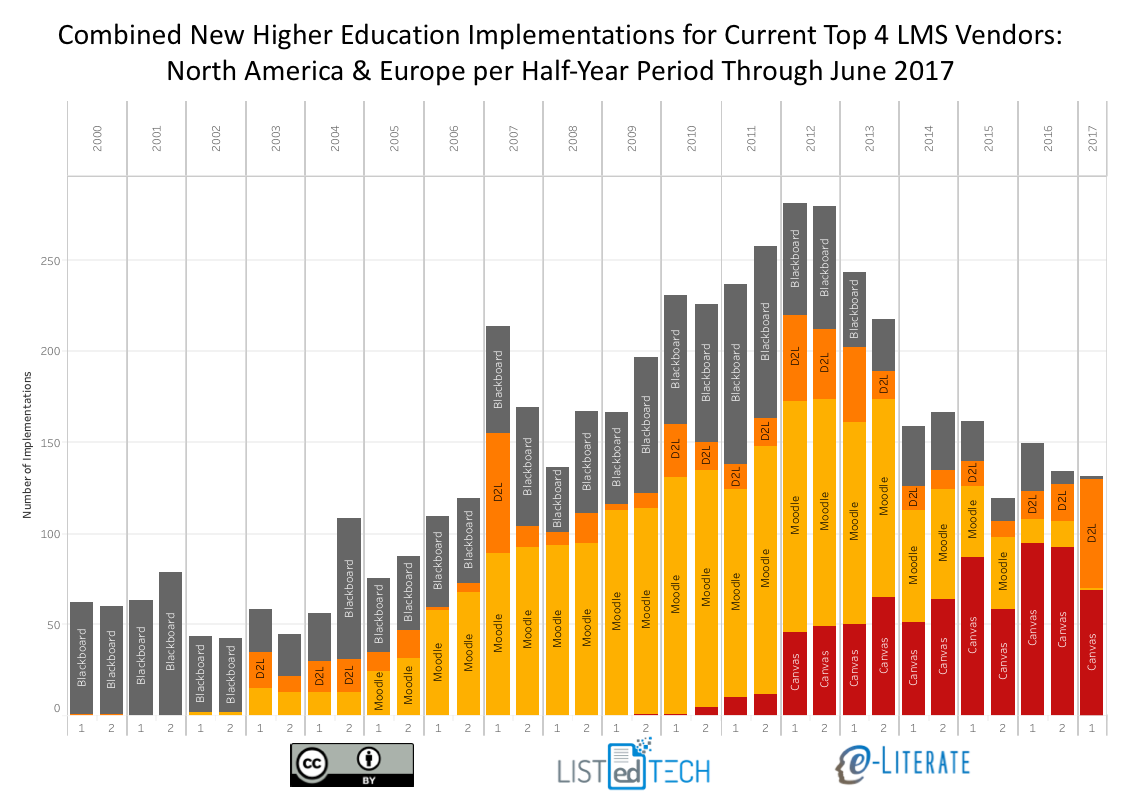
To see these issues with an example, consider the updated chart of new implementations that led to the Future Trends Forum discussion described above.
What is relevant to the dataset for this chart:
The data is based not on North American data – it is based on data from Europe, Latin America, and Oceania (Australia, New Zealand, and surrounding island countries).
The data comes from public sources per institution as described above and does not come from vendors;
The data is for primary systems – the official campus LMS; and
The caveats listed above should apply. Note that we identified a new trend early in 2017 (collapse of Moodle new implementations) that we can update with data through 10 months of the year – the data today is more solid than it was in early summer.
I hope this description will answer some of the questions people have asked about our data.
Now that we’re past the 2017 WCET conference and headed to the EDUCAUSE conference, let’s look at updates on the institutional LMS market for North America (US and Canada). Last year we started our LMS market analysis service, where we are working with LISTedTECH to provide market data and visualizations, and our fall report for subscribers will be released in about a month. Data for 2017 presented below goes through October 1 of this year.
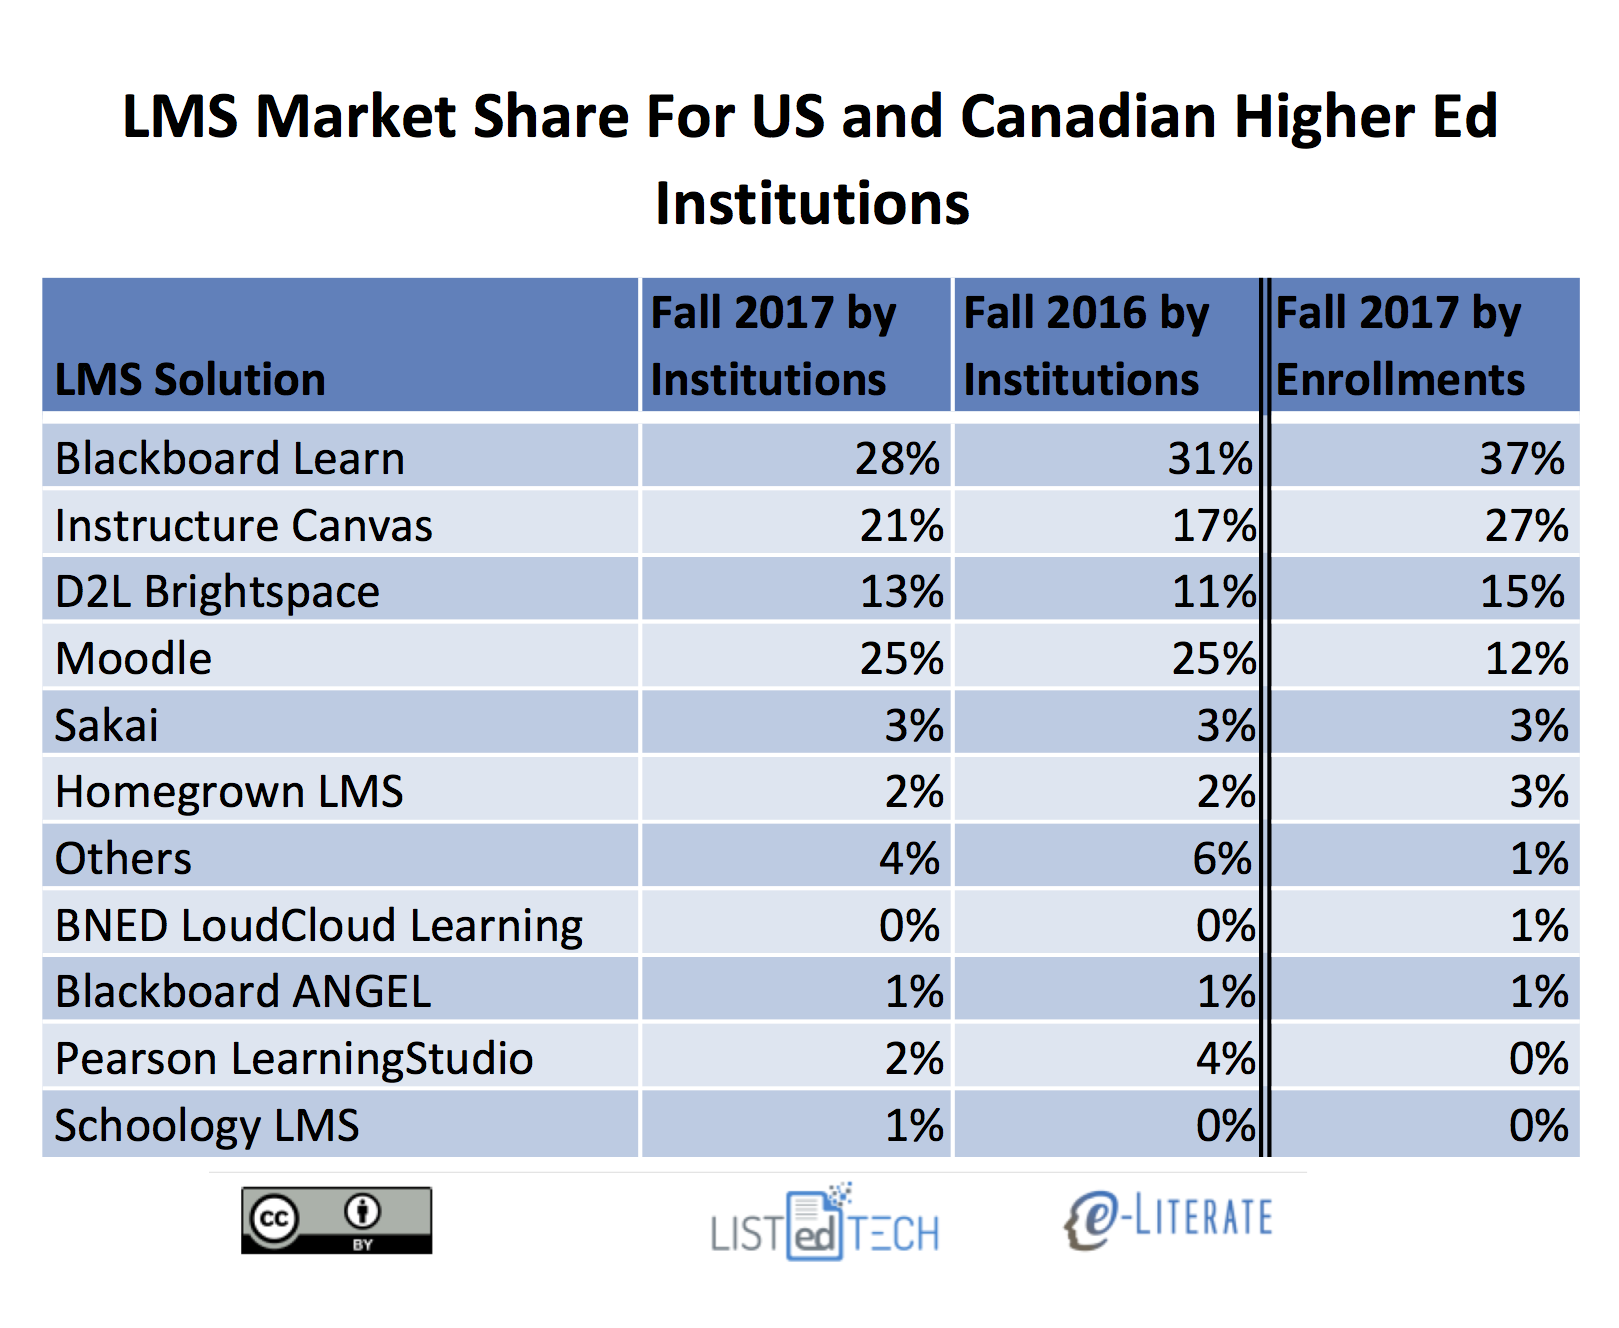
We present the data “by institutions”, with market share as a percentage of the total number of institutions using each LMS as a primary system, and “by enrollments”, where we scale the institutions by their total enrollment. The latter better captures the business of the LMS market, since most licensing deals are based the number of students. We have also included data from Fall 2016 by institutions for comparison purposes.
Some notes on the market share as defined by percentage of institutions:
In terms of new selections the market continues to be a two-horse race recently with Canvas by Instructure and Brightspace by D2L as the only two solutions with material gains in market share. Canvas grew from 17% to 21% , and Brightspace from 11% to 13%, of the market.
Outside of the big four – Blackboard Learn, Canvas, D2L Brightspace, and Moodle – no other system has more than 3% of the market measured either by percentage of institutions or percentage of enrollments. Furthermore, the category of “Others”, capturing systems not listed above and having less than 1% market share, actually dropped from 4% to 2% of the market. This indicates that continued market consolidation.
Schoology and BNED LoudCloud grew slightly, but not nearly to the degree of the Canvas and Brightspace.
Blackboard Learn fell the farthest, from 31% to 28% of of the market. The second biggest drop was Pearson LearningStudio, from 4% to 2%, based on its end-of-life notice for December 2017.
Moodle and Sakai both lost market share of just under 1%, not enough to show up in the rounded numbers in the table but enough to show up in our underlying data.
The difference in Moodle’s market share by institutions at 25% and by enrollments at 12% really shows how concentrated their usage is for smaller schools.
When viewing market share as defined by percentage of enrollments, Blackboard and Canvas are the most-used systems, at 37% and 27% of the market, followed by D2L at 15% and Moodle at 12%.
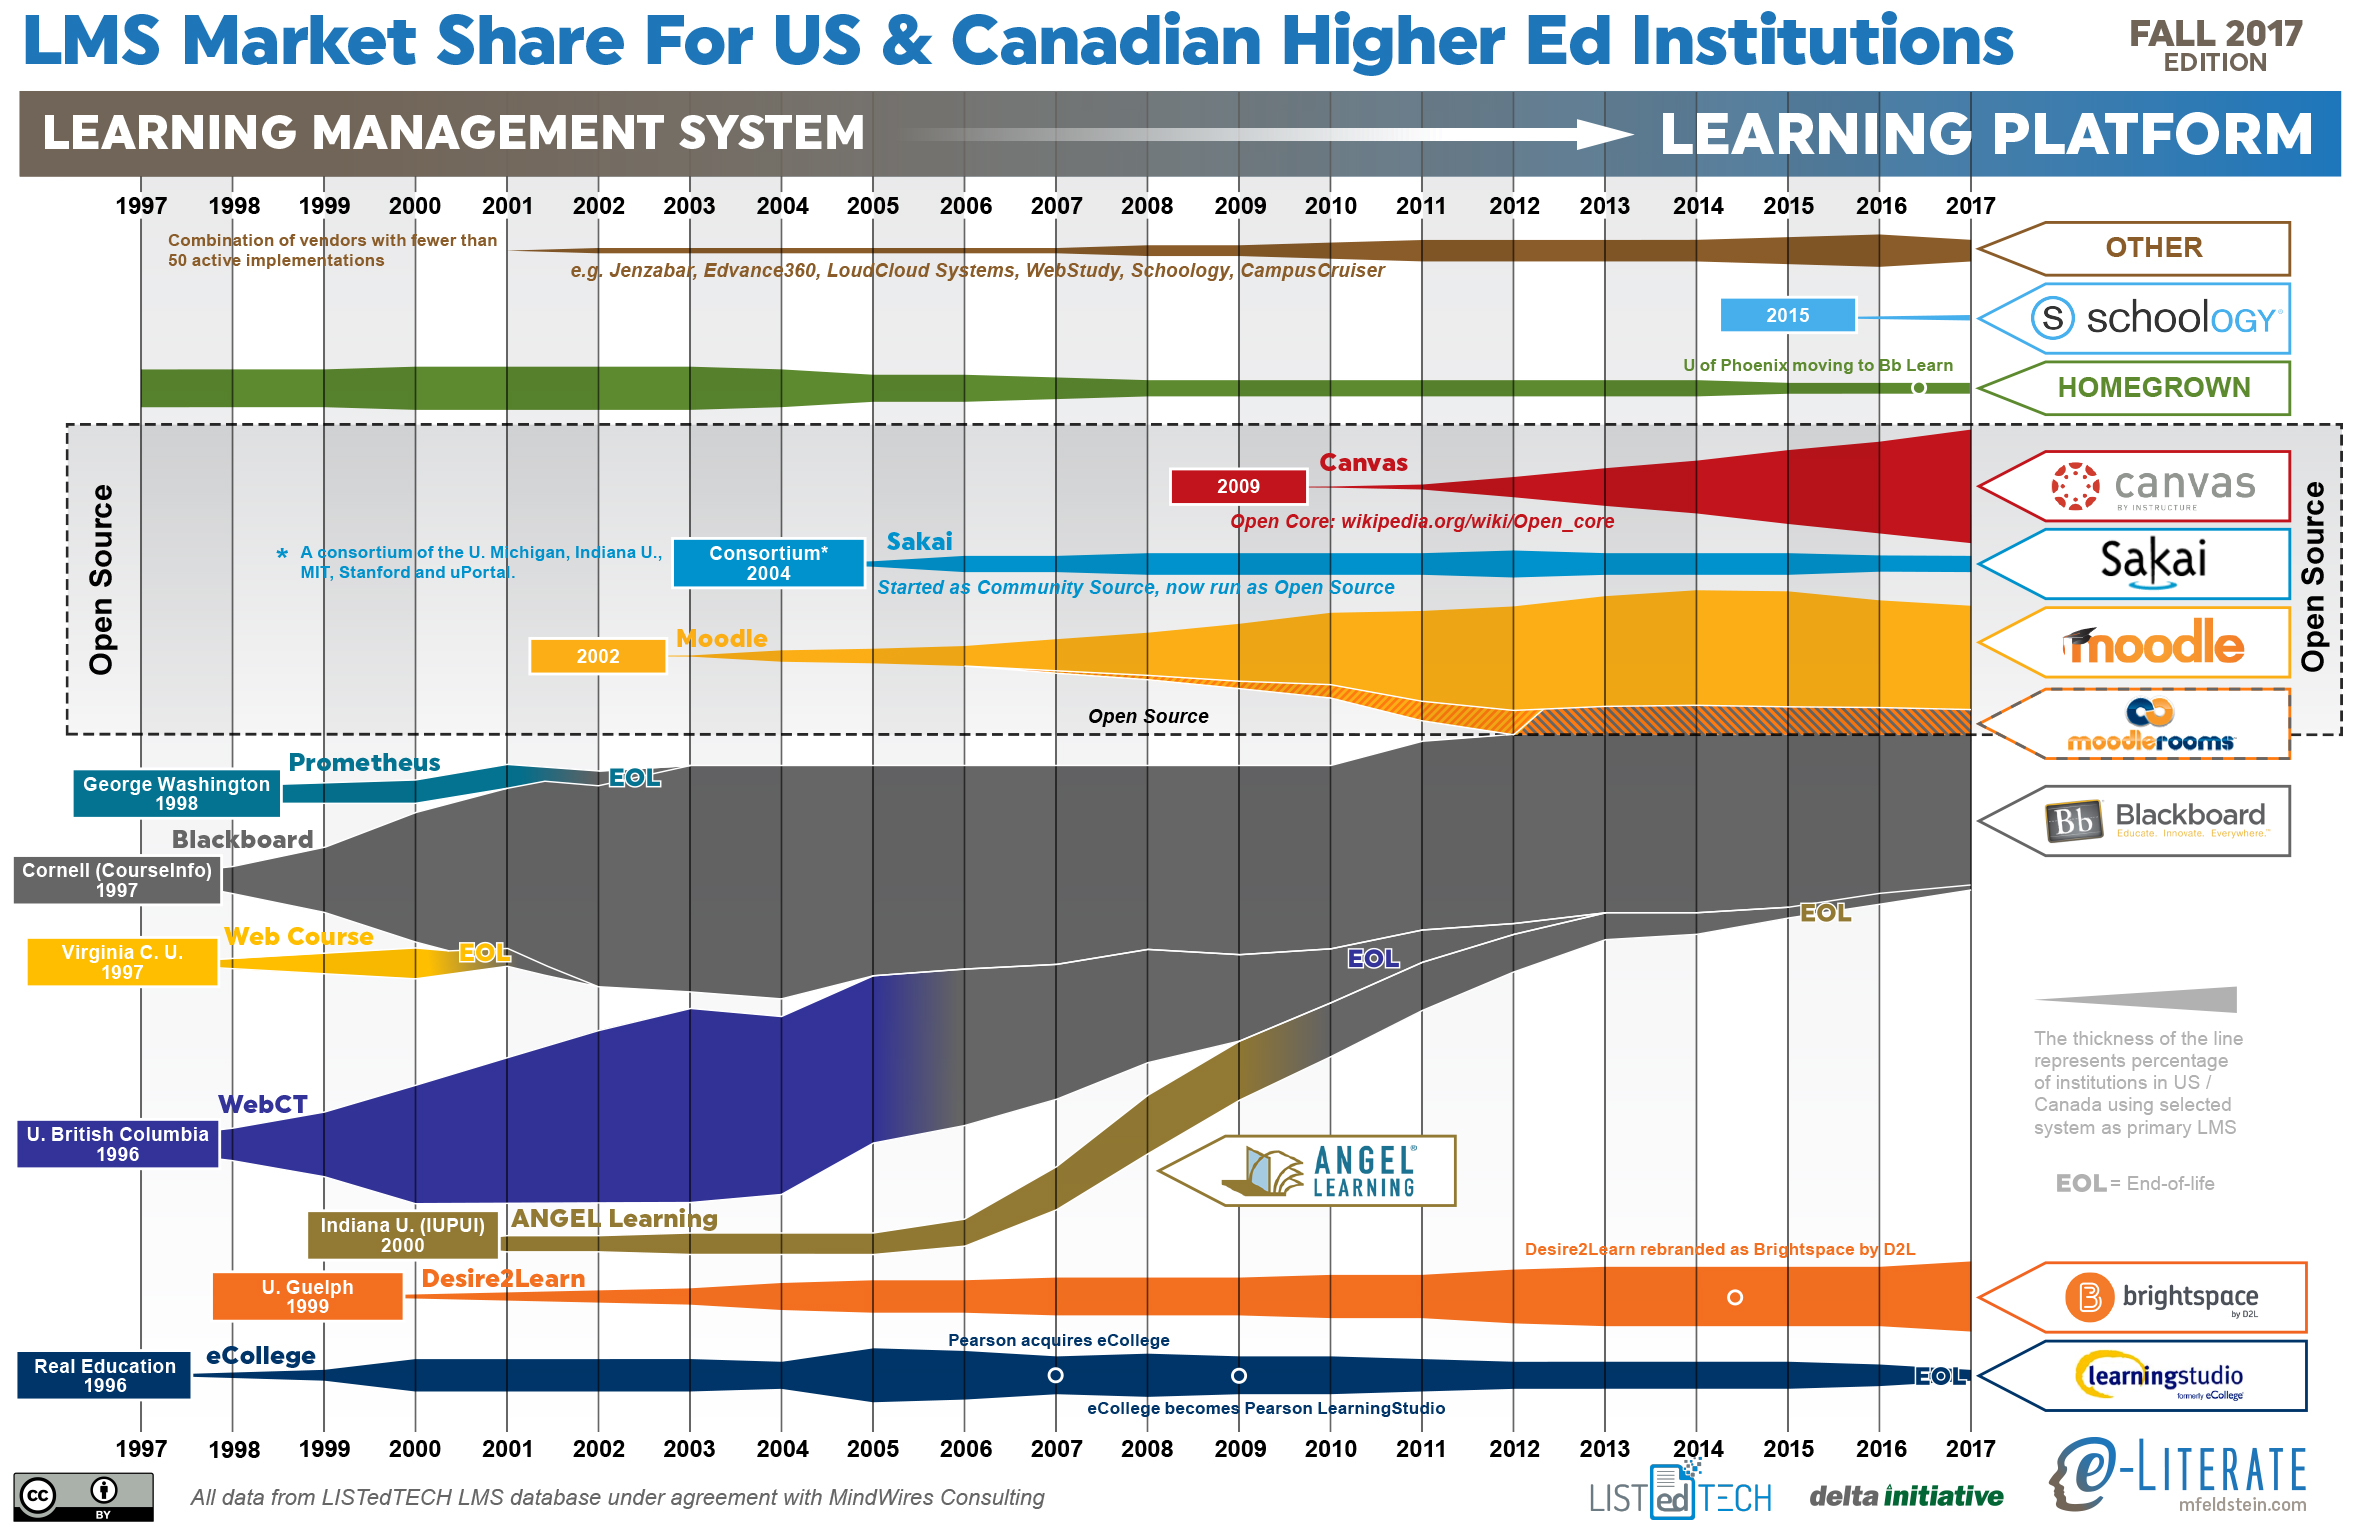
Stepping back from the immediate data, let’s look at an updated LMS market share graphic, commonly known as the squid graphic, for US and Canadian higher education. The original idea remains – to give a picture of the LMS market in one page, highlighting the story of the market over time. The key to the graphic is that the width of each band represents the percentage of institutions using a particular LMS as its primary system.
Some additional notes:
Blackboard and Moodle have been the market leaders as number one and two in share as they have been for the past decade. However, Canvas is quickly approaching Moodle’s market share.
We’ll share any updates we discover at the conference this week.
Josh Kim wrote a post yesterday at Inside Higher Ed questioning some claims about the LMS market size.
The first result that comes up in Google is from Zion Market Research. Their estimate is that the global LMS market is valued at $5.19 billion in 2016, and expected to reach $19 billion by 2022.
According to Statista, the LMS market in 2016 was valued at $3.21 billion. CNBC claims that the learning management system market is worth $5.2 billion today, and will grow to $16 billion in four years.
Can these numbers be right?
Josh then did a quick analysis based on Instructure’s revenue and came up with much smaller numbers.
If we assume that the cost of Canvas is about average for LMS companies, we can get an estimate of the total market size by multiplying Instructure’s revenues by five. This gives us an estimate for the total size of the LMS market $555 million.
He extended this by 50% based on Instructure growth to give an estimate of $555 – $832 million, which is way below the big numbers claimed by Zion, MarketsandMarkets, and other market analysts.
The biggest difference here is that all of these analysts combine corporate learning markets with academic LMS usage, and corporate learning platforms account for somewhere between $2 – $4 billion, with best estimates (although outdated) coming from Bersin. This point has already been pointed out in the comments at IHE.
tl;dr – the ~$5 billion number is reasonable if you combine academic and corporate LMS markets.
There are two caveats, however.
First, the market growth claims are marketing fluff to generate interest in buying the reports, as companies love to show growth potential to investors. Anything close to $20 billion in a few years is ludicrous.
Second, as Michael commented on this approach based on a post I wrote criticizing MarketsandMarkets:
If anything, my Phil understates the case here. Lumping higher ed, K12, and corporate LMSs into the same category is a little bit like lumping railroad cars together with automobiles because they are both called cars, have wheels, and carry things and/or people from one place to another. On top of that, nobody has decent data on the size of the global market, never mind the growth of it. MarketsandMarkets’ “analysis” effectively gives us made-up numbers about a mythical automobile/train car market.
So a better question is what is the size of the global academic LMS markets, combining K-12 and postsecondary?
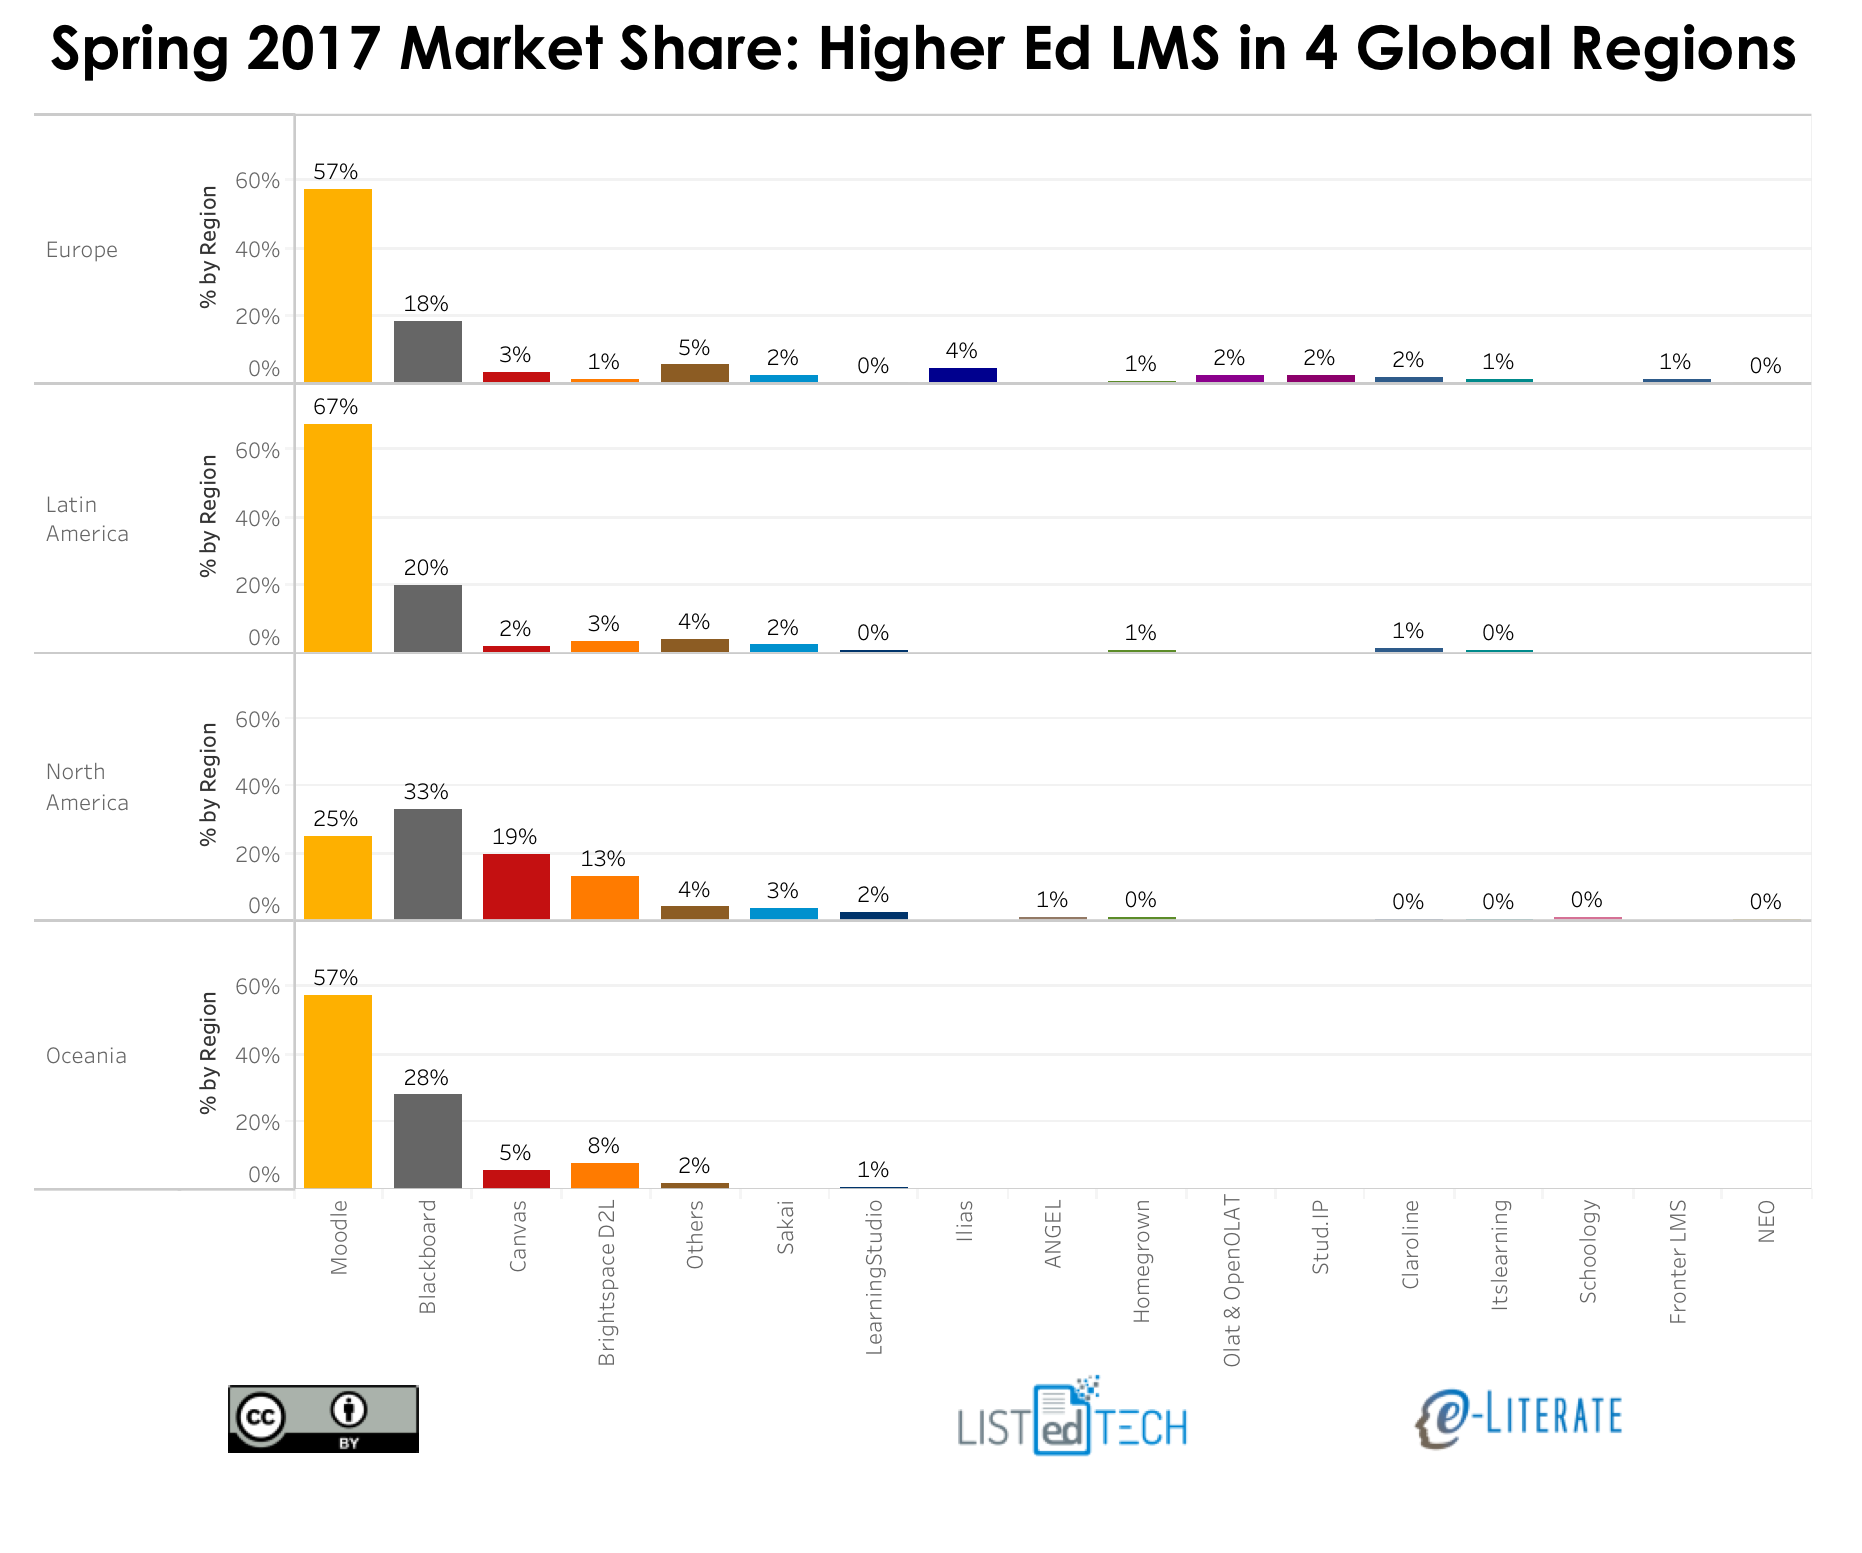
One issue from the IHE post is that Josh used our 20% market share as basis for extrapolating Instructure’s market share, but that number is only for North American higher education. Globally, Instructure’s market share is much smaller as shown in our recent analysis (data provided by our partners LISTedTECH).
Furthermore, while Canvas by Instructure and Schoology seem to be leading vendors for new adoptions in the K-12 market, at least in the US, no one has reasonable measures of market share in this area. Long and short – we need a different approach than extrapolation from Instructure alone.
LISTedTECH estimated the global LMS market just in higher education as $1.7 billion based on (# of students) * (average cost of LMS per student) = annual spending approach. In the US, the best estimates I’ve seen in that K-12 learning platform markets are worth 30 – 40% of higher ed market. This likely is smaller globally, as anecdotally there is not a big emphasis on LMS usage outside North American and Northern Europe. So one very rough estimate is that academic LMS market is worth approximately $2 billion per year.
If you want to use the company revenue method, then I would use additional data. Blackboard’s LMS revenue is likely $450 – $550 million per year based on reviews of corporate debt filings and extrapolation from their time as a public company. D2L’s revenue is smaller than Instructure’s, so let’s assume the two companies combined have $200 million revenue. Note that in all of these companies this is global revenue for K-12 and higher ed combined. The question is how to scale this $700 million combined revenue from all three companies. Is it reasonable that global spending for academic LMS could be 2 – 3x larger than this number? When you add in all of the Moodle hosting – both Moodle Partners and unofficial Moodle hosting – as well as Chinese market adoption, European providers, and K-12 players like Schoology and Powerschool/Haiku, this seems at least believable.
So my highly-researched, thoroughly-documented estimate of the global academic LMS market is $1.5 – 2.0 billion per year. And it is forecast to grow to $8.2134526 billion by June 3, 2022.
In our recent coverage of BbWorld and D2L Fusion, Michael and I came away impressed. Both companies are improving and doing so in ways showing them listening to customers, empathizing, and developing product enhancements with more engaging user experiences. Both companies are doing so by attempting to change their company cultures to support these behaviors. Their challenge, however, is that Instructure is already there – their company culture has supported simplicity, customer-centric empathy, and openness from day one. And what struck me (again) at this year’s InstructureCon was how well the company is managed and how consistent is their approach, over time and throughout the organization.
Instructure launched its Canvas LMS back in 2010, and it is remarkable how Michael’s description from June 2010 could still be applied today.
If I had to summarize Instructure’s strategy in one sentence, it would be “They use the lessons learned by consumer web companies to clear the clutter out of LMS software design and business model.” They’re not focusing particularly on open education or analytics or any other hot topics in online education, although they are aware of these and do pay some attention to them. Rather, they are looking at core use cases and trying to make them as simple as possible, throwing out some outdated LMS design assumptions in the process.
From the early days when they had dozens of employees to today, when they have over 1,100 employees, the strategy is the same and the company culture is the same. This despite the departure of both founders and the 2015 IPO and all the resultant pressure from investors.
This is Instructure’s secret. They continue to manage the company to support the strategy of clearing the clutter out of LMS software design and business models.
Product News
The biggest product news at InstructureCon this year:
Release of Gauge, an assessment management platform for K-12 usage, which might impact higher ed in the future
Redesigned Quiz engine and Gradebook, leading to what we saw as the biggest interest from conference attendees
Release of blueprint courses
Investment in back-end platform design (e.g. microservices) to increase speed of design improvements
Reintroduction of analytics – visualizations initially targeted at faculty usage
Introduction of Alexa integration
The focus on assessments, quizzes and grade books is both problematic and encouraging. Problematic for the industry as we spend too much time on measurements and grading and accountability and too little time on learning and continuous formative assessment. Yes, the quizzing engine can be used for formative assessment, but in most cases the usage is for summative assessment. But even with this viewpoint, it is encouraging that the primary focus of these product enhancements to Canvas is on reducing the time spent on the grading activities. It is a fact of life that an enormous amount of effort is spent by faculty, particularly in the US, on managing grades. It is good to see tools that directly reduce the pain in this area.
In a standing-room only session, Instructure’s Christi Wruck explained the initial phase of a multi-year effort to redesign and improve the grade book. Most features shown were of the nature of reducing the number of clicks or simplifying the navigation of grading activities. I won’t go into the minutiae here, but this session seemed to generate the most excitement at the conference.
The (re)introduction of analytics surprised me, as I had seen most public efforts in Canvas lately focusing on getting data out to let customers do their own analytics. The initial analytics in Canvas were introduced in 2012, and there were and are a few cool visualizations for faculty mostly, but there is little meat on the bones. There never seemed to be a real product strategy on the developing role of analytics within an LMS nor a full team to work on this challenge. In the meantime they rolled out Canvas Data, which we have talked to staff from several colleges and universities who are actively playing with and exploring the data. But this year Instructure described how they’ve been hiring a new analytics team and working on new visualizations. As with the previous effort, the initial focus is on helping faculty get a better view of how students are performing. We will have to watch this current focus on analytics to see if a real strategy develops.
Blueprint Courses is a overdue features set to allow course design templates or components across courses or shared between instructors. This capability finally provides direct support for centralized course design models involving master courses and multiple course shells as typically used in large online programs. While this capability could be considered late, conference attendees seemed to be quite impressed with the design of the new features.
Market News
I shared in my post on D2L’s Fusion conference how their Brightspace LMS has made impressive wins recently, particularly for schools with large online programs. Canvas continues to gain market share and lead all competitors in new implementations (schools choosing a new LMS), but over the past 12 months they’ve allowed D2L to at least become a clear competitor.
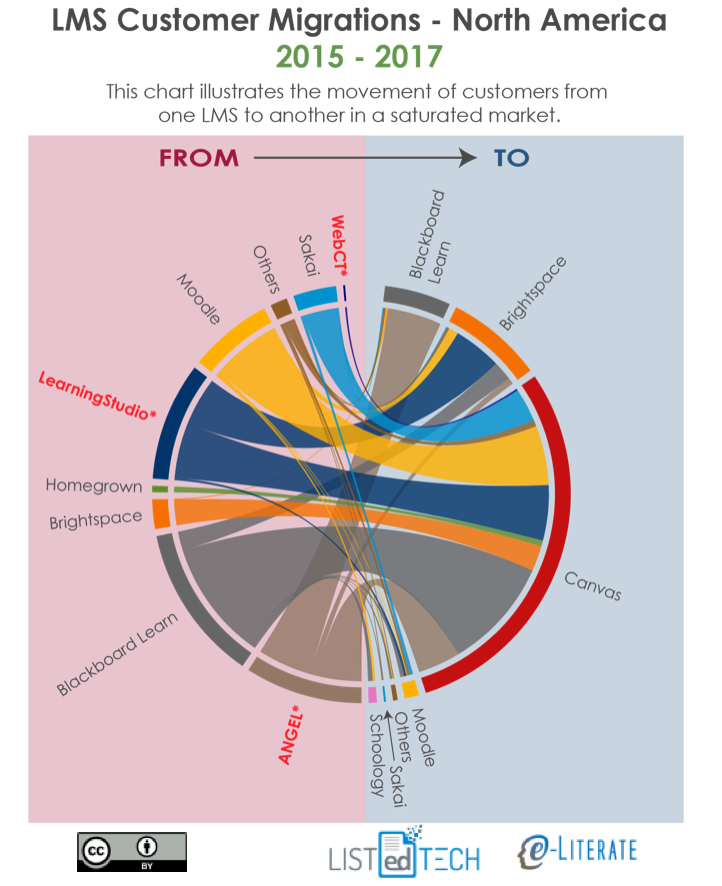
Michael also shared a view from the North American (US and Canada) market for higher education showing that most of Blackboard’s “wins” over the past few years have come from ANGEL end-of-life migrations. Looking at that same image, however, it becomes even more obvious just how well Canvas has performed for new implementations. It is not just that Canvas has the lion’s share of new implementations, it’s also the breadth of migrations coming from Blackboard Learn, Moodle, ANGEL, LearningStudio, Sakai, and even several from D2L Brightspace.
Instructure has recorded strong international grown in just the past two years, and this interest was evident at the conference. The most notable difference between the early users conferences and this year’s event was the expansion of the customer base. There must be similar numbers of K-12 attendees as there are higher education attendees, and we’re now seeing clients from Europe, Latin America, and Australia & New Zealand.
Just 2-3 years ago Canvas as an LMS brand was virtually unknown outside of the US and Canada, but now Canvas is winning more than any others in North America, Europe, Latin America, and Oceania.
Challenges
Instructure certainly has challenges to face. In terms of market share, it will be very interesting to look at data for the end of 2017 to see if D2L has maintained its momentum in new implementations. And being a publicly-traded company, investors care not just that Instructure is growing but also whether Instructure is growing fast enough in multiple markets. That’s a lot of pressure.
On the product front, Canvas was late to the game in terms of supporting mastery learning and associated competency-based education initiatives, although their introduction of MasteryPaths is showing some ability to catch up. Likewise, they certainly are behind their competitors in terms of learning analytics and associated research. And I would even say that they are late in supporting centralized course design models. In all three areas, there are initiatives introduced over the past 12 months to address these product needs. The challenge is for the company to catch up with competitors not necessarily in terms of full feature sets, but more in terms of supporting basic use cases and doing it well.
When I asked various Instructure management at the conference whom they saw as their greatest competitor, the most common answer was themselves. The company knows they have work to do, and there is a real sense of “we have to do better” that permeates the company. For Instructure’s competitors, the good news is that Canvas has weaknesses. The bad news is that the company knows it.
Back to Culture
But the real event of InstructureCon is not really based on product news or market share. As Michael noted last year:
Throughout the conference, I asked a number of attendees what percentage of their motivation for coming was to find out what the company was planning to develop in the next year. The range of answers averaged between 10% and 20%. They all told me that, while they were looking forward to the roadmap sessions later in the week, they didn’t expect any big surprises and weren’t all that focused on finding out what the developers had been doing. I have never been at an LMS conference where that was true, including Sakai conferences and Moodle Moots.
Consider the Instructure company profile at Glassdoor. Last year the company was rated #4 best place to work for all small and medium-sized businesses, and Josh Coates was rated #15 for all CEOs in the same category. But also look at the video that Instructure management chose to include in the “Why Work For Us?” section. Other companies tend to put up platitude-filled dreck that tells you very little about their company. But Instructure puts up a 7+ minute video where they talk primarily about company values. In the video, they talk about the behavior the company does and doesn’t want – and even nods that they’ll get rid of people who have have these behaviors – and they avoid all the pseudo-inspirational messages.
While Canvas is a market-changing platform, that is not really Instructure’s primary strength. Instructure as a company is the real strength.