e-Literate

Present is Prologue

Tag: NCES

  • Fall 2017 IPEDS Data: New Profile of US Higher Ed Online Education

    Fall 2017 IPEDS Data: New Profile of US Higher Ed Online Education

    Update 19 Dec 2018: Images and interactive chart have been updated to fix mistake with sector of multiple institutions. Overall totals have not changed but allocations for each sector have. Thanks to reader Drew Bagley for discovering issue and even looking at data to point me in direction of fix. Post publish date has been updated accordingly.

    The National Center for Educational Statistics (NCES) and its Integrated Postsecondary Education Data System (IPEDS) provide the most official data on colleges and universities in the United States. I have been analyzing and sharing the data since the inaugural Fall 2012 dataset.

    Below is a profile of online education in the US for degree-granting colleges and university, broken out by sector and for each state for the most recent, Fall 2017, data.

    Please note the following:

    • There are multiple ways to filter and select data. For this set, I have limited to U.S. degree-granting institutions in six sectors – public 4-year, private 4-year, for profit 4-year, public 2-year, private 2-year, and for profit 2-year. For undergraduate totals I have included degree-seeking and non-degree-seeking students (degree-granting institutions can offer non-degree programs). Note that this will give different totals than what was reported in the NCES First Look report.
    • For the most part distance education and online education terms are interchangeable, but they are not equivalent as DE can include courses delivered by a medium other than the Internet (e.g. correspondence course).
    • I have provided some flat images as well as an interactive graphic at the bottom of the post. The interactive graphic has much better image resolution than the flat images.
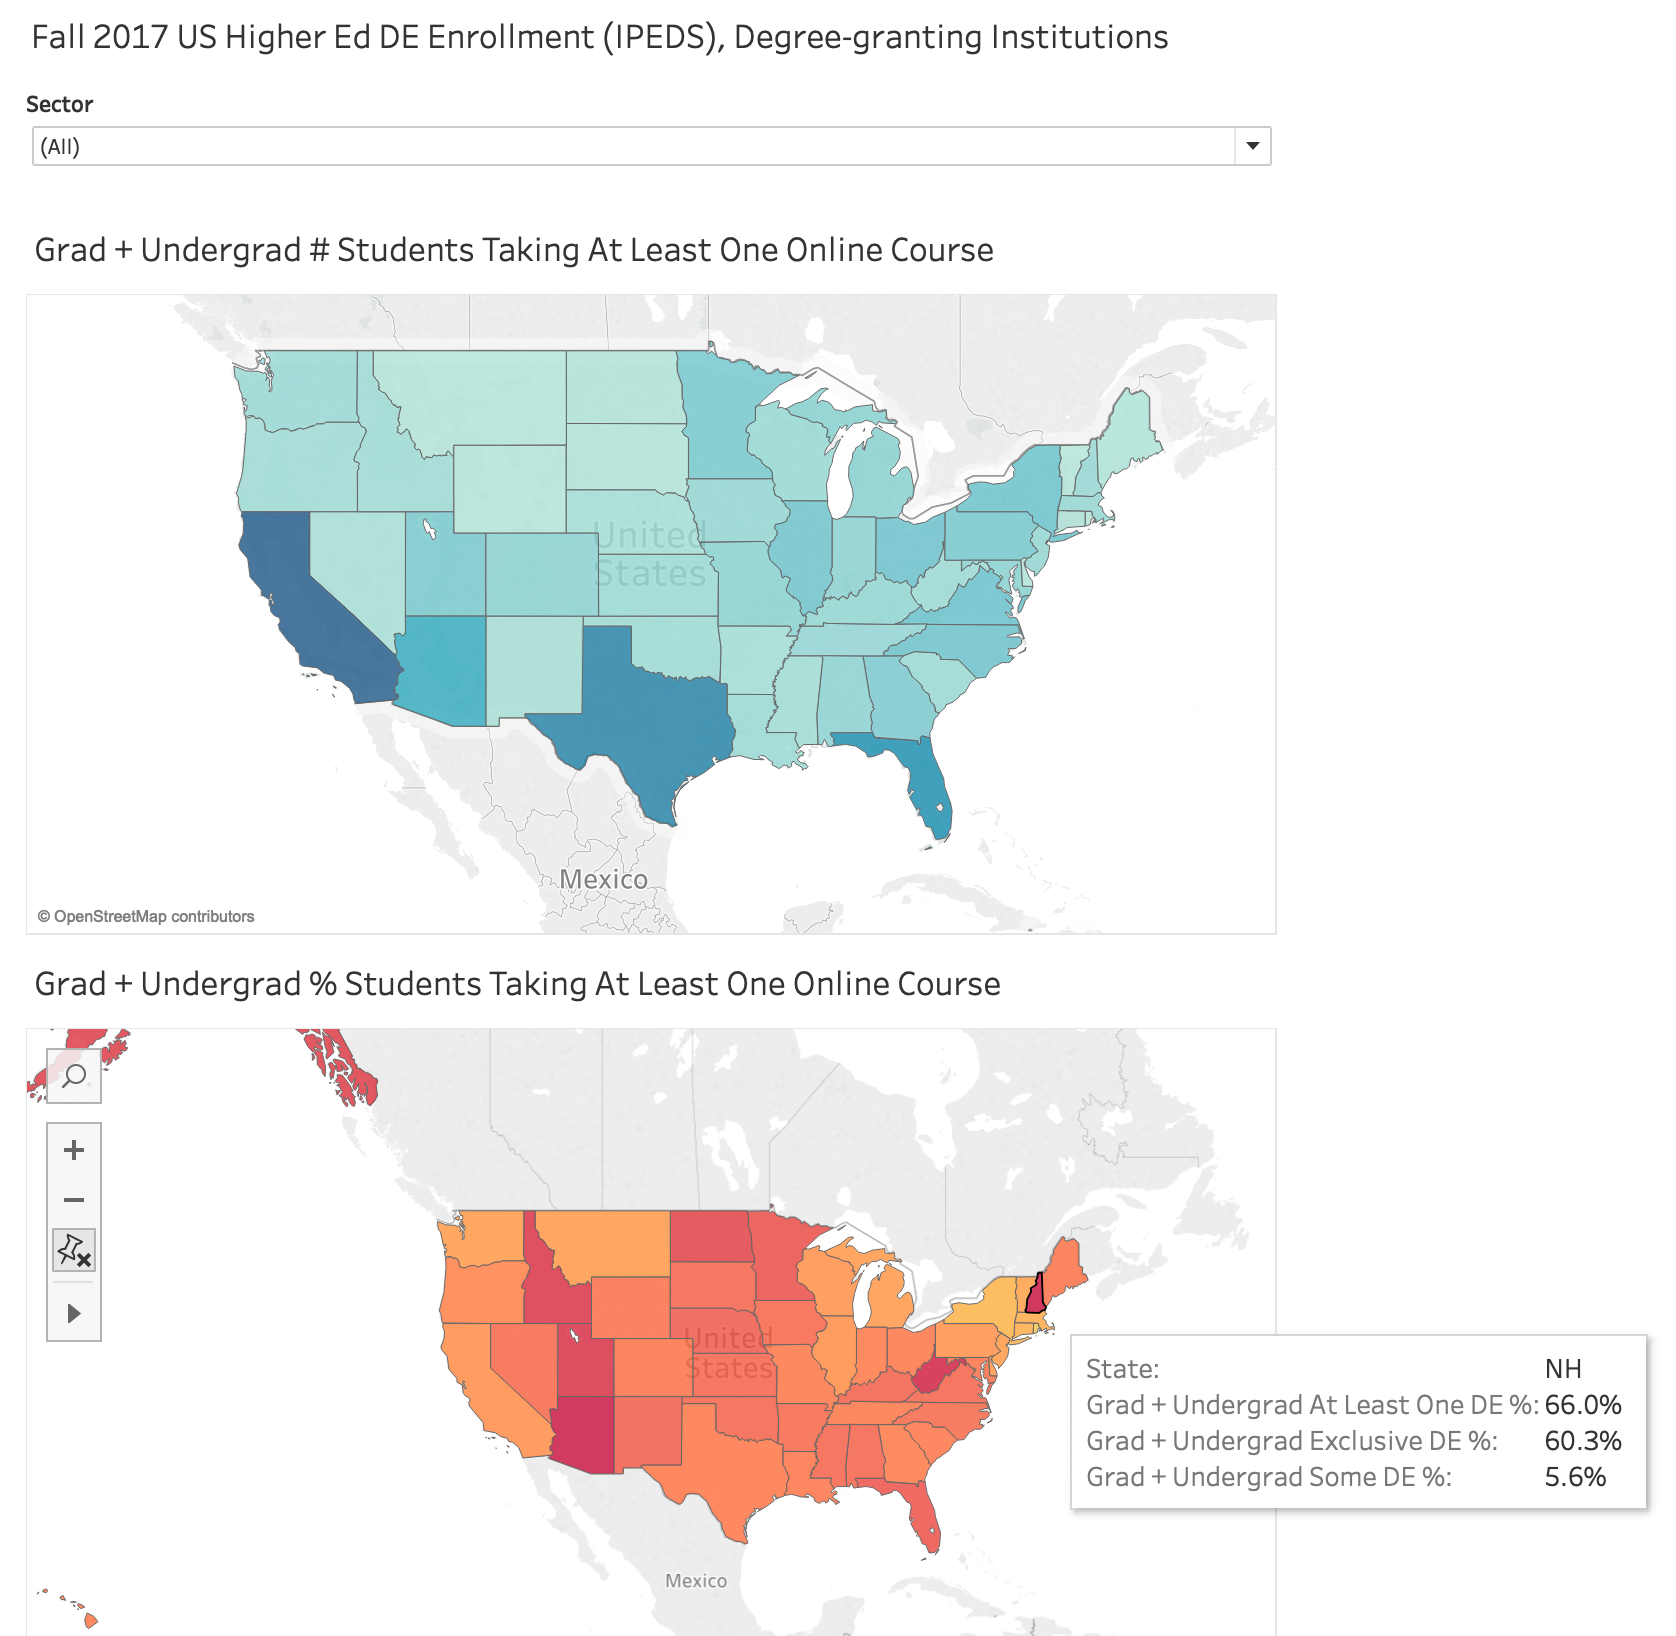
    • There are two tabs below in the interactive graphic – the first shows totals for the US by sector and by level (grad, undergrad); the second shows a map view allowing filtering by sector.
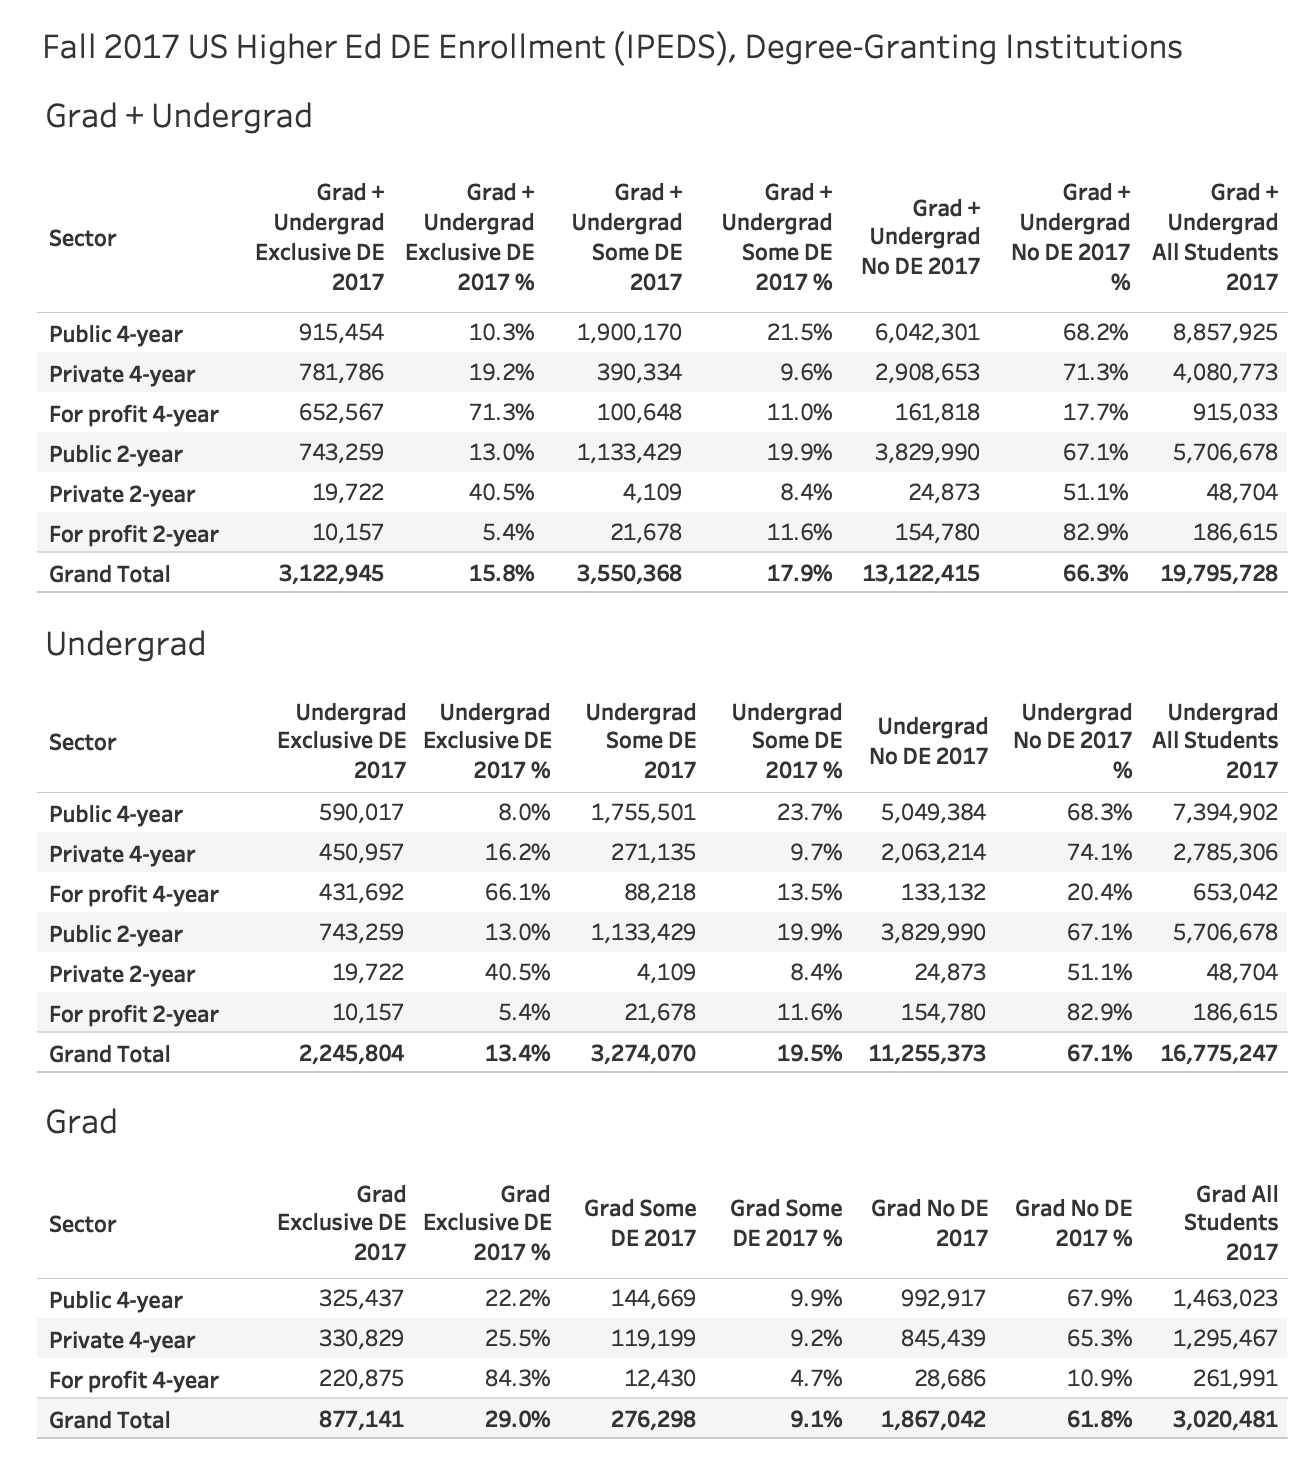
    Fall 2017 IPEDS data on distance education enrollment

    Here is the map view of state data colored by number of, and percentage of, students taking at least one online class for each sector. If you hover over any state you can get the basic data. As an example, here is a view highlighting New Hampshire institutions.
    Interactive Graphic

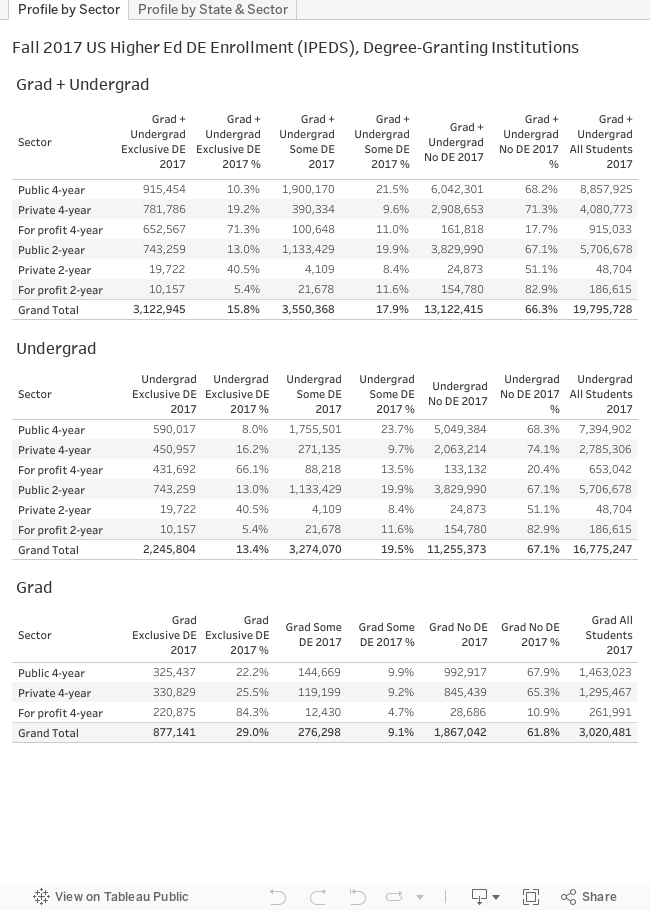
    For those of you who have made it this far, below is the interactive graphic, which can also be found here. Enjoy the data.
  • Fall 2017 Top 30 Largest Online Enrollments In US – With LMS Usage and Trends Since 2012

    Fall 2017 Top 30 Largest Online Enrollments In US – With LMS Usage and Trends Since 2012

    The National Center for Educational Statistics (NCES) and its Integrated Postsecondary Education Data System (IPEDS) provide the most official data on colleges and universities in the United States. This is the sixth year of data on distance education enrollments, and we have an opportunity to view trends over time.

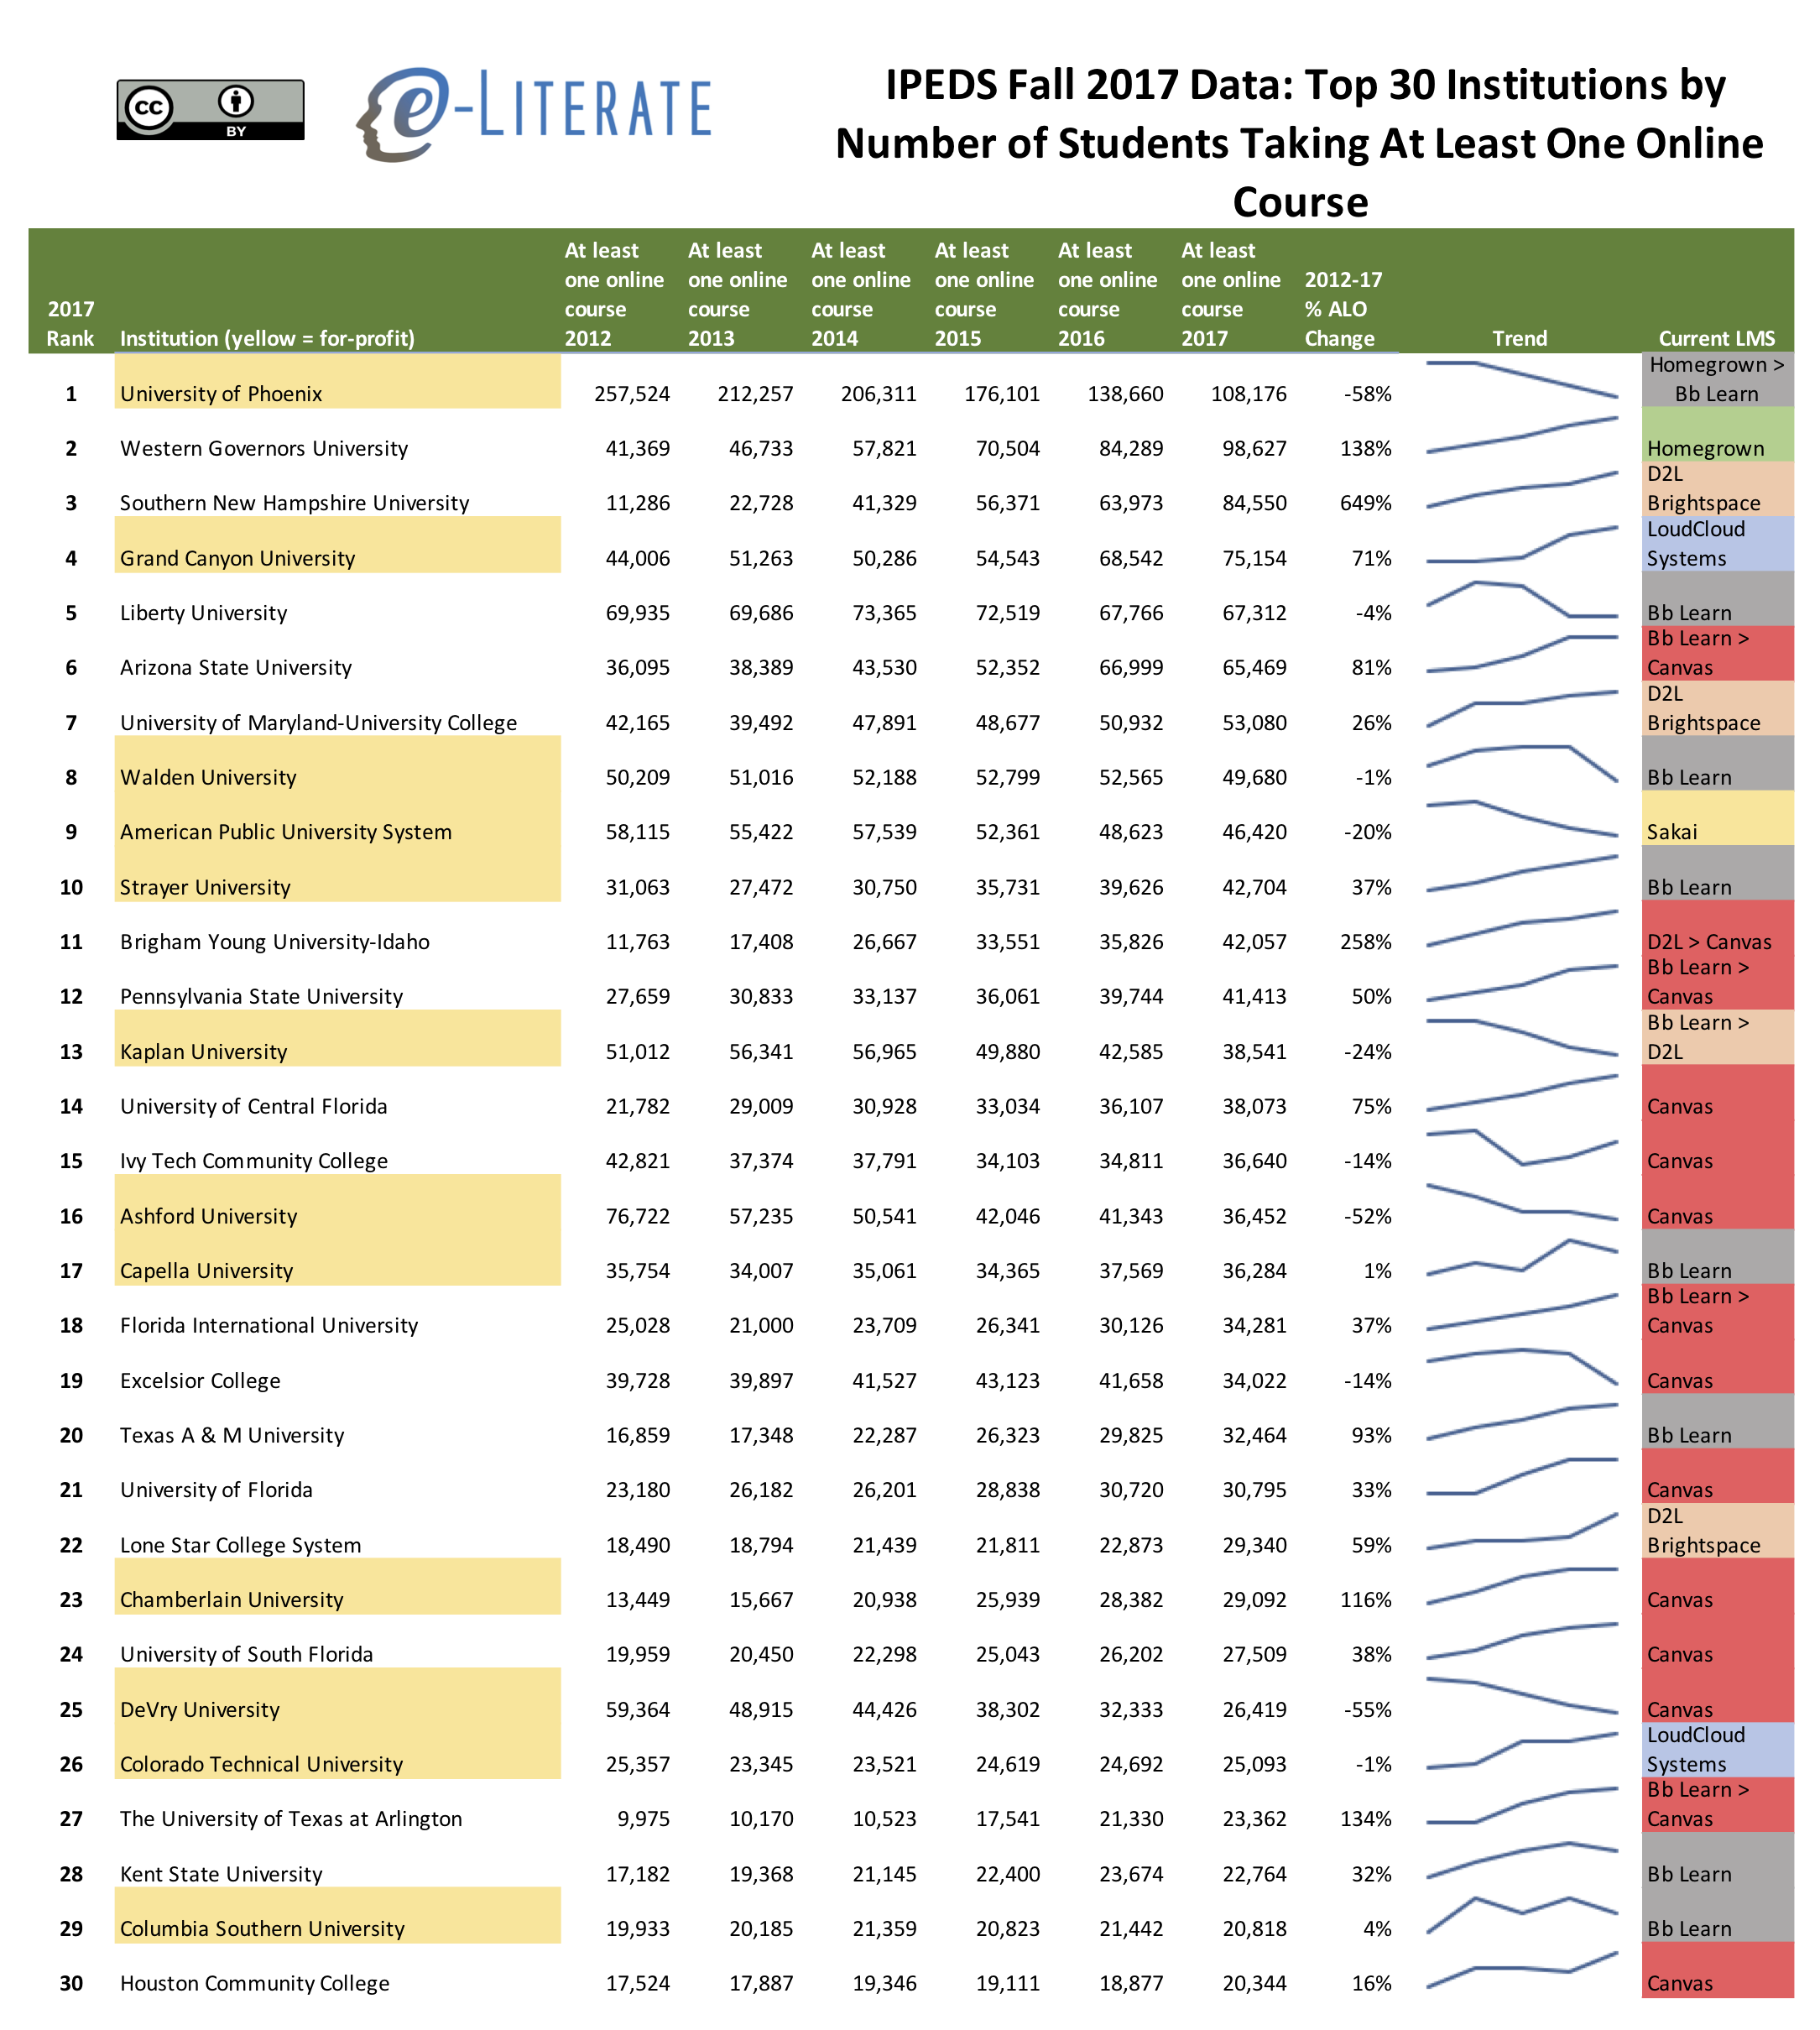
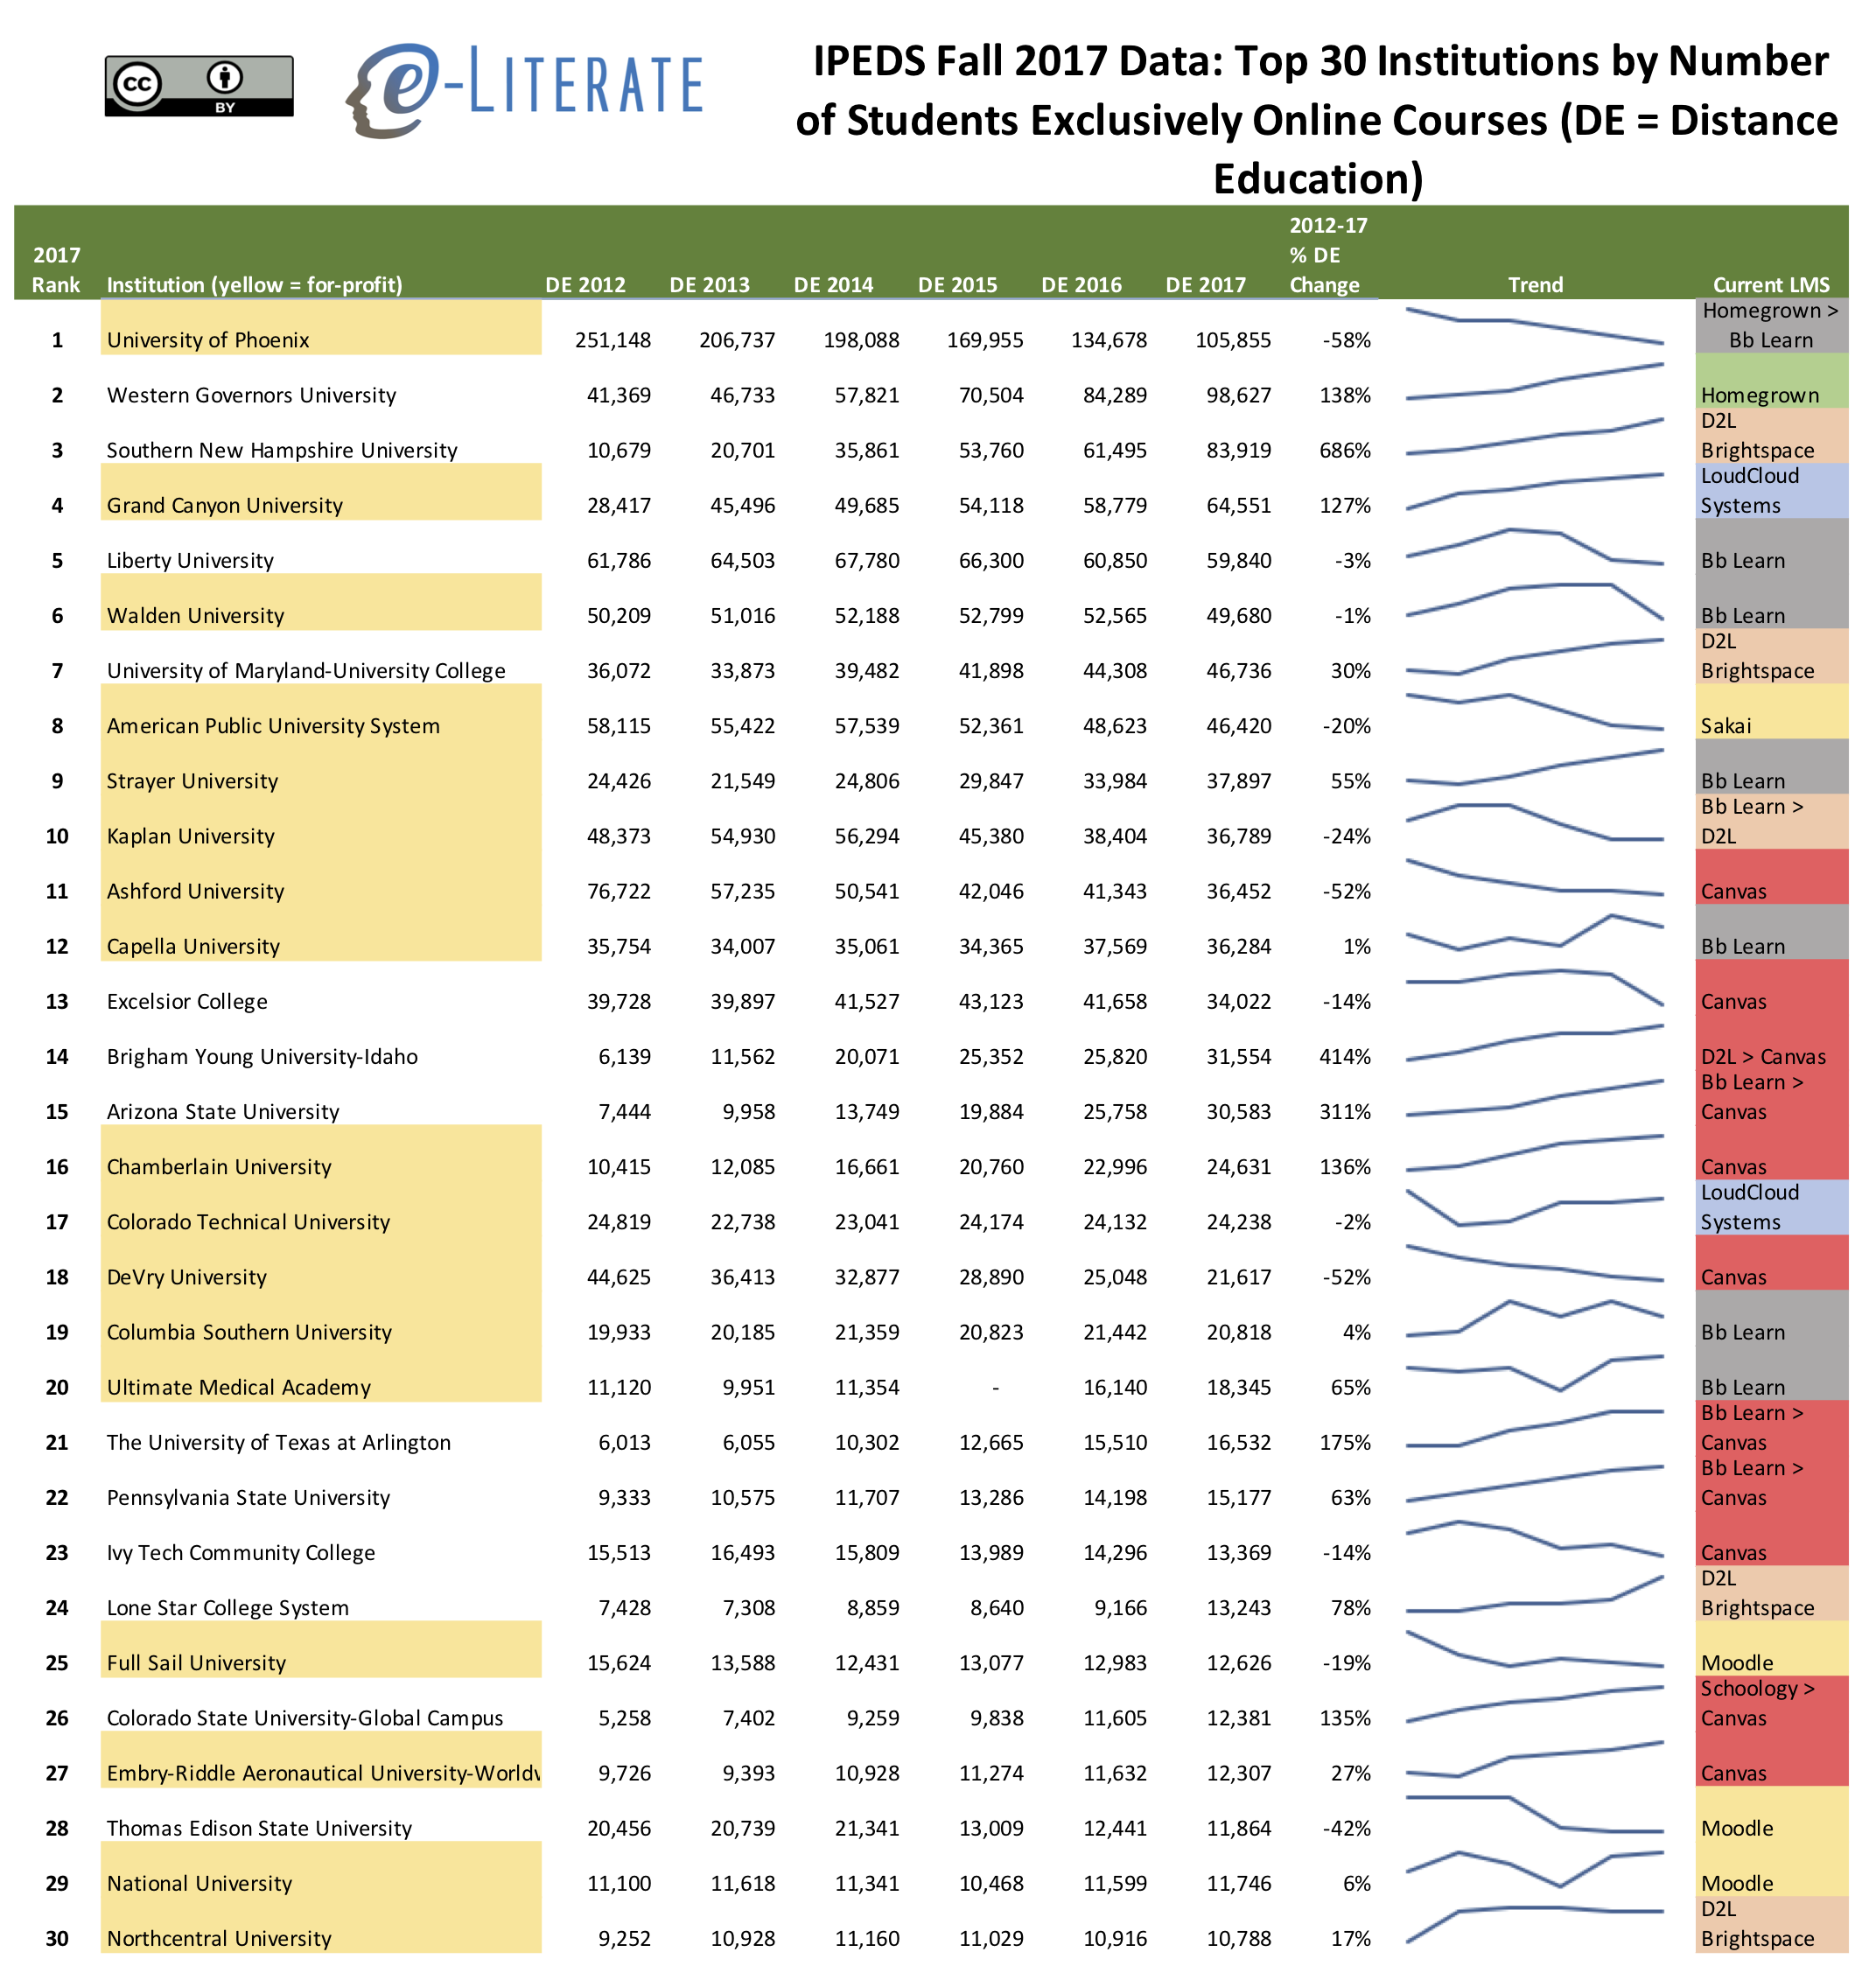
    Let’s look at the top 30 online programs for Fall 2017 (in terms of total number of students taking at least one online course for grad and undergrad levels combined) in the US. Some notes on the data:

    • The first view combines the categories ‘students exclusively taking distance education courses’ and ‘students taking some but not all distance education courses’ to obtain the ‘at least one online course’ category; the second view shows just the ‘students exclusively taking distance education courses’.
    • Note that IPEDS captures distance education enrollment data based on Fall 20xx reports using a census date of October 15; this approach does not fully capture programs with multiple start dates throughout the year.
    • IPEDS tracks data based on the accredited body, which can differ for systems – this data has combined most for-profit systems into one institution entity as well as Arizona State University and a handful of not-for-profit systems that operate as one entity.
    • There is a new column this year showing changes in enrollment in each case between Fall 2012 and Fall 2017 data.
    • Both views highlight for-profit institutions in yellow and added sparklines to help visualize trends. There has been a wave of for-profits converting in one form or another of not-for-profit institutions (e.g. Grand Canyon University, Kaplan / Purdue Global), but these conversions for the most part had not taken place as of the Fall 2017 reporting period.
    • There is another new column this year showing which LMS is currently in usage at each of the schools listed, and in cases where there is a transition in 2018, both systems are shown with a direction > sign.
    • See this post for Fall 2017 profile by sector and state.

    Largest 30 online enrollments in US

    Looking at the case where students exclusively take online courses in a distance education (DE) mode, we see some differences in the list with a greater concentration of for-profit schools.

    Top 30 distance ed institutions

    Finally, it’s worth looking at the top 30 trend over time. Obviously the University of Phoenix is no longer the 800 pound gorilla in distance education, with two not-for-profits – Western Governors University and Southern New Hampshire University – poised to overtake Phoenix in the next year or two. This view also shows the tendency for most institutions to top out at approximately 60,000 students, but this may be changing with the three counter-examples above as well as Grand Canyon University.

    IPEDS Top 30 trend 2012-17

    Based on a reader request, I have added a Google Sheet for the data used above. There are tabs for Top 200 and Top 30 listings for each category (ALO and DE), but the LMS data was added manually and only available in Top 30.

    Update 11/26: Fixed mistake in 2012-17% calculations, updated first two images. Added downloadable Google Sheet for data access.

  • Fall 2016 Top 20 Largest Online Enrollments In US – With Trends Since 2012

    Fall 2016 Top 20 Largest Online Enrollments In US – With Trends Since 2012

    The National Center for Educational Statistics (NCES) and its Integrated Postsecondary Education Data System (IPEDS) provide the most official data on colleges and universities in the United States. This is the fifth year of data, and we have an opportunity to view trends over time.

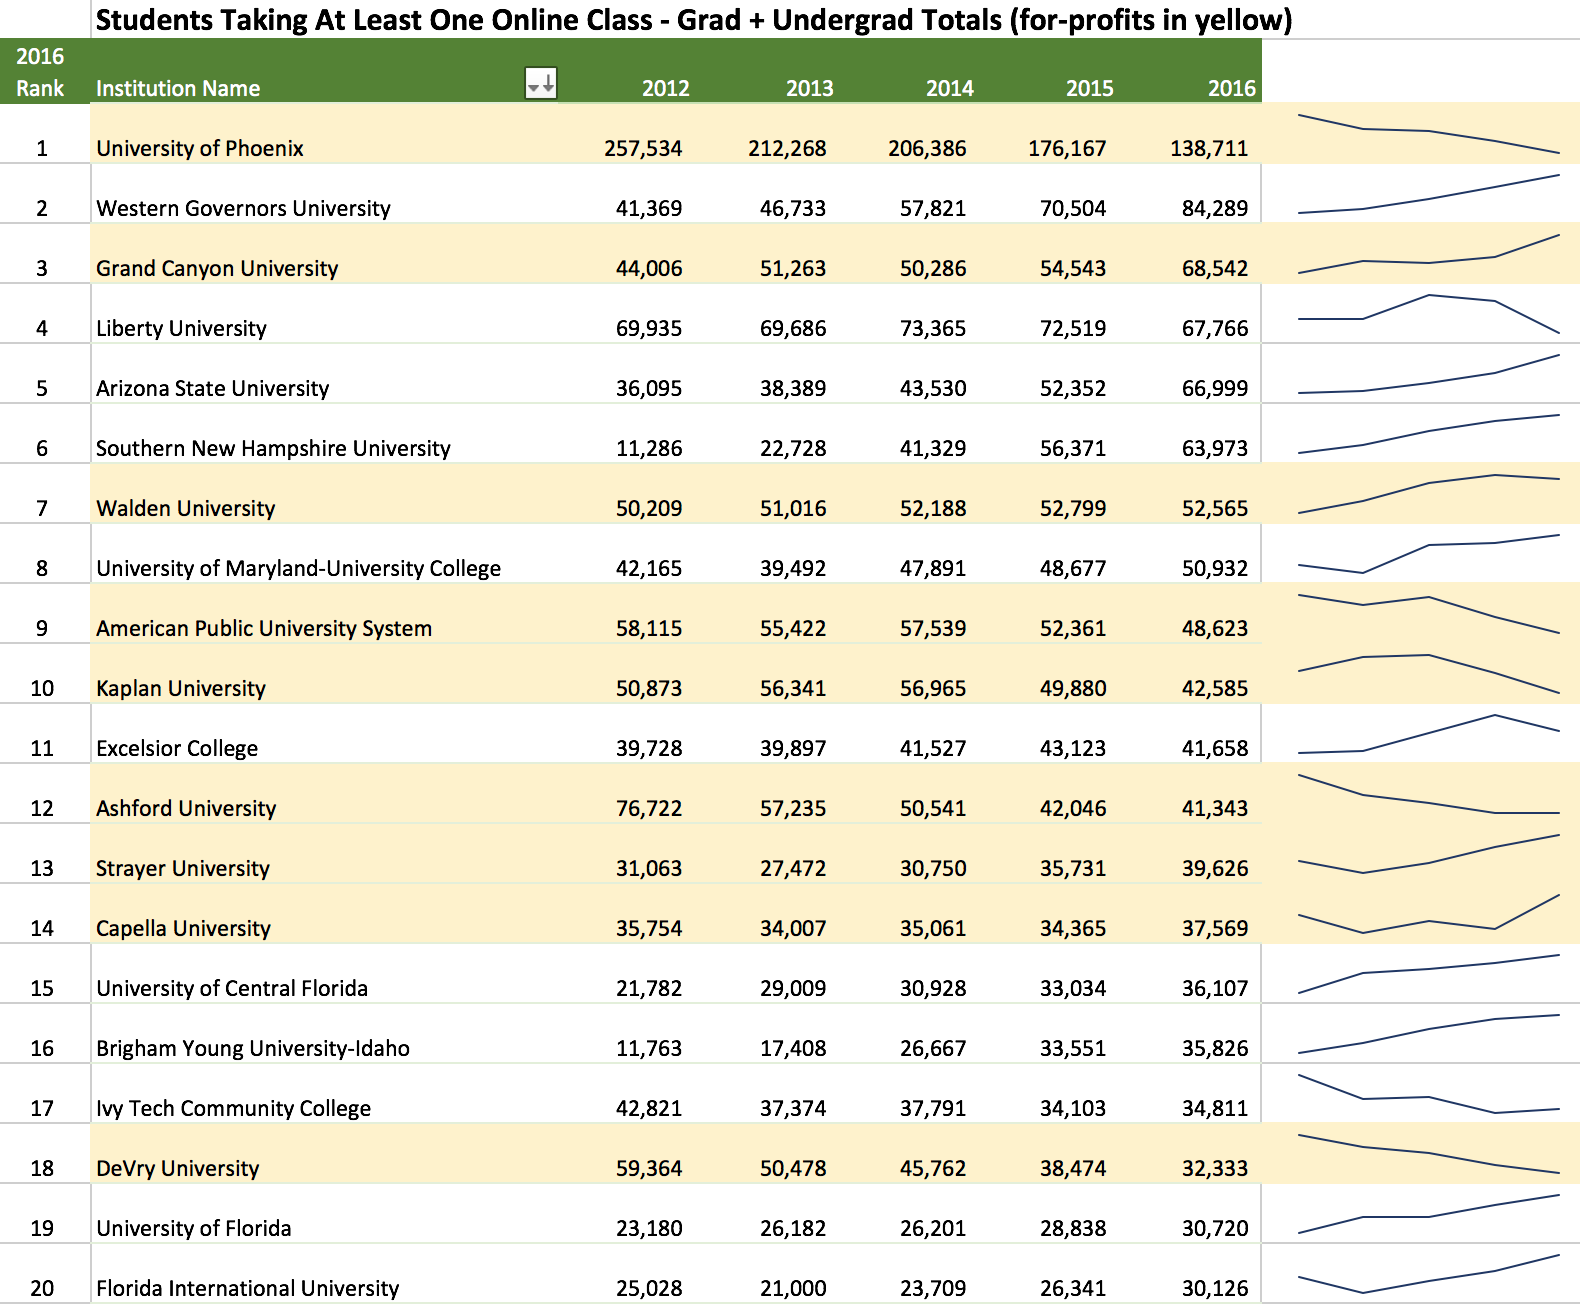
    Let’s look at the top 20 online programs for Fall 2016 (in terms of total number of students taking at least one online course for grad and undergrad levels combined) in the US. Some notes on the data source:

    • I have combined the categories ‘students exclusively taking distance education courses’ and ‘students taking some but not all distance education courses’ to obtain the ‘at least one online course’ category;
    • IPEDS tracks data based on the accredited body, which can differ for systems – I manually combined most for-profit systems into one institution entity as well as Arizona State University;
    • I have highlighted for-profit institutions in yellow and added sparklines to help visualize trends;
    • See this post for Fall 2016 profile by sector and state.

    Top 20 Online Enrollment in US

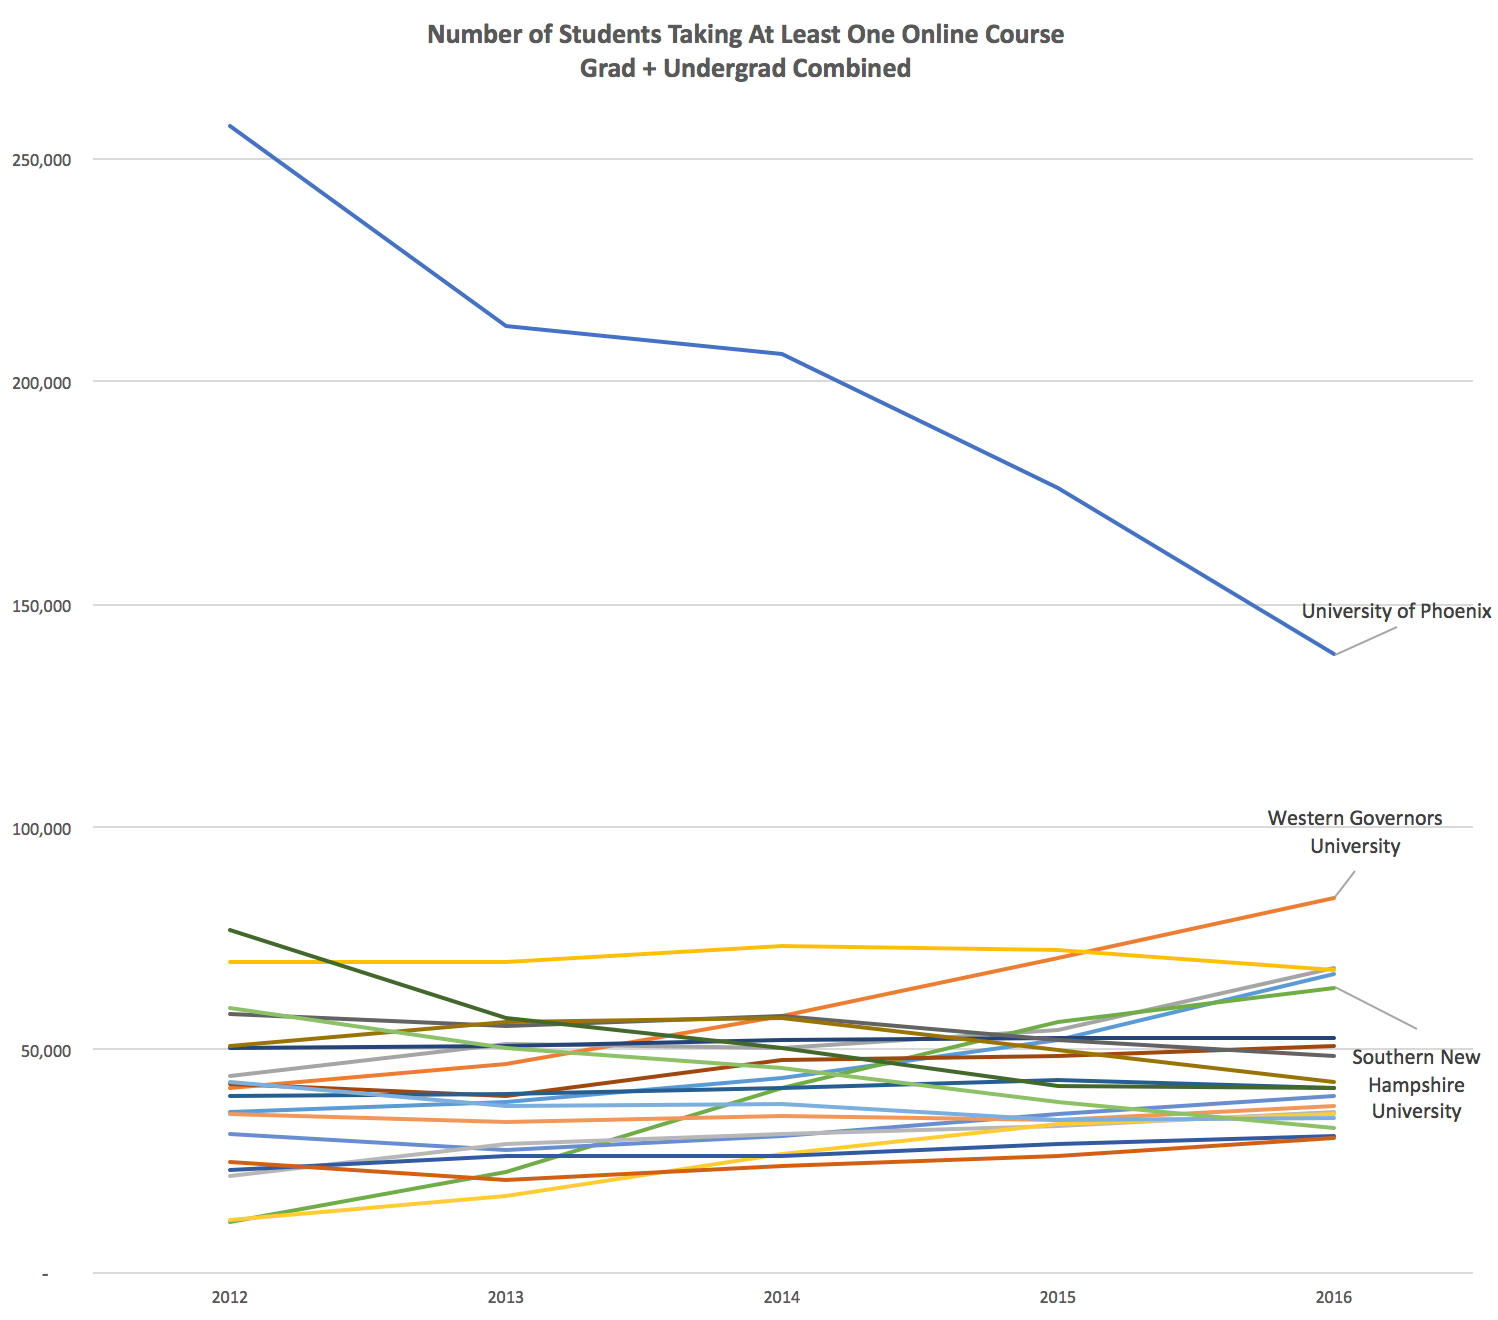
    One additional trend to capture is the dramatic change in the (previous) dominance of the University of Phoenix for overall and online enrollment. For perspective I have also labeled Western Governors University and Southern New Hampshire University.

    Top 20 Online Enrollment 2012 thru 2016

  • Fall 2016 IPEDS Data: New Profile of US Higher Ed Online Education

    Fall 2016 IPEDS Data: New Profile of US Higher Ed Online Education

    The National Center for Educational Statistics (NCES) and its Integrated Postsecondary Education Data System (IPEDS) provide the most official data on colleges and universities in the United States. I have been analyzing and sharing the data since the inaugural Fall 2012 dataset.

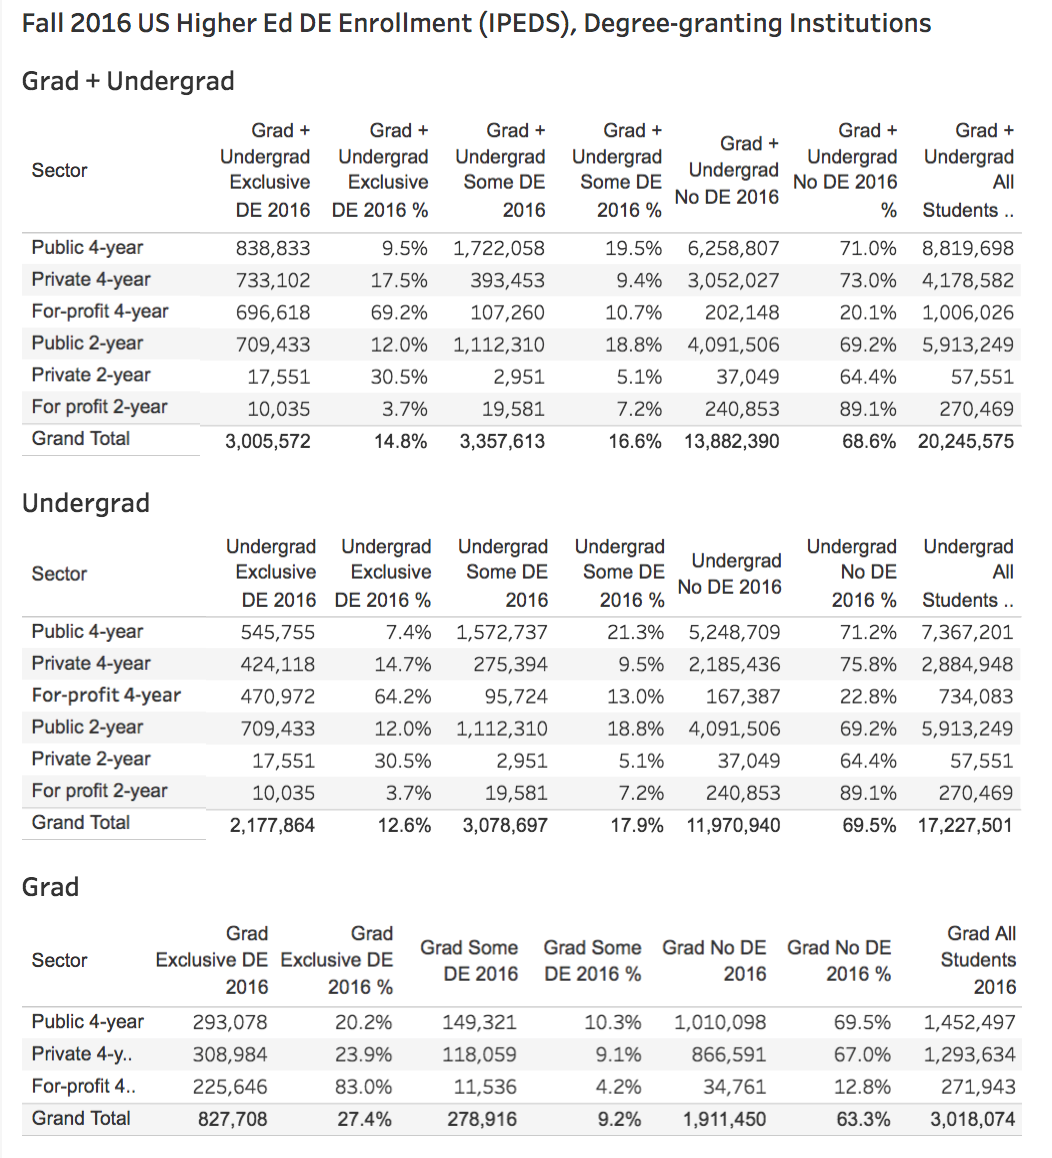
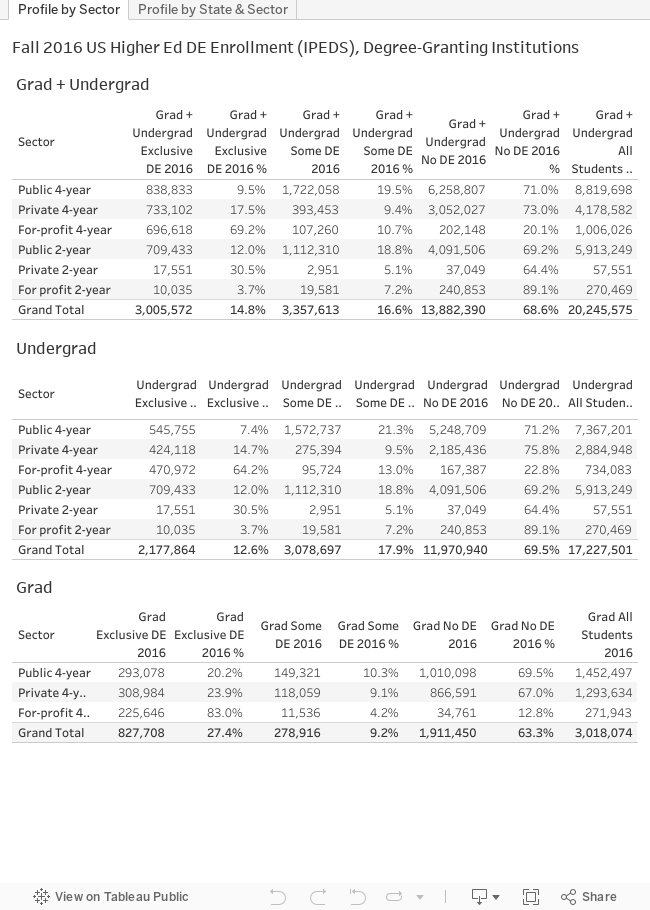
    Below is a profile of online education in the US for degree-granting colleges and university, broken out by sector and for each state.

    Please note the following:

    • For the most part distance education and online education terms are interchangeable, but they are not equivalent as DE can include courses delivered by a medium other than the Internet (e.g. correspondence course).
    • I have provided some flat images as well as an interactive graphic at the bottom of the post. The interactive graphic has much better image resolution than the flat images.
    • There are two tabs below in the interactive graphic – the first shows totals for the US by sector and by level (grad, undergrad); the third shows a map view allowing filtering by sector.

    Table of DE enrollments

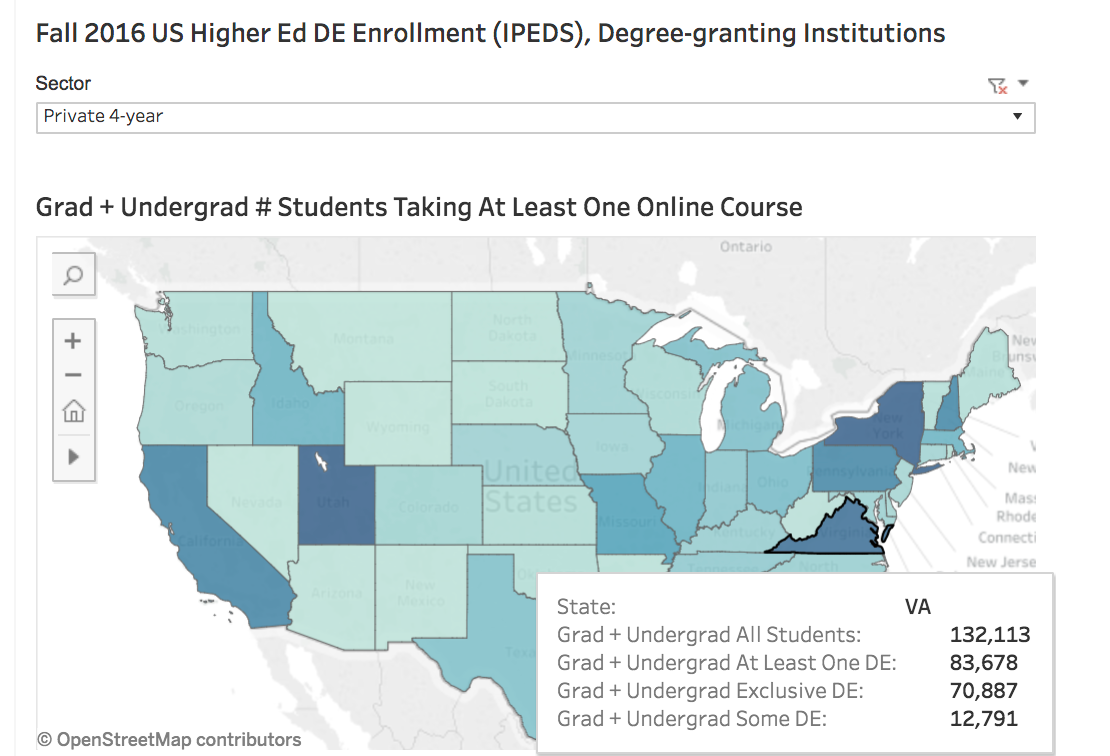
    There is also a map view of state data colored by number of, and percentage of, students taking at least one online class for each sector. If you hover over any state you can get the basic data. As an example, here is a view highlighting Virginia private 4-year institutions.

    State map view of DE enrollments

    Interactive Graphic

    For those of you who have made it this far, below is the interactive graphic, which can also be found here. Enjoy the data.
  • Fall 2016 IPEDS First Look: Continued growth in distance education in US

    Fall 2016 IPEDS First Look: Continued growth in distance education in US

    The National Center for Educational Statistics (NCES) just released its Integrated Postsecondary Education Data System (IPEDS) report and data on postsecondary enrollment in the US for the Fall 2016 term. This federal data has been tracking distance education (DE) since Fall 2012, and with the new release we get our first look at trends through last year. Accompanying the data is a report by NCES with summary data tables. For the following tables and chart, I took the same approach as the report, by simply filtering for US-only institutions participating in Title IV federal financial aid programs.

    Please note that this is a broader definition, with more schools included, that our previous analysis at e-Literate and the Digital Learning Compass report. Those posts and analysis further filter for 2-year and 4-year degree-granting institutions.

    When viewing data from this first look at 6,677 institutions and administrative units, please note the following:

    • For the most part distance education and online education terms are interchangeable, but they are not equivalent as DE can include courses delivered by a medium other than the Internet (e.g. correspondence course).
    • Exclusively DE means students who take all their courses online.
    • Some DE means students who take some but not all of their courses online.
    • At Least One DE is a combination of the above two categories, showing students who take at least one of their courses online.
    • No DE means students not taking any online courses.
    • The data totals used in the report are slightly off (0.07%) from what is in the data set that is the basis for my tables and chart below. I have not figured out this discrepancy yet, but it is immaterial for the big picture.

    For this first post, I am showing totals – institutions in all sectors, and a combination of student enrollment from graduate and undergraduate (4-year, 2-year, and less than 2-year) programs. I’ll break down by sector and level of study and even state in future posts.

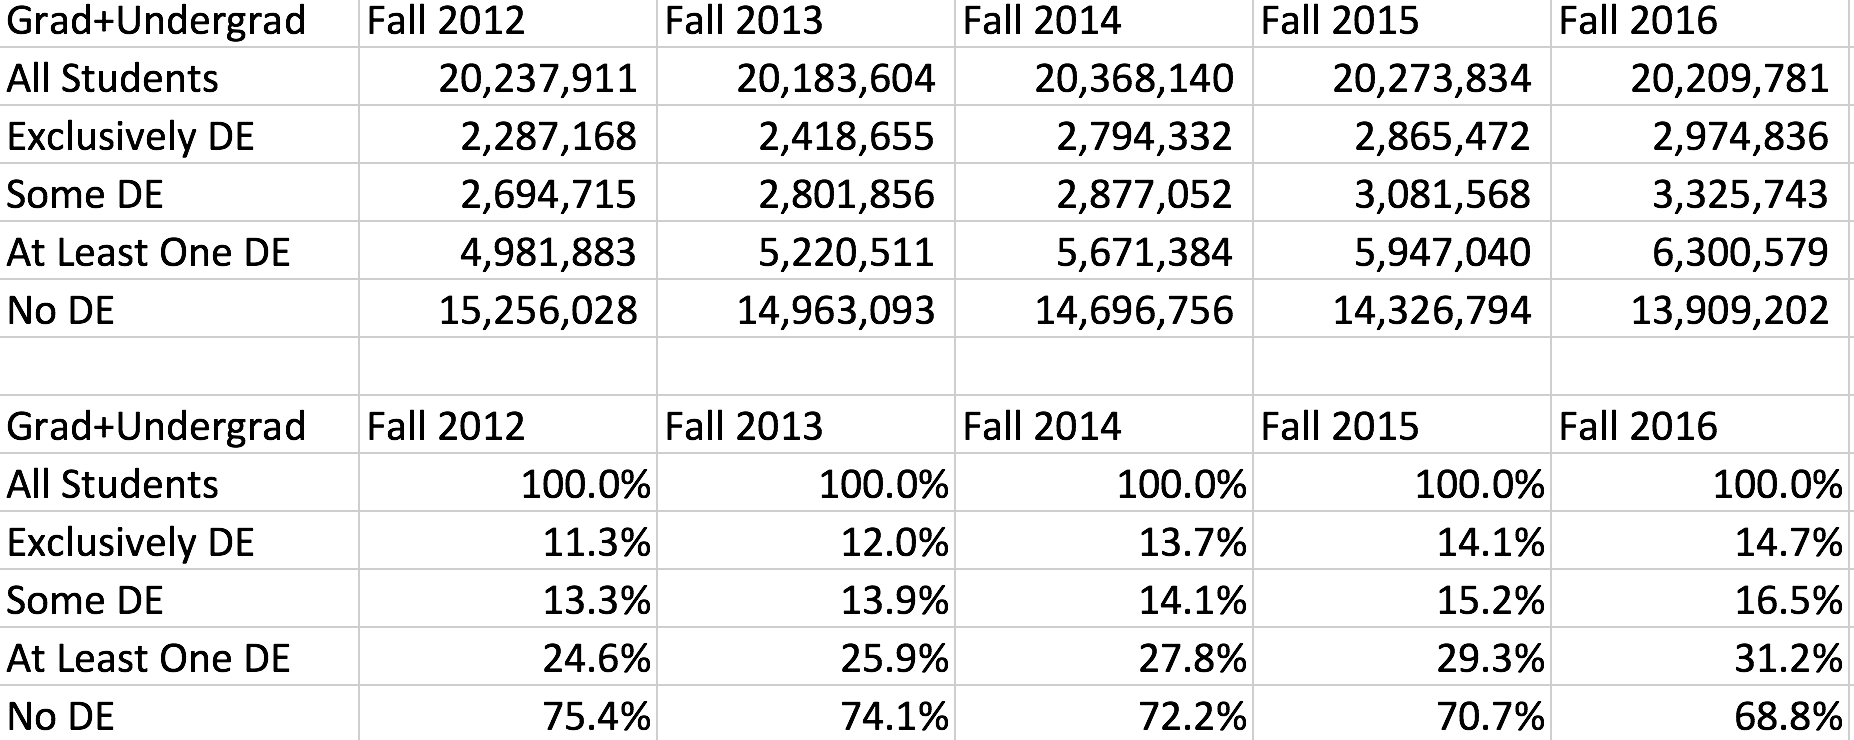
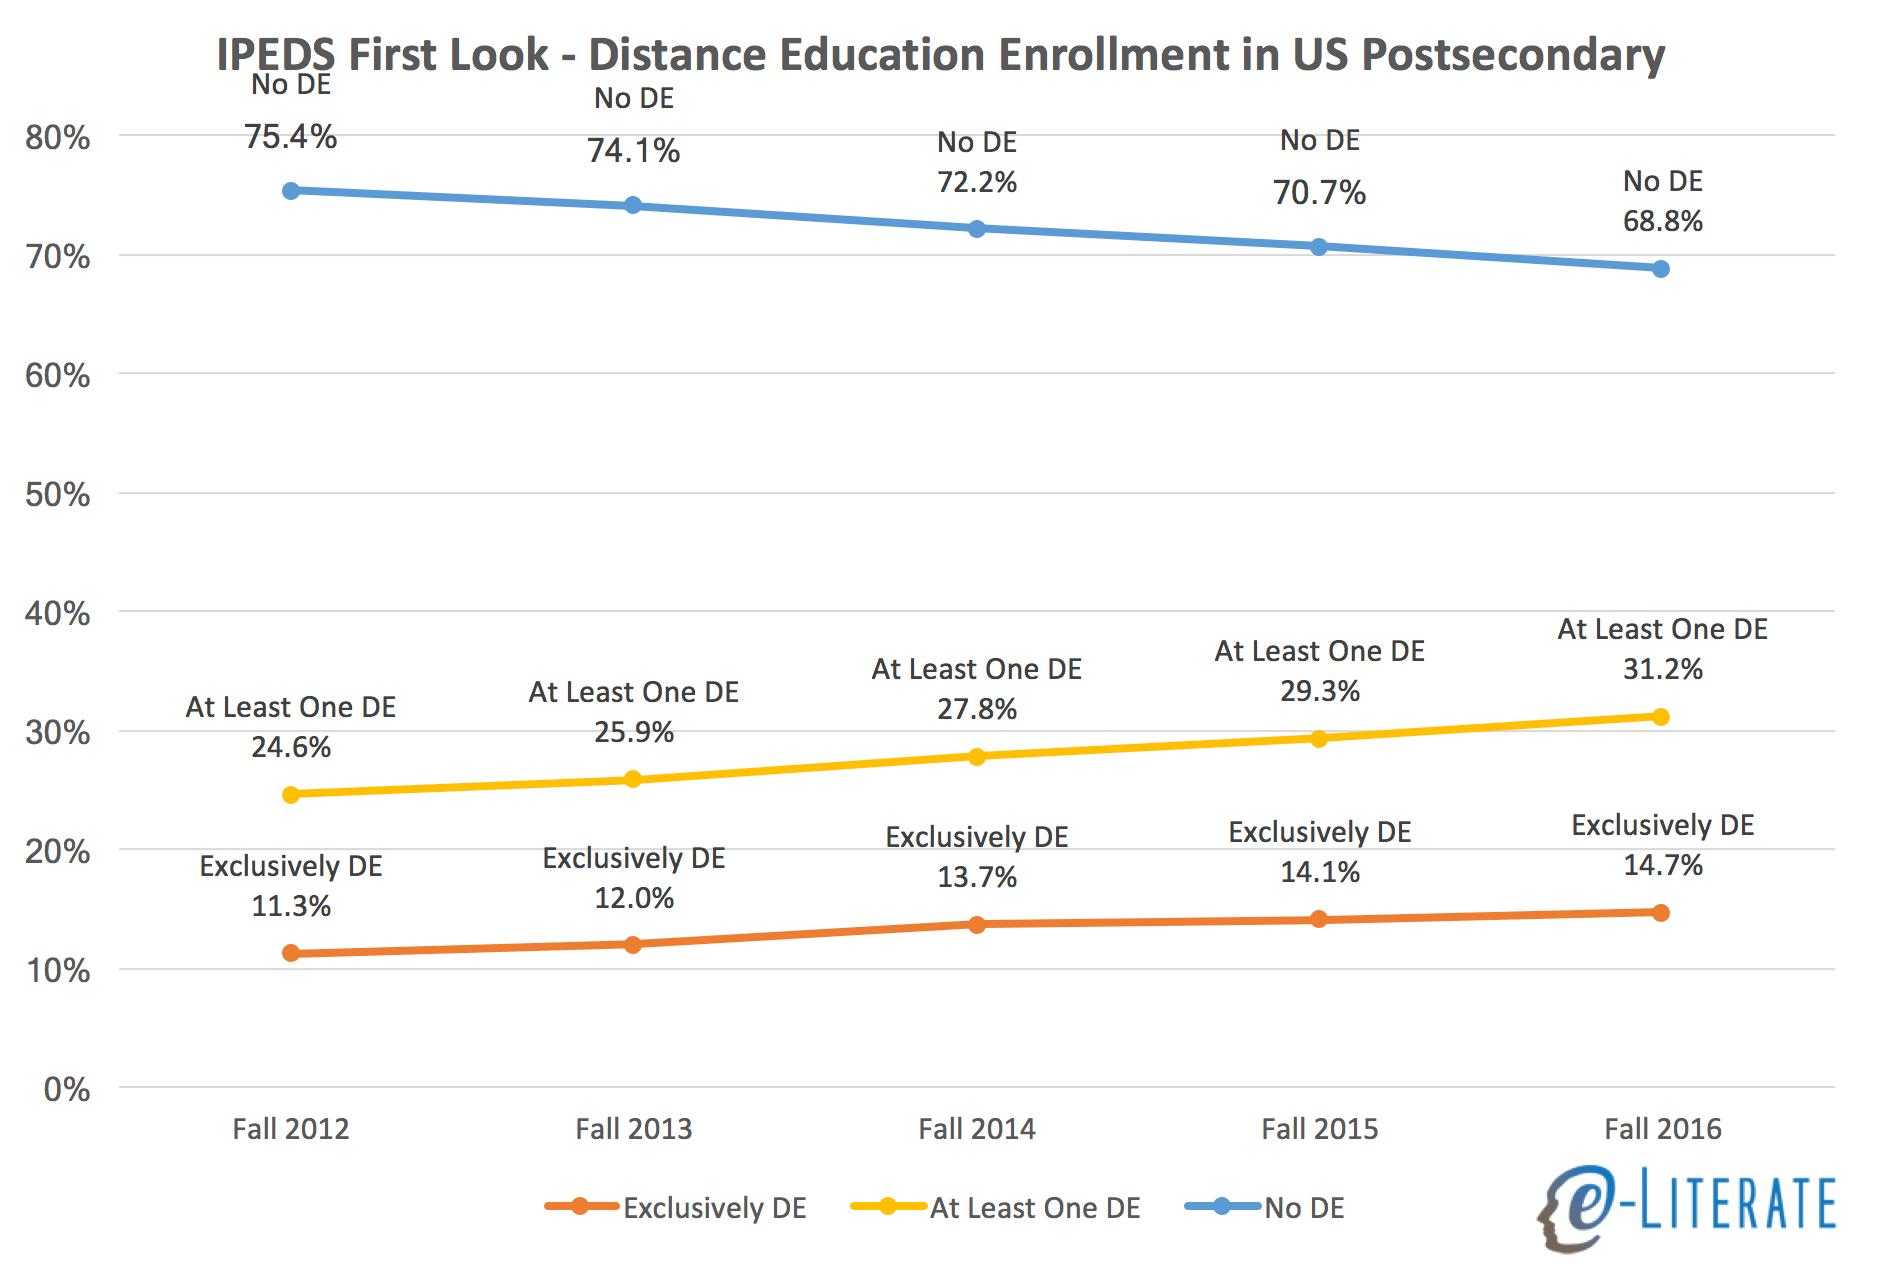
    With all those caveats in mind, here are data from Fall 2012 through 2016.

    Some observations of this data for Fall 2016:

    • There appears to be an small but noticeable acceleration in the growth of DE, going from 1.5% increase in percentage of students taking at least one online course from Fall 2014 to 2015, and a 1.9% increase from Fall 2015 to 2016. Although not shown in these tables, the acceleration appears in both undergraduate and graduate programs.
    • In the four-year period from Fall 2012 to Fall 2016, the share of students taking at least one online course increased by 27% (from 24.6% to 31.2%).
    • Note that this broad view of students (US, Title IV as only filters) does not capture the decrease in total enrollment shown in other IPEDS reports or National Student Clearinghouse reports.

    We’ll look deeper into the data and apply more consistent filtering to allow comparisons to our previous analysis. And we’ll break down by level of study, sector, and home state of institutions.

  • Fall 2014 IPEDS Data: Interactive table ranking DE programs by enrollment

    Last week I shared a static view of the US institutions with the 30 highest enrollments of students taking at least one online (distance ed, or DE) course. But we can do better than that, thanks to some help from Justin Menard at LISTedTECH and his Tableau guidance.

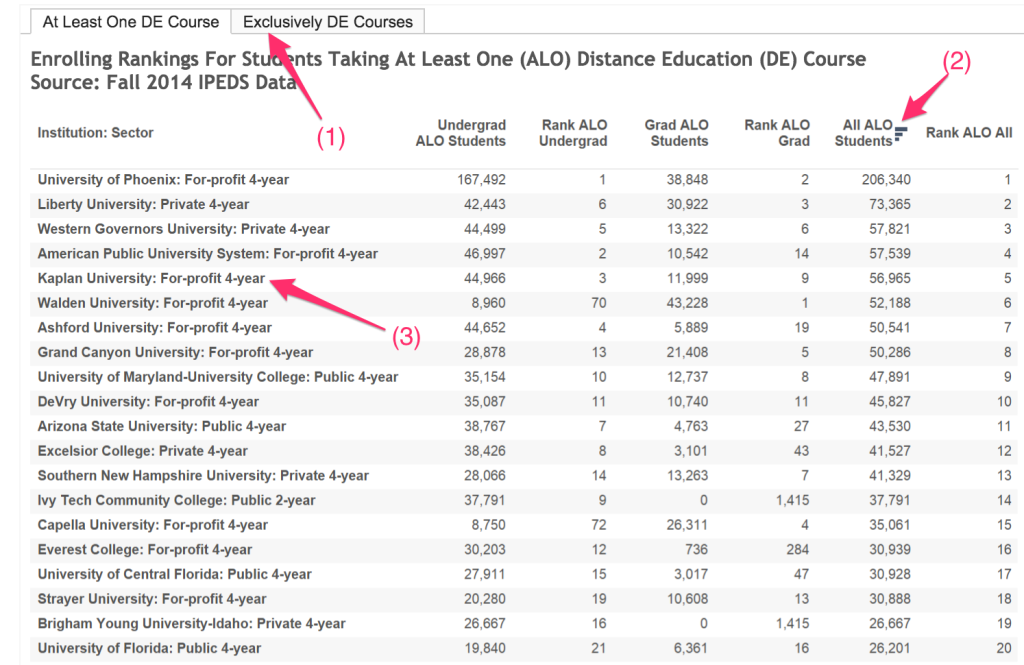
    The following interactive chart allows you to see the full rankings based on undergraduate, graduate and combined enrollments. And it has two views – one for students taking at least one online course and one for exclusive online students. Note the following:

    Tableau hints

    • (1) shows how you can change views by selecting the appropriate tab.
    • (2) shows how you can sort on any of the three measures (hover over the column header).
    • (3) shows the sector for each institution by the institution name.

    (more…)

  • Fall 2014 IPEDS Data: Top 30 largest online enrollments per institution

    The National Center for Educational Statistics (NCES) and its Integrated Postsecondary Education Data System (IPEDS) provide the most official data on colleges and universities in the United States. This is the third year of data.

    Let’s look at the top 30 online programs for Fall 2014 (in terms of total number of students taking at least one online course). Some notes on the data source:

    • I have combined the categories ‘students exclusively taking distance education courses’ and ‘students taking some but not all distance education courses’ to obtain the ‘at least one online course’ category;
    • Each sector is listed by column;
    • IPEDS tracks data based on the accredited body, which can differ for systems – I manually combined most for-profit systems into one institution entity as well as Arizona State University[1];
    • See this post for Fall 2013 Top 30 data and see this post for Fall 2014 profile by sector and state.

    Fall 2014 Top 30 Largest Online Enrollments Per Institution (more…)