Since the earliest days of Campus Computing and EDUCAUSE measurement of LMS market data up through recent analysis by Edutechnica and LISTedTECH (the latter our partners for the LMS market analysis service and data behind our LMS graphics), the most common measurement used has been “number of institutions adopting system X as their primary LMS”. But that is only one view, and like any view it has limitations. Sweet Briar College with 900 students is treated with the same metric as Ohio State University with 55,000. I’m sorry, The Ohio State University.
Based on our recent publication of market share data and graphics, we have had multiple requests to share similar data by enrollment. Both Edutechnica and LISTedTECH have provided such views here and there in the past, but given our recent analysis expansion along with LISTedTECH to cover non-North American regions, we thought it would be worth sharing LMS market data based on enrollments.
What we cannot do is look at how many students actually use the LMS. But for North America (US and Canada in this case) and Europe, we have sufficient coverage of official enrollment figures that we can scale each institution by its enrollment data. This is how most LMS companies determine their prices for each school, so it is a much better measurement to correlate with market revenues. Not a perfect measure, but a better one.
In addition, this view gives additional insights into the market and likely future direction of the LMS providers.
Hey Phil, will you just get to the damn graphics? Let us judge the importance.
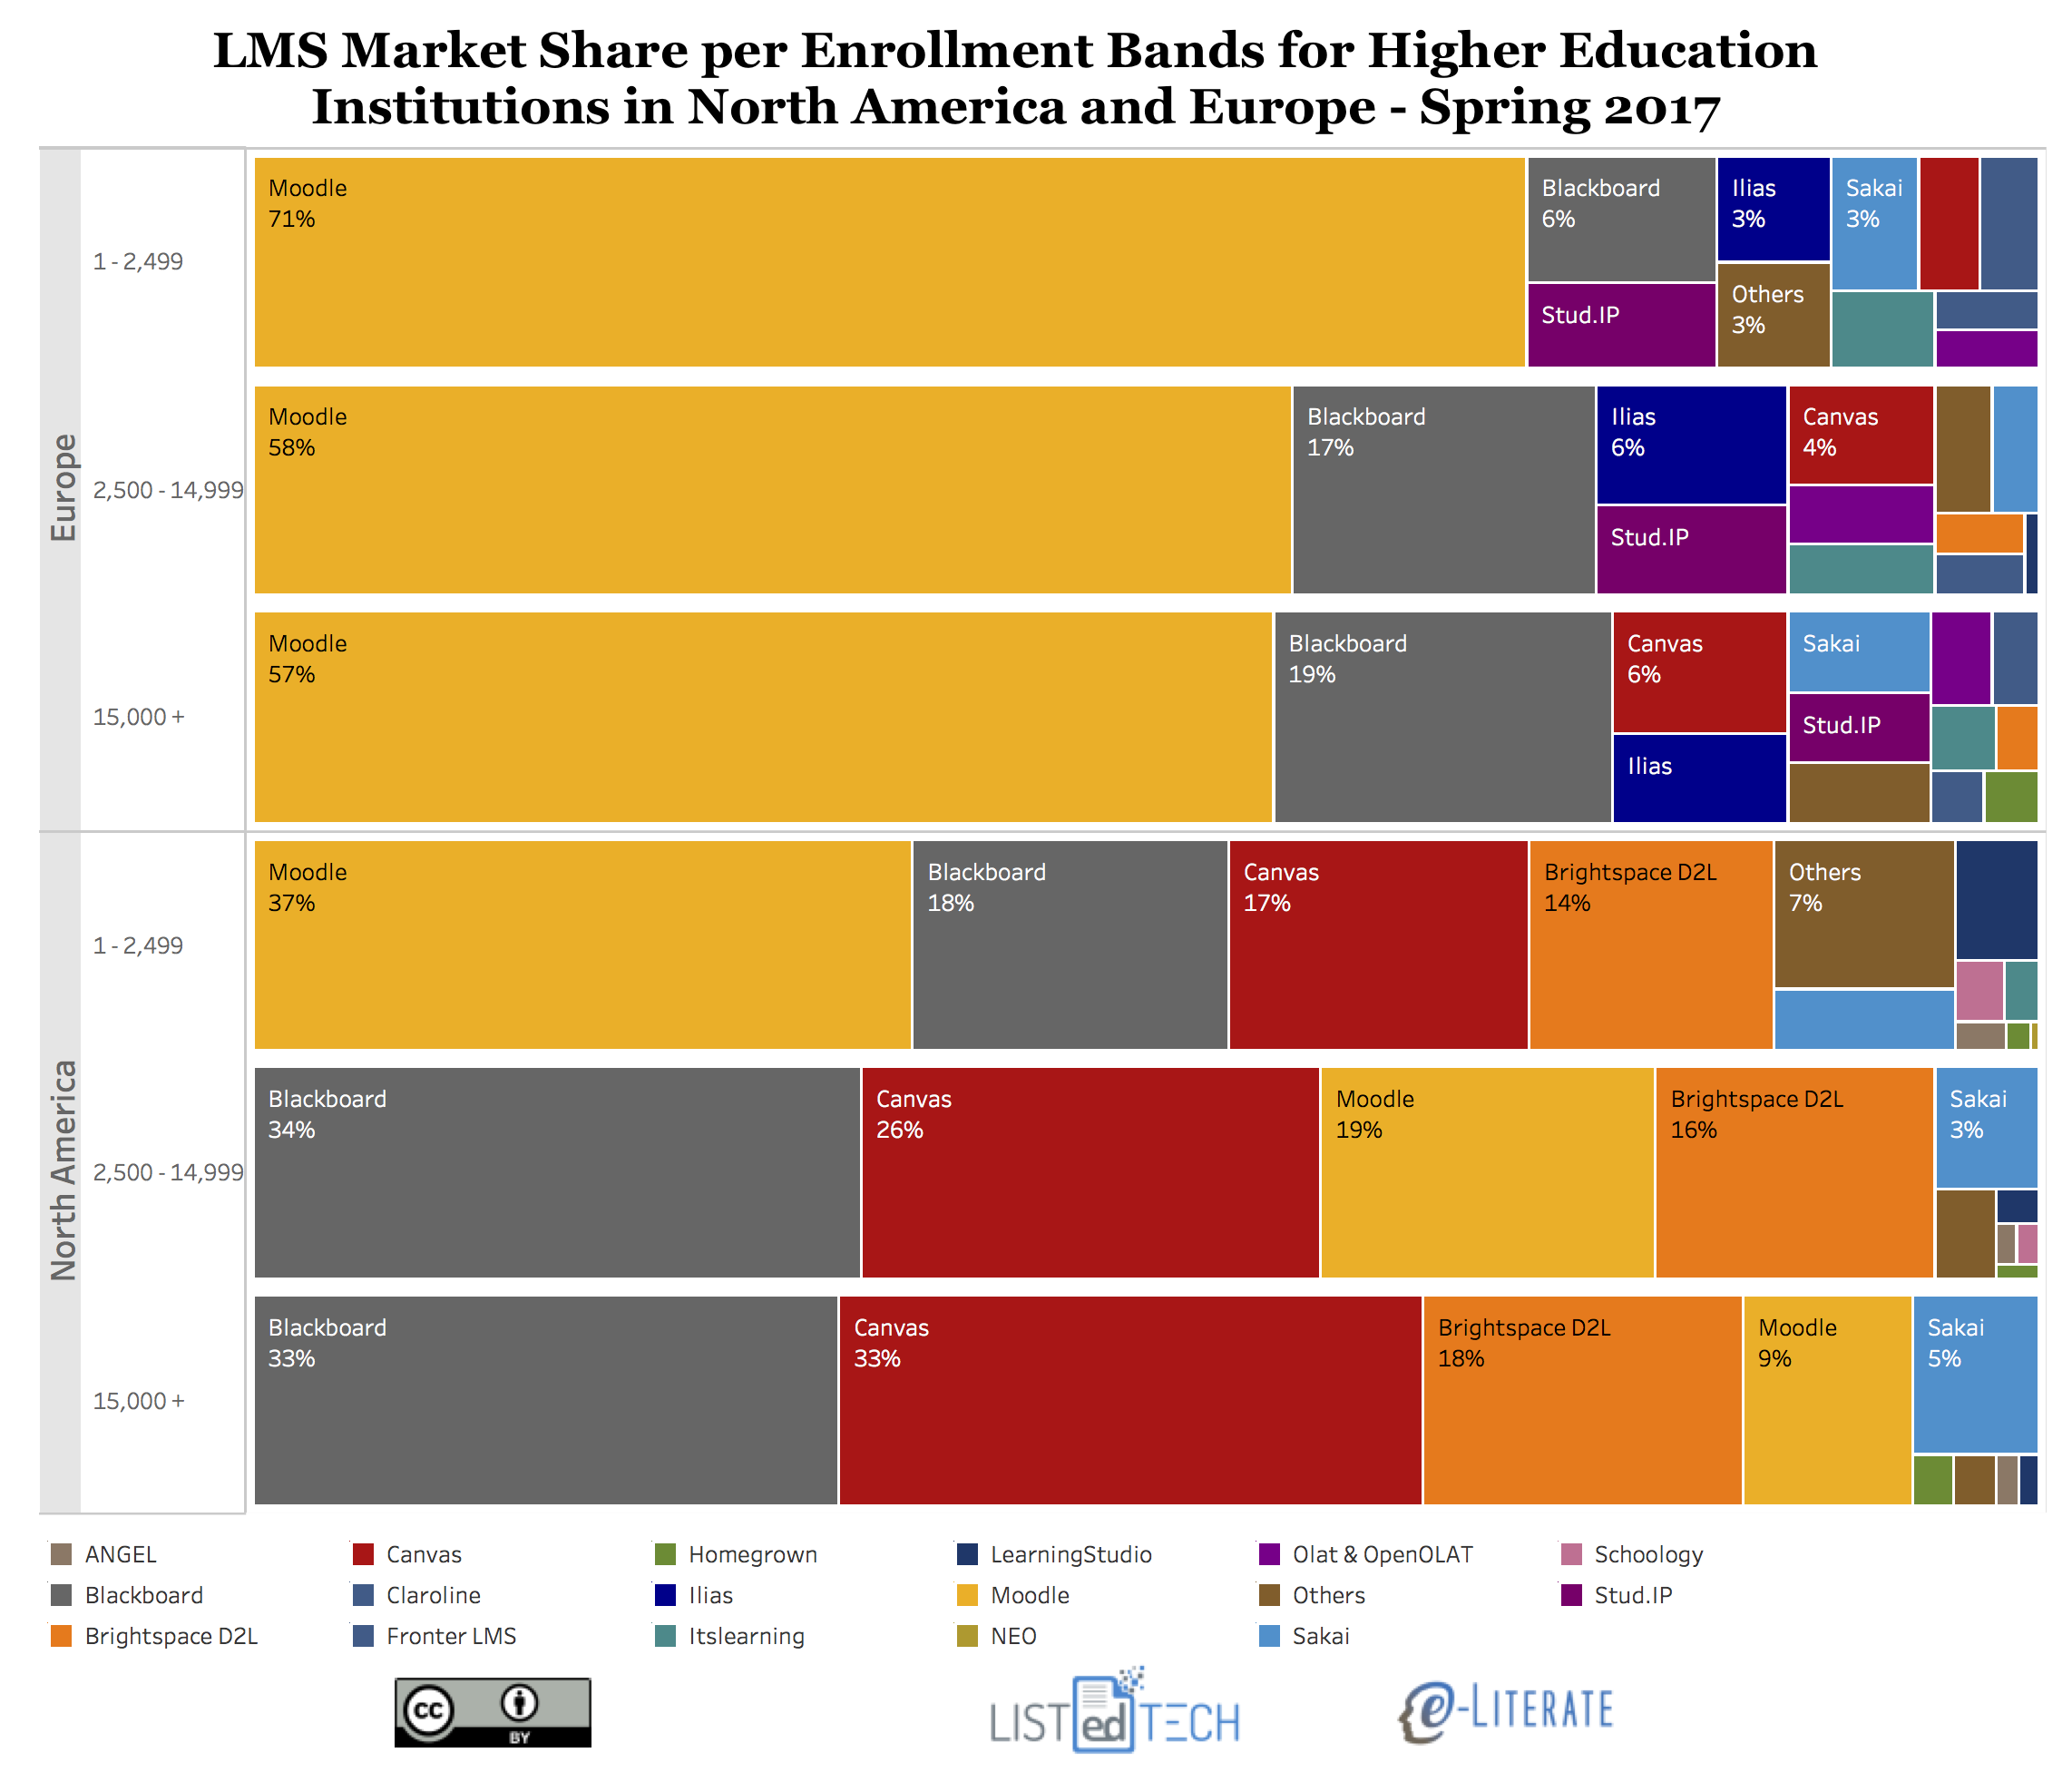
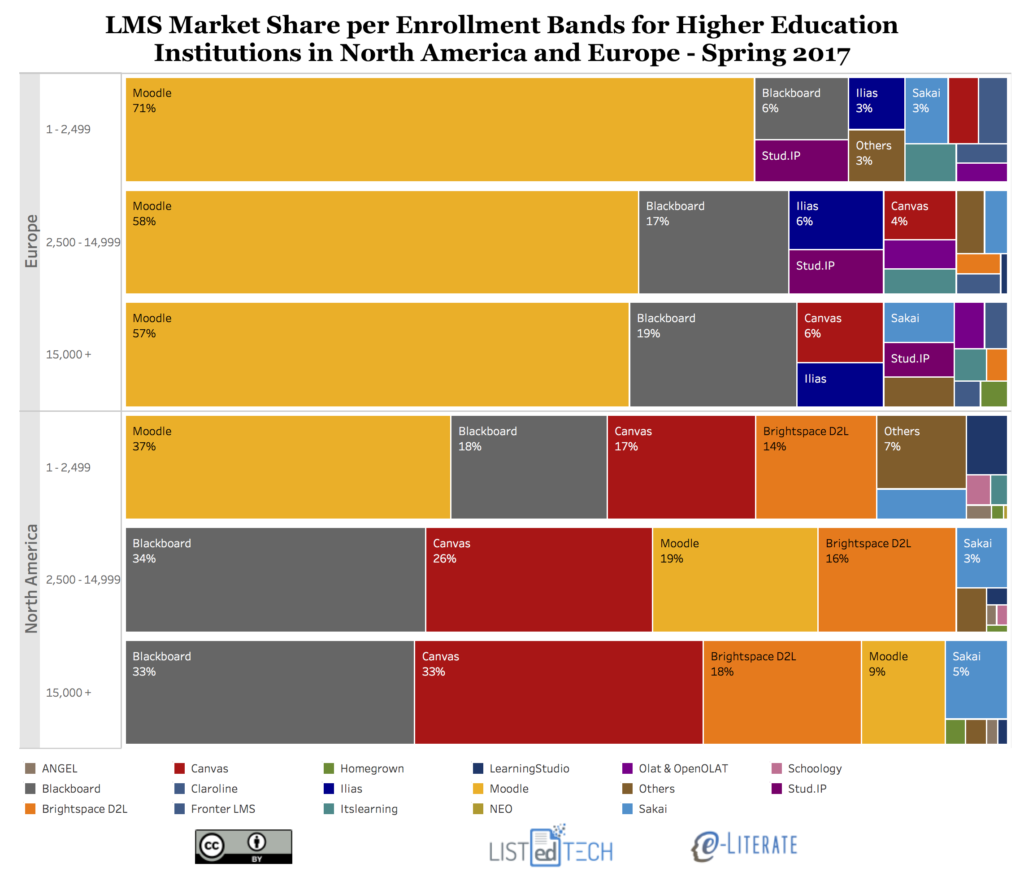
OK, OK – for our first view, we group all institutions into separate bands of total enrollment and show market share for each band for each region (North America and Europe). Percentage of institutions adopting each LMS within each enrollment band of Small (1 – 2,499), Medium (2,500 – 14,999) and Large (15,000+) enrollments. Update: Clarified language.
Some Notes:
- The LMS with the greatest enrollment variation is Moodle, particularly in North America. For small schools below 2,500 students, Moodle is #1 at 37%, but for medium schools it’s #3 at 19% and for large it’s #4 at 9%. A huge difference. In Europe, Moodle market share also inversely correlates with enrollment but to a far smaller degree (71%, 58%, 57%) and it is still #1 in all bands.
- Blackboard Learn and Canvas vary in North America the opposite direction – larger enrollment sizes equals larger market share – but not quite as dramatically as Moodle’s inverse relationship. Blackboard is #1 with roughly 33% market share for both large and medium institutions but is #2 with 18% for small institutions. Canvas goes from 33% for large to 26% for medium to 17% for small institutions. And note that Canvas and Blackboard Learn are virtually tied for first place for large institutions in North America.
- D2L Brightspace has the most even distribution, with 18% of large, 16% of medium, and 14% of small institutions. That’s interesting.
- In Europe, the overall distributions are more consistent with less variation between enrollment bands. While Moodle has smaller market share for larger enrollment bands, the general shape of the market does not change that much – just scaled a bit and with minor variations.
- In what might be a surprise given its roots in larger research universities, Sakai (like D2L) has a fairly even distribution and similar market share across small, medium and large institutional bands.
Coming soon – combining data not in enrollment bands but as scaled by each institution’s enrollment numbers.
Update: See second post here.