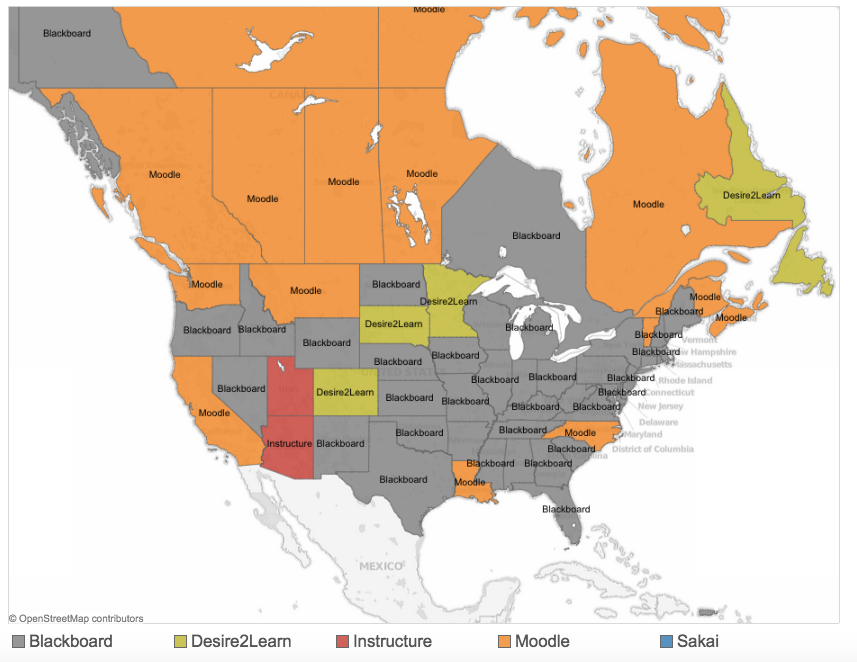
Last year I wrote about a relatively new site offering very interesting data and visualizations in the ed tech world. LISTedTECH was created by Justin Menard, who is Business Intelligence Senior Analyst at University of Ottawa. First of all, the site is broader in scope than just the LMS – there is a rich source of data & visualizations on MOOCs, university rankings, and IPEDS data. Most of the visualizations are presented by Tableau and therefore interactive in nature, allowing the user to filter data, zoom in on geographic data, etc. Since e-Literate is not set up for full-page visualizations, I have included screen shots below, but clicking on the image will take you to the appropriate LISTedTECH page.
Tag: tableau
-
Fall 2012 US Distance Education Enrollment: Now viewable by each state
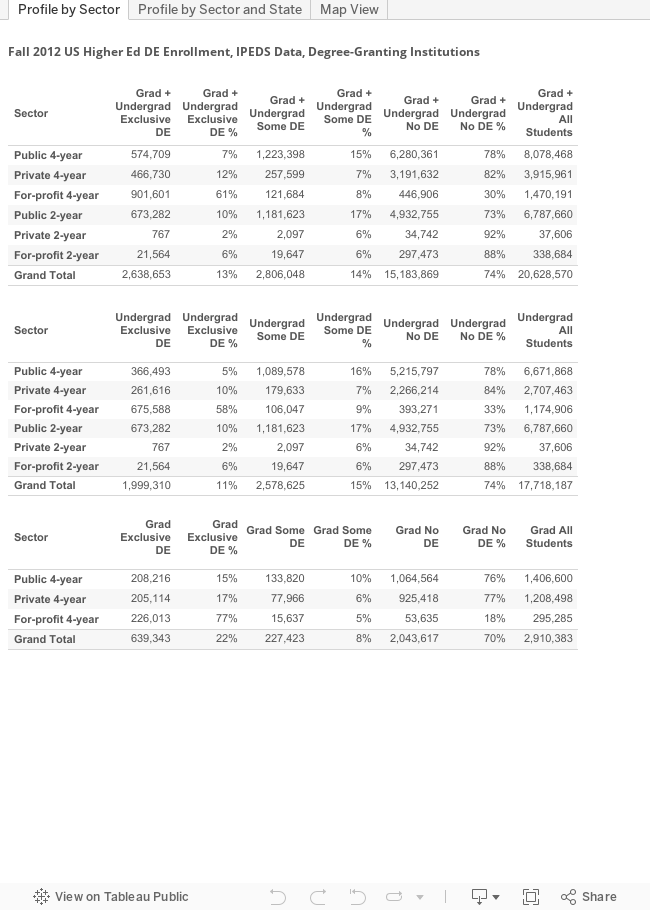
Starting in late 2013, the National Center for Educational Statistics (NCES) and its Integrated Postsecondary Education Data System (IPEDS) started providing preliminary data for the Fall 2012 term that for the first time includes online education. Using Tableau (thanks to Justin Menard for prompting me to use this), we can now see a profile of online education in the US for degree-granting colleges and university, broken out by sector and for each state.
Please note the following:
- For the most part distance education and online education terms are interchangeable, but they are not equivalent as DE can include courses delivered by a medium other than the Internet (e.g. correspondence course).
- There are three tabs below – the first shows totals for the US by sector and by level (grad, undergrad); the second also shows the data for each state (this is new); the third shows a map view.