
e-Literate

Present is Prologue

Tag: WebCT

  • LearningStudio and OpenClass End-Of-Life: Pearson is getting out of LMS market

    Pearson has notified customers that LearningStudio will be shut down as a standalone LMS over the next 2-3 years. Created from the Pearson acquisition of both eCollege and Fronter, LearningStudio has been targeted primarily at fully-online programs and associated hybrid programs – not for simple augmentation of face-to-face classes. The customer base has mostly included for-profit institutions as well as not-for-profit programs that are often packaged with an online service prover model (e.g. Embanet customers). As of this year, LearningStudio has approximately 110 customers with 1.2 million unique student enrollments.

    This decision is not one isolated to LearningStudio, as the end-of-life notification caps a series of moves by Pearson to get out of the LMS market in general. (more…)
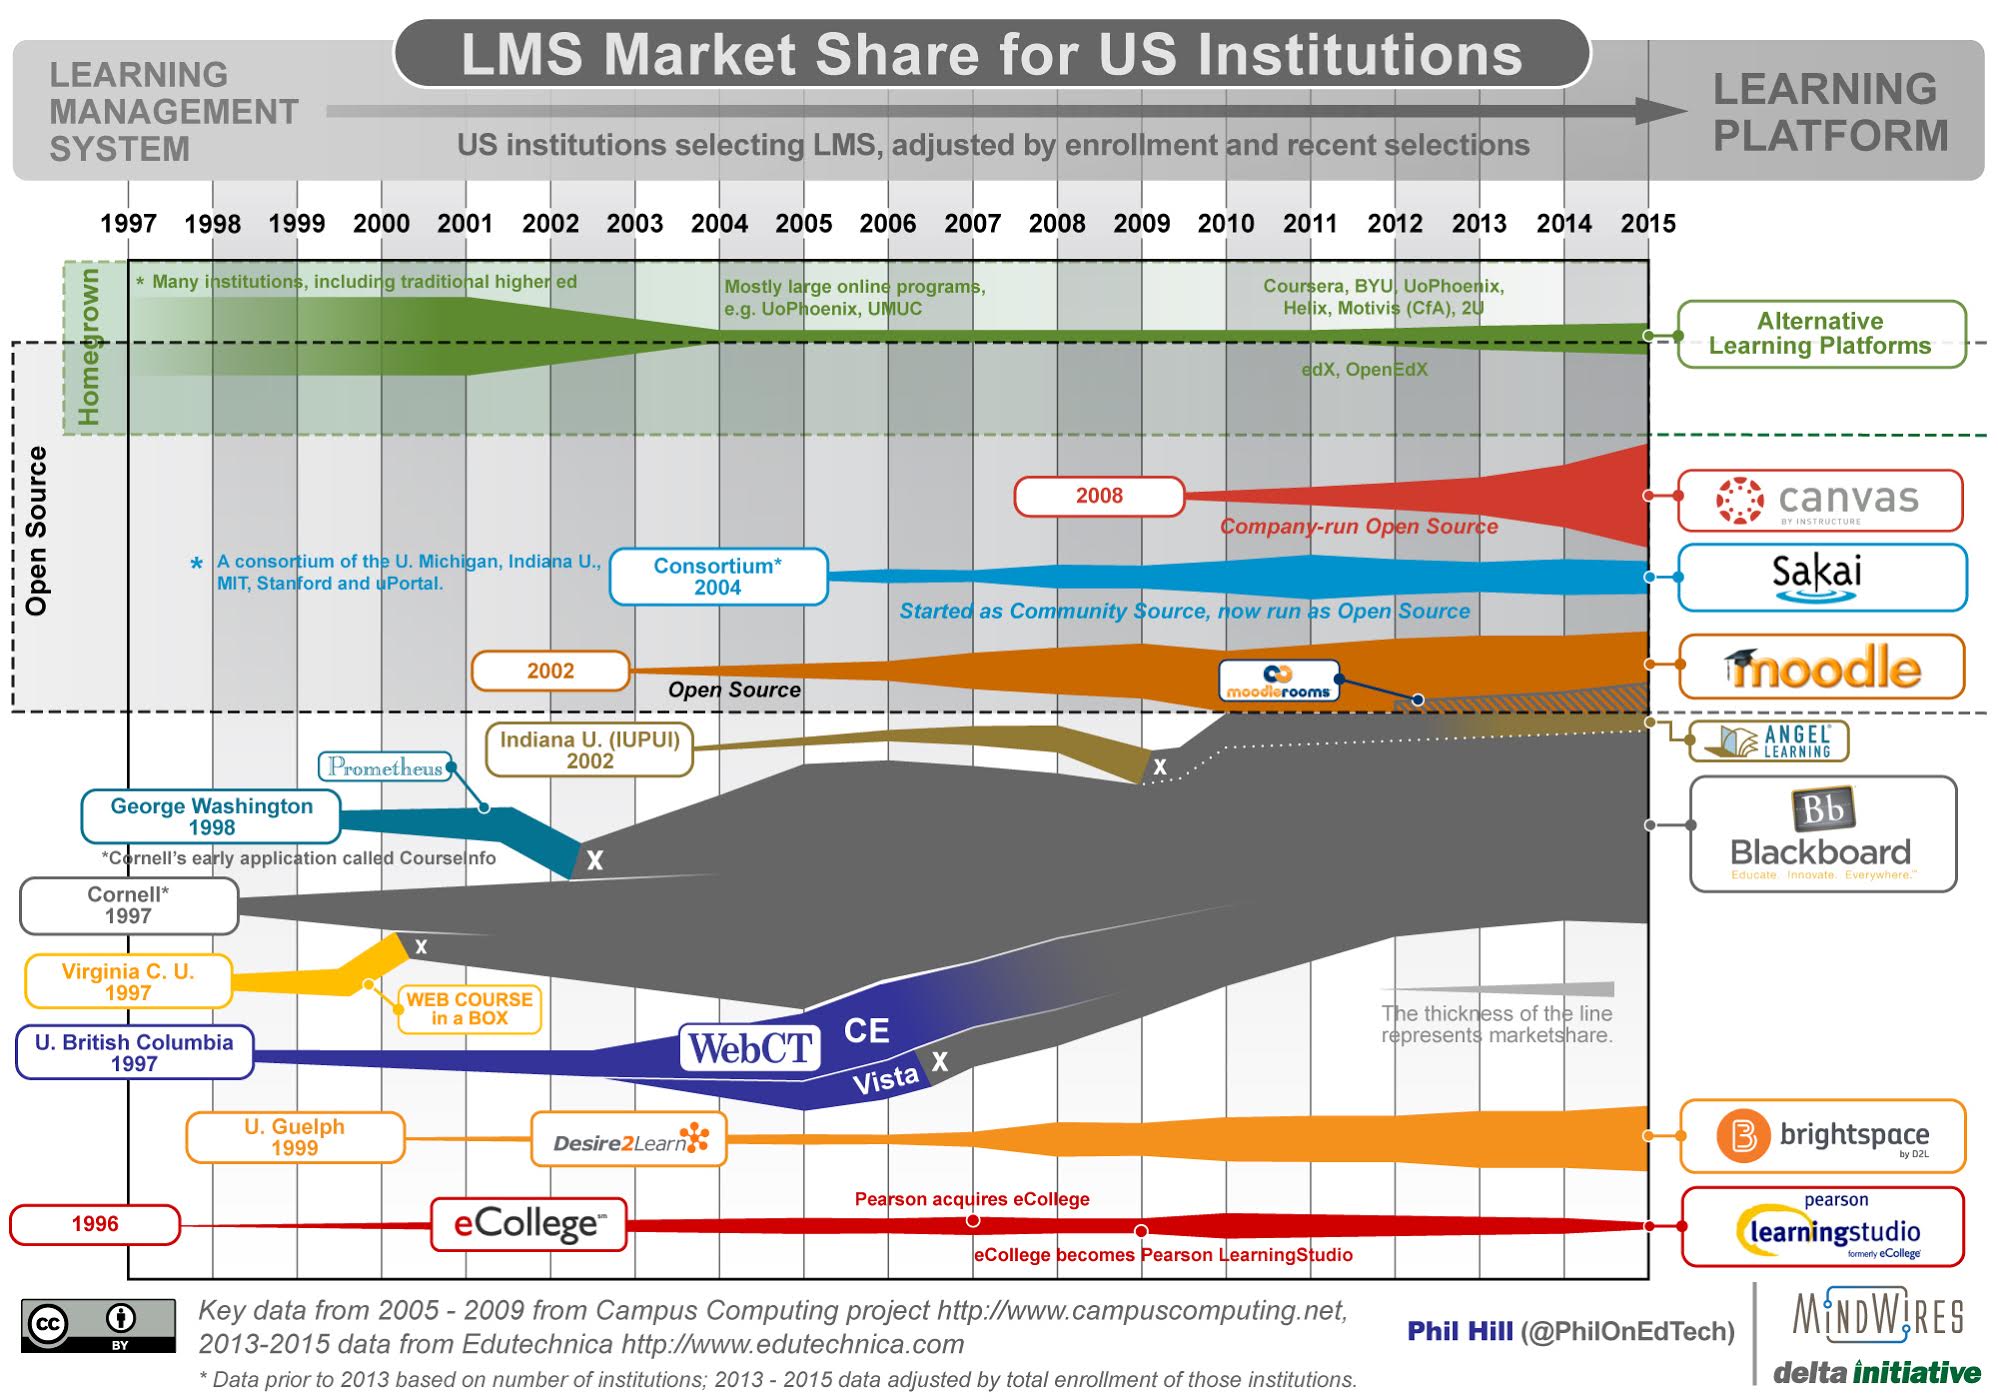
  • State of the US Higher Education LMS Market: 2015 Edition

    I shared the most recent graphic summarizing the LMS market in October 2014, and thanks to revised data sources it’s time for an update. As with all previous versions, the 2005 – 2009 data points are based on the Campus Computing Project, and therefore is based on US adoption from non-profit institutions. This set of longitudinal data provides an anchor for the summary.

    The primary data source for 2013 – 2015 is Edutechnica, which not only does a more direct measurement of a larger number of schools (viewing all schools in IPEDS database with more than 700 FTE enrollments), but it also allows scaling based on enrollment per institution. This means that the latter years now more accurately represent how many students use a particular LMS. This post at Edutechnica provides the most recent data for Fall 2015.

    A few items to note:

    • The most important recent feature of the market – the rapid rise of Canvas, surpassing D2L and quickly closing in on Moodle – is quite visible now.
    • Blackboard Learn appears to have stopped its well-documented losses in US higher ed and has even risen in the past year. Its market share is far smaller than at its 2009 peak, but the company is no longer losing large numbers of clients each year.
    • D2L, Sakai, and Moodle have risen ever so slightly, but in effect have hit a plateau.
    • ANGEL and eCollege have lost market share.
    • There is a growing area of “Alternative Learning Platforms” that includes OpenEdX, 2U, Helix and Motivis (the newly commercialized learning platform from College for America).
    • While the data is more solid than 2012 and prior years, keep in mind that you should treat the graphic as telling a story of the market rather than being a chart of exact data.
    • Update (10/16): Removed “Curtin University as origin of Moodle based on Martin’s comments. Mea culpa – should have caught this earlier.
    • Update (10/23): Changed graphic title to refer to US and not North America.

    LMS_MarketShare_20151023

  • Instructure Is Truly Anomalous

    Phil started his last post with the following:

    I’m not sure which is more surprising – Instructure’s continued growth with no major hiccups or their competitors’ inability after a half-decade to understand and accept what is at its core a very simple strategy.

    Personally, I vote for Door #1. As surprising as the competition’s seeming sense of denial is, Instructure’s performance is truly shocking. After five years, I continue to be surprised by it. It’s not just how well they are executing. It’s that they seem to defy the laws of physics in the LMS market. We had no reason to believe that any LMS company could rack up the numbers they are showing—in several different areas—no matter how well they execute.

    (more…)

  • State of the US Higher Education LMS Market: 2014 Edition

    I shared the most recent graphic summarizing the LMS market in November 2013, and thanks to new data sources it’s time for an update. As with all previous versions, the 2005 – 2009 data points are based on the Campus Computing Project, and therefore is based on US adoption from non-profit institutions. This set of longitudinal data provides an anchor for the summary.

    The primary data source for 2013 – 2014 is Edutechnica, which not only does a more direct measurement of a larger number of schools (viewing all schools in IPEDS database with more than 800 FTE enrollments), but it also allows scaling based on enrollment per institution. This means that the latter years now more accurately represent how many students use a particular LMS.

    A few items to note:

    • Despite the addition of the new data source and its inclusion of enrollment measures, the basic shape and story of the graphic have not changed. My confidence has gone up in the past few years, but the heuristics were not far off.
    • The 2013 inclusion of Anglosphere (US, UK, Canada, Australia) numbers caused more confusion and questions than clarity, so this version goes back to being US only.
    • The Desire2Learn branding has been changed to Brightspace by D2L.
    • The eCollege branding has been changed to Pearson LearningStudio.
    • There is a growing area of “Alternative Learning Platforms” that includes University of Phoenix, Coursera, edX and OpenEdX, 2U, Helix and Motivis (the newly commercialized learning platform from College for America).
    • While the data is more solid than 2012 and prior years, keep in mind that you should treat the graphic as telling a story of the market rather than being a chart of exact data.

    LMS_MarketShare_20141107

    Some observations of the new data taken from the post on Edutechnica from September:

    • Blackboard’s BbLearn and ANGEL continue to lose market share in US -[1] Using the 2013 to 2014 tables (> 2000 enrollments), BbLearn has dropped from 848 to 817 institutions and ANGEL has dropped from 162 to 123. Using the revised methodology, Blackboard market share for > 800 enrollments now stands at 33.5% of institutions and 43.5% of total enrollments.
    • Moodle, D2L, and Sakai have no changes in US – Using the 2013 to 2014 tables (> 2000 enrollments), D2L has added only 2 schools, Moodle none, and Sakai 2 schools.
    • Canvas is the fasted growing LMS and has overtaken D2L – Using the 2013 to 2014 tables (> 2000 enrollments), Canvas grew ~40% in one year (from 166 to 232 institutions). For the first time, Canvas appears to have have larger US market share than D2L (13.7% to 12.2% of total enrollments using table above).
  • ANGEL LMS: Dead or Alive?

    After the recent news of two significant ANGEL LMS customers leaving for other vendors – Washington State Board of Community and Technical Colleges selected Instructure’s Canvas LMS in the spring, and Michigan State University selected Desire2Learn’s Learning Suite in the summer – there is an interesting question of whether ANGEL is still a viable LMS solution, at least for current clients.

    ANGEL was created at Indiana University Purdue University Indianapolis in 2000, and after a successful 9 years Angel Learning, the company behind ANGEL, was purchased by Blackboard in May 2009. Shortly after the purchase, Blackboard announced they would place ANGEL in end-of-life status by 2014. This decision to end ANGEL, along with a similar decision for WebCT product lines, has been fueling a large percentage of the LMS market churn over the past 2 – 3 years (more from WebCT than from ANGEL, however).

    In March 2012 Blackboard changed their strategy – no longer pushing all new “acquired” customers to migrate to the Learn 9.x platform, and instead looking to support multiple LMS solutions. The least discussed part of the March announcements was the decision to cancel the end-of-life notice for ANGEL. As described in an open letter to the community from Blackboard:

    (more…)

  • The Evolving LMS Market, Part II

    I have gotten a lot of very nice compliments in the last 24 hours about the first post in this two-part series. I do want to emphasize that a huge portion of the value in that post comes from the great survey work that Casey Green does. All I did was tease out a few implications and make a few new graphs (which, I admit, were very pretty). If you want to see analysis like this continue in future years, then support the Campus Computing Project.

    In this next part, we’re going to go “off-road” a little and see what we can figure out in areas where we don’t have quantitative data that is as solid as Casey’s. As I wrote in the previous post in this series, there are roughly 875 WebCT and ANGEL customers who will have to migrate to a new LMS in the next few years, in an environment of strong budget pressures. This creates an atmosphere in which more and different schools may be in play than has typically been the case. But evaluating options and choosing to move are two different things. What happens in the next few years is likely to shape the LMS landscape for years to come, at least in North America.

    Let’s see if we can read the tea leaves.

    (more…)

  • The Evolving LMS Market, Part I

    As Casey Green said in my recent interview with him, the LMS space is a “market in transition.” In 2005, the year that Blackboard acquired WebCT, the two platforms had a combined total of 75.6% U.S. higher education market share, and the next closest competitor had barely cracked 2% market share. Today, the situation is substantially different and changing rapidly. But the narratives around exactly what’s happening tend to be off. Typically, I hear the frame as being a contest between Blackboard and “open source.” Has “open source” (by which we mean Moodle and Sakai, the two open source LMSs with significant market share in the United States) made inroads into the market?  If you read what the majority of sell-side financial analysts ((Sell-side analysts are financial analysts who work for major brokerage houses and provide stock analysis to retail investors. Comments by analysts that you read in business news articles are typically from sell-side analysts.)) are writing, you may see the claim that “open source” is not putting a major dent in Blackboard. If you talk to Moodle or Sakai advocates, you might hear that they are crushing the company in sales. Neither account is really capturing what’s happening in the market, so I’m going to try to explain what we know about what’s really going on in a two-part series. In this post, I’ll talk about what the data are telling us so far about the recent shifts in the market, describe how colleges and universities come to decide that they need to go to market for an LMS, and assess the degree to which we may see an uptick in the number of schools that decide to look around and evaluate their options. In the second post, I’ll describe how the next four years of market transition may be different than the previous four and what signs we should be watching for to see which way the market is going to break.

    (more…)