e-Literate

Present is Prologue

Author: Phil Hill

  • Insight into Community College Students and Challenges of Online Education

    Insight into Community College Students and Challenges of Online Education

    Inside Higher Ed reported today on a new survey report on community colleges and challenges that students face.

    Most community colleges are aware of the challenges students face if they are working, raising children or struggling to afford textbooks. But a newly released survey digs into the nuances of those challenges so colleges can pinpoint ways to lift barriers to college completion and prevent students from dropping out.

    Researchers at North Carolina State University designed and encouraged students to participate in the Revealing Institutional Strengths and Challenges survey. The survey found that working and paying for expenses were the top two challenges community college students said impeded their academic success. The researchers surveyed nearly 6,000 two-year college students from 10 community colleges in California, Michigan, Nebraska, North Carolina, South Dakota, Texas, Virginia, Wisconsin and Wyoming in fall 2017 and 2018.

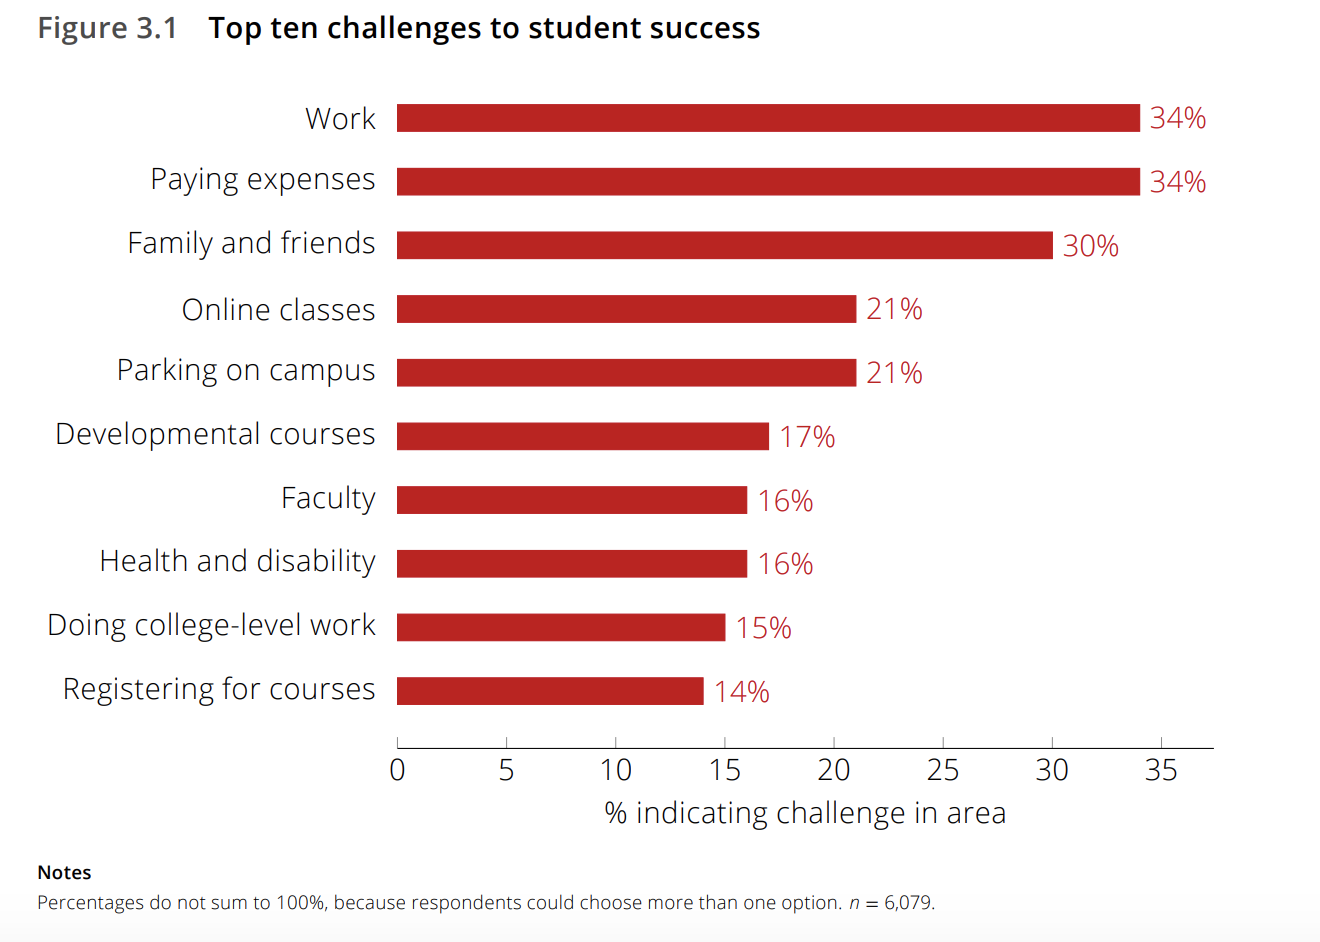
    Of the top ten challenges listed, the category of online classes was tied for fourth along with parking in an ironic twist as lack of physical facilities is one of the drivers for the growth in online education. Interestingly for parking, it is not the costs. 86% of those listing parking stated it was “difficulty finding parking on or near campus” and only 10% listed parking as too expensive.

    Top Ten challenges for community college students

    The value of this survey, as described at IHE in interviews with the report authors, is in the nuance that can guide institutional planning.

    [Report authors] Umbach and Steve Porter, also a professor of higher education at the university, said they noticed a dearth of surveys that asked students about the barriers they face to completing college and wanted to provide a tool that colleges could use to eliminate those barriers and boost graduation rates.

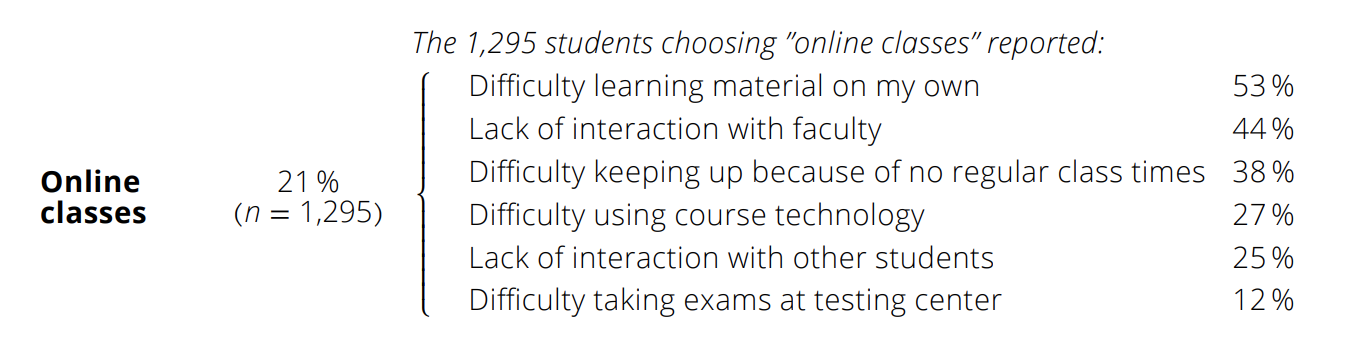
    On the topic of online education as a barrier, one view of the results could be that only one out of five students have a problem with these classes, which is not problematic as we have long known that online is not for everyone. On the other hand, the nuance provided should give institutions some insight into how they can improve their services to students.

    Reasons for online classes as a challenge

    The big issue that I’ve seen in the field is not whether a school should offer online classes – in so many cases this is the only way for students to have access to degrees – but how well-designed the courses are and how much support is provided outside of the course. Throwing courses online with no real interaction or adequate support is a recipe for disaster here, as I described in one case last year. But the school in that example is not alone in this regard. In the many cases where community colleges make these mistakes, students should have difficulty learning and the 21% number should be problematic.

    But on the opposite side, when colleges focus on improving course design and extend meaningful support services, student outcomes improve dramatically. Consider the California Community College system and their improved outcomes, where their most recent distance education report shows system-wide closing of the achievement gap between face-to-face and online students. Online education can work for community college students and is an important part of student access, but there are no silver bullets.

    I was quoted in the article about these challenges.

    Hill said the California Community College System’s Online Education Initiative, which he worked on as a consultant, is a good example of a well-designed online learning system. It helped close the gap between the rate of students successfully completing traditional courses and online classes from 17 percent in 2006 to 4 percent in 2016.

    To be clear, the California Community College System in general has been improving their provision and support of online courses for years, and OEI is not the only driver of this change.

    CCCS improvements in gap of online ed

    I don’t think the California Community College System is the only example of improvements in online education support, but I do think their focus on improving course design as well as improving advising and support structures is worth considering.

    The problem of ‘difficulty learning material on my own’  and ‘difficulty keeping up’ issues can only partially be addressed – online education is not for everyone – but more engaging and well-designed online courses can help, or at least reduce barriers. The mixing of synchronous elements of a course along with asynchronous can also play an important role.

    ‘Lack of interaction with faculty’, ‘lack of interaction with other students’, and ‘difficulty using course technology’, however, are issues that should be addressed by the institution as part of the course design and support services. It would be naive to think that these issues could be eliminated, but there is no excuse for schools to not have a coordinated effort to make improvements across all online courses.

    Online education can work, and community colleges can improve outcomes by addressing the challenges students face.

    While this post focuses on the online education angle, the whole report is worth reading. The insights into issues outside the classroom, particularly for students trying to balance work and family commitments with their education, should provide valuable input into institutional- and system-level planning.

  • State of Higher Ed LMS Market for US and Canada: 2018 Year-End Edition

    State of Higher Ed LMS Market for US and Canada: 2018 Year-End Edition

    This is the eleventh year I have shared the LMS market share graphic, commonly known as the squid graphic, for US and Canadian higher education. This past year we at e-Literate shifted our LMS Market Analysis reports from Spring / Fall to Mid-Year / End-of-Year to better allow analysis of entire years. With the release of our end-of-2018 report last week to subscribers, it’s time for us to look at updates on the institutional LMS market for North America (US and Canada) higher education. Note that our coverage for the market analysis includes Europe, Latin America, Oceania (Australia, New Zealand, and surrounding island countries) as well as emerging coverage of the Middle East.

    We present the following data “by institutions”, with market share as a percentage of the total number of institutions using each LMS as a primary system, and “by enrollments”, where we scale the institutions by its total enrollment. The latter better captures the business of the LMS market, since most licensing deals are based the number of students.

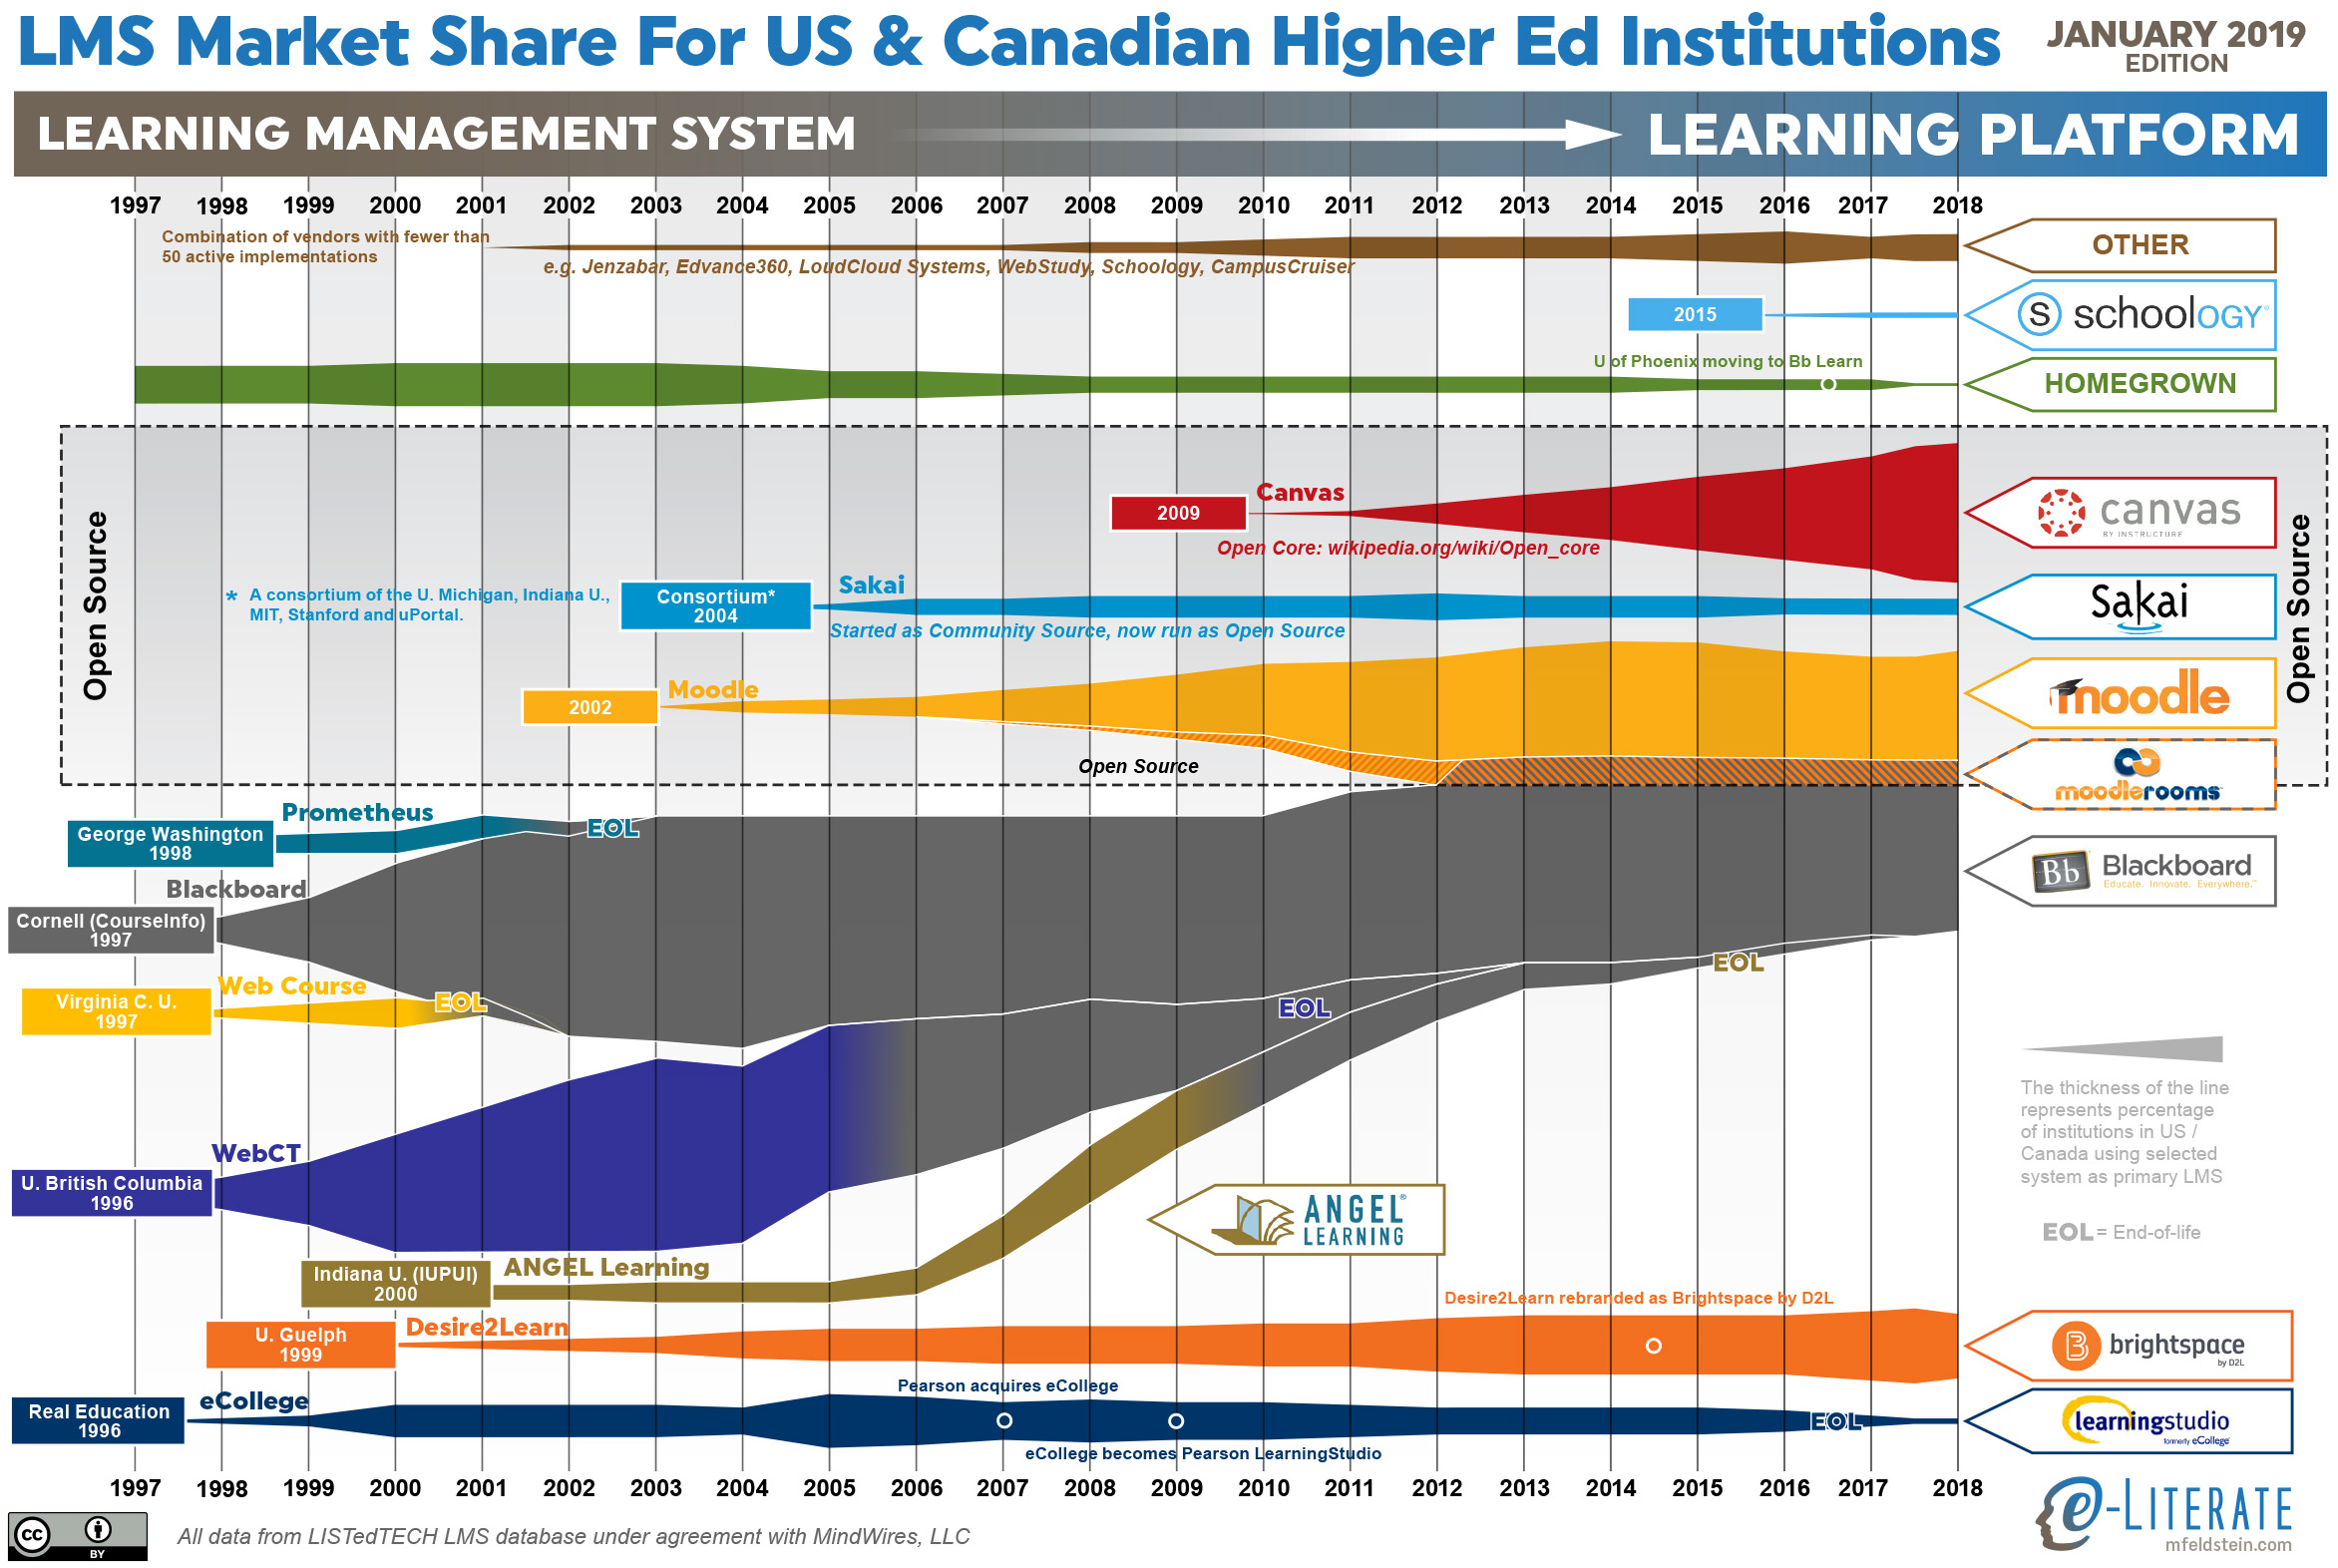
    But first, let’s look at an updated LMS market share graphic, commonly known as the squid graphic, for US and Canadian higher education. The original idea remains – to give a picture of the LMS market in one page, highlighting the story of the market over time. The key to the graphic is that the width of each band represents the percentage of institutions using a particular LMS as its primary system.

    Higher ed LMS market share for US and Canada, January 2019

    This year there are two inter-related trends that deserve a broader explanation -the LMS market slowed down with less activity overall, and Canvas and Blackboard continue to be neck-and-neck in the top spot of this market.

    We recently described the overall market activity slowdown in that there are fewer LMS formal evaluations taking place since mid 2018, with initial data pointing to a 20 – 25% drop from a year earlier. This slowdown seems to be a type of plateau rather than a continuing trend, and we are watching to see if it is temporary or not.

    Last summer we shared the symbolic passing of the torch where Canvas surpassed Blackboard in US market share, which was the first time Blackboard was not the top system since the market emerged two decades ago. What is interesting is that half a year later, the two systems are still neck-and-neck. In the US Canvas is still slightly ahead, and in North America (adding in Canada), Blackboard remains in the top spot by 0.4% (26.8% to 26.4%). Why is Canvas not continuing to extend its lead? Looking at the underlying data, there seems to be three reasons to consider:

    • The overall market slowdown means that there are fewer deals for Canvas to win lately.
    • Blackboard continues its University of Phoenix implementation, which still includes dozens of campuses despite its enrollment drop.
    • The shutdown in December of the for-profit Education Corporation of America (Virginia College and Brightwood College systems) meant that Canvas lost several dozen campuses.

    The latter two points should fully play out in the next three months, possibly making this a one-time change in trends, but it is important to call this situation out.

    Some other notes:

    • The market continues to consolidate around the Big Four – Blackboard, Canvas, D2L Brightspace, and Moodle.
    • The Homegrown option for LMS usage is going away, at least in a statistical sense. Only a handful of schools even consider this option.
    • D2L shares the challenge of having picked up several large for-profit systems that are closing campuses and therefore hurting market share. In D2L’s case, the biggest one is the former EDMC schools – the Art Institutes, Argosy University, and South University – that were sold out of bankruptcy to a non-profit entity and have closed dozens of campuses over the past year. These losses offset many of D2L’s wins in 2018.
    • Moodle had a few new wins in North America.

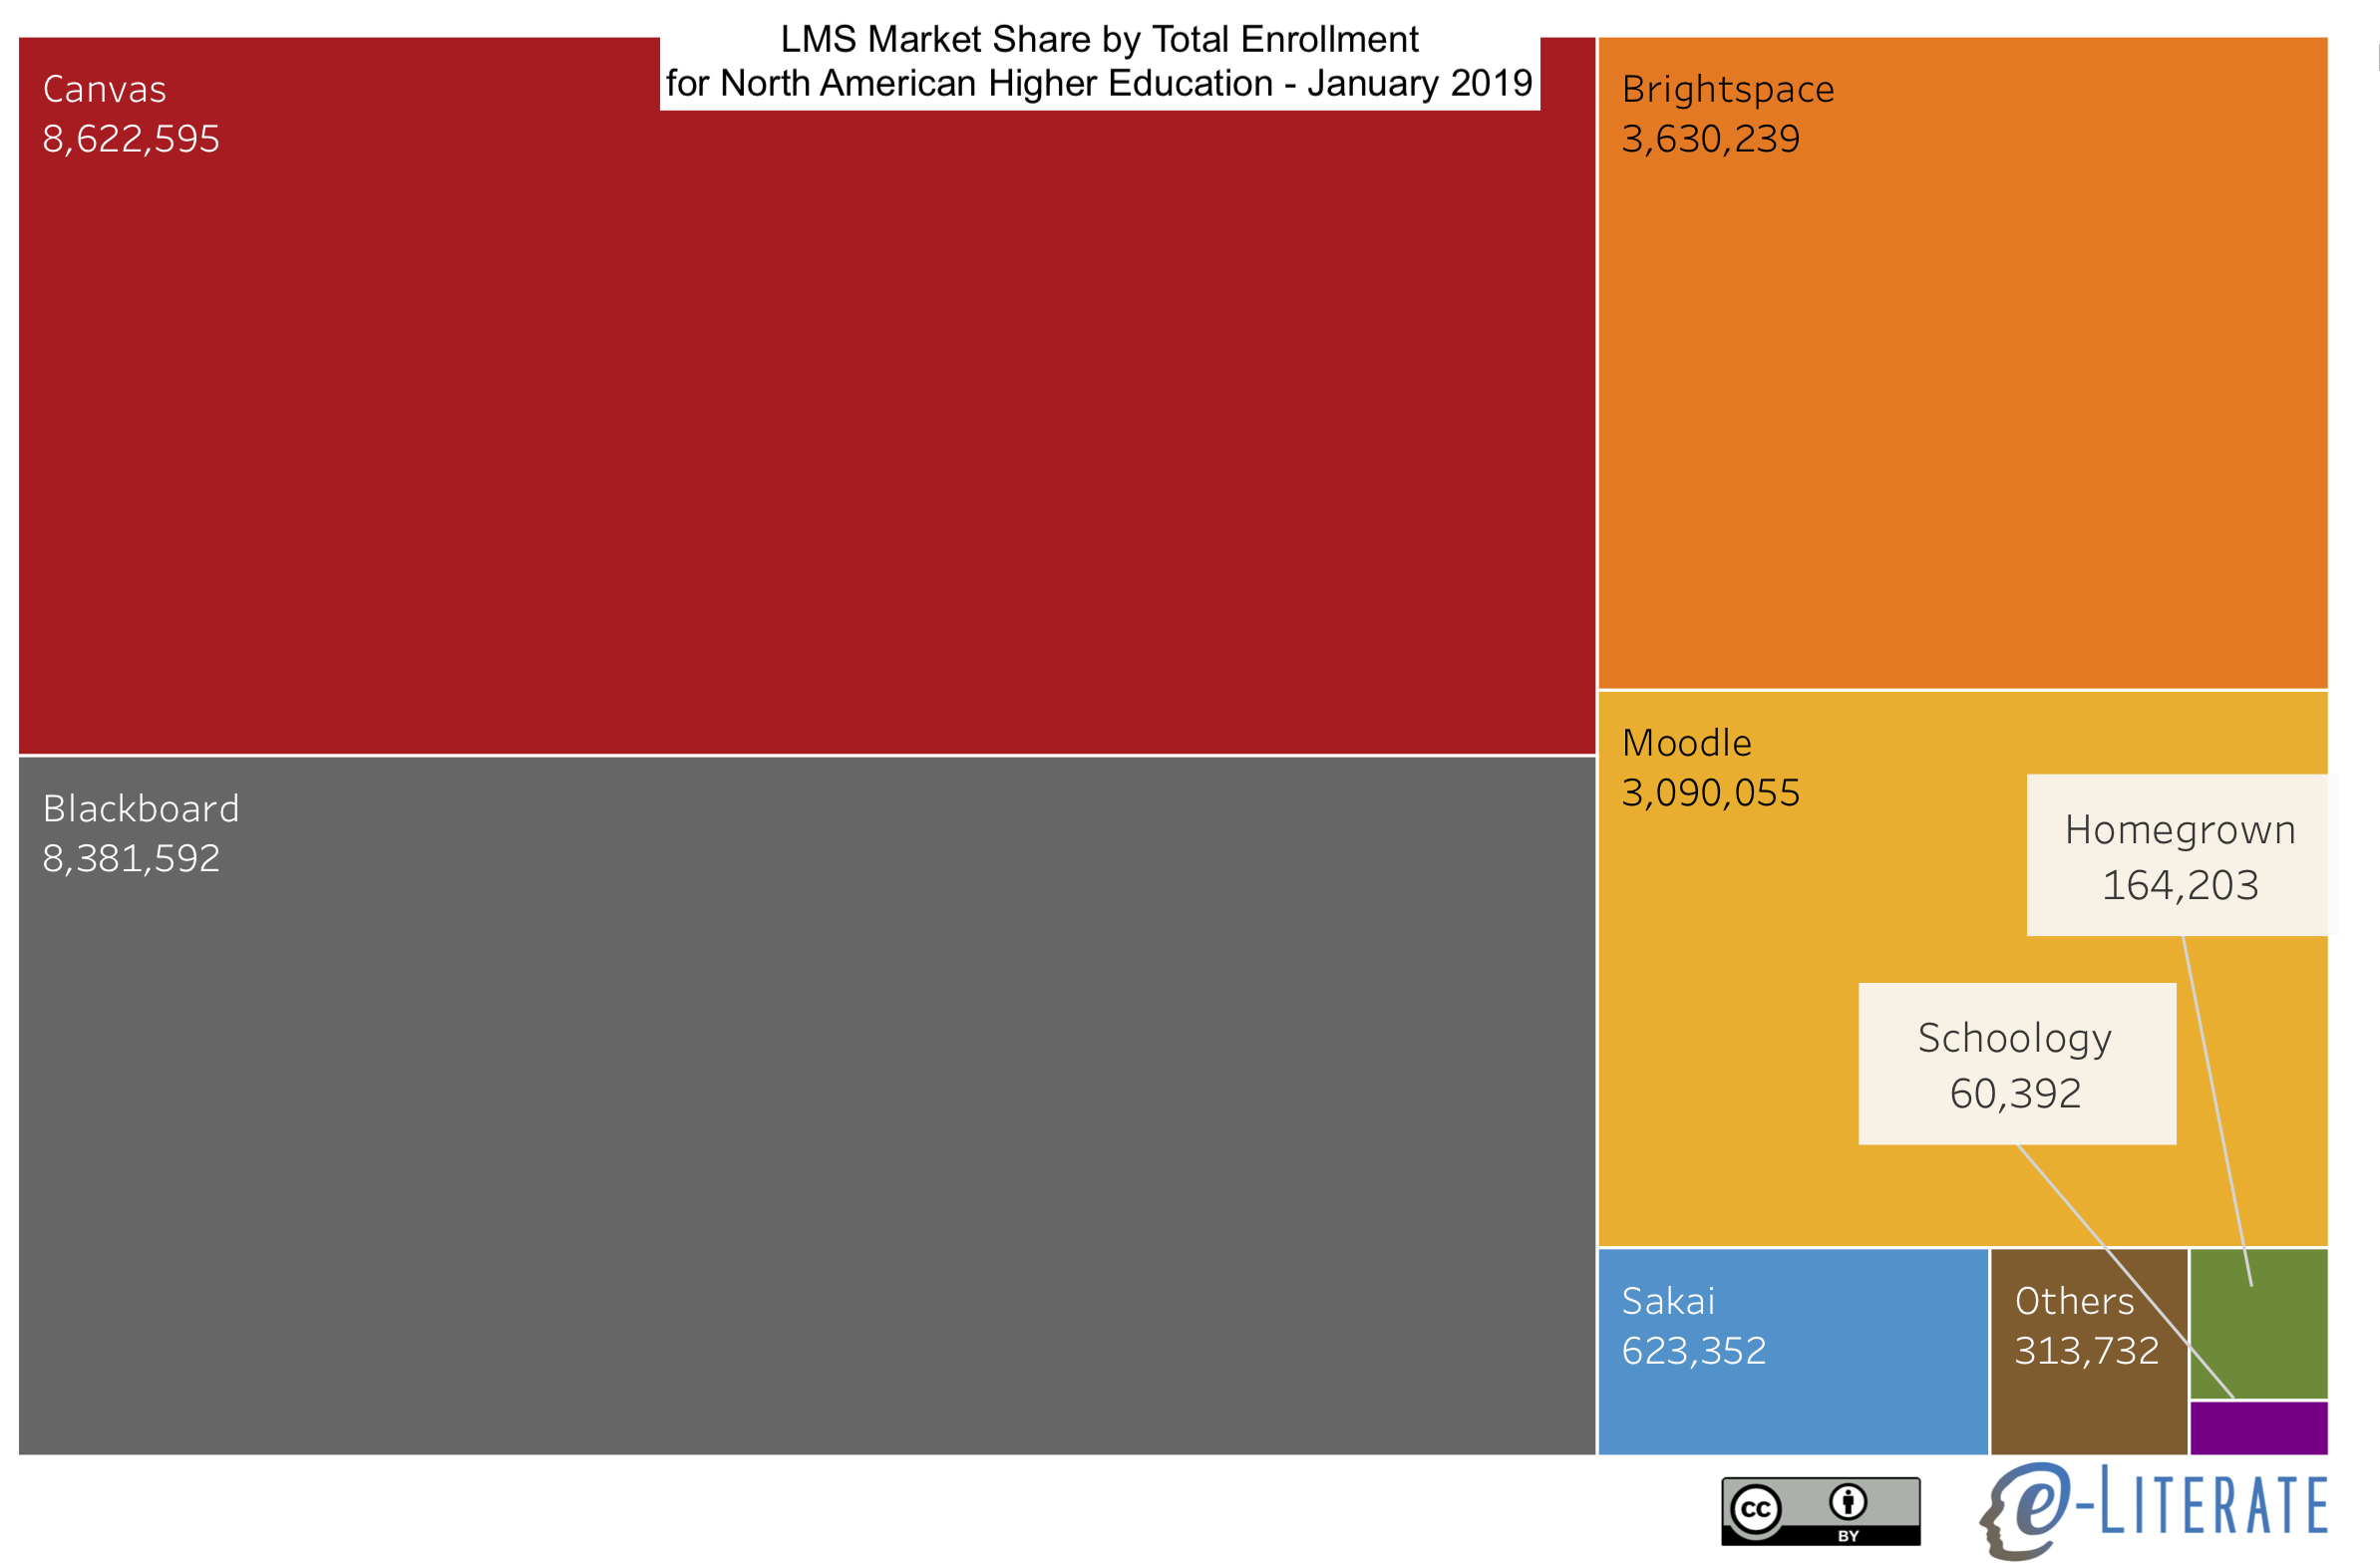
    Sticking with North America, we can also show LMS market share scaled by the enrollment of each institution, giving a different measure worth considering.

    NA LMS Market Share by Enrollment

    We’ll share more information on other global regions in the coming months.

  • Deeply Flawed GMU Report on Online Education Asks Good Questions But Provides Misguided Analysis

    Deeply Flawed GMU Report on Online Education Asks Good Questions But Provides Misguided Analysis

    Another year and another deeply flawed report about online education in US higher education, this time by Spiros Protopsaltis (associate professor and director of the Center for Education Policy and Evaluation at George Mason University, as well as former aide to Senate Democrats) and Sandy Baum (a fellow at the Urban Institute and professor emerita of economics at Skidmore College, as well as former advisor to Hillary Clinton’s presidential campaign). As Inside Higher Ed described the report, titled “Does Online Education Live Up to Its Promise? A Look at the Evidence and Implications for Federal Policy”:

    Online education has not lived up to its potential, according to a new report, which said fully online course work contributes to socioeconomic and racial achievement gaps while failing to be more affordable than traditional courses.

    The report aims to make a research-driven case discouraging federal policy makers from pulling back on consumer protections in the name of educational innovation.

    In many ways this report takes a similar approach to the report by Caroline Hoxby from Stanford University, which was subsequently withdrawn, in asking important questions but providing flawed analysis to support conclusions. But unlike the previous report, the GMU one documents its sources well with 165 end notes, and for the most part this new report describes the underlying analysis accurately. Where the major problems arise is in conflating online education in general with the for-profit sector and in drawing conclusions that are not supported by the evidence.

    The report is not easy to wade through, largely from its wide-ranging discussion of for-profits, online history, past federal policy, a snapshot of research on learning outcomes, and a discussion of current policy debates. Let’s take the primary conclusions and discuss the analysis provided.

    “Online education is the fastest-growing segment of higher education and its growth is overrepresented in the for-profit sector.”

    The report accurately describes the growth of online education, rising to point where one in three postsecondary students take at least one online course.
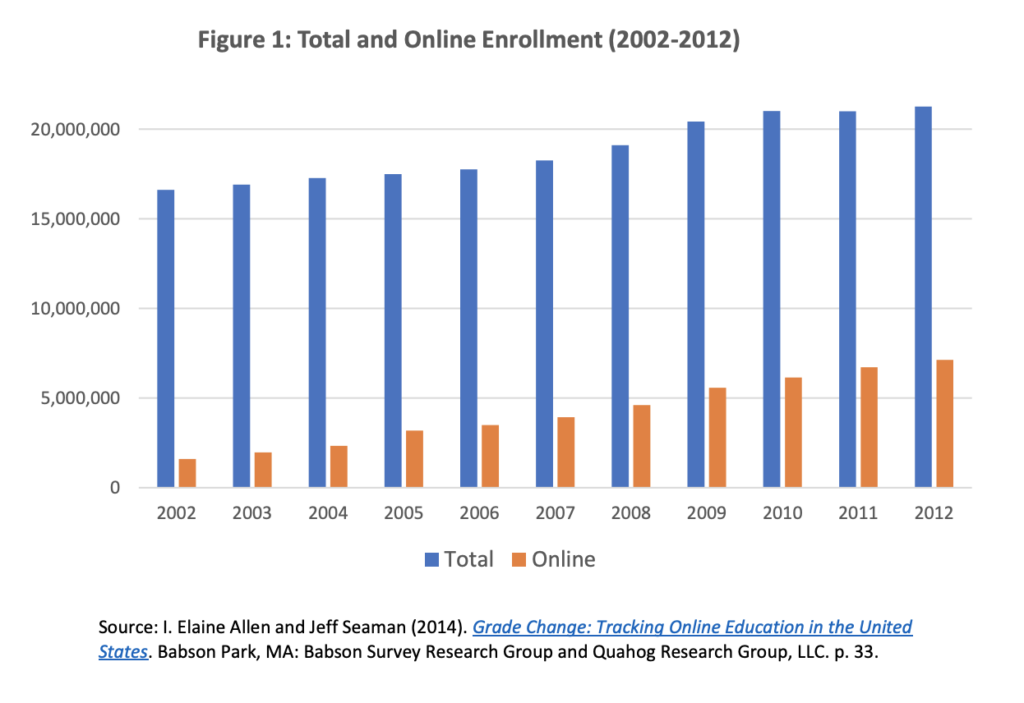
    Figure 1 online ed growth

    There is a disturbing tendency to describe this growth as “explosive” (mentioned five times in report) and an unexplained reliance in many cases on six year old data when new data exists. But the conclusion about growth is accurate.

    The phrasing “overrepresented in the for-profit sector” and “concentration in the for-profit sector” in describing online education is very misleading, however. It is true that for-profit schools have a larger percentage of their students studying fully online, but the topic of the report is online education in general, and for-profits represent a rapidly shrinking minority of this case. Never mentioned in the report is the most salient point about for-profits – the sector is in major decline. As documented by IPEDS:
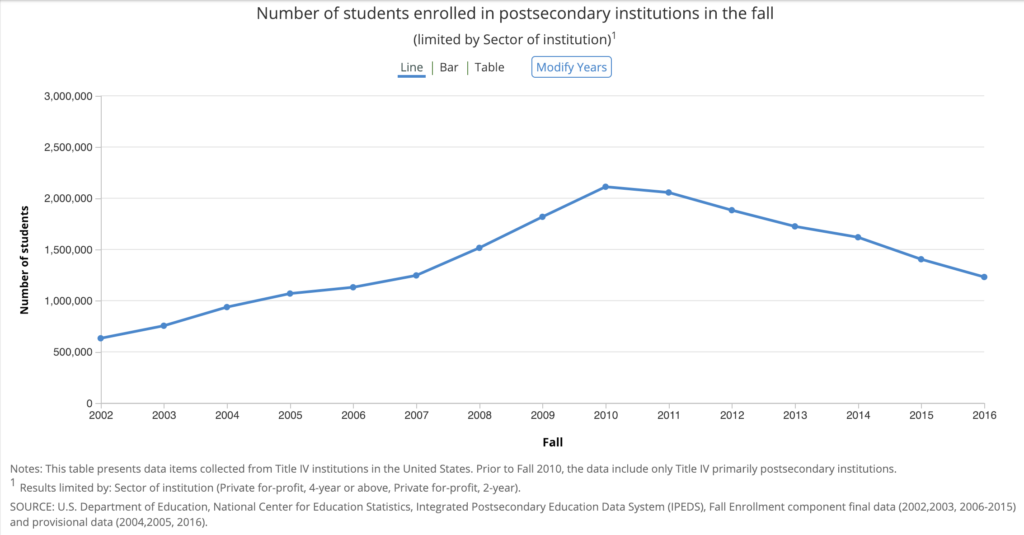
    For-profit enrollment trends 2002-2016

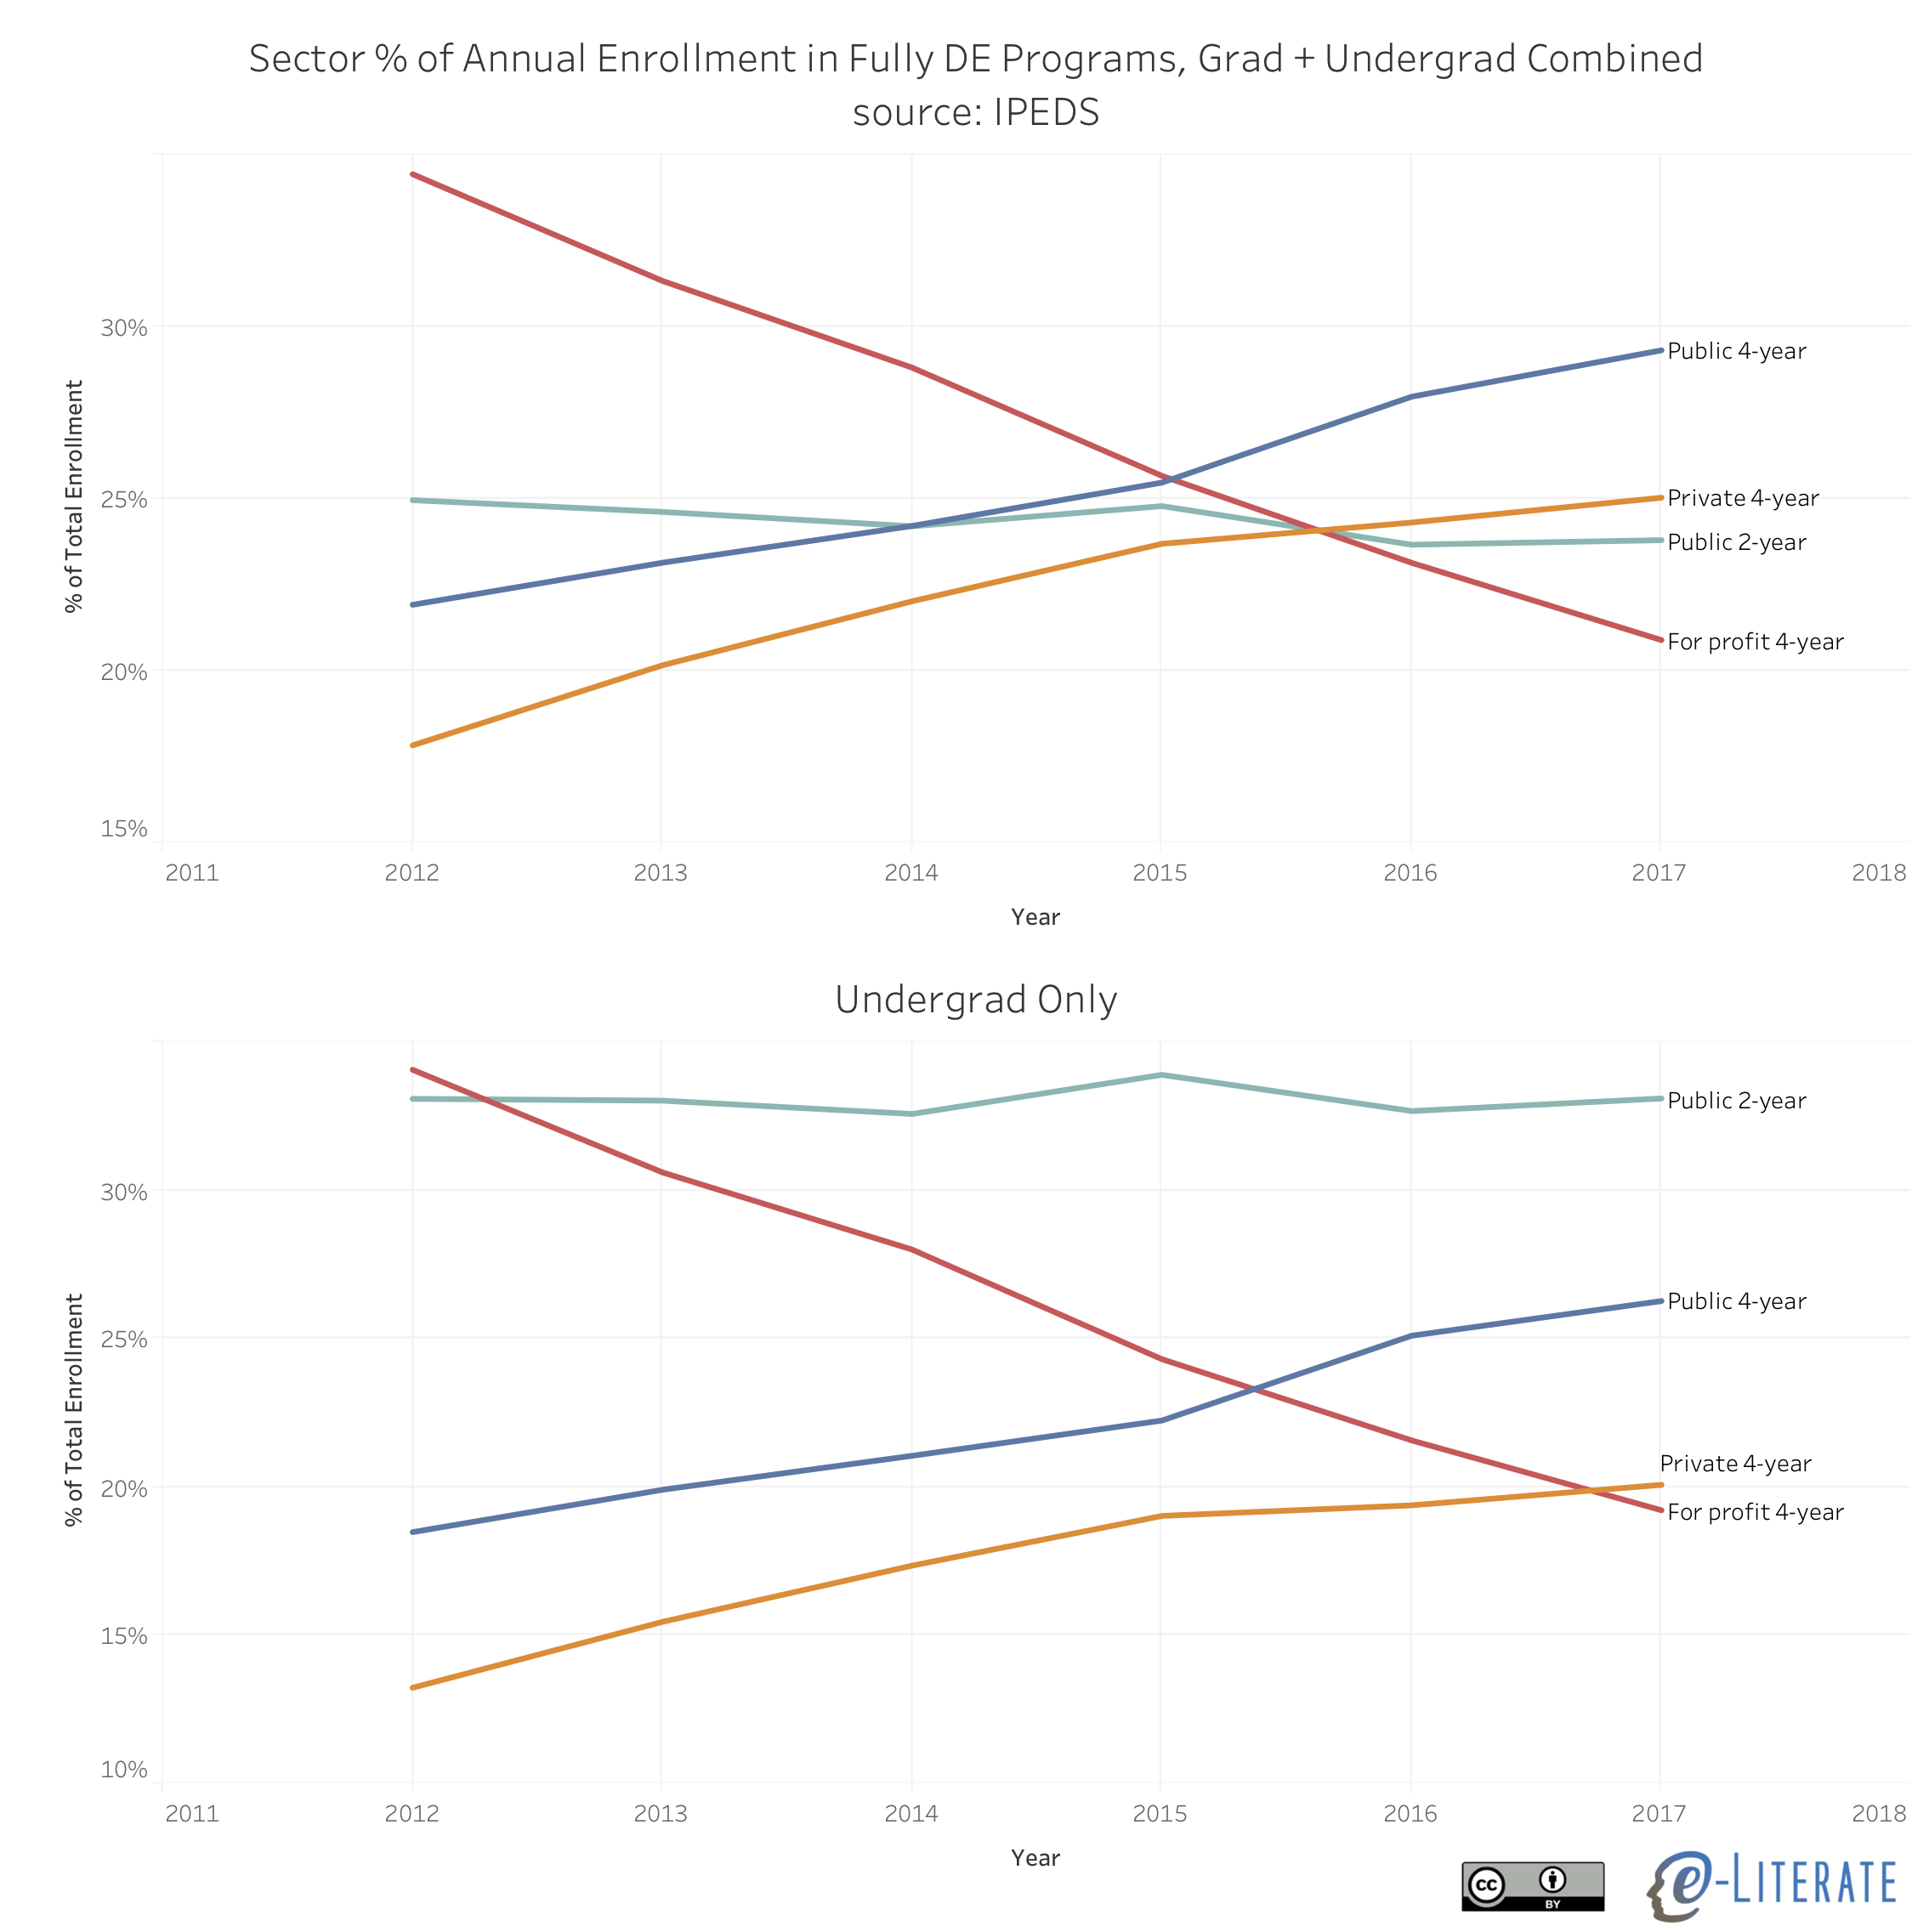
    This decline seems relevant, even if you then look at fully-online programs (e-Literate analysis of IPEDS data).
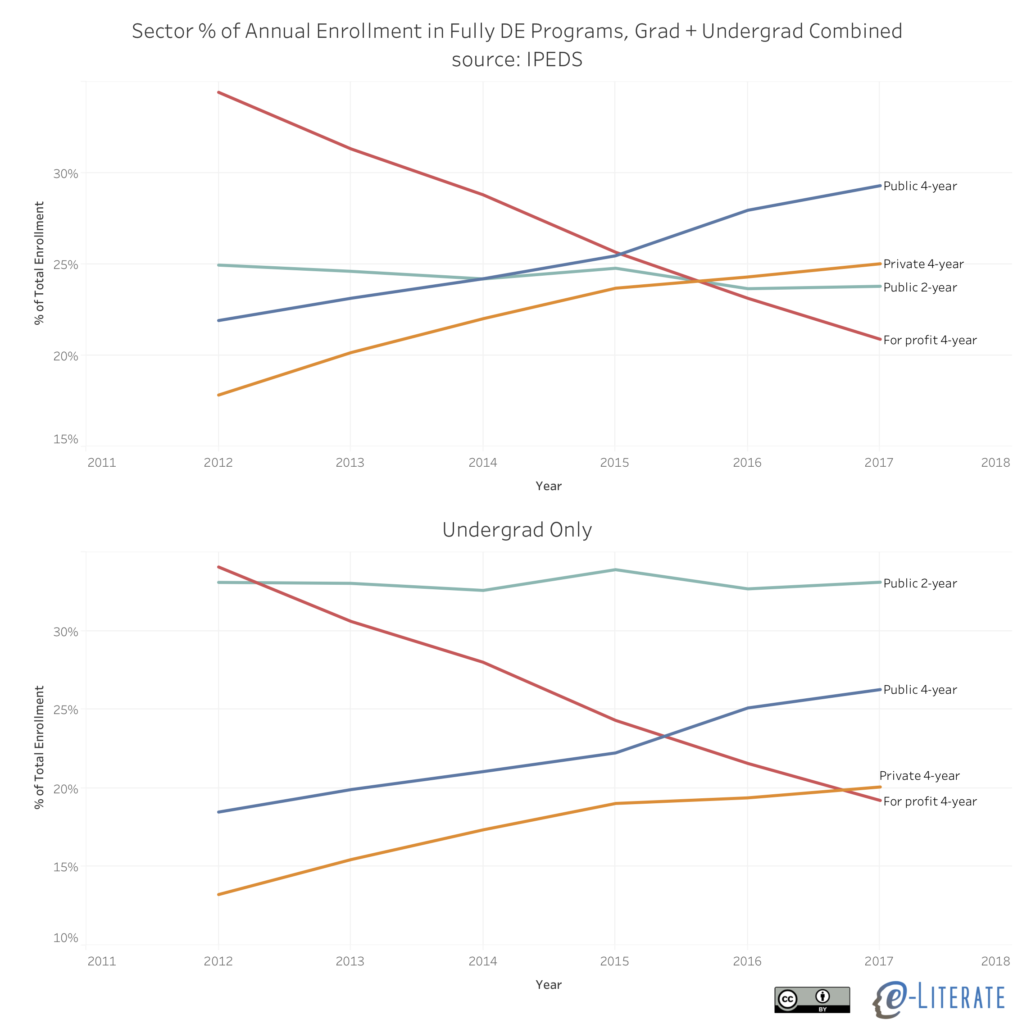
    Trends in online enrollment by sector

    Even in 2012, just two years after the for-profit peak, the for-profit sector accounted for less than 35% of fully online student enrollment, and as of Fall 2017 it was down to 21% with a clear trend. For-profits are rapidly becoming less and less relevant to the topic of online education, with no evidence to back up Protopsaltis claims that the for-profit sector is about to make a big comeback. It is high time that responsible analysts and scholars cease conflating online ed with for-profit schools, and the authors of this report should know better. If you want to study the for-profit sector, then describe it accurately and don’t extrapolate beyond what the data supports.

    “A wide range of audiences and stakeholders—including faculty and academic leaders, employers and the general public—are skeptical about the quality and value of online education, which they view as inferior to face-to-face education.”

    I find it strange to put this much emphasis on perceptions from an organization that purports to provide “timely, sound, evidence-based analysis”, but perceptions are somewhat important to understand. The body of the report describes a variety of research sources, but it is inaccurate to summarize that the wide range of stakeholders “view [online education] as inferior to face-to-face education.” Especially if you look at more recent data sources.

    Consider the 2018 Inside Higher Ed / Gallup survey of faculty (starting page 32), where they found that faculty with actual experience teaching online have surprising high confidence in the quality potential of online education. For those who have taught online, the percentage that agree or strongly agree that “for-credit online courses can achieve student learning outcomes that are at least equivalent to those of in-person courses in the following context”, 39% for any institution, 52% at my institution, 54% in my department or discipline, and 58% in courses that I teach. Put simply, a majority of faculty who have experience teaching online think results can be at least equivalent to in-person.

    Consider the 2019 Inside Higher Ed / Gallup survey of Chief Academic Officers, where fully 83% of them report plans to increase investment in online programs at their institution.

    Consider the 2018 Northeastern University Survey on the Use and Value of Educational Credentials in Hiring, where they found that “Online credentials are now mainstream, with a solid majority (61%) of HR leaders believing that credentials earned online are of generally equal quality to those completed in-person, up from lower percentages in years past.”

    Yes, perception issues are important. But the report’s conclusions are misleading and out of date.

    “Students in online education, and in particular underprepared and disadvantaged students, underperform and on average, experience poor outcomes. Gaps in educational attainment across socioeconomic groups are even larger in online than in traditional coursework.”

    This topic deserves its own report, and the GMU authors are right to point out that simply comparing online to face-to-face outcomes can obscure the important issue of underprepared and disadvantaged student experiences. On the surface, the conclusion about achievement gaps being “larger in online than in traditional coursework” is also accurate. But the more important question is not whether there is a problem, but rather how to minimize or reverse the achievement gap.

    The report references several studies from the California Community College system, mostly from years ago, describing how students “were less likely to complete online courses and when they completed them, less likely to pass them”. Yet the authors did not look at the trends within this system, as easily found in the most recent Distance Education report from the system, where the gap in performance overall for online versus tradition is closing rapidly.
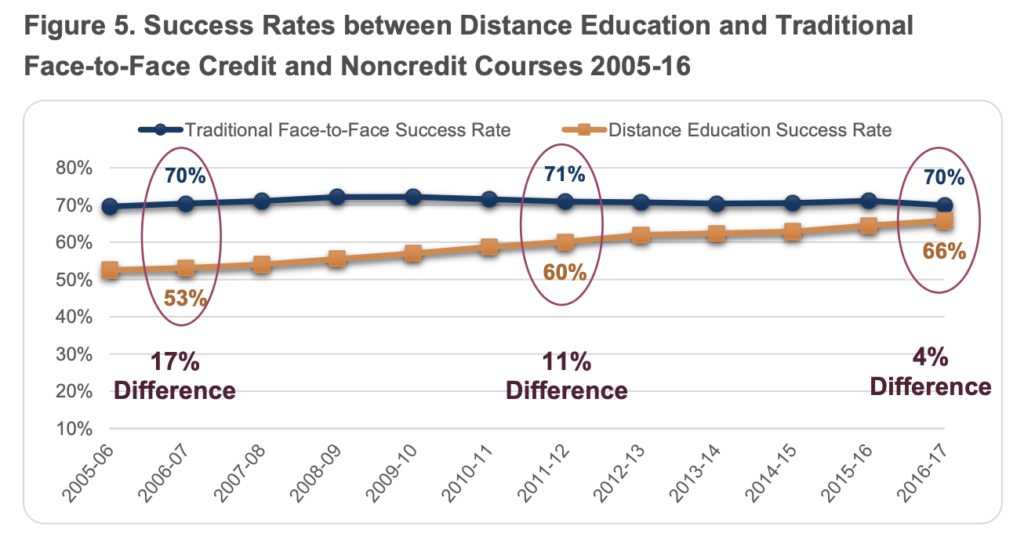
    CCCS improvements in gap of online ed

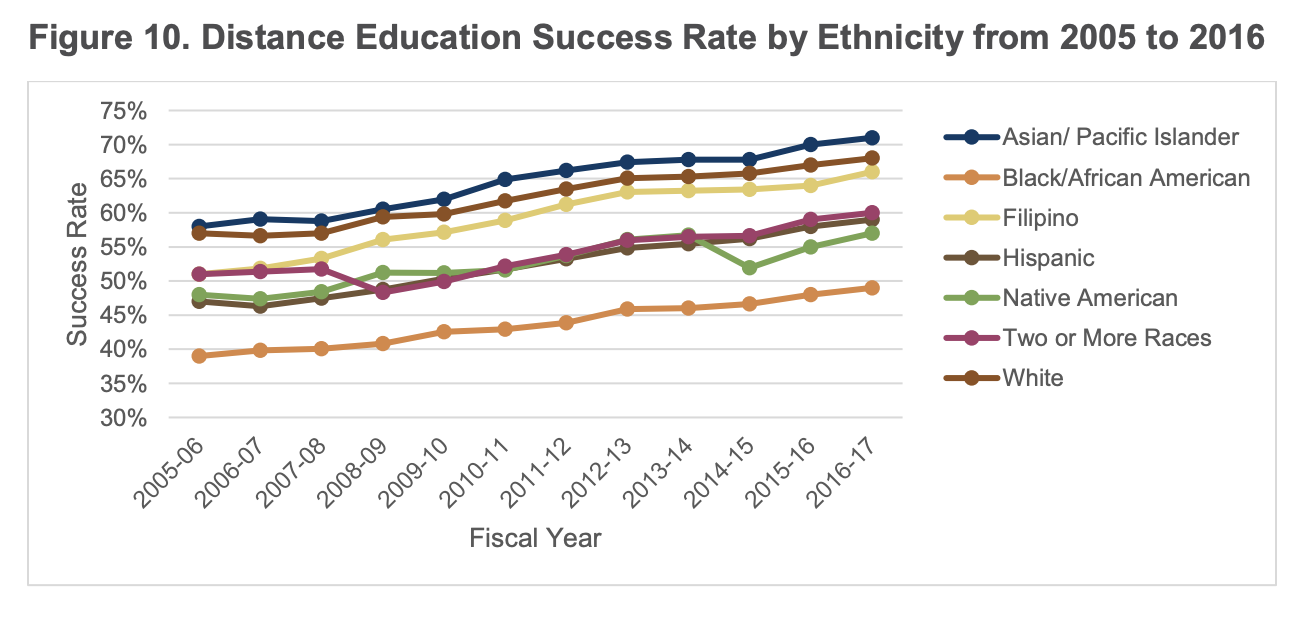
    More importantly, the achievement gains applied to all ethnic groups.
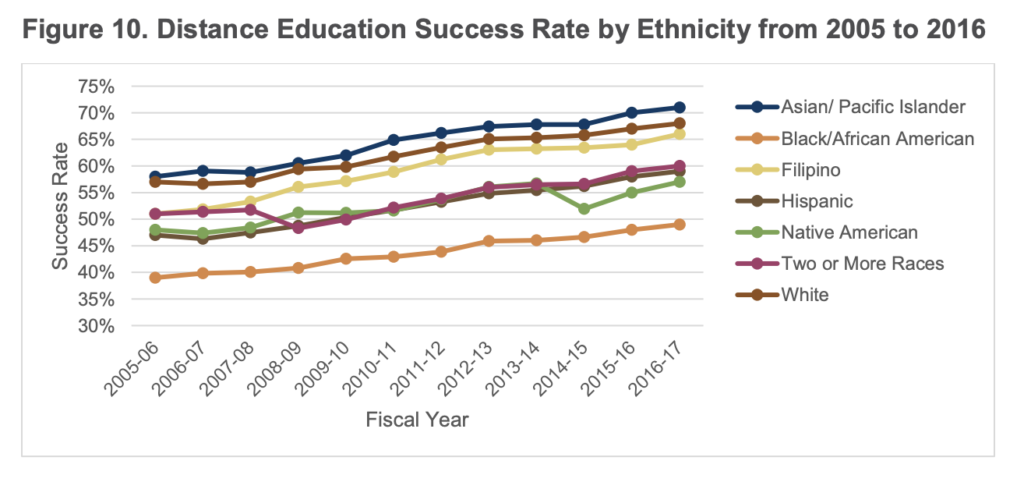
    CCCS Online performance by ethnicity

    It does appear that the performance gaps within online education are not closing by ethnicity despite the broad improvements. That is a real question to consider. Rather than viewing a simplistic view that online = bad results, we should focus on how to maintain current improvements while figuring out how to do even better in providing equal opportunity.

    “Online education has failed to improve affordability, frequently costs more, and does not produce a positive return on investment.”

    This conclusion is largely based on the NBER Hoxby report that was subsequently withdrawn, and for which I provided a detailed critique. I was not able to get a response from the report author. Beyond a gross mischaracterization of the source data, the Hoxby report made a fundamental flaw in its ROI analysis.

    This view of online education – students choosing between non-selective face-to-face institutions or online institutions – takes a zero-sum approach, as if you have the same student population just choosing between institution types. This view ignores the large and growing number of working adults who can only attend college – often in degree-completion programs or masters level programs – because of an online option. Their real choice should be seen as online institution or not at all.

    The GMU report relies on the withdrawn Hoxby report and does not even describe that it was withdrawn.

    There is an excellent point made that pricing for students has largely not been lower for online education, but there are specific examples (UF Online, SNHU, WGU, to name a few) where they specifically provide much lower-priced offerings to students than comparable face-to-face programs. It would be interesting to study enrollment trends and student outcomes for lower-priced online programs compared to comparably-priced programs.

    “Regular and substantive student-instructor interactivity is a key determinant of quality in online education; it leads to improved student satisfaction, learning, and outcomes.”

    “Online students desire greater student-instructor interaction and the online education community is also calling for a stronger focus on such interactivity to address a widely recognized shortcoming of current online offerings.”

    These last two points get to the primary purpose of the GMU report – current federal policy making efforts that include a re-evaluation of the Regular and Substantive Interaction (RSI) requirement for programs to be classified as online education and no correspondence courses.

    The GMU report describes a large body of work documenting the importance of interaction to online student success, and the report accurately describes how “the online education community has also emphasized recently the importance of student-instructor interaction for ensuring quality.” This point is crucial – the vast majority of educators working in online education understand and accept the importance of interaction; there is not significant disagreement on the subject.

    What the GMU report gets wrong is conflating actual quality interaction within courses with federal regulations. Much of the basis of the GMU analysis is a series of Office of Inspector General (OIG) reports calling out weak implementation of the RSI regulations. In the biggest case – a report on Western Governors University (WGU) and its competency-based model – this conflation is unwarranted, as I described in a detailed analysis of that action. There were two particular problems with the OIG findings in my view – the first is that the OIG defined their own terms due to the ambiguous nature of the RSI regulation.

    The OIG used a binary role-based approach (you are an instructor or you are not) leading to conclusion that only course mentors and evaluators could be considered as instructors, however. The basis of this determination was an instructor must “provide instruction on course content” – clearly a content-dissemination view that rejects alternative pedagogies. And this interpretation that the OIG treats as unambiguous is not based on law, regulations, or commonly-accepted educational terminology. [snip]

    This is why I call the audit methodology as hyper-literal. Somehow the OIG thinks they can determine – without any disagreement or ambiguity – the “ordinary meaning of those terms” based on their own interpretations.

    The second problem was that the OIG did not evaluate the actual courses or even address the issue of course quality.

    Also note that the determination was entirely based on course design materials – think syllabus and course outlines. The OIG did not look at interactions arising during the course of actual course work, just whether there were pre-defined webinars, meetings, and student-instructor interactions. [snip]

    These views essentially reject not just WGU’s approach to CBE but also the broader movement of faculty from “sage on the stage to guide on the side”. Instructors, from the OIG view, must provide instruction on course content and interactions must be pre-planned in the course design materials, at least for online courses.

    The OIG did not look at student outcomes, applied its own hyper-literal translation of an ambiguous regulation, and did not look at the course interactions themselves – just whether pre-planned course materials described future course interactions. Note, however, that despite the weakness of the OIG report, this does not mean that WGU is off the hook. Likewise, this report’s over-reliance on the OIG reports mistakes regulation for actual interaction quality, but that does not mean that there is not an issue where many or most online courses could improve faculty-student interaction.

    It is broadly understood that the RSI regulation is important but flawed. I agree with the GMU report that a simple elimination of the regulation would be a mistake. But it is overly simplistic and completely subjective for the GMU report to conclude that “unbundled faculty models that have difficulty complying should make changes to match the law instead of changing the law to match the needs of such models.” That is a policy position and not based on “timely, sound, evidence-based analysis”.

    In Conclusion

    This last point gets to the danger of this GMU report. It is a subjective set of policy recommendations disguised as extensively-documented evidence-based research. There is value in the questions asked, in much of the research documented in the footnotes, and in the clear policy position presented on regular and substantive interaction. But there is more harm than good from the report due to the mischaracterizations, selective data usage, and flawed analysis provided. Read it as a policy paper and not a research report.

    Paul Fain from Inside Higher Ed provided a valuable, pithy summary at the end of his article on the report.

    The report’s co-authors and its critics agreed that further research is needed on the rapidly evolving field of online education, particularly as more high-quality colleges and universities ramp up their online offerings.

  • Academic LMS Market Slowdown

    In one of our premium versions of the LMS Market Analysis services, targeted primarily at the investment community, we have noted since early summer (starting in June 2018) that the global LMS market appears to be slowing down for higher ed. Given our public market analysis role and given the trend now lasting more than half a year, this news seems more than just a note for investors.

    Based on CFO Steven Kaminsky’s comments during Instructure’s quarterly earnings call, we’re not the only ones noticing:

    So for renewals what we’ve seen specifically this year is fewer large deals in the multi-hundred thousand dollar range than we’ve seen in previous years. It’s a little still too early to talk about 2019, we’ll be doing that in a few months but we have seen that and when I referenced earlier that it didn’t look like we’re going to grow domestic Canvas by much of it all, that’s what I was really referring to, that’s the key driver there.

    A recent analysis note from Brian Peterson at Raymond James shared similar observations.

    Our proprietary higher-ed North American LMS tracker pointed to a notable slowdown in large deal activity in 2018, with full year levels (as defined by the number of students) down in the double digits.

    But first a note about our data to help readers determine how to interpret the description of this trend.

    Along with new implementations (changes from one LMS to another at a particular institution), we also track what we call “First Seen” data. This captures how many LMS decisions we capture in a given month, and over time this metric acts as a leading indicator of implementation changes. This data is broken down by global region (North America, Europe, Latin America, and Australia / New Zealand are currently covered), LMS provider, and enrollment band (to capture institution size).

    What we noted in Summer 2018 was a fairly dramatic drop in First Seen data, particularly in North America. Over time, we also noted a change in Trailing 12 Month data from New Implementations (total of previous 12 months for each measured month to smooth out market seasonality). For Dec 2018 T12M data, capturing the full 2018 calendar year, the activity of new implementations is roughly 20 – 25% lower than it was a year prior.

    Global academic LMS Market slowdown over past year

    Some notes on the data shown described and above:

    • Even with T12M data smoothing, the trends are still somewhat lumpy, which is the nature of academic markets.
    • The market for implementations seems to have peaked at the end of the spring 2018 academic calendar and then dropped to current levels that represent a plateau rather than ongoing downward trend.
    • To allow reasonable comparisons over time, the data above represents T12M as we knew it at the time. The data is not a full set, as it does not contain implementations we discovered more than a month after the reported month, so the key is to look at trends and not absolute levels.
    • There are other factors to consider that impact company finances, such as the ongoing enrollment declines in North America, particularly among for-profit or formerly for-profit institutions, but we now have two different variables both pointing to at least a temporary dropping of activity.

    It’s premature to determine whether the slowdown will continue or whether market activity will rise again in 2019. We have some statistical and anecdotal indicators for both cases but are not ready to predict yet.

    Hopefully this data description of market activity hasn’t been too tedious, but there are strong arguments that company financial health in 2018 / 19 for the providers will continue to have an outsized impact on the future of LMS offerings.

  • OER Survey and Adoption Growth: It pays to check source material

    OER Survey and Adoption Growth: It pays to check source material

    I had a trip to the UK this month and only had time to read media coverage of the recent Babson Survey Research Group (BSRG) survey on open educational resources (OER). What a mistake. The Chronicle of Higher Education had a flawed description of a key question – actual and planned adoption of OER material by faculty – that misinformed readers like me who didn’t read the actual survey report, at least initially.

    The open-educational-resources movement, commonly known as OER, is an effort to encourage academics to use open-licensed materials in their classrooms as a way to lower costs. Some nonprofits, like OpenStax, have produced textbooks based on this material. The survey shows that OER has made inroads: 22 percent of people who teach introductory courses, subjects in which free textbooks are most commonly available, use it as required material, up from 15 percent last year.

    Yet the percentage of faculty members who say they will use, or consider using, open materials in the next three years actually dropped slightly, with the numbers now at 6 percent and 32 percent respectively.

    On the surface, this description indicates that OER adoption increased for faculty teaching introductory courses, but the second paragraph shows a potential drop in adoption over the next three years for all faculty. That would be major news showing that the OER movement hit an inflection point and is likely to drop soon, even though faculty have a natural affinity for the same issues that OER offers – lower cost and the ability to remix / reuse.

    It turns out this interpretation is wrong. The actual BSRG survey report states the following [emphasis added]:

    Each year, this survey asks faculty members who are not current users of open educational resources whether they expect to be using OER in the next three years.

    This question is only for non OER-adopting faculty. In other words, it measures growth potential, not total adoption potential. In fact, the percentage of faculty who used required OER material in any of their courses more than doubled this year, and based on the question above should continue to grow. BSRG further described the numbers for non OER-adopting faculty.

    There have been minimal changes in the proportion of faculty who report that they will use OER in the next three years, dropping slightly from 7% in 2015-16 and 2016-17, to the 6% reported this year. The number who report that they “Will consider” OER grew from 31% in 2015-16 to 37% for 2016-17, before dropping to 32% for 2017-18.

    This description is poorly worded and misses the context provided earlier, which I assume was part of the problem with Chronicle coverage.

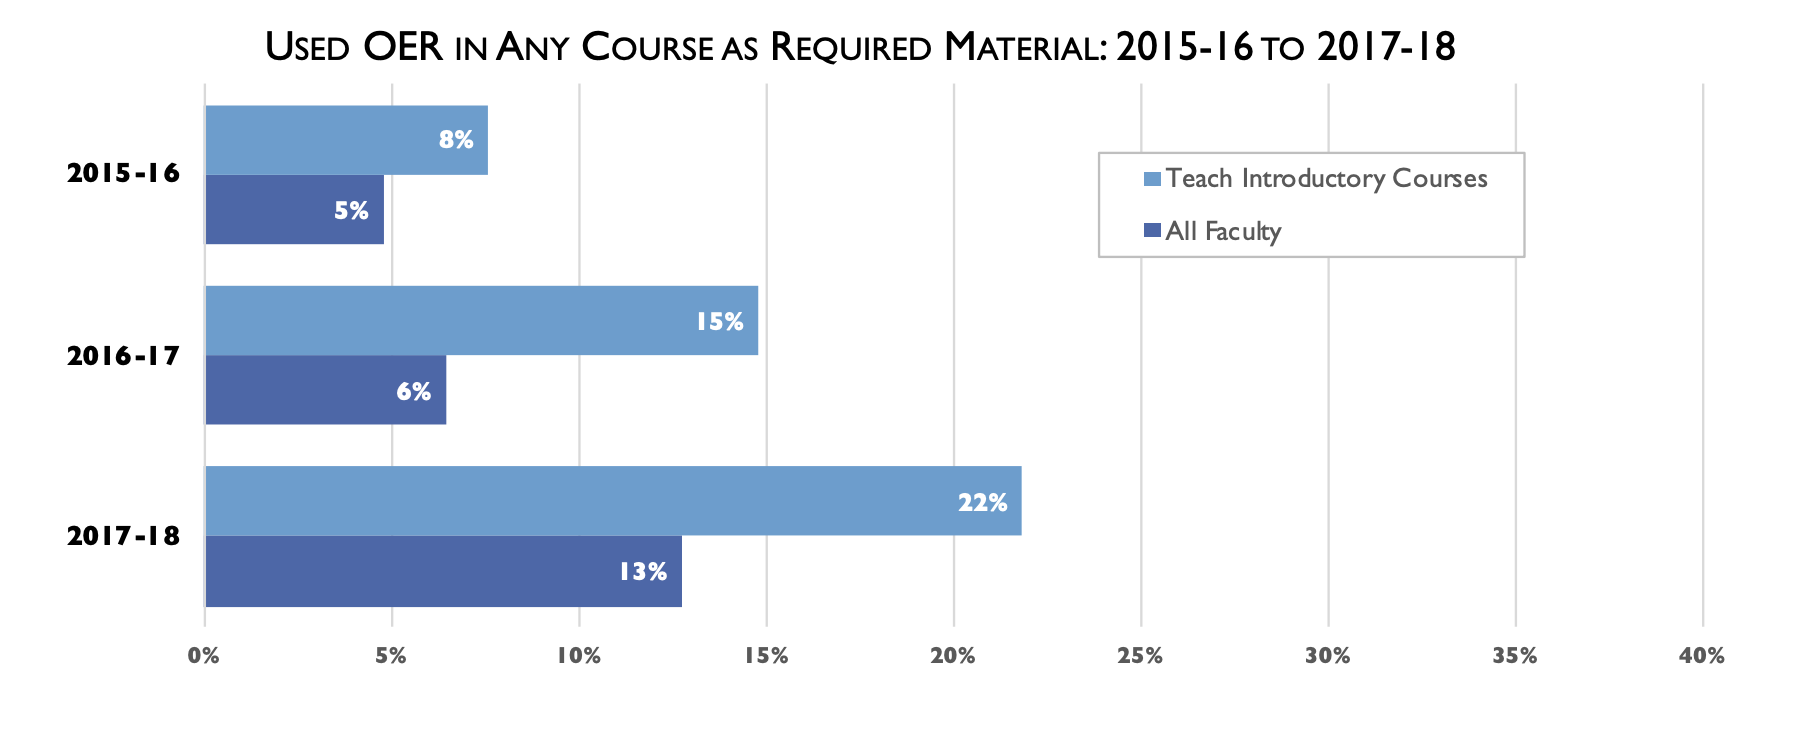
    As for actual adoption, the category of “all faculty” grew significantly over the past year.

    Nearly one-quarter of faculty that teach large enrollment introductory courses report that they are using OER in some fashion, with more of these faculty responding that use OER as supplemental rather than as required materials. The rates are lower across all faculty, with 13% reporting using OER as required course material in at least one of their courses.

    These numbers represent a large increase over those in previous years, with the overall faculty rate of required OER use climbing from 5% two years ago to 6% in 2016-17, and then making a large jump to 13% this year. Given the sometimes vague understanding of the OER and its licensing, care must be taken in interpreting these results. Are faculty lumping any free resource into the OER category, even those that are not licensed as OER? Based on previous results we have to assume that there is some level of over-reporting in these figures of OER use; we just don’t know how much of an impact this is having.

    Chart showing growth of OER adoption

    What is interesting is that this adoption growth aligns with an independent source, the Cengage OER survey from Fall 2016.

    Open Educational Resources (OER) in higher education have the potential to triple in use as primary courseware over the next five years, from 4 percent to 12 percent, according to a survey of more than 500 faculty by Cengage Learning.

    What the data appear to show is significant growth in OER adoption for all faculty as well as for the subset teaching introductory courses. Adoption should continue, although it could be at a slower rate than was seen over the past year.

    It pays to read source material when the data describes important trends, especially when the results are surprising. I wish I had done this earlier.

  • MOOCs in Decline: Insights into multi-year data from MIT and Harvard

    MOOCs in Decline: Insights into multi-year data from MIT and Harvard

    It is no secret that the commercial Massive Open Online Courses (MOOCs) launched by Coursera, Udacity, and edX in 2011/12 are a different beast from the majority of for-credit online education offerings. One such difference is the pattern of quick drop-off of students within each course, particularly in the first 2 – 3 weeks, which we documented in 2013.

    We also know that the original disruption vision for these large MOOCs has not come to pass, with many MOOC providers moving into Online Program Management (OPM) business models and shutting off many of the free and open access that made MOOCs in the first place.

    Late last week two researchers at MIT, Justin Reich and José A. Ruipérez-Valiente, published an article in Science titled “The MOOC Pivot” that provides new multi-year insight into the trends based on edX usage at MIT and Harvard, the two founding schools for edX. In a nutshell, MOOC activity peaked in 2016 based on new individual learners, based on a dataset of “565 course iterations from 261 different courses, with a combined 12.67 million course registrations from 5.63 million learners”, leading the MOOC providers to look to the OPM market as a more-realistic method of sustainability. The researchers identify three insights from their data [emphasis added].

    To better understand the reasons for this shift, we highlight three patterns emerging from data on MOOCs provided by Harvard University and Massachusetts Institute of Technology (MIT) via the edX platform: The vast majority of MOOC learners never return after their first year, the growth in MOOC participation has been concentrated almost entirely in the world’s most affluent countries, and the bane of MOOCs—low completion rates—has not improved over 6 years.

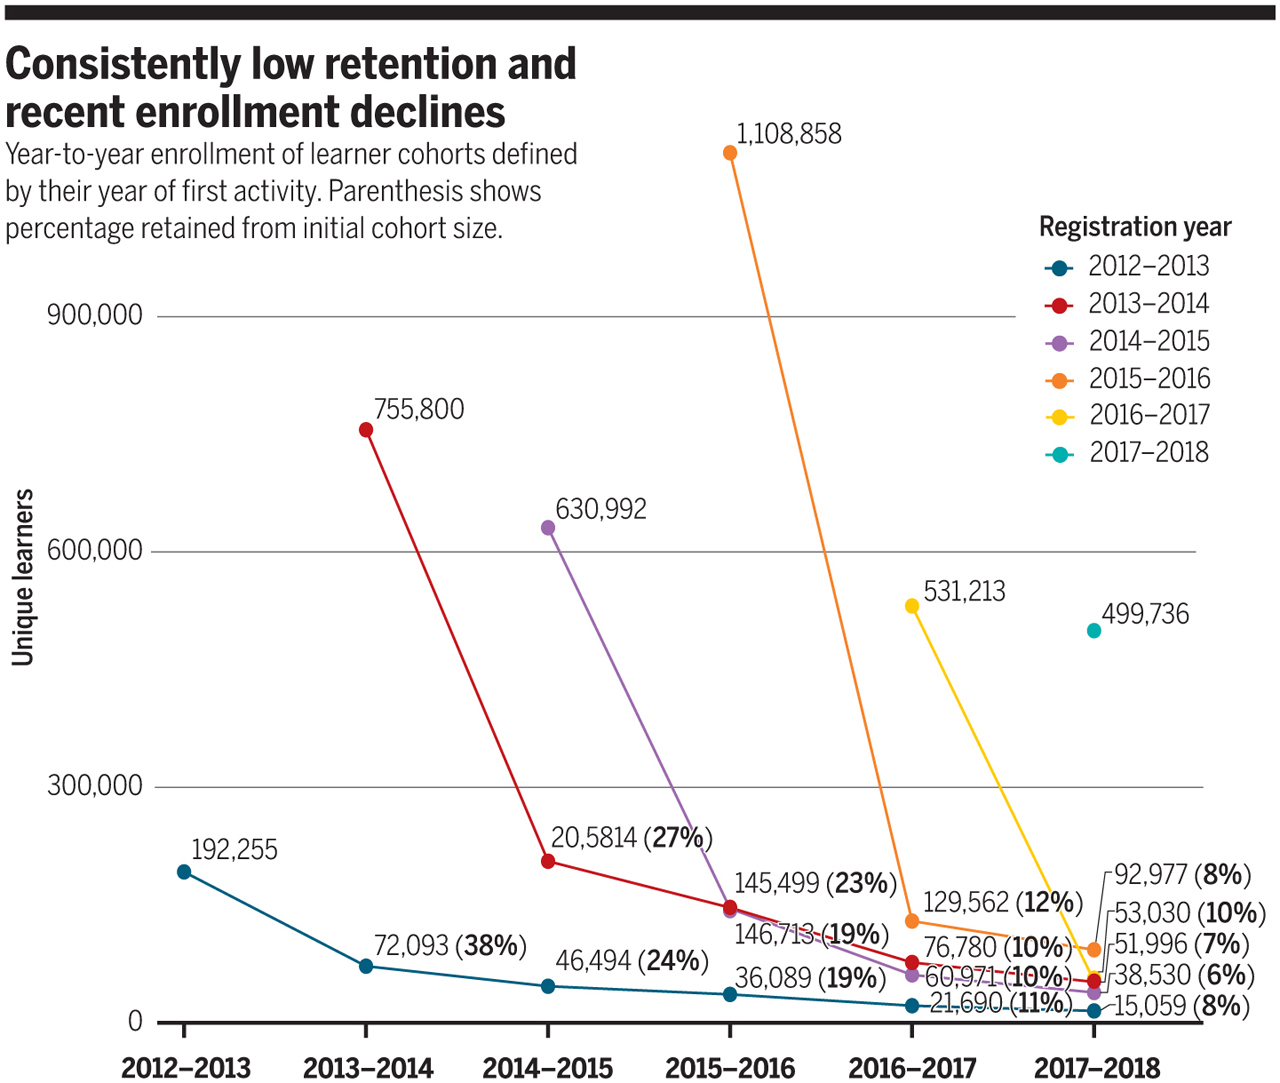
    The highlighted conclusion makes sense, but to my knowledge we have previously not had any solid data to back this point up. The following chart in the article shows annual cohorts of learners and tracks them over time, showing that the decrease per year largely mirrors the course-level situation.

    MIT Harvard multi-year research on MOOCs

    Thus 38% of 2012-13 cohort enrolled in at least one course in year 2, and 24% of 2012-13 cohort enrolled in any course in year 3, etc. Over time, these year 2 / year 3 / year 4 retention numbers reduce significantly. Thankfully, Justin and José provided a GitHub repository of the data, and perhaps a transposition of Table S1 can make these trends more obvious.

    It took nearly six years for 10% or fewer of the 2012-13 cohort to remain active (enrolled in any courses), but just two years for 2016-17. And note that the cohort size has been dropping since 2015-16. Keep in mind that the MOOC providers counteract these institution-level trends by increasing the number of institutions that they partner with over time.

    There is more analysis in the full article at Science – it’s worth reading the whole thing.

  • Fate of EDU For-Profits: A look into recent enrollment changes and shut downs

    Fate of EDU For-Profits: A look into recent enrollment changes and shut downs

    One month ago the Education Corporation of America (ECA) was the latest for-profit system to shut down, as described by Inside Higher Ed:

    Education Corporation of America owns more than 75 campuses and enrolls at least 20,000 students in mostly certificate-granting professional disciplines such as cosmetology, culinary arts and medical and dental assistant programs. It operates chains including Virginia College and Brightwood College.

    A week later Adtalem Global Education completed their sale of for-profit systems:

    Adtalem Global Education (NYSE: ATGE), a leading global education provider, today announced the completion of the transfer of ownership of DeVry University (DVU) and its Keller Graduate School of Management to Cogswell Education LLC. Today’s announcement closely follows Adtalem’s disclosure of the transfer of ownership of Carrington College to San Joaquin Valley College, Inc. (SJVC Inc.) which was completed on Dec. 4, 2018. Post divestitures, Adtalem Global Education’s U.S. postsecondary degree-granting institutions serve the high-demand, rapidly growing medical and healthcare markets.

    The centerpiece of Adtalem’s remaining portfolio ((Disclosure: Adtalem is a former client of MindWires and past subscriber of our LMS Market Analysis service.)) is Chamberlain University, a growing system of nursing-based programs, and a look at the underlying data reveals that Chamberlain is one of only two large for-profit systems with significant growth.

    Given all the changes in for-profits, we tend to see either anecdotes about specific institutions or aggregate data on all for-profits combined. What is missing, though, is a view in between, showing enrollments and changes to a select group of for-profit schools, to help understand the different fates of different institutions.

    Why does this matter? For one, many for-profit chains are accredited as a number of different institutions, and they need to be combined to understand overall company strength. Second, following Tolstoy’s idea that “All happy families are alike; each unhappy family is unhappy in its own way”, the decline of for-profit institutions has a number of unhappy families with different lessons. In the case of ECA there is something unseen in other cases – ECA abruptly shut down despite growing enrollment by 32% year-over-year across Virginia College and Brightwood Colleges in the most recent IPEDS.

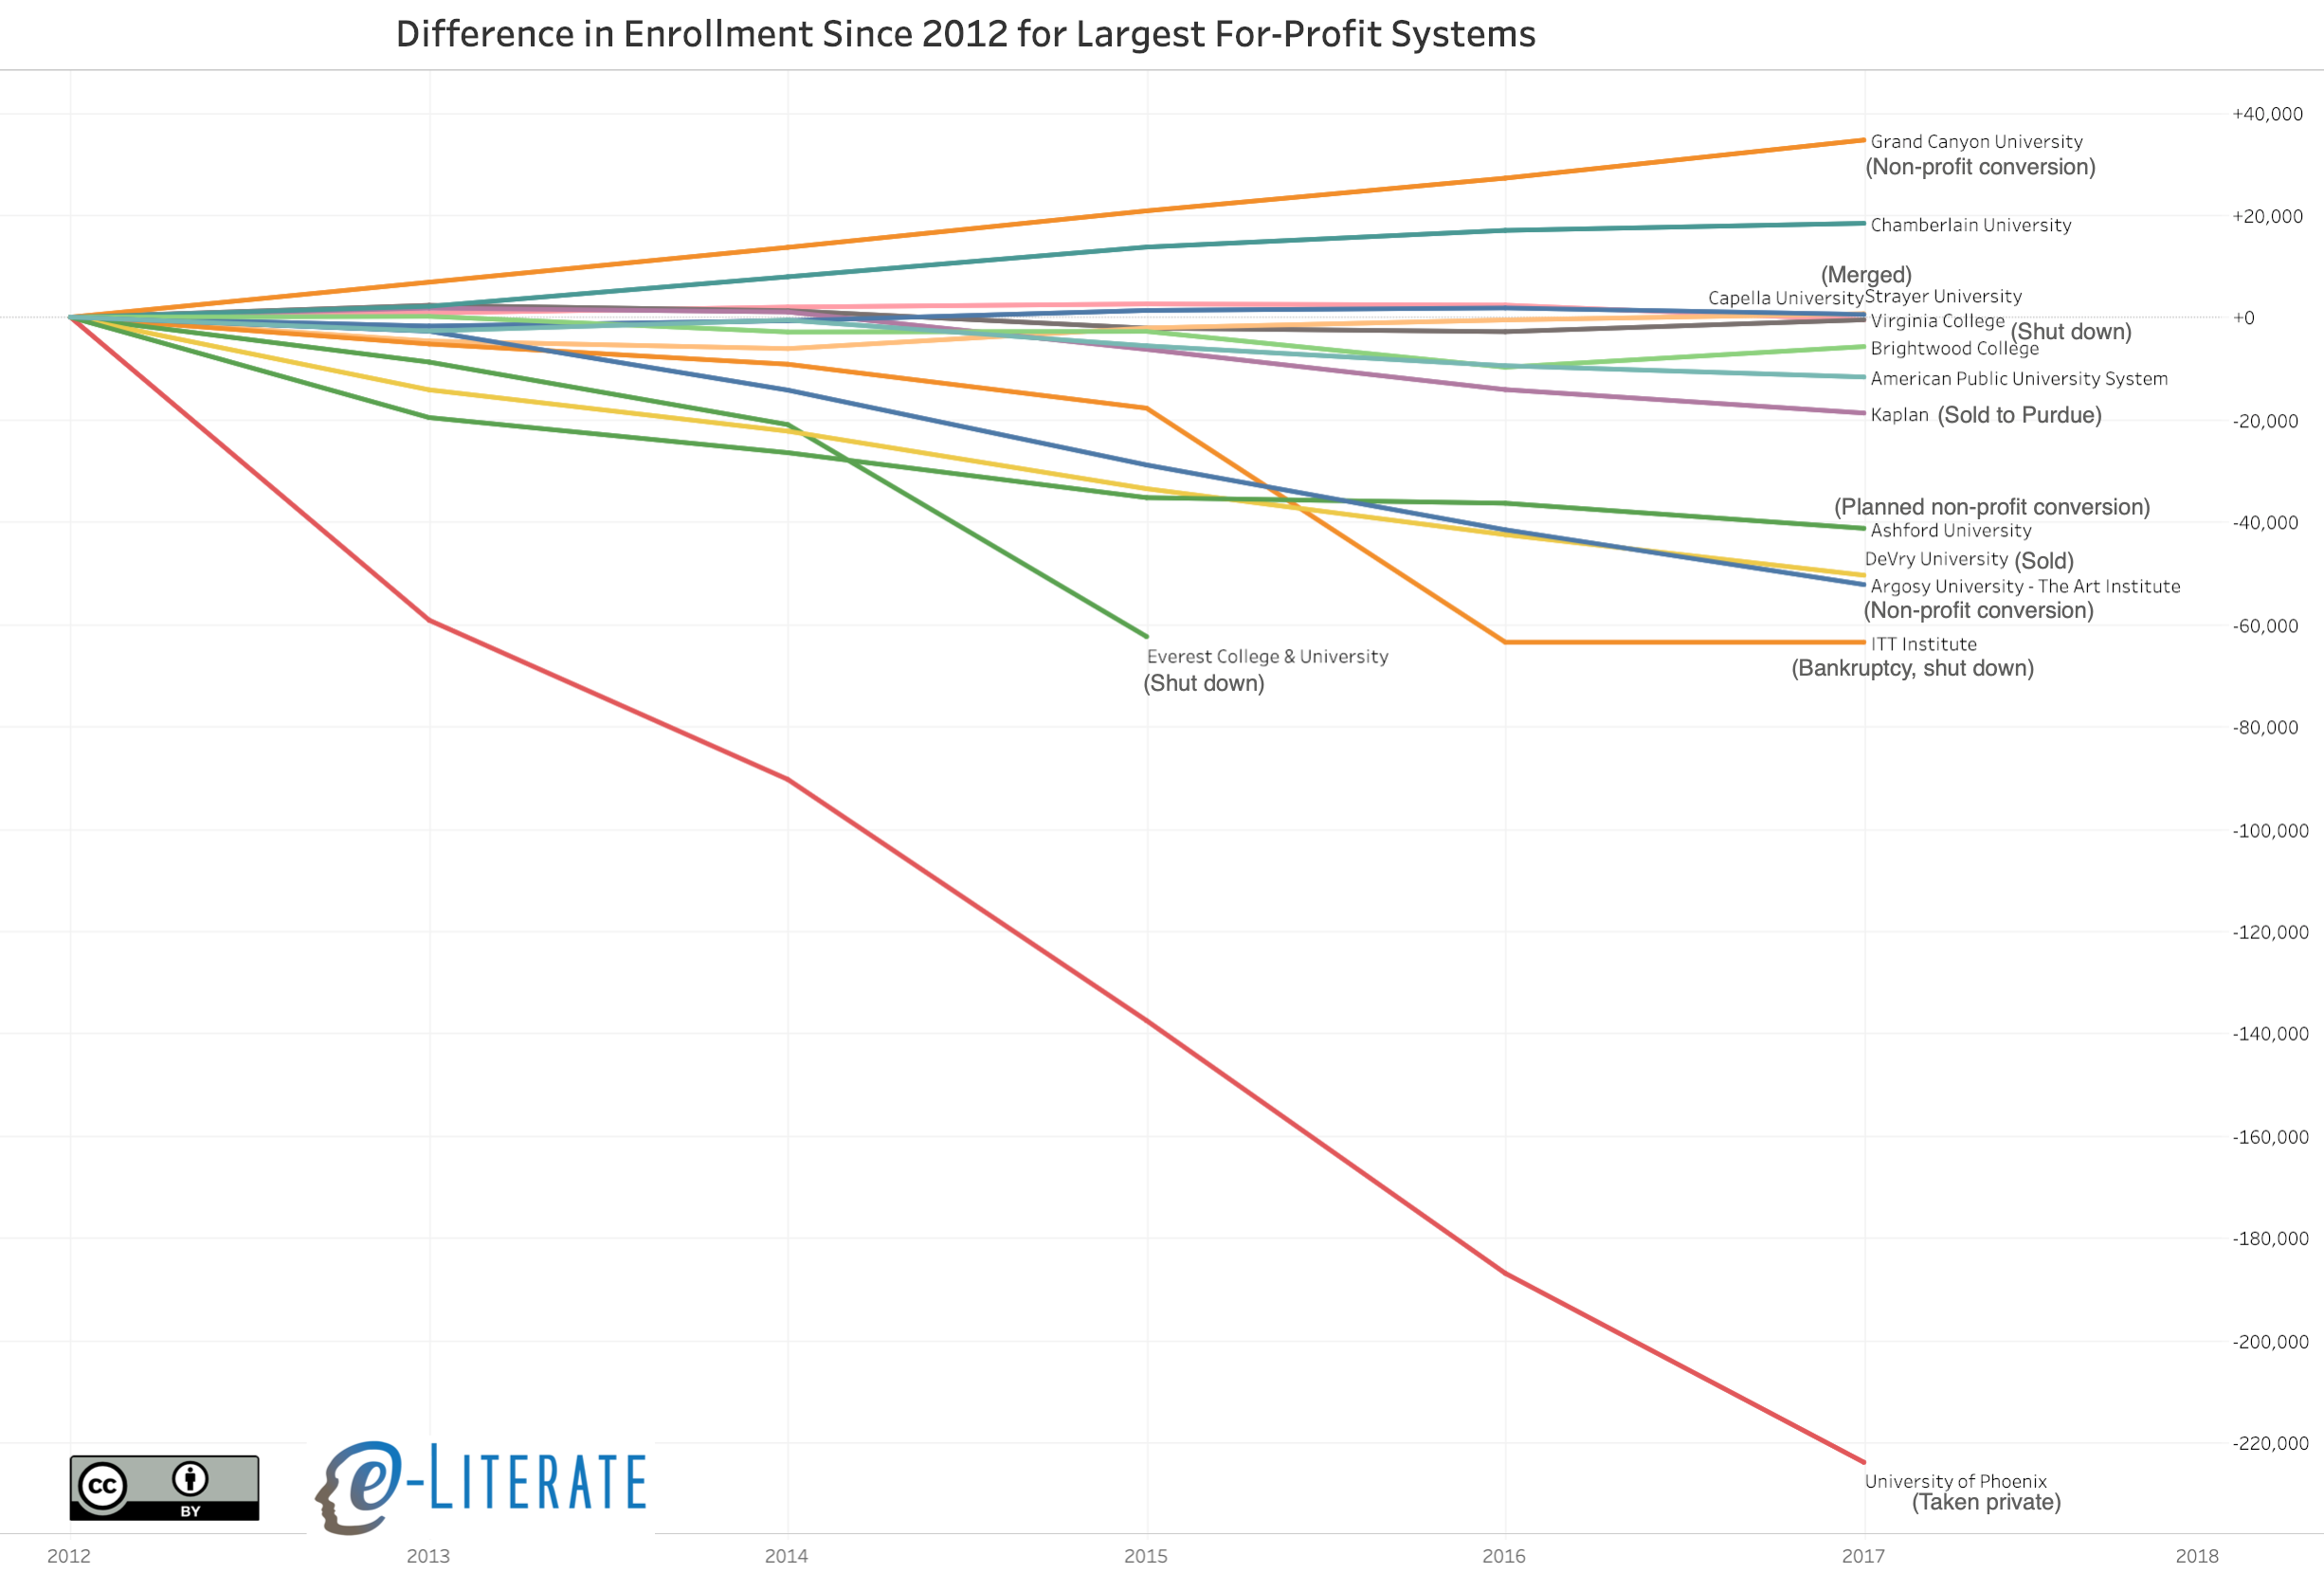
    The chart below shows differences from the Fall 2012 IPEDS enrollment report (grad + undergrad) for the 13 largest degree-granting systems as of that date, running through the Fall 2017 report (the most recent data available). I’ve added notes to show the various changes in ownership, control, and status for these systems – converting to non-profit status with a for-profit operating entity, merging of institutions, sale of institutions as with DeVry, going bankrupt withy full shut-down of systems, or taking the company private as with the U of Phoenix. Click on image for full size version.

    Largest for-profits - changes from 2012

    Some notes:

    • To read the chart properly, note that Chamberlain University had almost 20,000 more students in Fall 2017 than they had in Fall 2012, while DeVry University had roughly 50,000 fewer students in that same time period;
    • Seen together, it is startling the extent of changes in ownership, control and status among these former high-flying for-profit systems;
    • The only significant growth for these large systems came from Grand Canyon University and Chamberlain;
    • The changes to Virginia College and Brightwood College are not that significant; and
    • By far the largest decrease in enrollment has been the University of Phoenix.

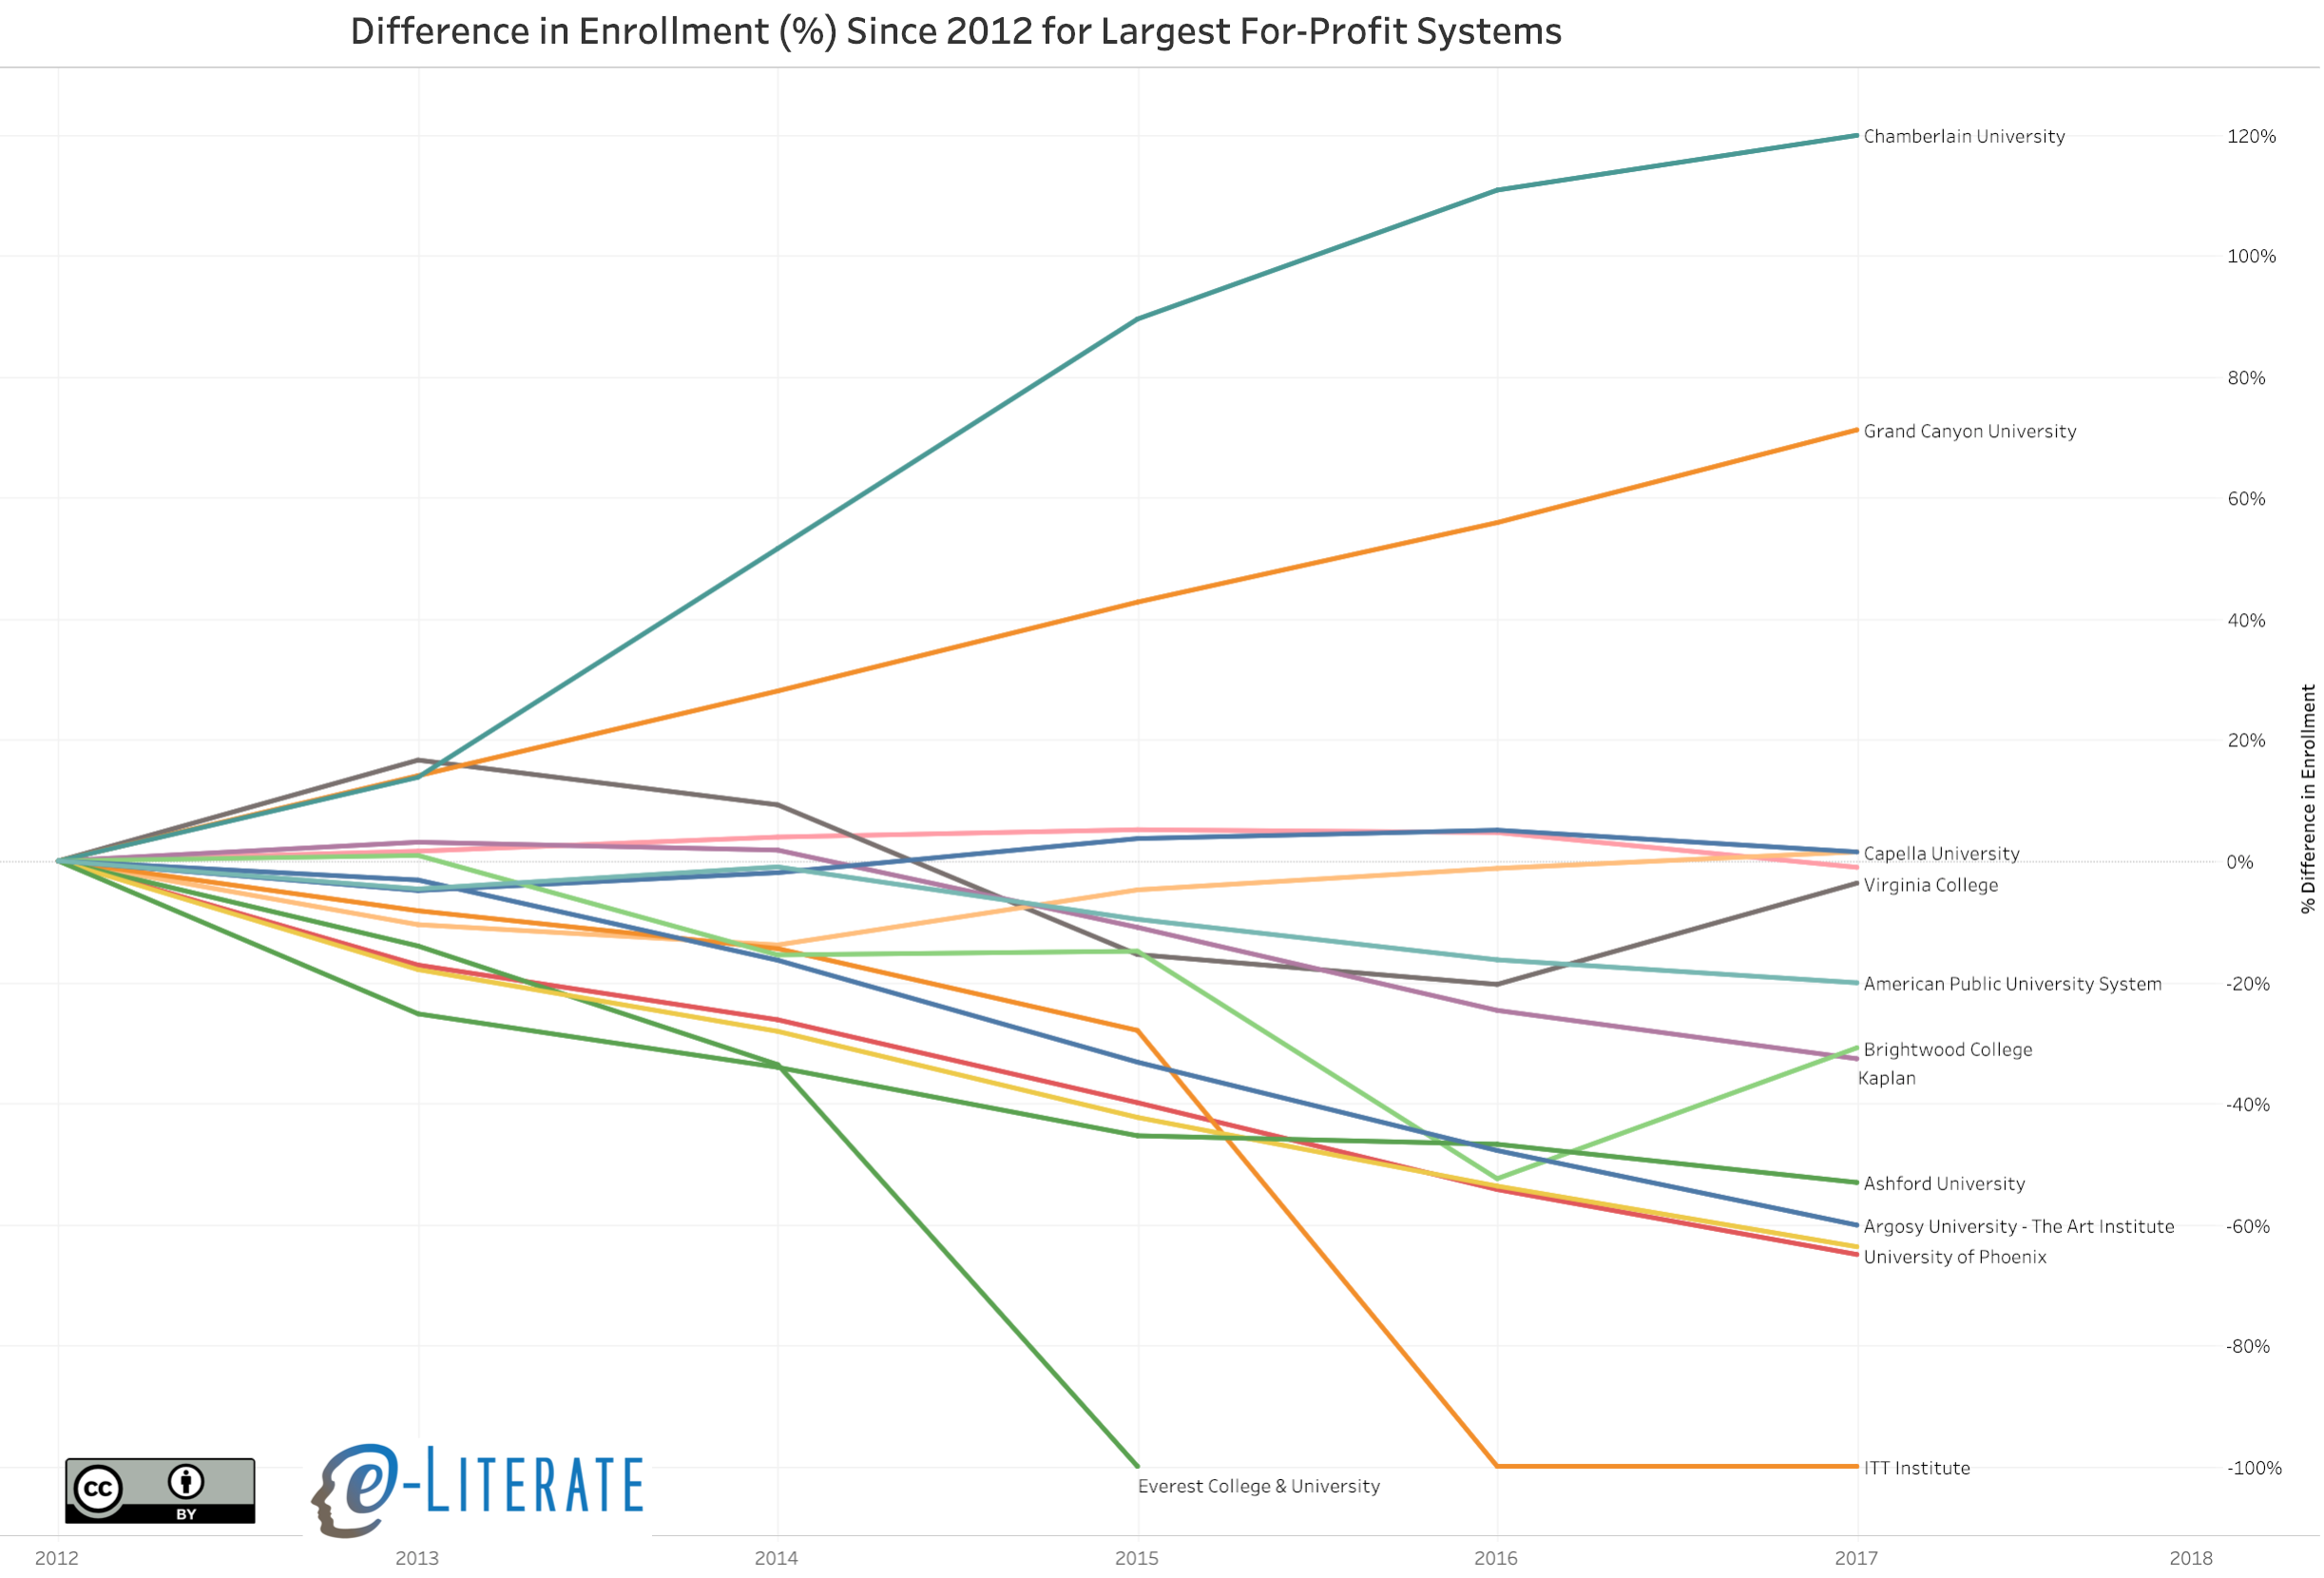
    While that view shows enrollment changes in total numbers, it is also useful to see relative changes for these same systems since 2012 to take into account the different enrollment sizes of the systems.

    Some notes:

    • To read the chart properly, note that Chamberlain University grew roughly 120% from Fall 2012 to Fall 2017, while DeVry University shrank more than 60% in that same time period;
    • In percentage terms, Chamberlain’s growth exceeds Grand Canyon University’s, which surprised me, but it seems to be leveling off;
    • Likewise, in percentage terms, DeVry University’s decline is roughly the same as the University of Phoenix’s;
    • Virginia College and Brightwood College actually grew from Fall 2016 – Fall 2017; and
    • We can see the shutdown of Corinthian Colleges (Everest) and ITT with 100% declines (ITT reported data in 2016 and 2017 even with no students).

    Let’s focus on just the four brands mentioned in last month’s stories – DeVry University & Chamberlain University for Adtalem, and Virginia College and Brightwood College for ECA.

    With this view, Adtalem’s strategy of selling DeVry while keeping Chamberlain makes a lot of sense, even if several years late and if they essentially gave away DeVry.

    ECA’s shut down, however, is not easily explained by the data. Unlike ITT and Everest, Virginia College and Brightwood College were not in enrollment free fall, and in fact there was instead recent enrollment gains getting them roughly back to 2012 levels. So why such an abrupt shutdown of ECA? The answer seems to lie with how the Department of Education and its accreditor handled recent troubles, based on IHE reporting.

    The shutdown follows years of declining enrollment for the chain. More recently, the privately held company scrambled to turn around its troubled finances by closing about a third of its campuses and pursuing a corporate overhaul through a court-approved receivership. But ECA continued to be dogged by creditors after falling behind on payments and rent for many campus locations. In October the company filed a lawsuit, which was later dismissed, against the U.S. Department of Education in an attempt to maintain its access to federal student aid.

    In an email to campus employees Wednesday morning, ECA CEO Stu Reed said that the Department of Education had added new restrictions on its access to Title IV student aid. And on Tuesday night, the Accrediting Council for Independent Colleges and Schools suspended the colleges’ accreditation. Those steps meant the company couldn’t secure the additional capital needed to operate its campuses, he said.

    I do not have enough knowledge to judge whether the ED should have shut off access to financial aid at the time that they did, but it does appear that students are paying the price despite signs that the schools were making significant enrollment gains. From the news coverage, there were significant outcomes issues beyond financial health of the parent company, but to my knowledge, this is a new situation among for-profit colleges in having a shut down despite very recent enrollment gains.