e-Literate

Present is Prologue

Tag: ANGEL

  • State of Higher Ed LMS Market for US and Canada: 2018 Year-End Edition

    State of Higher Ed LMS Market for US and Canada: 2018 Year-End Edition

    This is the eleventh year I have shared the LMS market share graphic, commonly known as the squid graphic, for US and Canadian higher education. This past year we at e-Literate shifted our LMS Market Analysis reports from Spring / Fall to Mid-Year / End-of-Year to better allow analysis of entire years. With the release of our end-of-2018 report last week to subscribers, it’s time for us to look at updates on the institutional LMS market for North America (US and Canada) higher education. Note that our coverage for the market analysis includes Europe, Latin America, Oceania (Australia, New Zealand, and surrounding island countries) as well as emerging coverage of the Middle East.

    We present the following data “by institutions”, with market share as a percentage of the total number of institutions using each LMS as a primary system, and “by enrollments”, where we scale the institutions by its total enrollment. The latter better captures the business of the LMS market, since most licensing deals are based the number of students.

    But first, let’s look at an updated LMS market share graphic, commonly known as the squid graphic, for US and Canadian higher education. The original idea remains – to give a picture of the LMS market in one page, highlighting the story of the market over time. The key to the graphic is that the width of each band represents the percentage of institutions using a particular LMS as its primary system.
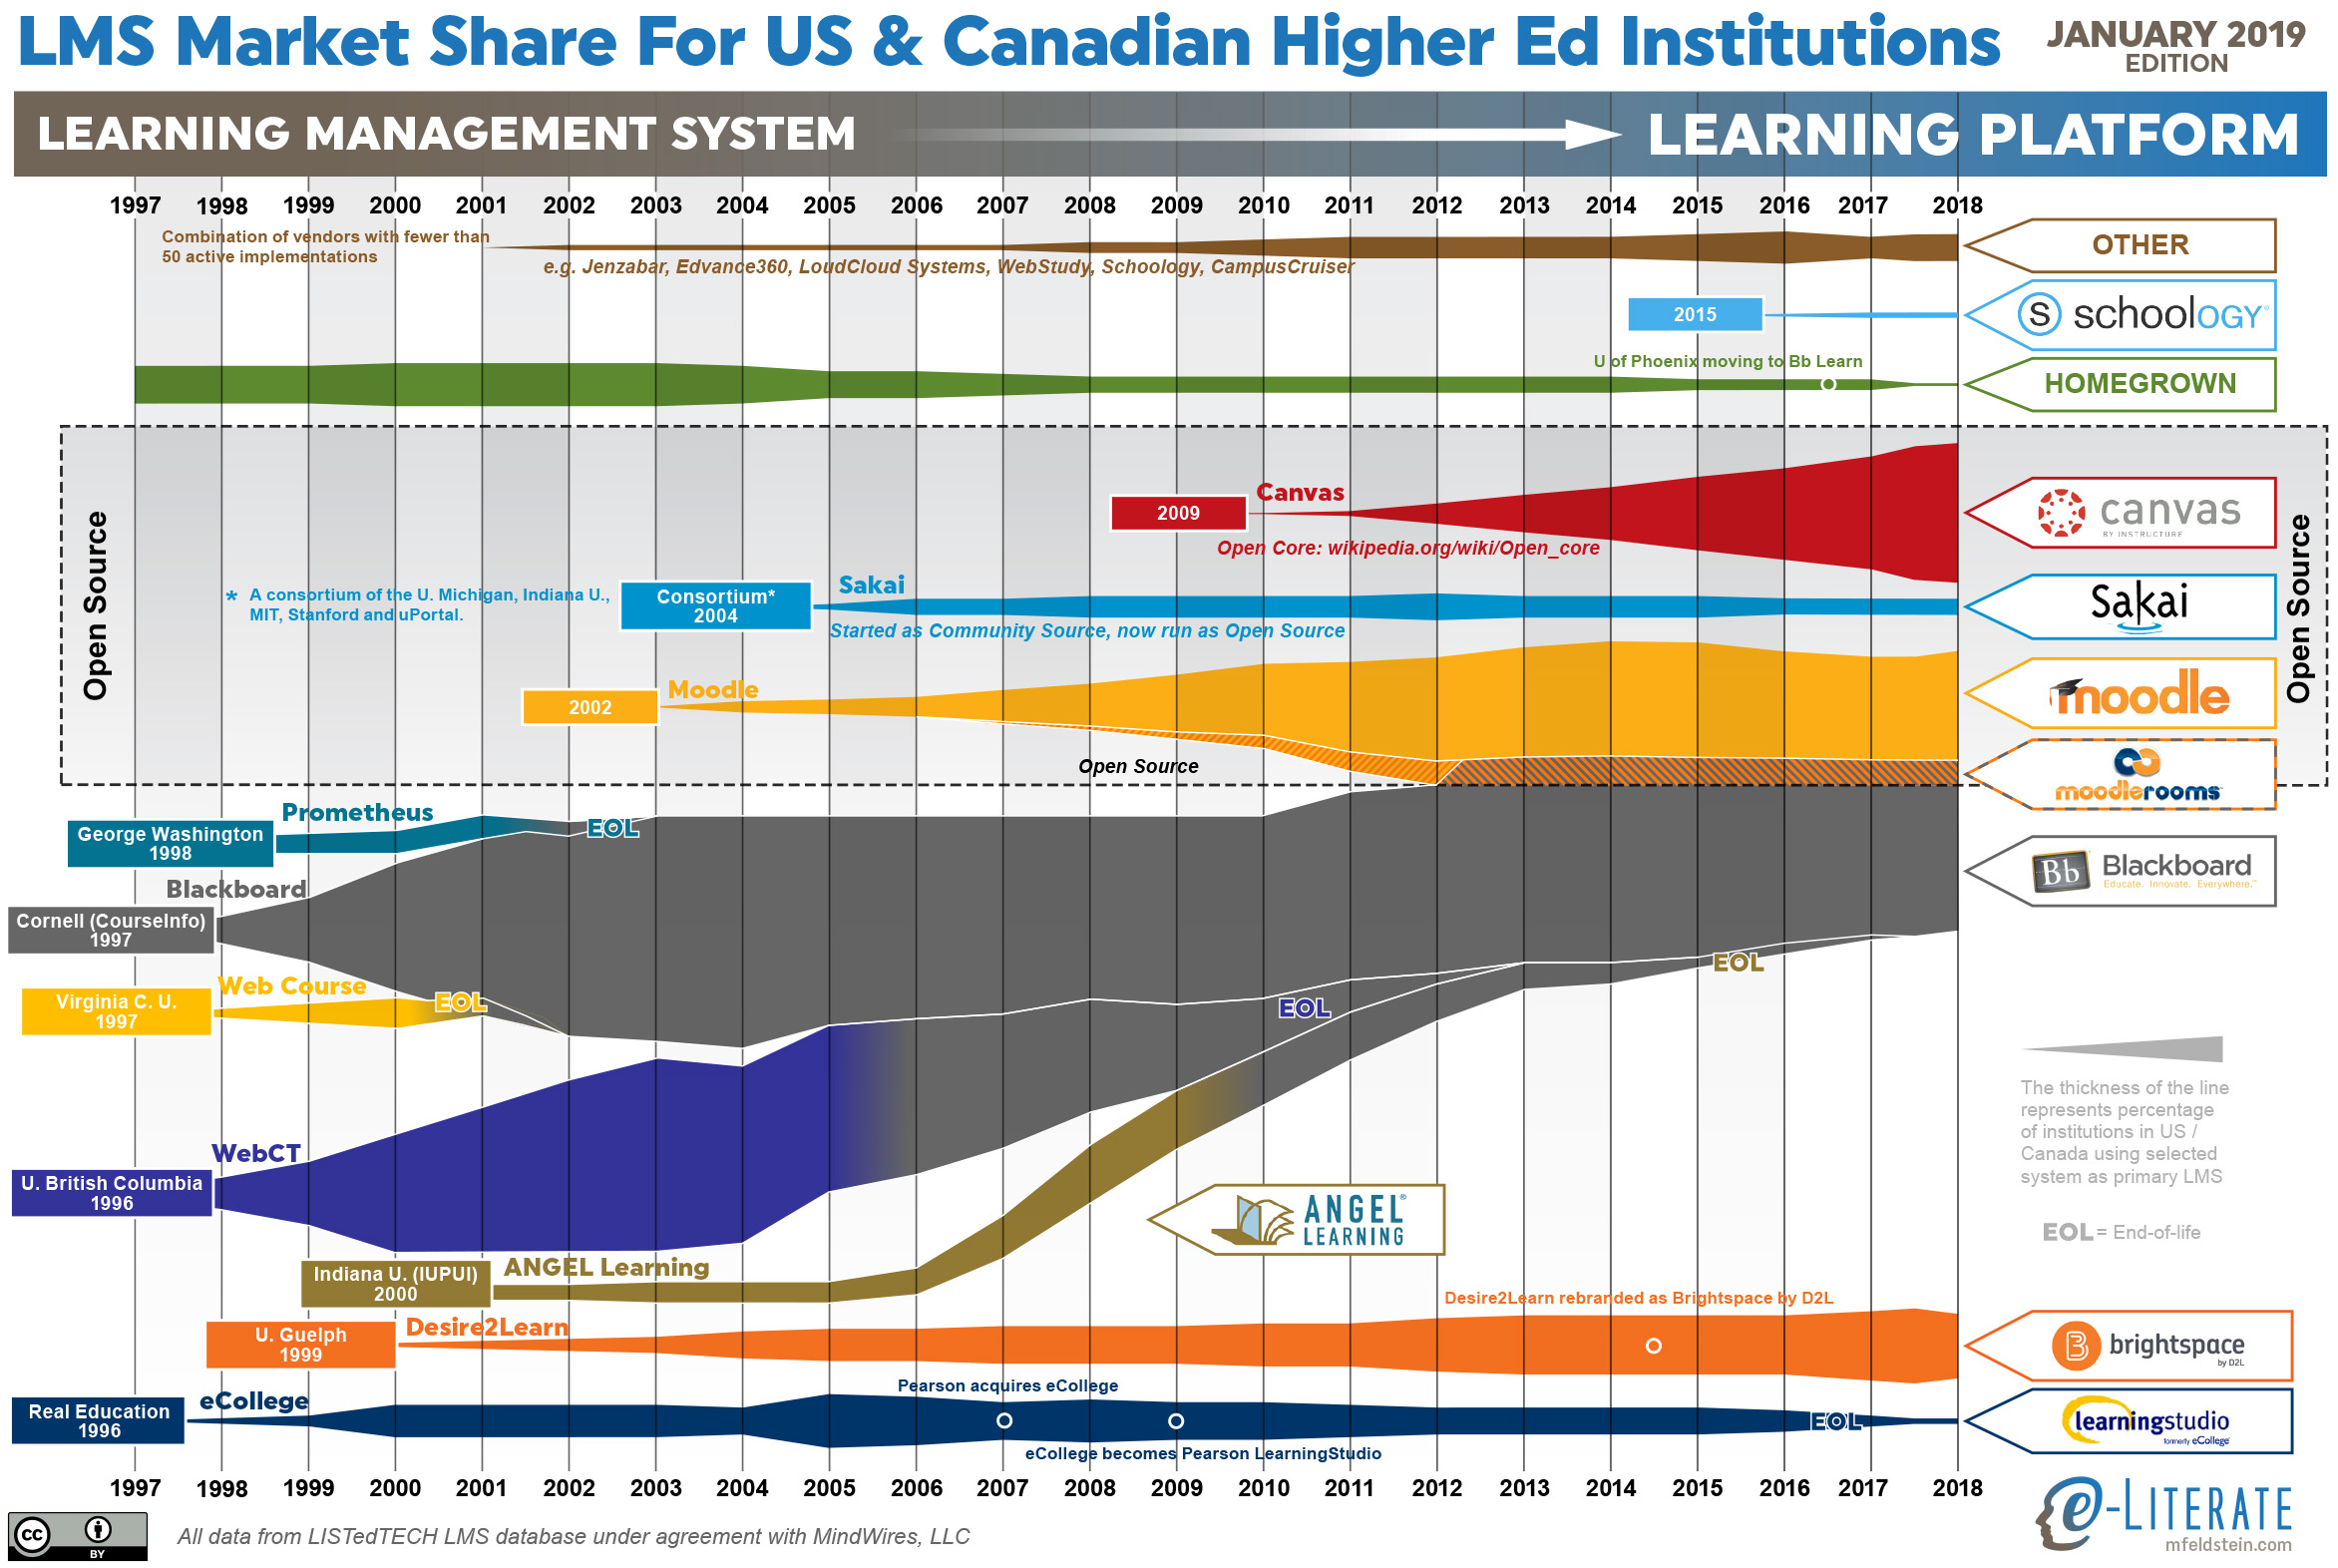
    Higher ed LMS market share for US and Canada, January 2019

    This year there are two inter-related trends that deserve a broader explanation -the LMS market slowed down with less activity overall, and Canvas and Blackboard continue to be neck-and-neck in the top spot of this market.

    We recently described the overall market activity slowdown in that there are fewer LMS formal evaluations taking place since mid 2018, with initial data pointing to a 20 – 25% drop from a year earlier. This slowdown seems to be a type of plateau rather than a continuing trend, and we are watching to see if it is temporary or not.

    Last summer we shared the symbolic passing of the torch where Canvas surpassed Blackboard in US market share, which was the first time Blackboard was not the top system since the market emerged two decades ago. What is interesting is that half a year later, the two systems are still neck-and-neck. In the US Canvas is still slightly ahead, and in North America (adding in Canada), Blackboard remains in the top spot by 0.4% (26.8% to 26.4%). Why is Canvas not continuing to extend its lead? Looking at the underlying data, there seems to be three reasons to consider:

    • The overall market slowdown means that there are fewer deals for Canvas to win lately.
    • Blackboard continues its University of Phoenix implementation, which still includes dozens of campuses despite its enrollment drop.
    • The shutdown in December of the for-profit Education Corporation of America (Virginia College and Brightwood College systems) meant that Canvas lost several dozen campuses.

    The latter two points should fully play out in the next three months, possibly making this a one-time change in trends, but it is important to call this situation out.

    Some other notes:

    • The market continues to consolidate around the Big Four – Blackboard, Canvas, D2L Brightspace, and Moodle.
    • The Homegrown option for LMS usage is going away, at least in a statistical sense. Only a handful of schools even consider this option.
    • D2L shares the challenge of having picked up several large for-profit systems that are closing campuses and therefore hurting market share. In D2L’s case, the biggest one is the former EDMC schools – the Art Institutes, Argosy University, and South University – that were sold out of bankruptcy to a non-profit entity and have closed dozens of campuses over the past year. These losses offset many of D2L’s wins in 2018.
    • Moodle had a few new wins in North America.

    Sticking with North America, we can also show LMS market share scaled by the enrollment of each institution, giving a different measure worth considering.
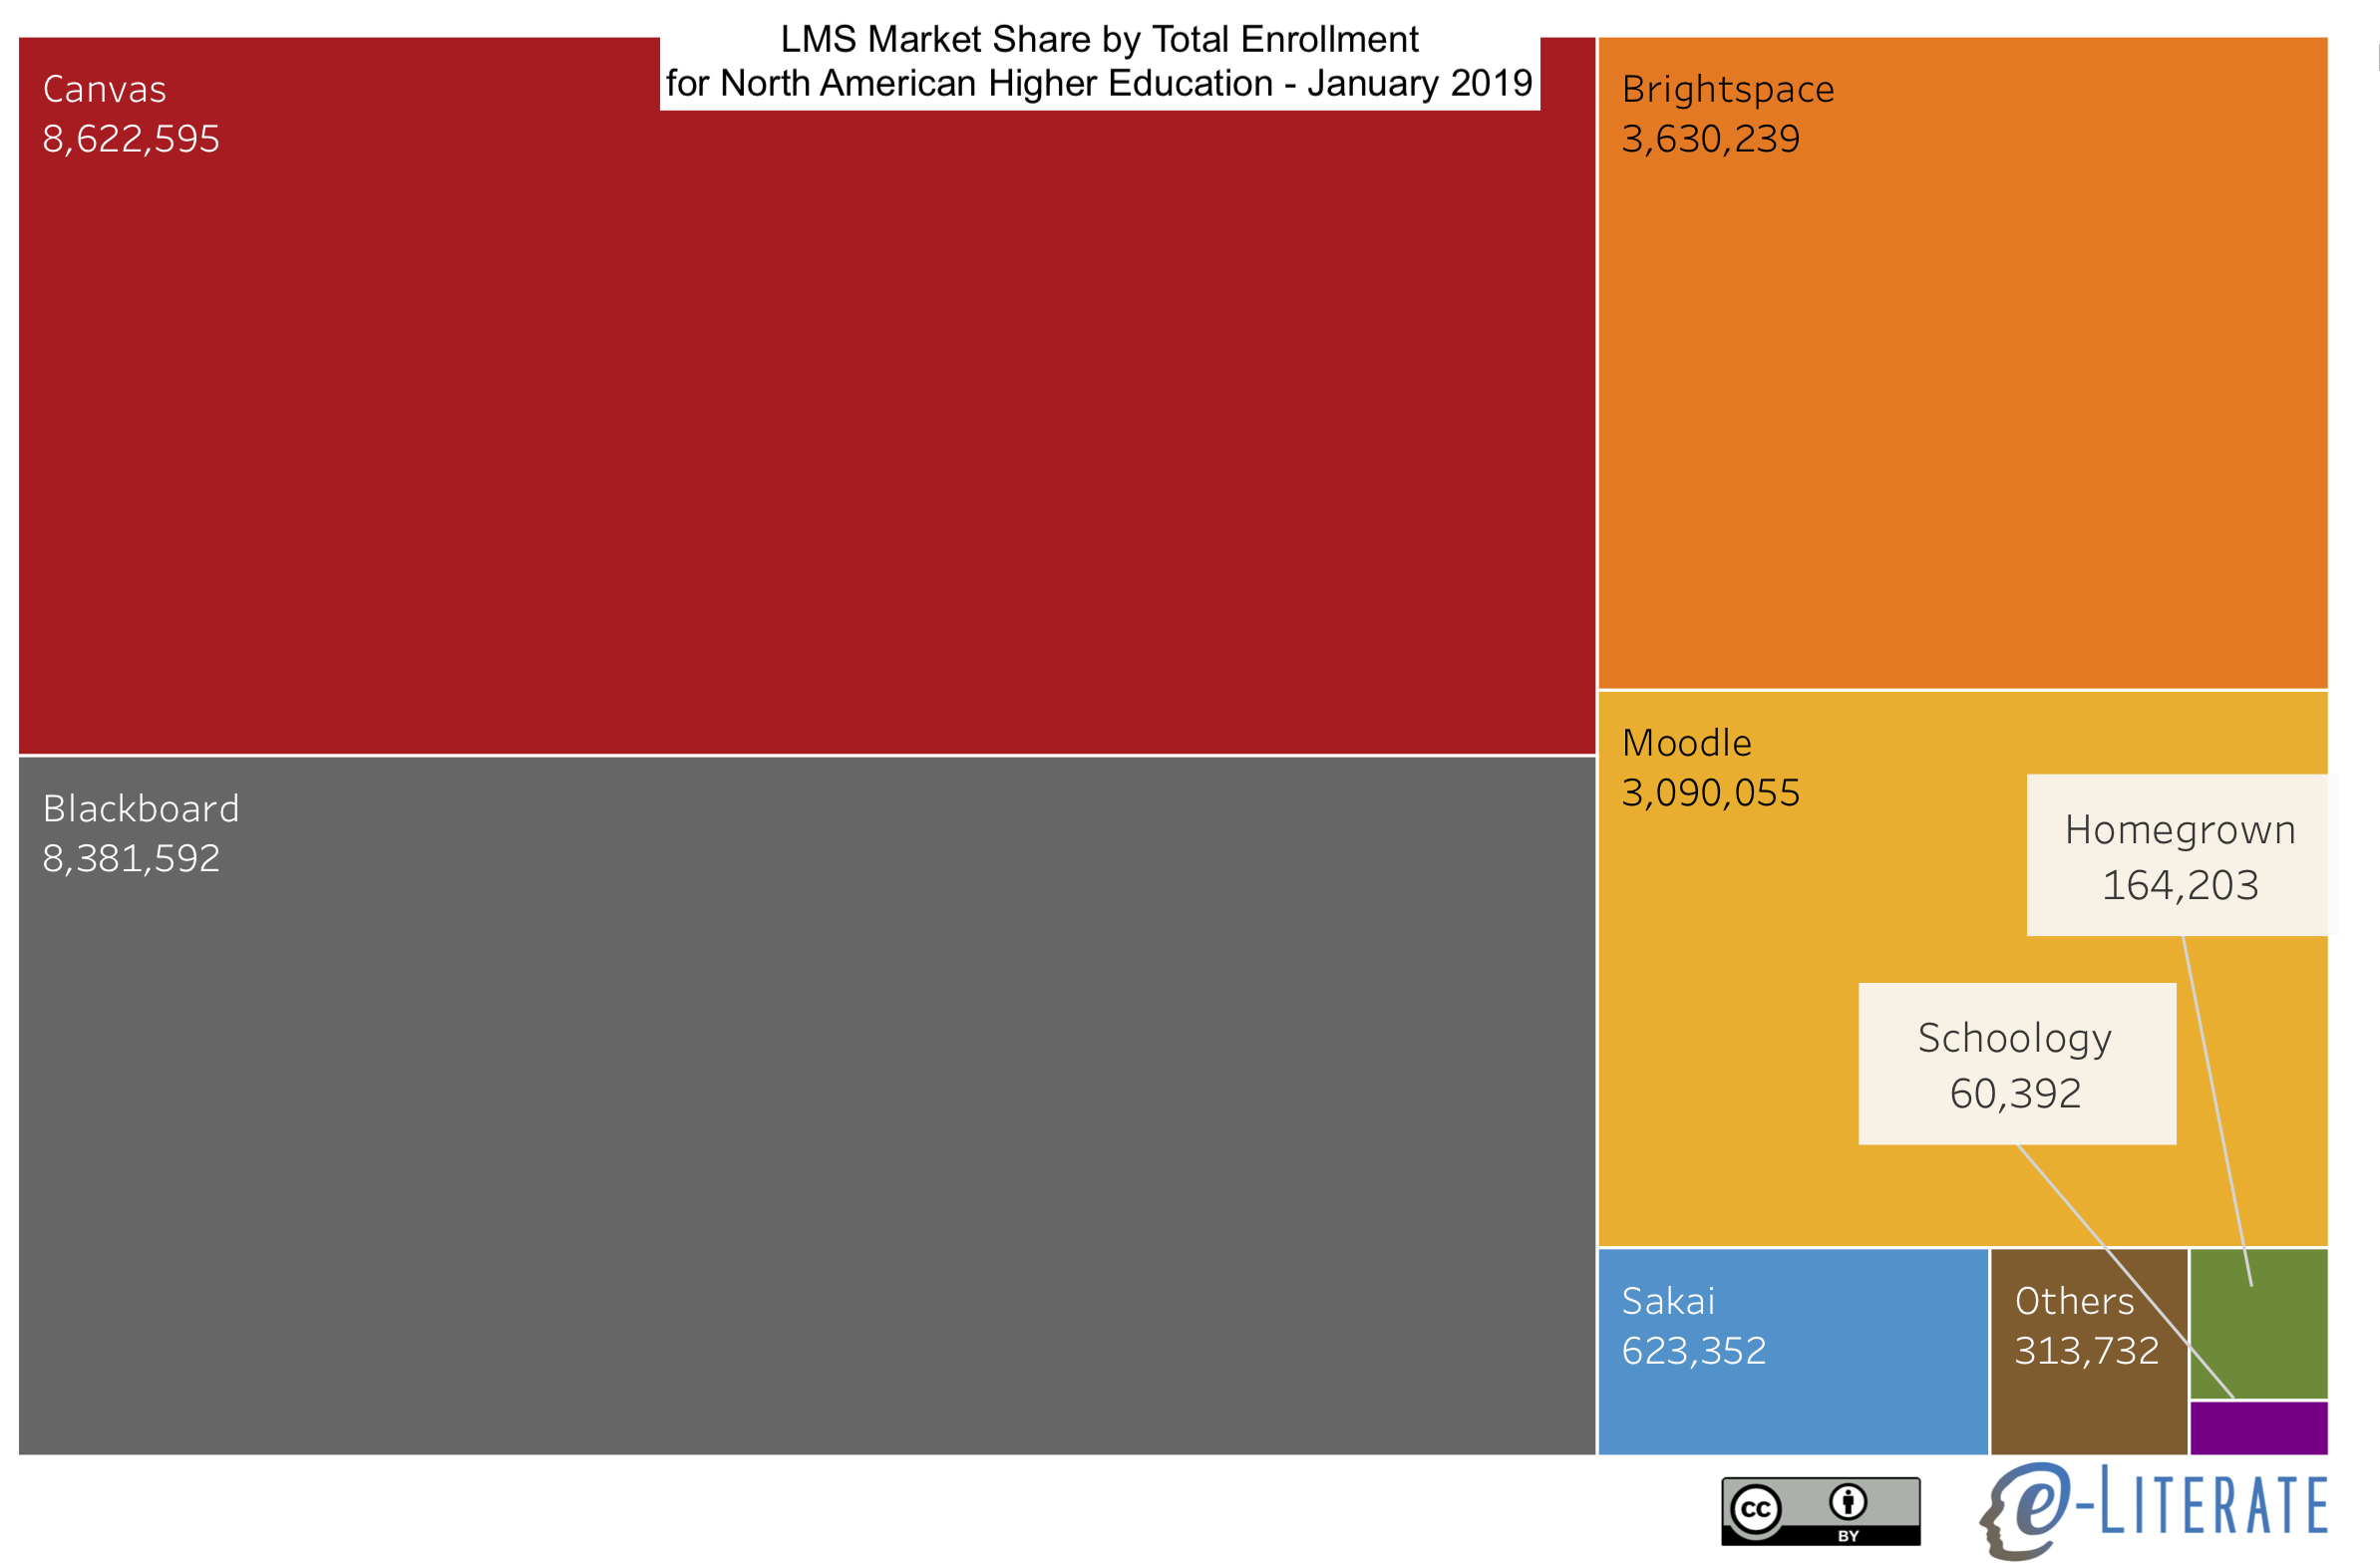
    NA LMS Market Share by Enrollment

    We’ll share more information on other global regions in the coming months.
  • Contrasting LMS Adoption Patterns in Four English-Speaking Countries

    Contrasting LMS Adoption Patterns in Four English-Speaking Countries

    The article is Cross-posted at LISTedTECH.

    One of the trends we have been covering is the gradual consolidation of global LMS markets in higher education around “the Big Four”, Moodle, Blackboard, Canvas, and D2L Brightspace. While there are market similarities in terms of this consolidation along with the broader move to the cloud, it would be a mistake to view various global regions as having the same same trends overall, even in a subset of English-speaking countries.

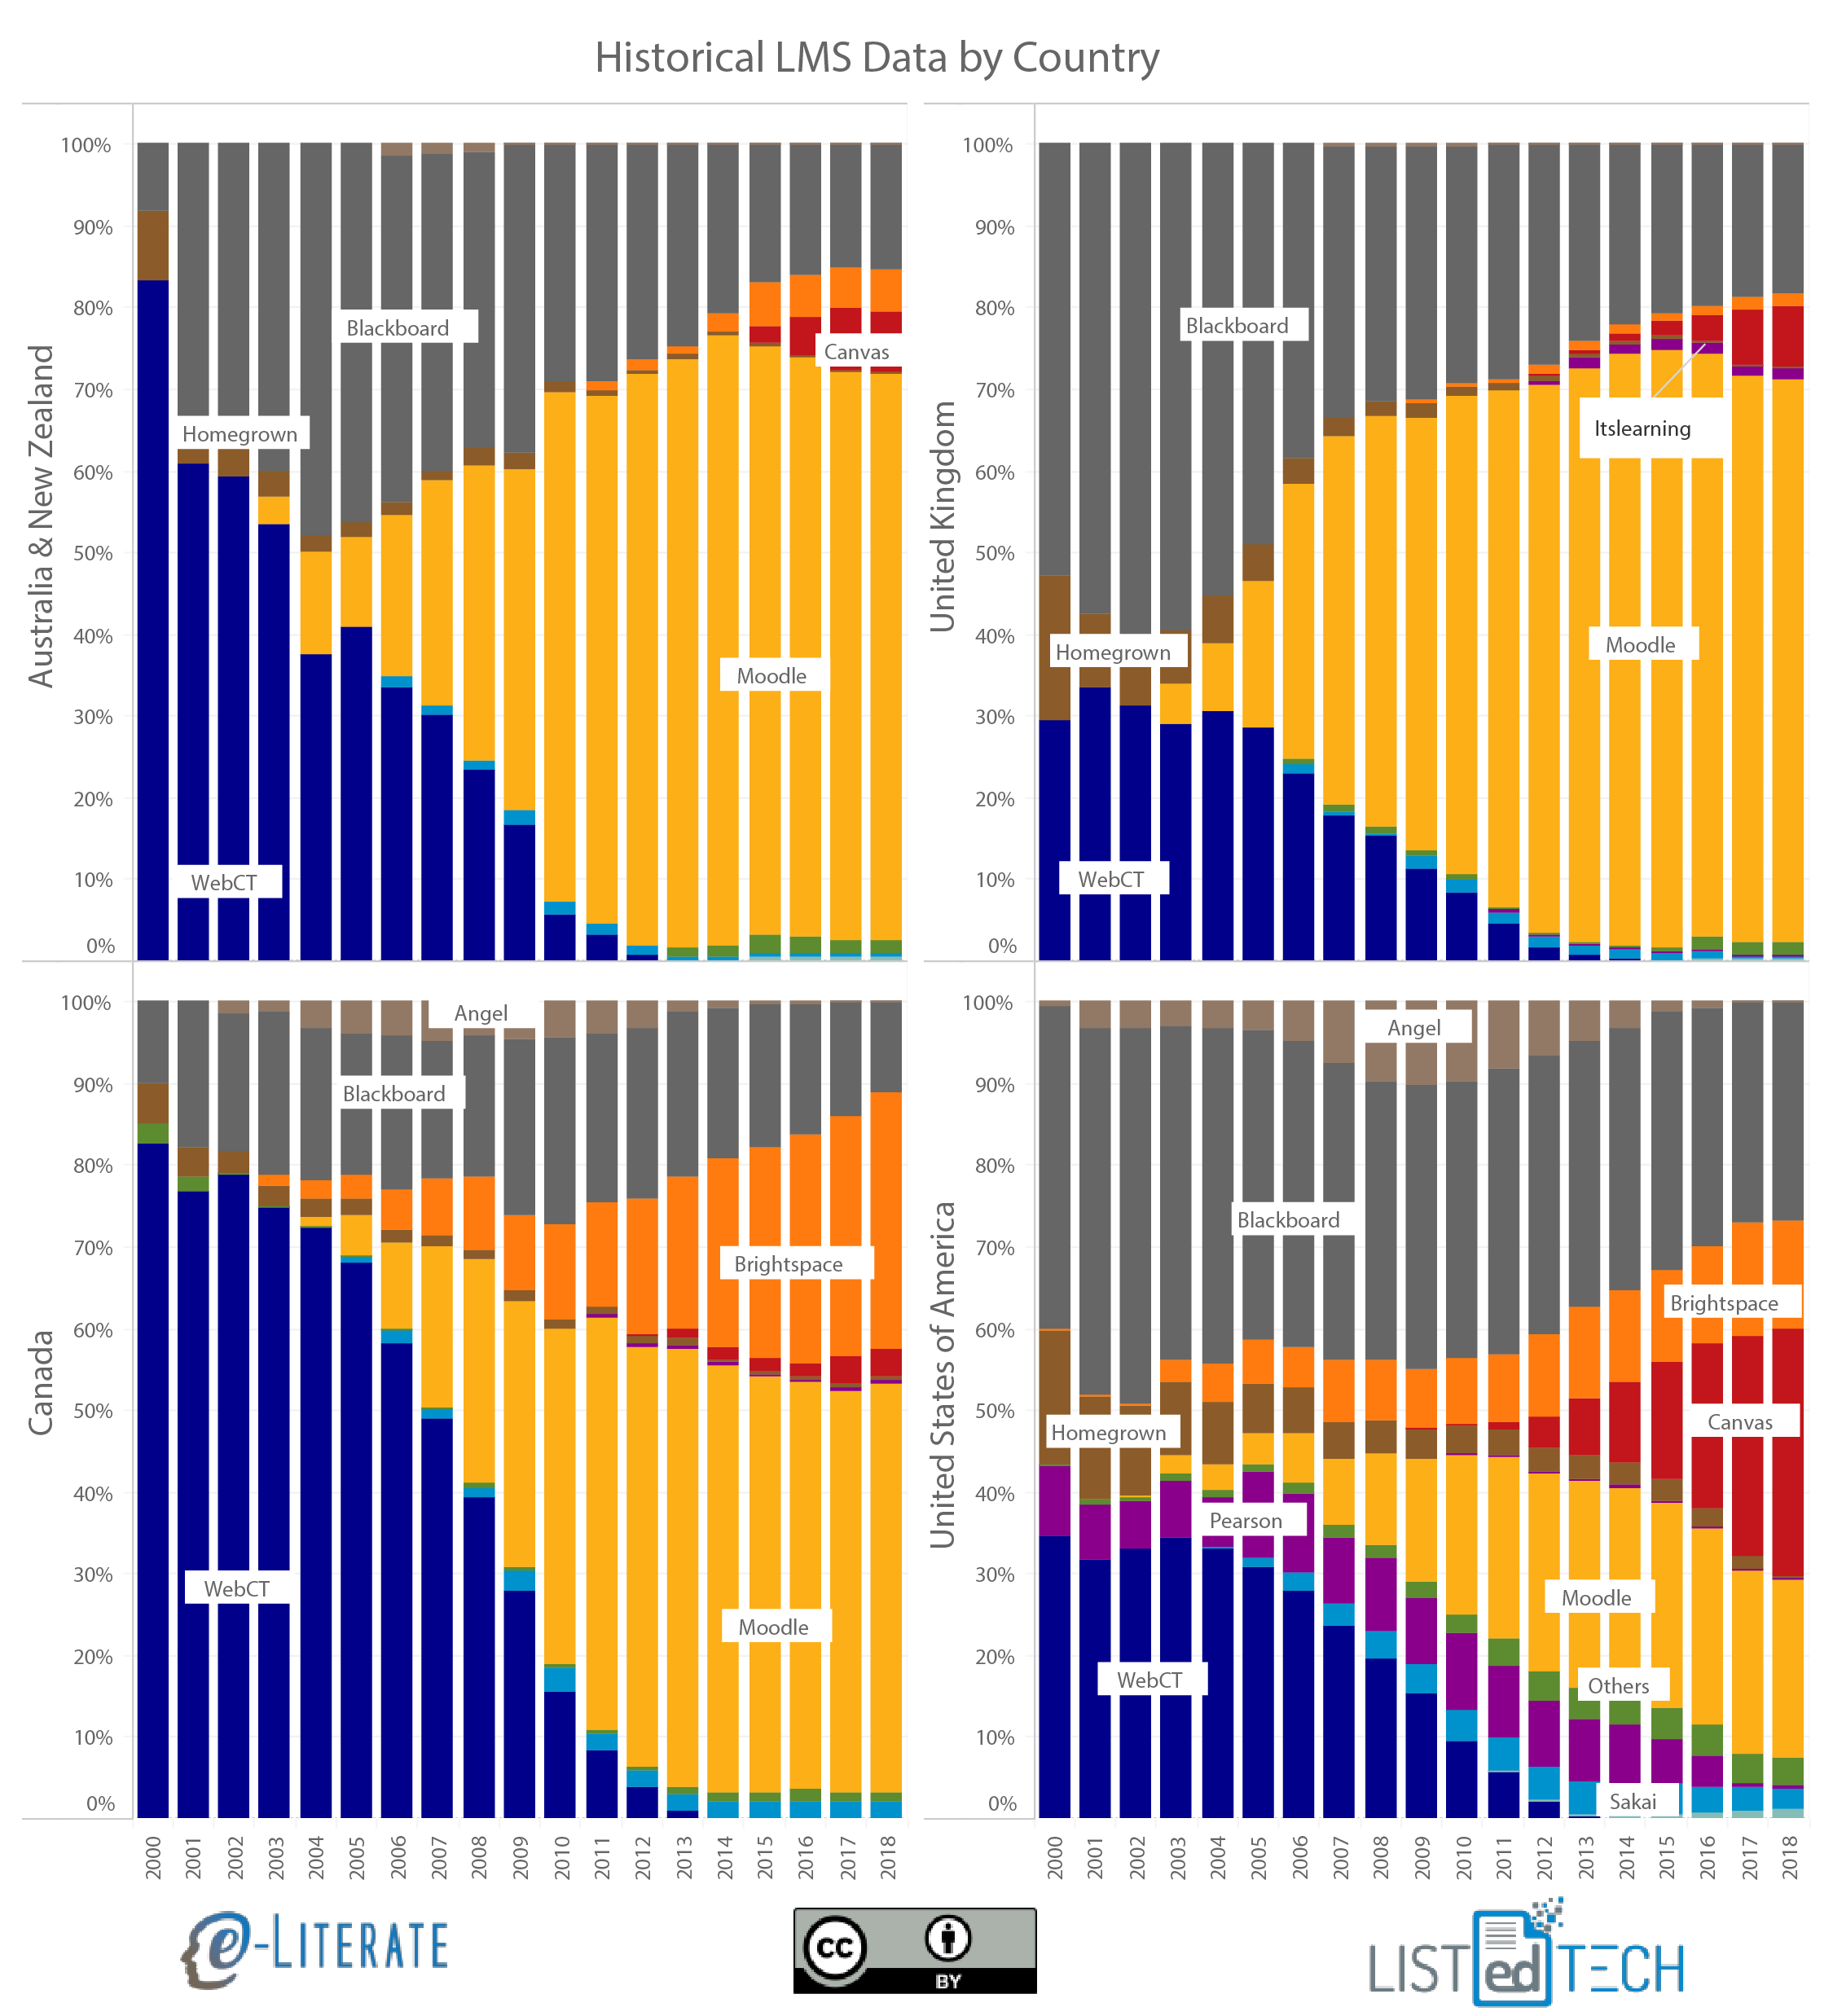
    By taking a step back and looking at institutional market share per country per year since 2000 (i.e. the percentage of higher education institutions having a particular LMS as their primary system), different adoption patterns become more apparent. In this case we’re looking at Australia / New Zealand (see note below), the United Kingdom, the US, and Canada. Note ahead of time that Blackboard acquired WebCT in 2004 and ANGEL in 2009 – this view separates out the product lines regardless of ownership, thus “Blackboard” means “Blackboard Learn / Academics Suite”. Also note that his is just one subset of the global market intended to show different patterns.

    Historical LMS adoption in US, Canada, UK, Australia & New Zealand

    • While the very early market was practically a duopoly, the preference for WebCT vs. Blackboard varied significantly.
    • Australia and New Zealand have a rich history of homegrown LMS development, including CECIL (University of Auckland in New Zealand), which some argue was the very first web-based LMS. There was still quite a bit of Homegrown LMS activity in the early 2000s along with a strong early preference for WebCT over Blackboard. Australia is the home country for Moodle (Perth), yet it lagged the UK in terms of late 2000s adoption of that system.
    • The UK showed a preference for Blackboard over WebCT, while also having significant Homegrown LMS adoptions early in the 2000s. Starting in 2003 we see the most rapid shift towards Moodle of any of these four countries, followed by a more recent move towards Canvas starting in 2013, starting with the Birmingham University adoption.
    • Canada is the home country for both WebCT (Vancouver, British Columbia) and D2L Brightspace (Kitchener, Ontario), and accordingly we see the highest percentages for both systems. This country also shows the slowest market gains for Canvas compared to the other three. Overall, early in the market, Homegrown solutions were much more common.
    • The US – home country to Blackboard, Pearson, Canvas, and Sakai –  is seen as an outlier by not having Moodle as the dominant system in terms of installed base. Pearson LearningStudio, formerly eCollege, was quite important in the US market, largely due to its position in the for-profit sector. And this is the leading country in terms of Canvas installed base and growth.

    There are other patterns to see in the data, but the overall point is to note how different adoption patterns can be in the LMS market, even for a subset of English-speaking countries since 2000. ((Disclosure: Blackboard, D2L, Moodle HQ, Instructure are all subscribers to our LMS Market Analysis service.))

    Update 27 Nov: We have duplicated the x axis to show on both levels for clarify. The data is based on number of institutions and represent running totals of active implementations where we have implementation / decommission dates – approximately 75% of all known active systems. The current totals used for each country are approximately 200 for Australia, 250 for Canada, 700 for the UK, and 3,500 for the US.

    Update 30 Nov: In an embarrassing mistake I credited CECIL to Australia when it was based at the University of Auckland in New Zealand. We have since updated the graphic to include both countries combined and edited the description of that region’s Homegrown activity. The article now combines Australia and New Zealand and treats as one country for the purposes of this analysis.

  • Comparing the First Ten Years of Blackboard and Instructure in LMS Market

    Comparing the First Ten Years of Blackboard and Instructure in LMS Market

    Last year Blackboard celebrated their 20th anniversary as a company, and this year Instructure celebrated their 10th. Yes, the company with Canvas, the “new” LMS solution, is a decade old. To gain historical perspective, it is interesting to compare each company’s first ten years in business in terms of primary financials – revenue and income – and performance in their core North American Higher Education market.

    We can only go so far in comparing the companies on this basis, however, due to different circumstances.

    • Most importantly, Blackboard helped create the LMS market and therefore had significant portion of its expansion in a greenfield situation, picking up clients who had not previously used an institution-wide LMS. Canvas entered the market well after saturation, with greater than 90% of institutions already having a standard LMS.
    • Blackboard developed its product line pre-cloud, with on-premise hosting being the primary deployment model. Canvas was cloud-native, developed on top of AWS infrastructure.
    • Blackboard’s growth was heavily based on corporate acquisition of competitors – Prometheus, WebCourse, WebCT in the first decade – while Instructure’s growth has been almost exclusively organic.
    • Both companies sold in more than just the North American Higher Ed (NAHE) LMS market, even if that was the core. Blackboard acquired two companies in 2000 and launched a card-reader transaction business, and they played somewhat in the K-12 and corporate learning space. Instructure developed Bridge for corporate learning, Arc for video platform, and it has a heavy presence in the K-12 LMS market.

    Interestingly, both companies went public in Year 7 (Blackboard in 2004, Instructure in 2015).

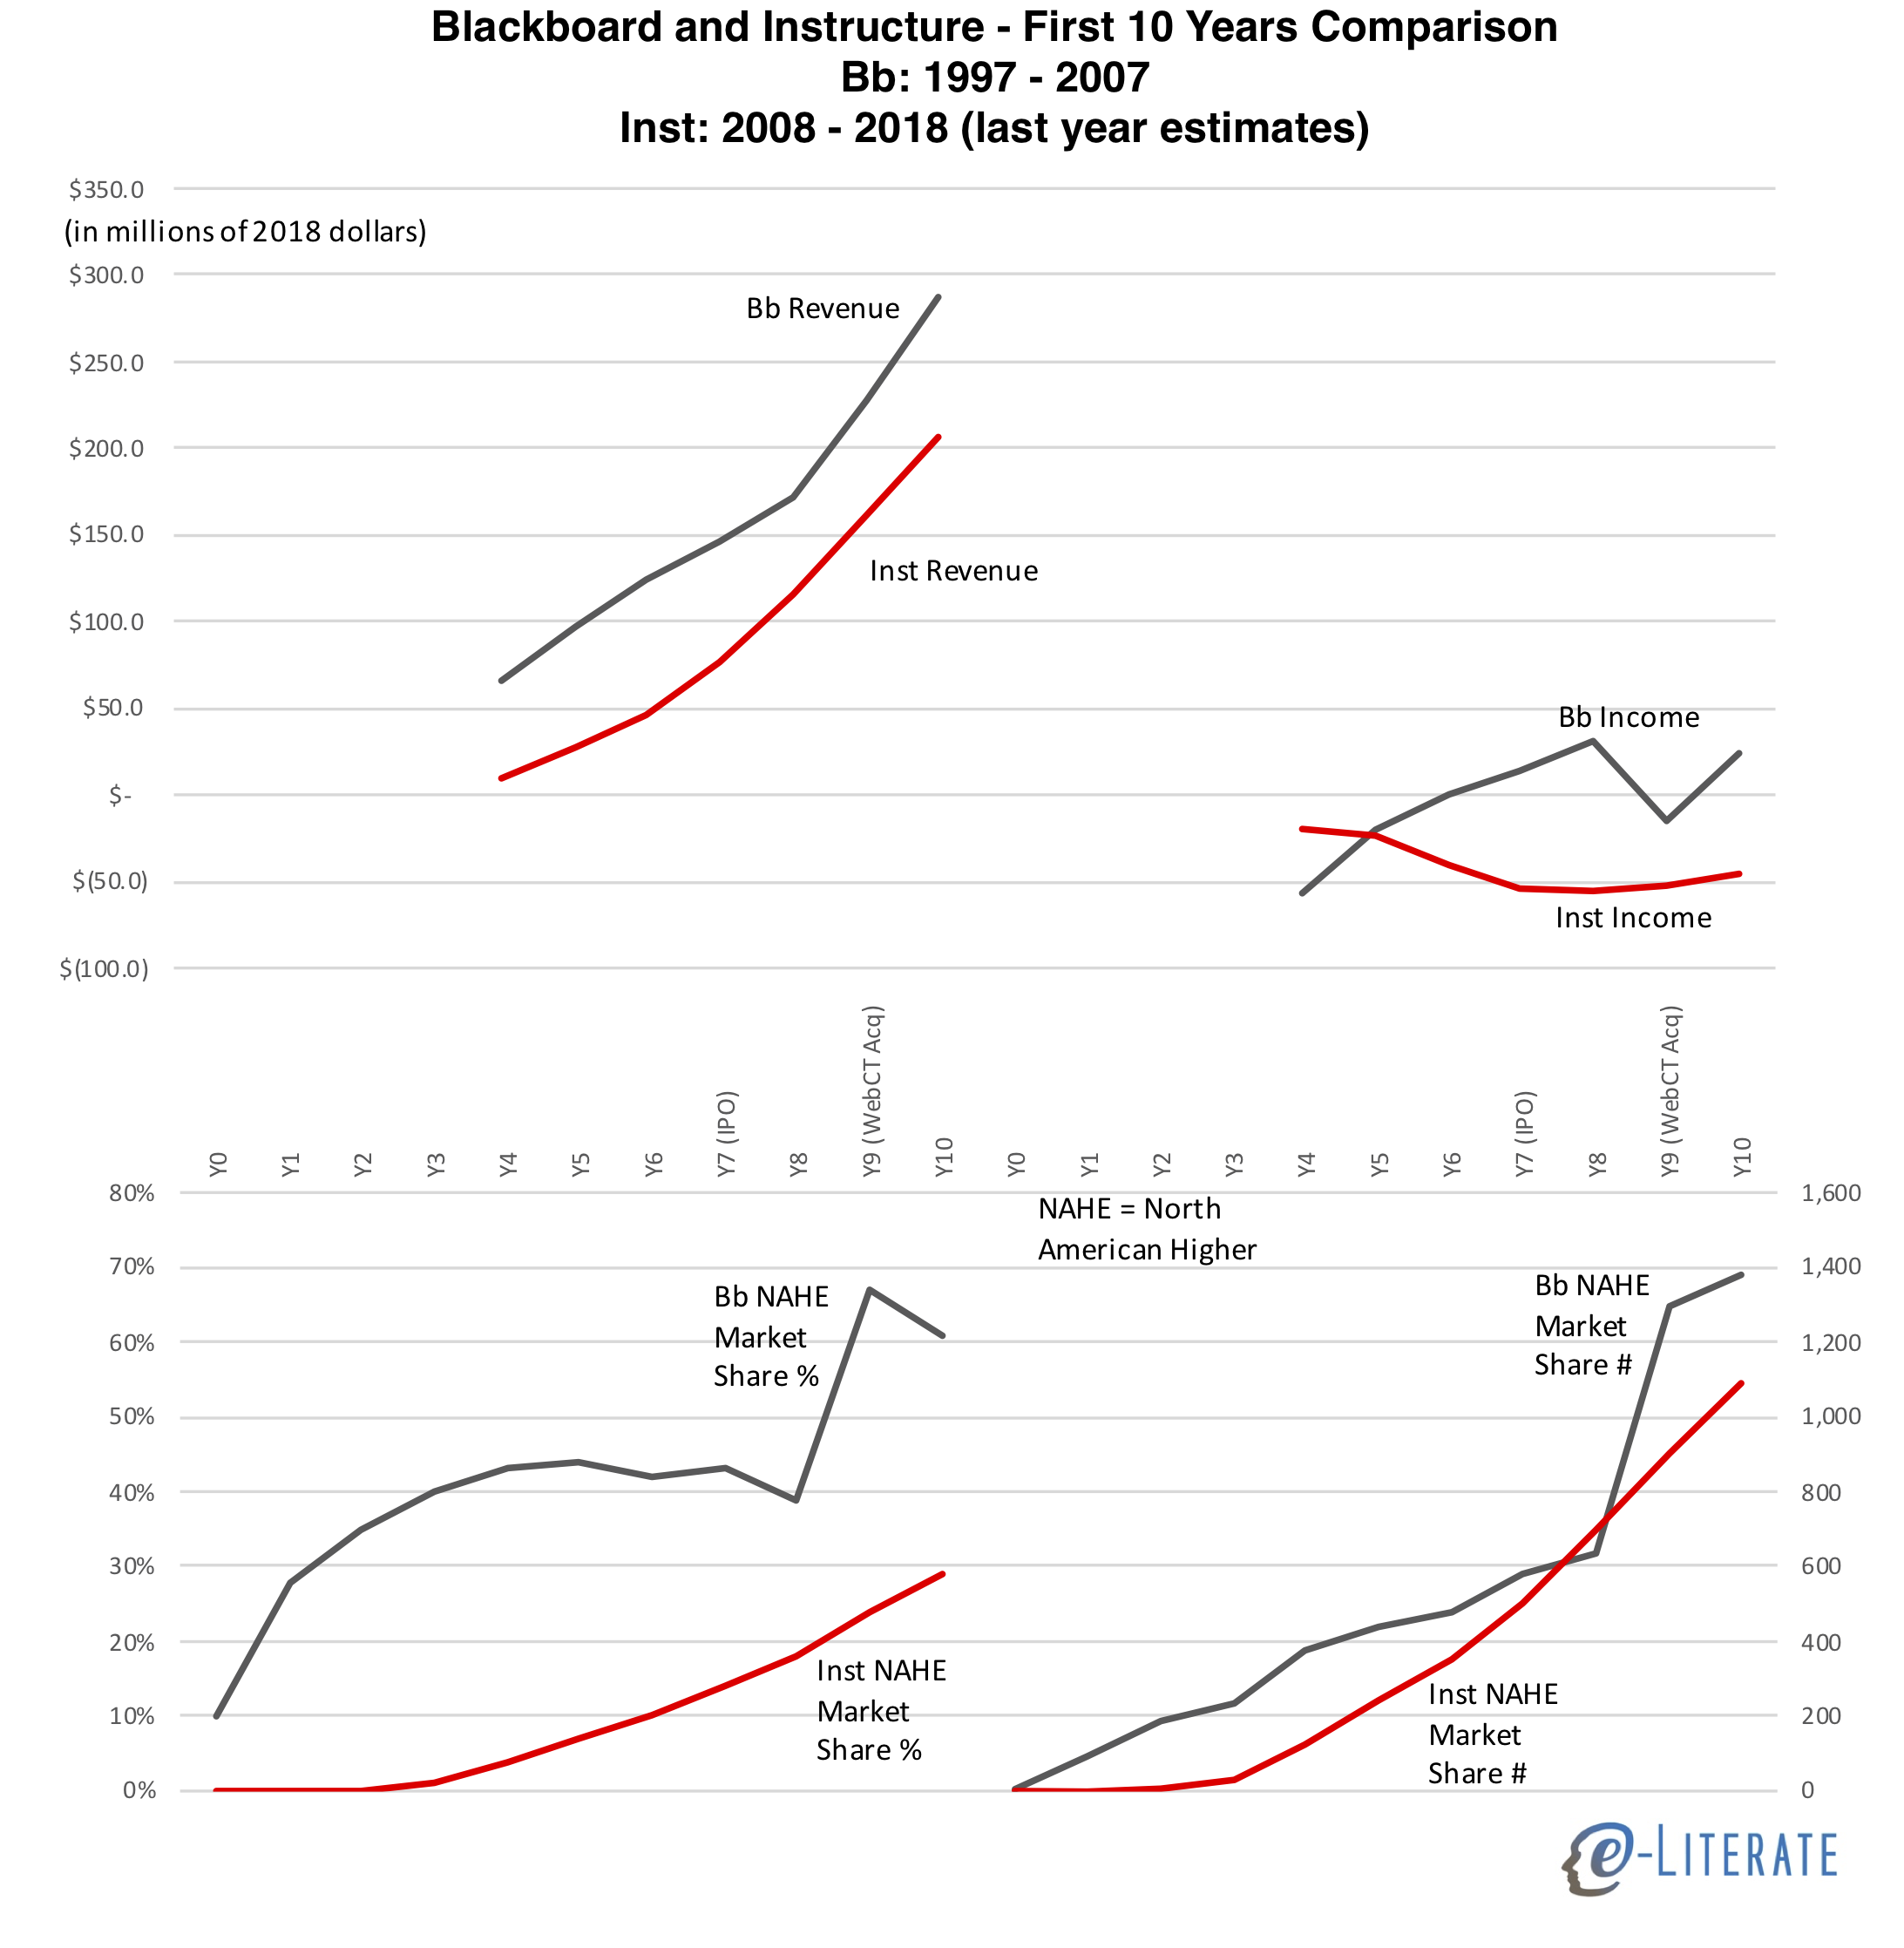
    With that in mind, let’s compare revenue, operating income – both derived from public SEC filings and adjusted to 2018 dollars – and market share in their core NAHE market. The financial data comes from public filings, and data for 2018 for Instructure are estimates based on their outlook presented in the most recent quarterly earnings release. Market share data is based on our LMS Market Analysis service and associated financial analysis for premium subscribers.

    Blackboard and Instructure revenue and income in 2018 dollars, and north american higher ed market share in percentage and numbers

    Some notes:

    • Blackboard raised ~$185 million in venture financing pre-IPO while Instructure raised ~$95 million (both in 2018 dollars). Part of this difference can be attributed to the much higher costs associated with pre-cloud enterprise software deployment models.
    • Blackboard’s revenue was higher than Instructure’s at similar points, and their operating income was mostly positive after Year 6. Instructure has maintained a significant loss each year from operations. One way to explain this difference is that Blackboard’s used funds for corporate acquisitions, thus fueling growth, while Instructure invested funds into sales & marketing and organic growth. This is not the whole story, but it is a big difference between the two companies.
    • In market share represented as a percentage, Blackboard’s growth was much faster, but this was in a period where the market was developing and not all schools had a standard LMS. When viewing this market share in raw numbers, we see that Instructure’s growth would have exceeded Blackboard’s were it not for the Year 9 WebCT acquisition.
    • Blackboard was already showing organic market declines (in NAHE market share %) and slowdowns in raw numbers outside of the immediate WebCT acquisition of customers. Instructure’s organic growth shows no signs yet of slowing down, is less lumpy and more predictable.


  • State of Higher Ed LMS Market for US and Canada: Fall 2017 Edition

    State of Higher Ed LMS Market for US and Canada: Fall 2017 Edition

    Now that we’re past the 2017 WCET conference and headed to the EDUCAUSE conference, let’s look at updates on the institutional LMS market for North America (US and Canada). Last year we started our LMS market analysis service, where we are working with LISTedTECH to provide market data and visualizations, and our fall report for subscribers will be released in about a month. Data for 2017 presented below goes through October 1 of this year.

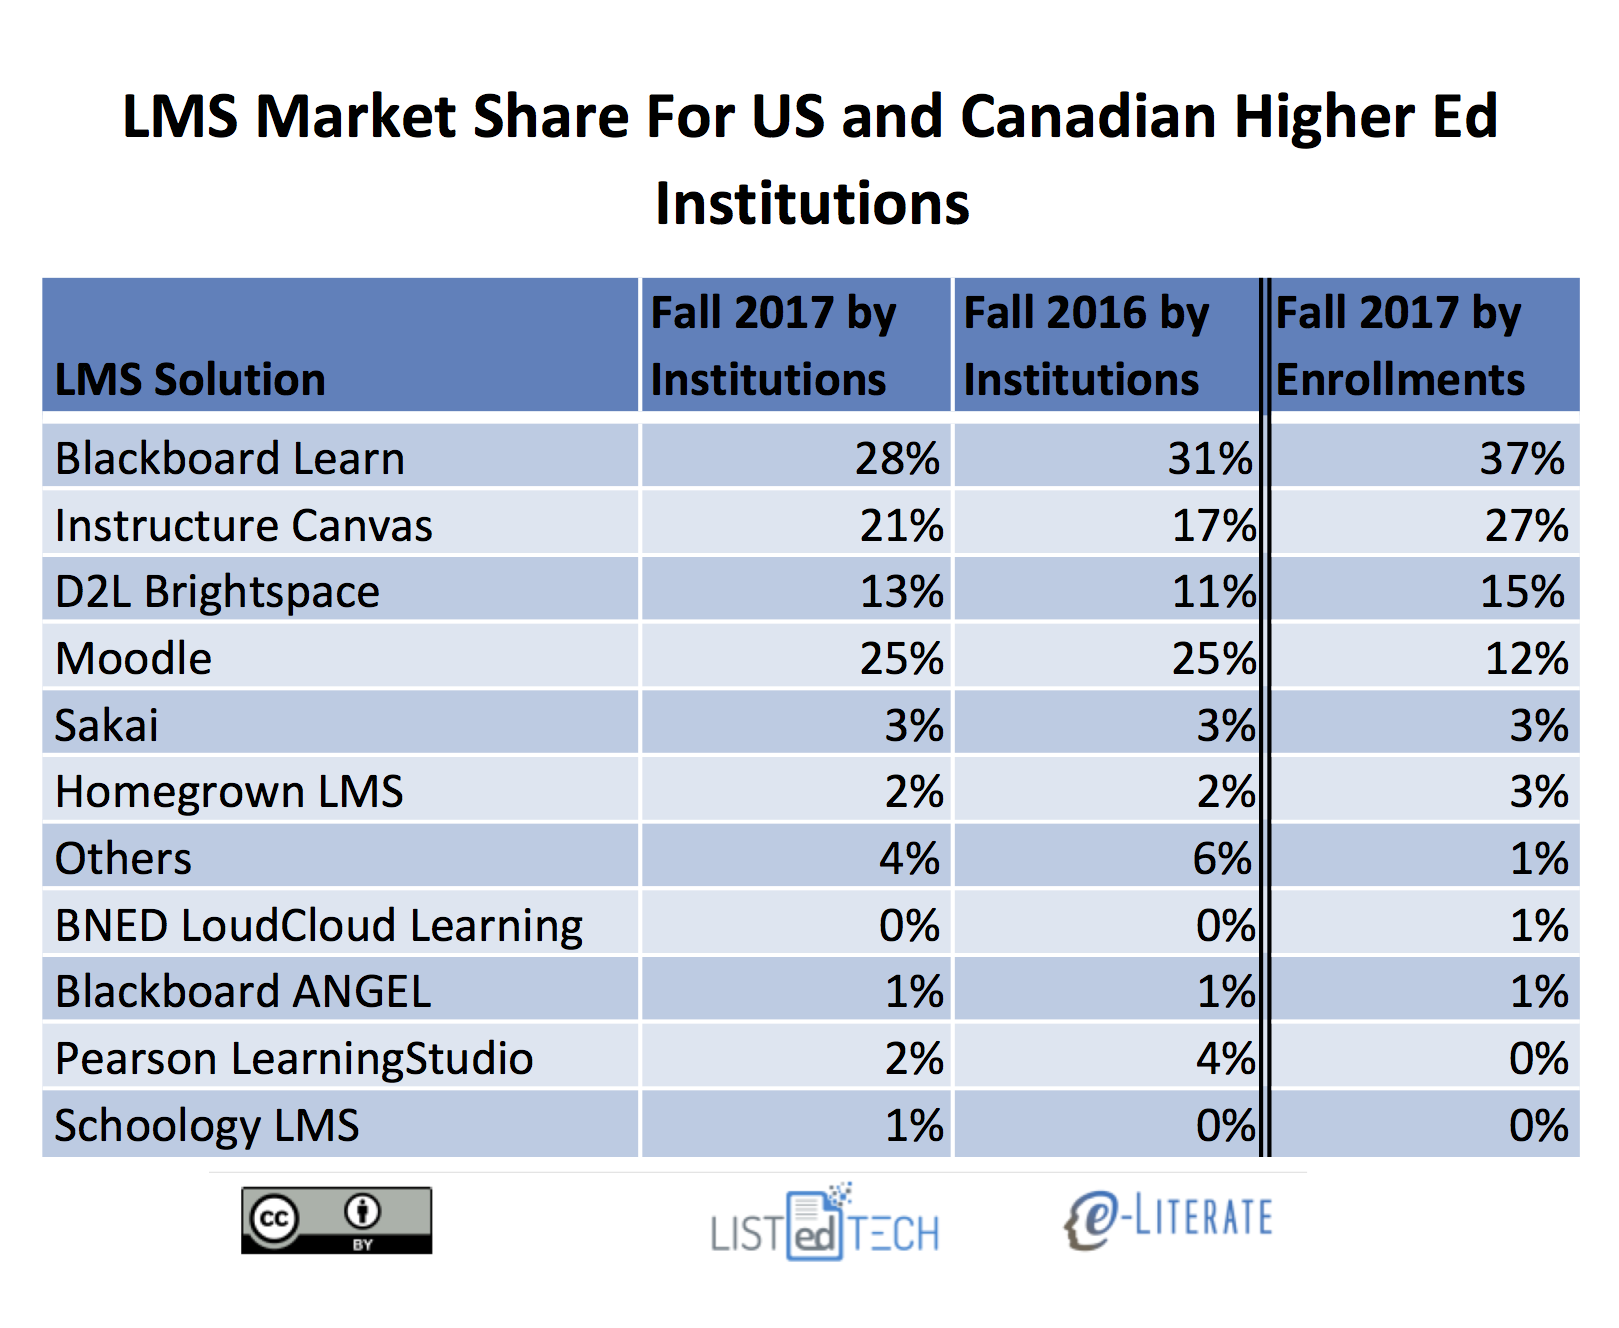
    We present the data “by institutions”, with market share as a percentage of the total number of institutions using each LMS as a primary system, and “by enrollments”, where we scale the institutions by their total enrollment. The latter better captures the business of the LMS market, since most licensing deals are based the number of students. We have also included data from Fall 2016 by institutions for comparison purposes.

    Some notes on the market share as defined by percentage of institutions:

    • In terms of new selections the market continues to be a two-horse race recently with Canvas by Instructure and Brightspace by D2L as the only two solutions with material gains in market share. Canvas grew from 17% to 21% , and Brightspace from 11% to 13%, of the market.
    • Outside of the big four – Blackboard Learn, Canvas, D2L Brightspace, and Moodle – no other system has more than 3% of the market measured either by percentage of institutions or percentage of enrollments. Furthermore, the category of “Others”, capturing systems not listed above and having less than 1% market share, actually dropped from 4% to 2% of the market. This indicates that continued market consolidation.
    • Schoology and BNED LoudCloud grew slightly, but not nearly to the degree of the Canvas and Brightspace.
    • Blackboard Learn fell the farthest, from 31% to 28% of of the market. The second biggest drop was Pearson LearningStudio, from 4% to 2%, based on its end-of-life notice for December 2017.
    • Moodle and Sakai both lost market share of just under 1%, not enough to show up in the rounded numbers in the table but enough to show up in our underlying data.
    • The difference in Moodle’s market share by institutions at 25% and by enrollments at 12% really shows how concentrated their usage is for smaller schools.
    • When viewing market share as defined by percentage of enrollments, Blackboard and Canvas are the most-used systems, at 37% and 27% of the market, followed by D2L at 15% and Moodle at 12%.

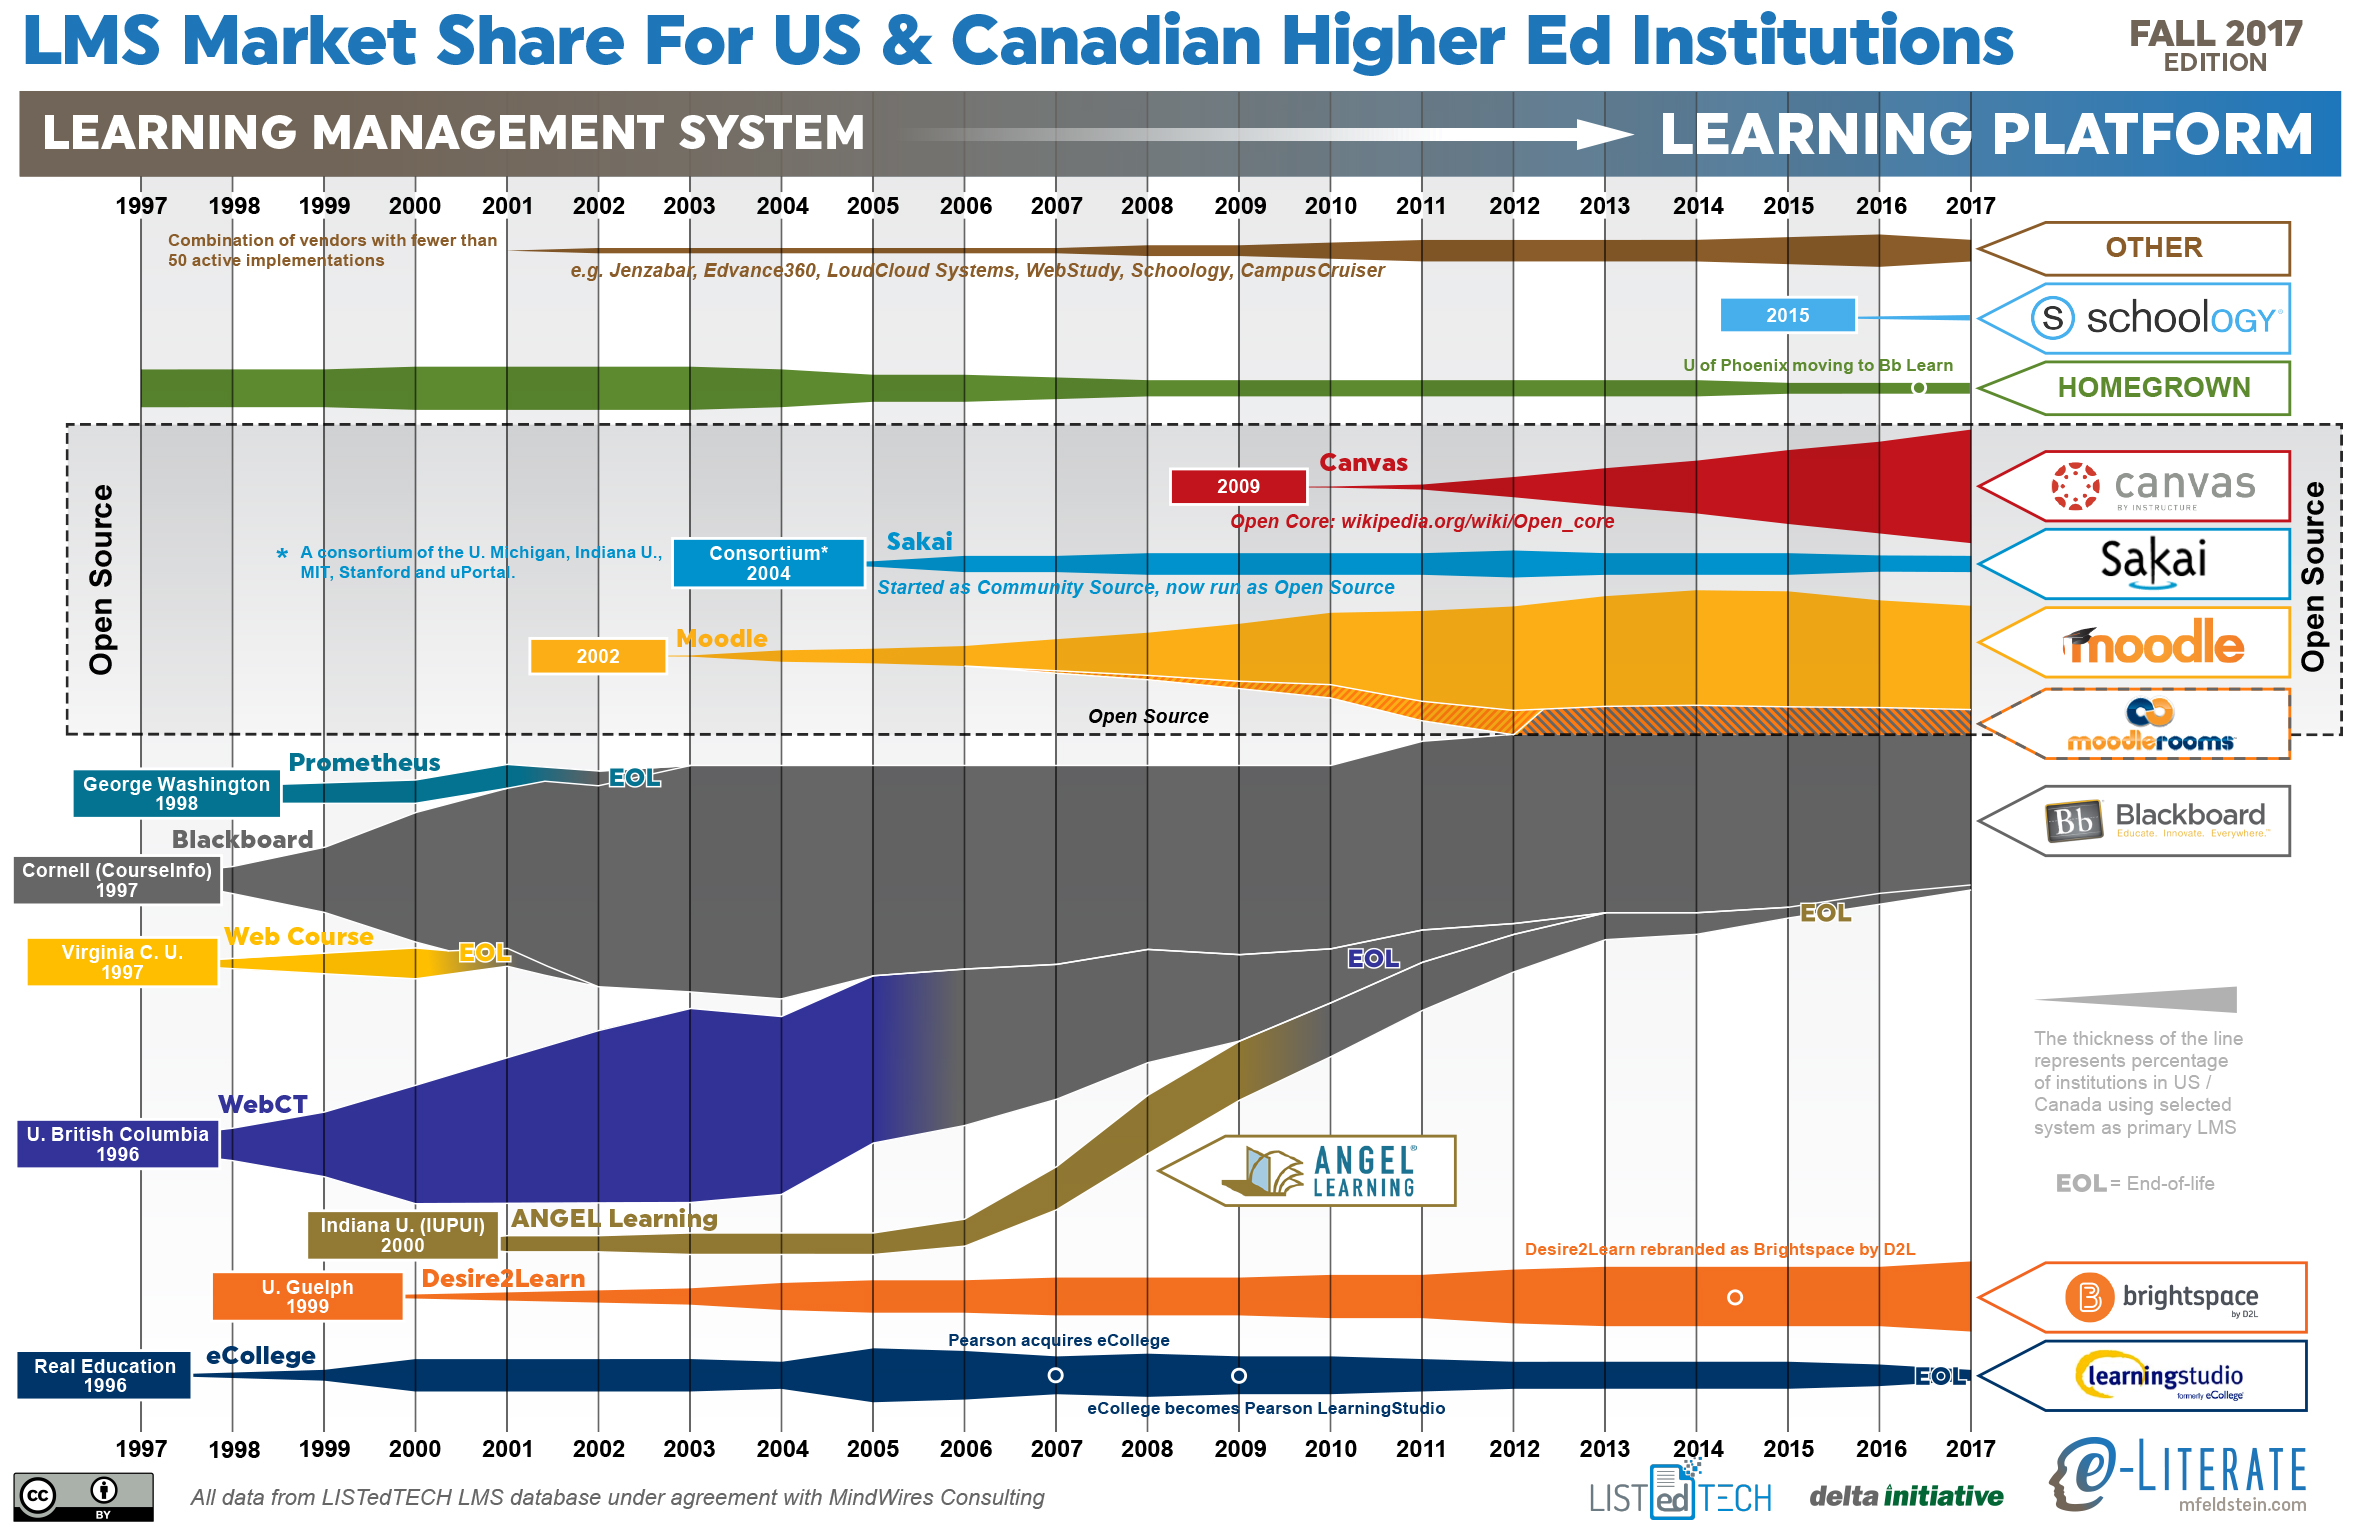
    Stepping back from the immediate data, let’s look at an updated LMS market share graphic, commonly known as the squid graphic, for US and Canadian higher education. The original idea remains – to give a picture of the LMS market in one page, highlighting the story of the market over time. The key to the graphic is that the width of each band represents the percentage of institutions using a particular LMS as its primary system.

    Some additional notes:

    • Blackboard and Moodle have been the market leaders as number one and two in share as they have been for the past decade. However, Canvas is quickly approaching Moodle’s market share.

    We’ll share any updates we discover at the conference this week.

  • State of Higher Ed LMS Market for US and Canada: Spring 2017 Edition

    State of Higher Ed LMS Market for US and Canada: Spring 2017 Edition

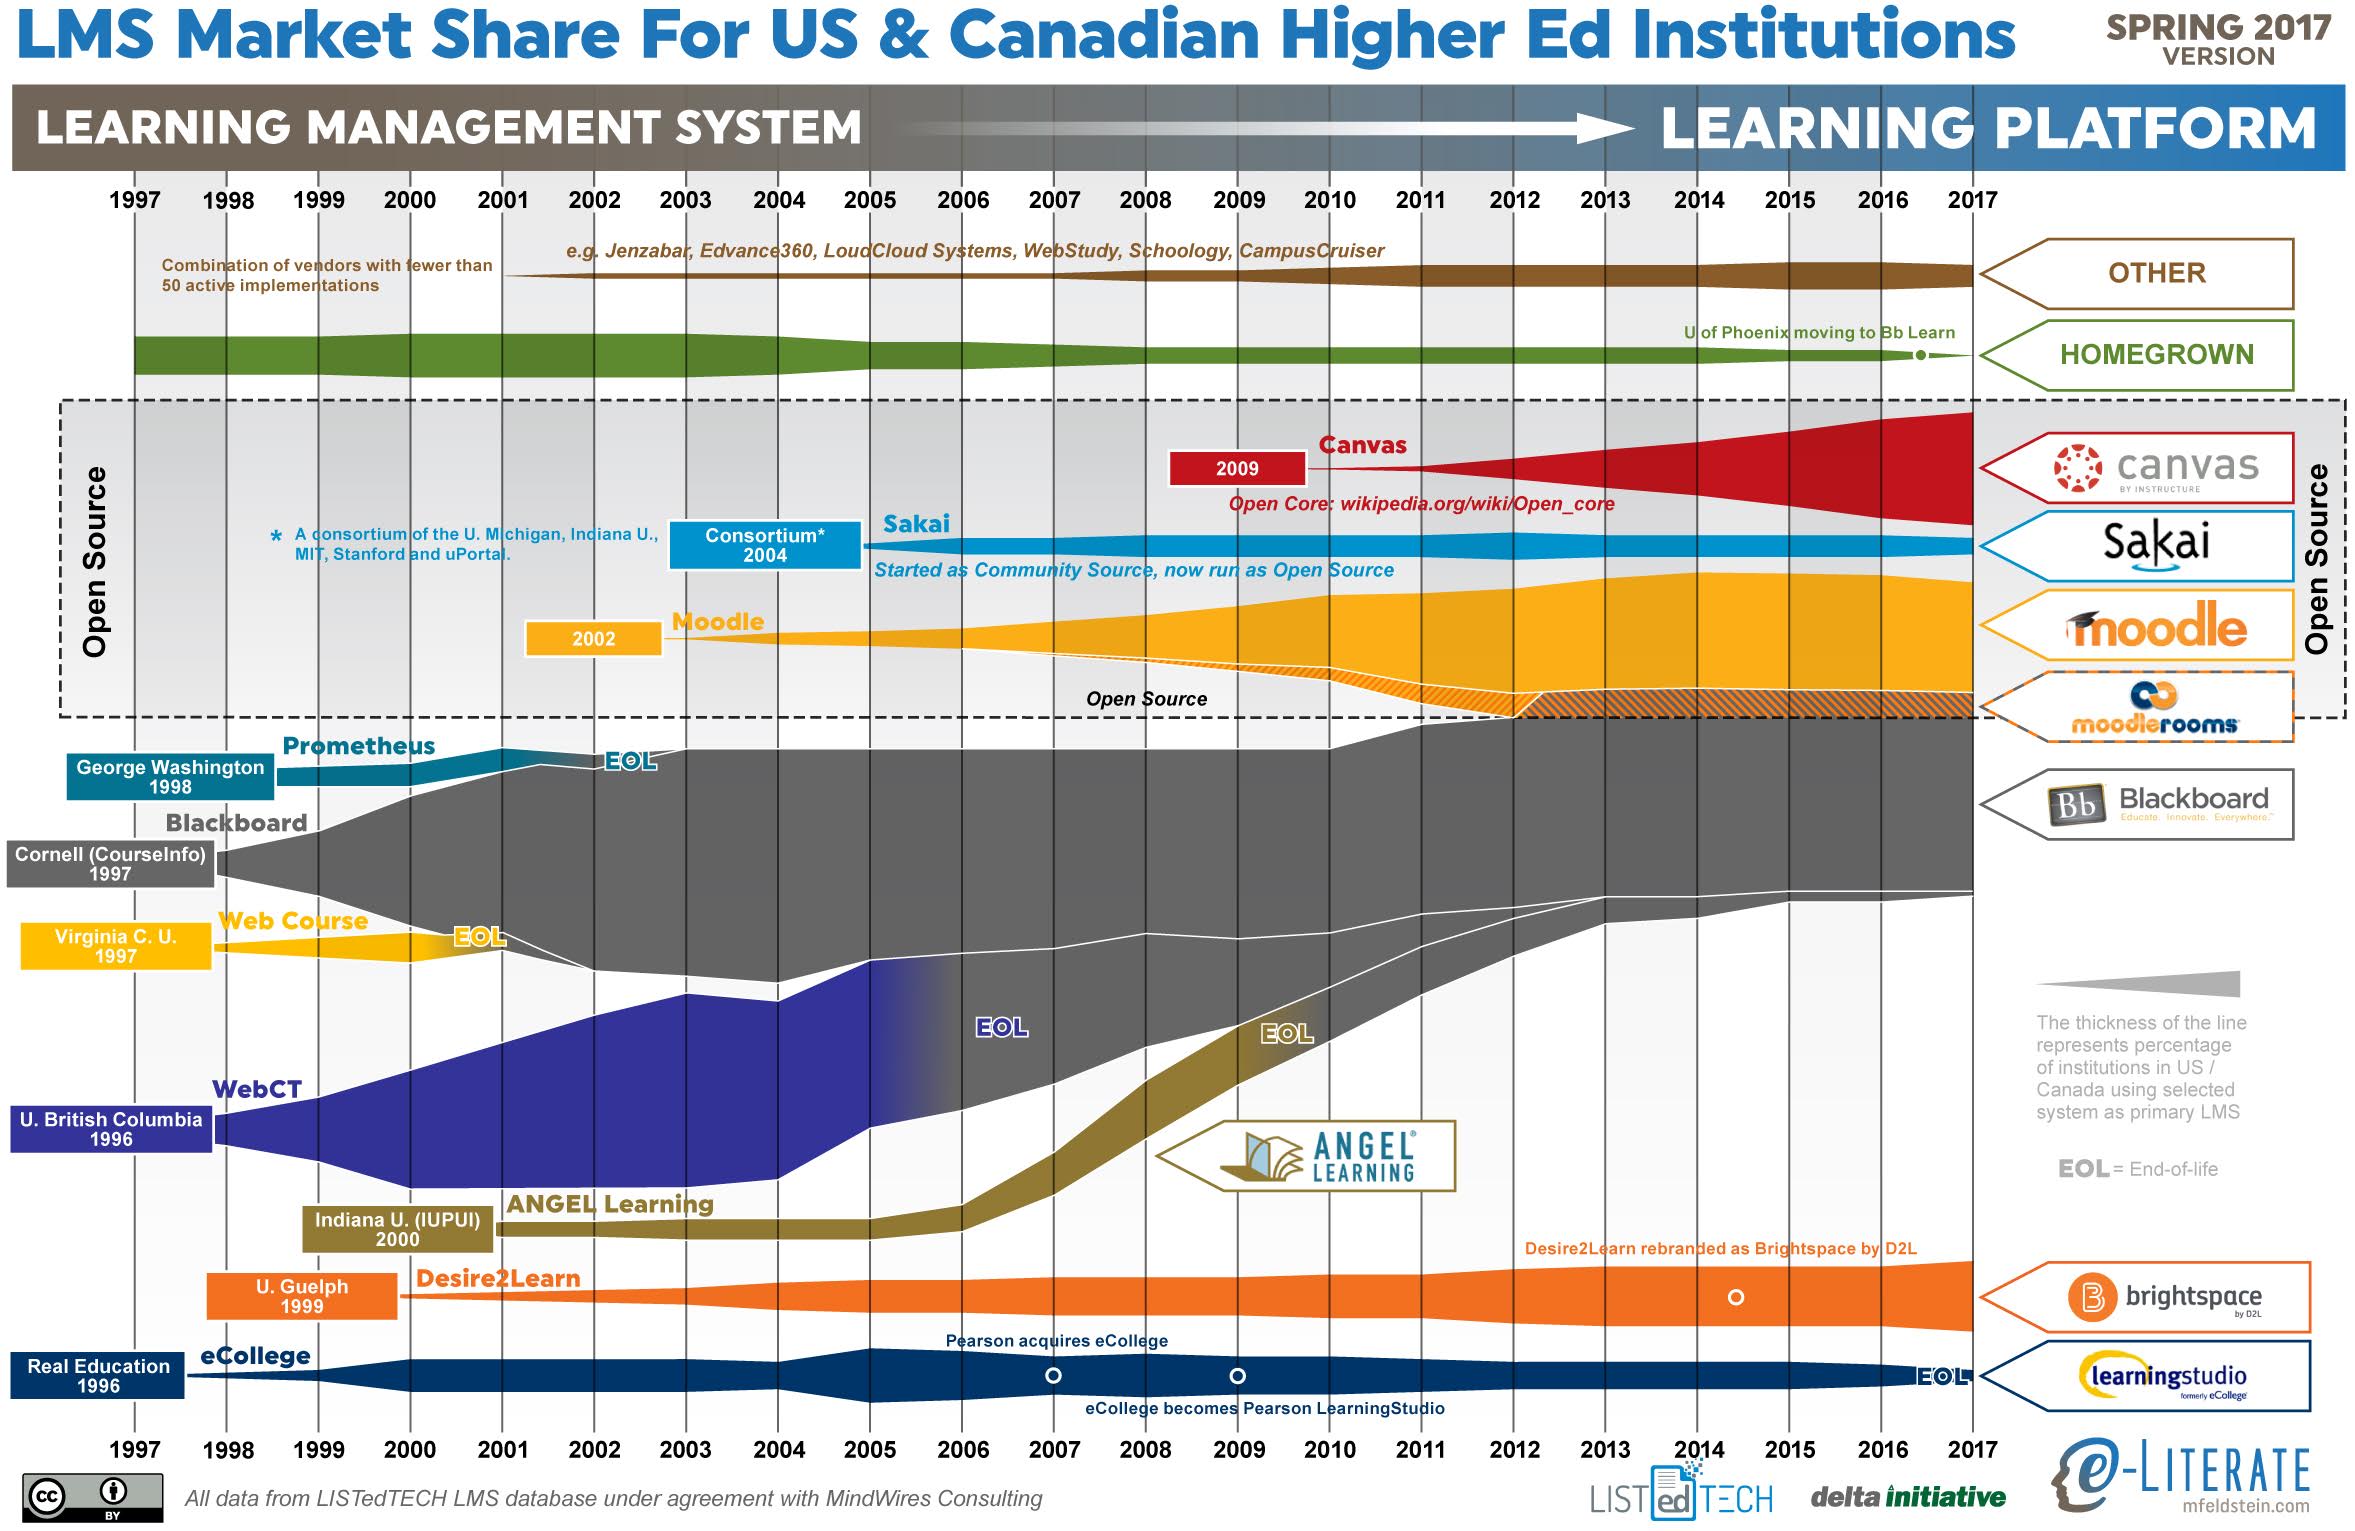
    This is the ninth year I have shared the LMS market share graphic, commonly known as the squid graphic, for US and Canadian higher education. The original idea remains – to give a picture of the LMS market in one page, highlighting the story of the market over time. The key to the graphic is that the width of each band represents the percentage of institutions using a particular LMS as its primary system.

    Last year we made a big shift based on our LMS market analysis service – we are working with LISTedTECH to provide market data and visualizations. This data source provides historical and current measures of institutional adoptions, allowing new insights into how the market has worked and current trends. Our spring report for subscribers will be released this month. Data for 2017 goes through April 1 of this year.

    (more…)

  • UC Davis Lessons: Open is as open does

    It’s interesting how one phrase can cause such a reaction.

    There is an interesting angle here in that Sakai is open source yet data is not easily recoverable.

    This comment came from the original post discussing UC Davis’ SmartSite disaster when their Sakai hosting partner Scriba botched a data center move, leading to a university of 32,000+ students going without a fully-functional LMS for the last three weeks of a term, including finals week. If you want the full run-down, read that linked post then look at additional posts in this list for the basics. ((SmartSite is the UC Davis branding for their LMS, which was hosted at the time by Scriba, a Sakai Commercial Affiliate.))

    What did I mean with this comment?

    Simply that this outage would give us a chance in reality to get a better understanding of the dynamics of open source solutions and whether the university in question would actually have achieved the ability to “control its destiny”. The early indications at the time were that UC Davis would not be able to make the course data from their LMS fully available to faculty and students before the end of the term. A full analysis of the causes and implications of the situation needed more information on what led to the outage, what UC Davis had in their contract with Scriba, and how the end of the term would play out. But even before that analysis, the comment was also based on the likely market perceptions.

    What did I not mean? (more…)

  • Previous LMS For Schools Moving to Canvas in US and Canada

    During the most recent quarterly earnings call for Instructure, an analyst asked an interesting question (despite starting off from the Chris Farley Show format).

    Corey Greendale (First Analysis Securities Corporation):  Awesome. A couple of other things on the, primarily on the Higher Ed space but I guess on education space, there’s a whole lot of couple questions about the competitive environment. When you’re and I don’t know if you will ever get into this level of granularity but when you got competitive wins against the Blackboard, are those predominantly from legacy ANGEL, are you getting those wins as much from Learn as well.

    Josh Coates (CEO of Instructure):  A lot of them are from Learn. Most, you know I don’t have the stats right off the top of my head. A lot of the ANGEL and WebCT stuff is been mopped up in the previous years and so, what’s left the majority of what’s left is Learn and our win rate against Blackboard it continues to be incredibly high, not just domestically but internationally as well.

    In fact, I think most of three out of the four international schools that we announced in this earnings where Blackboard Learn replacements, so yes Learn’s getting it.

    The question gets to the issue of whether Canvas is just picking up higher education clients coming off of discontinued LMSs (Angel, WebCT, etc) or if they are picking up clients from ongoing platforms such as Blackboard Learn. Beyond the obvious interest of investors and other ed tech vendors, this issue in general affects higher education institutions going through a vendor selection – for the system in consideration, are there many other schools considering the same migration path?

    Thanks to the work we’ve been doing with LISTedTECH and our new subscription service, we can answer this question in a little more detail. One of the charts we share shows higher education migrations over the past five years in the US and Canada. (more…)