e-Literate

Present is Prologue

Tag: Blackboard

  • Blackboard Learn Ultra in 2018: Is it ready and does it matter?

    Blackboard Learn Ultra in 2018: Is it ready and does it matter?

    One of our longest-running series of posts is on the prospects and status of Blackboard’s Learn Ultra, the user experience redesign and move to the cloud of the world’s second-most-used (behind Moodle) and highest-revenue-producing academic LMS. It is fashionable to claim the LMS is dead or passé, yet this product category remains the centerpiece of educational technology at colleges, universities, and K-12 districts. To understand Learn Ultra is to understand much of the overall LMS market.

    Looking at the timeline of e-Literate coverage, the broad story emerges:

    • 2012: Blackboard acquires Moodlerooms, and one benefit was the see of a cloud-based platform strategy.
    • 2014: Blackboard prematurely announced Learn Ultra (new user experience) and Learn SaaS (move to the cloud).
    • 2015: Learn Ultra is already a year late (more realistically, the BbWorld14 announcement was wildly unrealistic), but the University of Phoenix selects Learn Ultra as its next-generation learning platform.
    • 2016: Blackboard switches CEOs, admits that Learn Ultra is still not ready, and struggles with a major messaging problem around the transition.
    • 2017: No coverage – maybe we got tired of lack of not having customers to talk to.
    • 2018: Blackboard makes Learn Ultra the core of its message at its users conference BbWorld18.

    (Note: It might be easier to view this as a full page timeline instead of the embed within this post.)

    What we have been asked multiple times, by institutions, by investors, by other ed tech companies: is Learn Ultra ready, and does it matter? The unsurprising answer to both questions is a qualified and somewhat confusing it depends. To describe a little further, Learn Ultra’s Base Navigation is ready, but the Course View is not ready for meaningful adoption; furthermore, Learn Ultra is important to Blackboard’s future, but we think SaaS is more important to its present.

    Is It Ready?

    To ask this question requires an understanding of terminology, as we first described in this post. Blackboard1 is pushing the metric that there are 61 or 62 Learn Ultra customers “in production” or “using Ultra”, yet we have found very few that use, or even plan to use, Learn Ultra as their primary, institution-wide LMS. What gives? What became quite clear at this year’s BbWorld 18 users conference is that when Blackboard says in production, what they mean is that the LMS administrator has enabled the Ultra navigation, which uses the new Ultra user experience framework as the landing page / dashboard with activity feed that users see before entering a specific course. The company calls this Base Navigation, but at this point every course can be configured to be in the Original Experience or the Ultra Experience. Thus, enabling the possibility of running a course in Ultra counts as in production (note that Blackboard now lists 91 clients on Ultra).
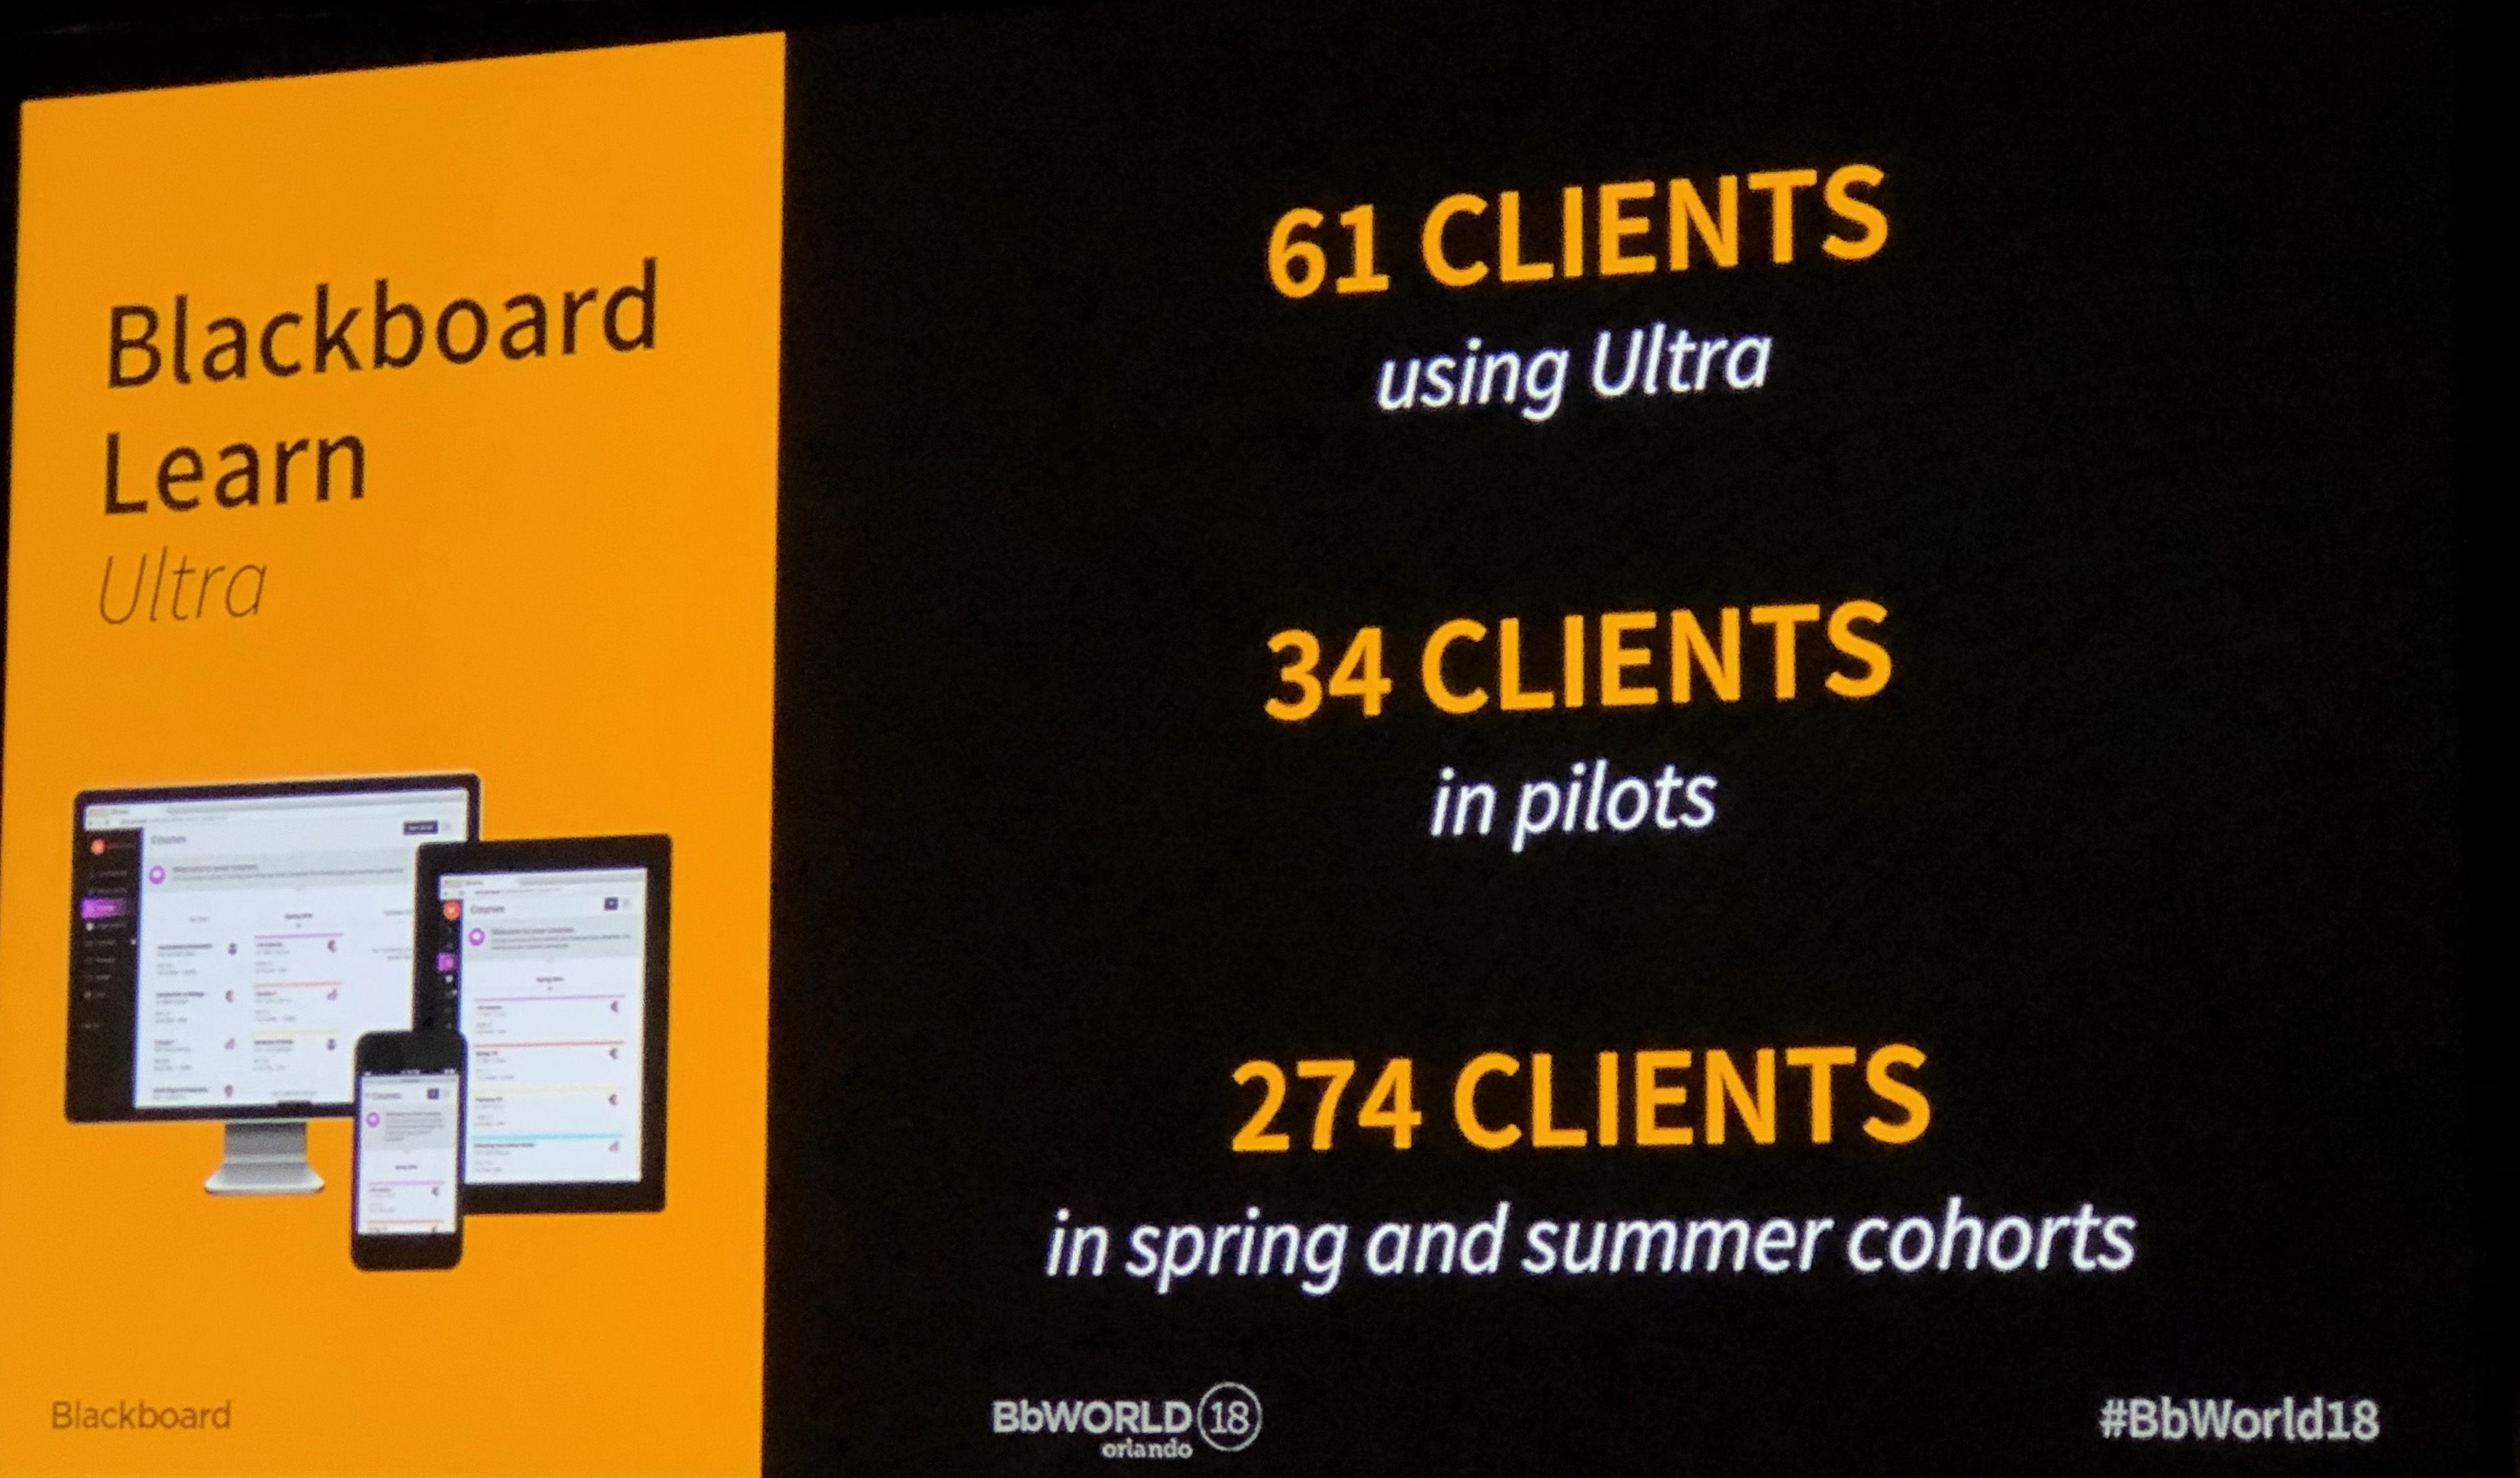
    Slide from BbWorld18

    Once a school has enabled Learn Ultra Base Navigation, they could choose to move exclusively to Ultra (e.g. the University of Phoenix, Northwest Florida State College, and a few others), or they could choose to keep all courses in Original (e.g. Northeastern State University), or they could choose to have some courses in Ultra and some in Original (used by the majority of schools investigating Ultra). This last mode is known as Dual Course mode, and even Blackboard executives seemed surprised to find out that the vast majority of schools putting Ultra in production are in fact running in Dual Course. For many of these schools, there are no definitive plans to move exclusively to Ultra.

    Upon re-reading this description, I believe that I should give more credit than just describing a landing page and base navigation. The cross-course functionality is and has been a long-term goal of Ultra, as we described as early as 2016.

    Creating a brand for a set of design goals is inherently fraught. Let’s look at two examples of how it makes communication of Blackboard’s strategy tricky for them. First, there’s mobile. Blackboard came out last year with a mobile app called Bb Student. It provides students with that activity stream view across courses and, of course, it’s mobile-first. (In fact, it’s mobile-only at the moment.) Furthermore, the company has made the product available for both traditional 9.x customers (which at this point is pretty much everybody) and their SaaS customers. People inside the company feel like they should be getting more credit for delivering on two major design goals (mobile first and stream-based activity views) as well as for delivering it to customers on the 9.x platform (which was more significant of a technical achievement than is immediately obvious).

    This is not a matter of Blackboard moving the goal posts, per se, and it is probably more accurate to say that Ultra cross-course functionality enabled by Base Navigation is ready and showing some benefits.
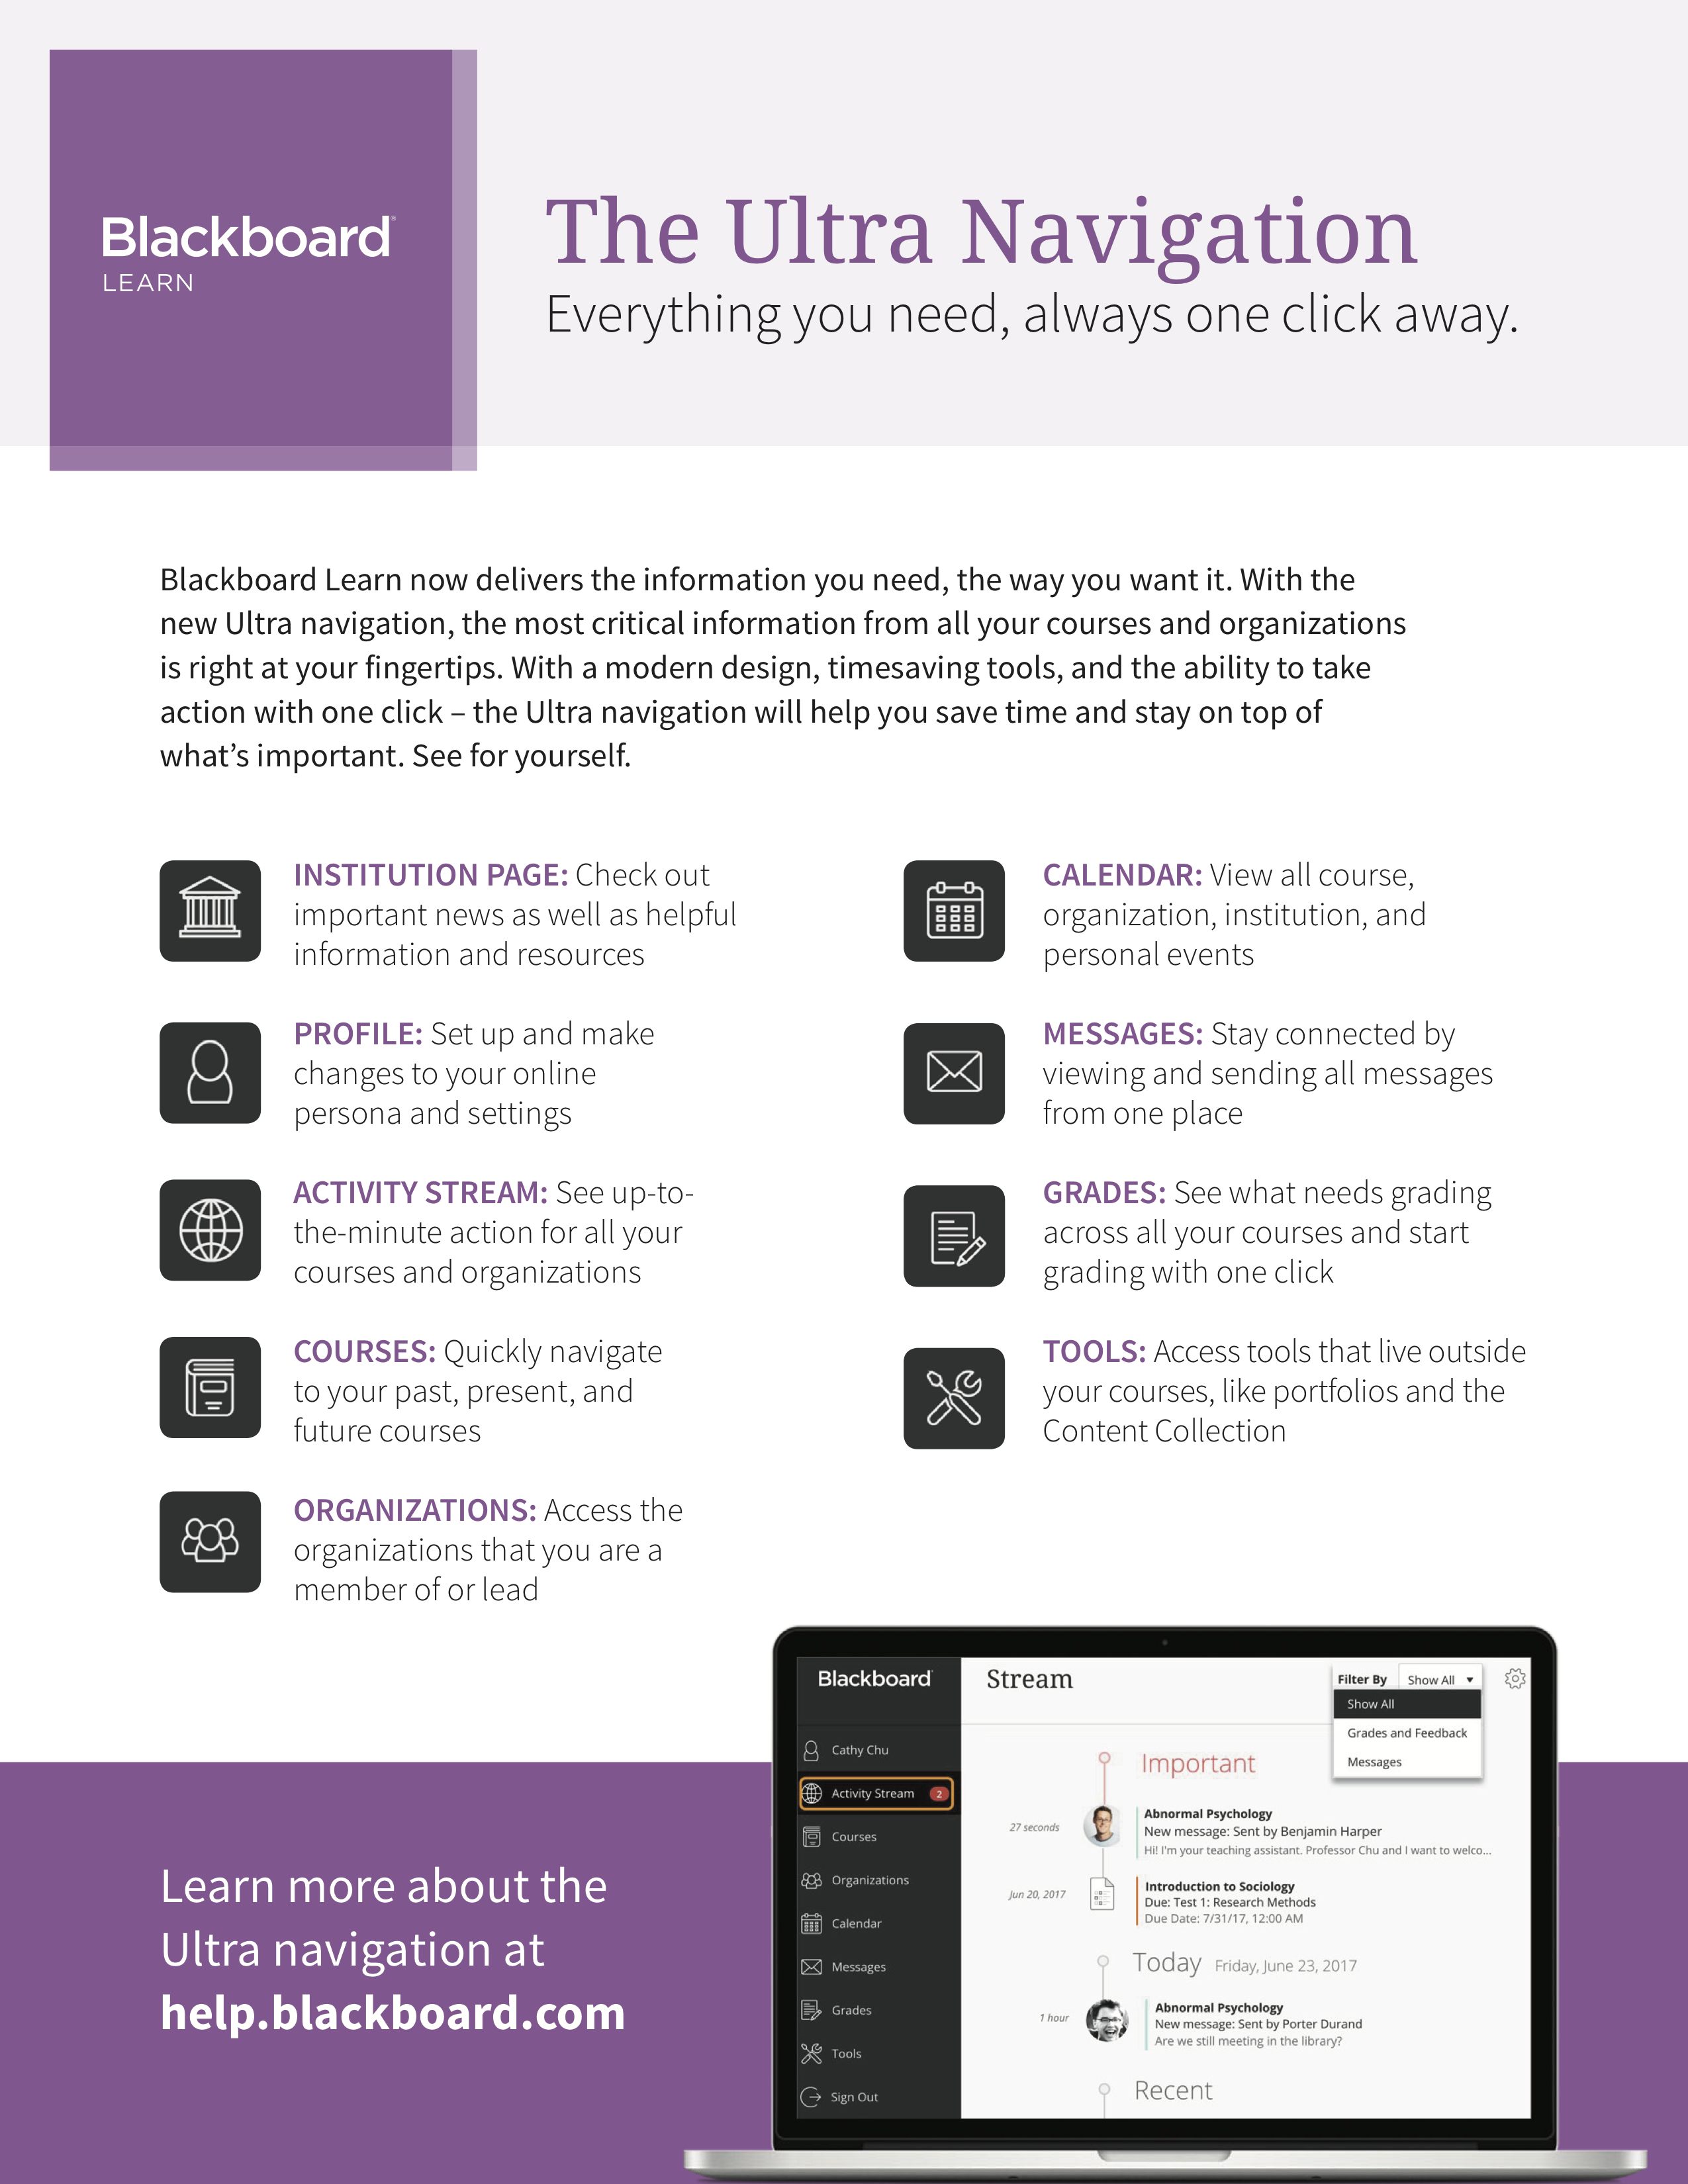
    Learn Ultra Base Navigation Brochure

    The challenge is that this move is not sufficient to make a material change in Blackboard’s company prospects. At best, Learn Ultra Base Navigation without usage of Course View will slightly slow down the rate of customers defecting for another LMS. For Learn Ultra to matter and to make Learn newly competitive, they need customers to also use Course View as the primary choice at their institution, and that usage by-and-large is not ready outside of a handful of schools.As an example from BbWorld18, Belmont University presented their experience moving to Learn SaaS (the important issue in the present, and a predecessor for  adopting Ultra)  and to “the Ultra Experience”. But after we asked a question about faculty adoption of the Ultra Course Experience, the administrator clarified that there are no courses running Ultra – all they have done is enable the Ultra base navigation, and they do not expect to do any course migrations for at least another year. This full adoption of Learn Ultra might become important in the future, but it is not driving decisions today.

    Does It Matter?

    Given that we’ve been asking for three entire years whether Learn Ultra is ready, one obvious follow-up question is whether it matters any longer. I do think the question matters as Blackboard is pinning their corporate turnaround on Learn Ultra as the core piece, and this message was heavily promoted at BbWorld 18.

    This messaging makes some sense in that we consider it unlikely that Blackboard can gain significant numbers of new clients (those moving from another LMS to Blackboard Learn, beyond a dozen or fewer schools) without Learn Ultra. Learn Original Experience has too much baggage and is too dated to compete with Canvas or Brightspace by D2L, at least in North America. The company’s new Learn LMS clients are largely the University of Phoenix and ANGEL contract conversions.

    To be fair, the exceptions include several schools in North Dakota (migrating from Moodle) as well as Northwest Florida State College (migrating from D2L). But even with NW Florida State, they based their decision on Learn Ultra.

    Based on interviews with clients arranged by Blackboard, and based on our own connections at BbWorld, what we consistently heard during dozens of interviews and from listening to panel discussions was that Learn Ultra Course View makes sense primarily for programs or schools that have not been on Blackboard Learn before. Bb Learn clients seem to have too many expectations of needing the same functionality they had before, pushing Ultra to be largely feature-compatible with Original and thus losing some of its simplicity in the process. When the Illinois Institute of Technology migrated from Learn self-hosting to SaaS, which enabled them to explore Ultra, they chose one program and a handful of faculty that were willing to jump into Learn Ultra, but for almost all others they are sticking with the Original Course View for the time being. The soonest they would expect moving primarily to Learn Ultra at the Course View would bet 3-5 years from now. You can hear the same dynamic in a recent Rod’s Pulse Podcast (shared under CC-BY-NC-SA license and also available at Inside Higher Ed), with Rod Murray interviewing Rob McCunney about their school (University of the Sciences) and its migration to SaaS and Ultra. It is a fascinating first-hand description of their experiences. Please note that they use use the terms Traditional and Original interchangeably.

    R Murray: We turned on the SaaS in January, but we really kept the Original Experience until July. In mid-July we flipped the switch to turn on the Ultra Experience. Now again for those of you are not as familiar with the way Blackboard works, that wasn’t changing the course format. They were still traditional courses, but you know all those tabs and modules disappeared, and we ended up with a new base navigation in Blackboard, which they called the Ultra Experience. So that was a major change, and we do have some summer sessions, but we felt this was the least painful way to turn it on. We didn’t want to wait till August just before our fall students came back.

    In terms of turning on the Ultra Experience, what were some of the major issues that you saw, that you were concerned with?

    R McCunney: Besides the fact that we lost the tabs and modules, so we kind of rolled out OneCampus as Rod said, I think one of the major things that that I noticed wasn’t really even on the admin side, it was just getting people used to something that was completely different as soon as they logged in to that institution page. Where’s my stuff, where is my modules? It just looks completely different than what they’re used to, and there’s some stuff missing, and we replaced it. We put stuff in other areas, and we communicated that, but that was probably the biggest hurdle. Just what is this, what is this Blackboard Ultra that you’re changing me to? And at that point, in July we only changed basically the institution page. Your average user, once they get into their course they didn’t notice anything different, but that initial freak out of here I don’t know where my form is. We told them a dozen times where it is, but it’s somewhere else. That was probably one of the major hurdles, and I didn’t anticipate that as being a big as an issue as it was. I thought there was going to be more nuts and bolts issues, which there were very few of those for the most part.

    R Murray: Right now of course we don’t have that many students here in the summer, so the real test will be in another week or so when students come back and really start. We all start kicking the tires, even on the traditional courses within the Ultra Experience.

    [snip]

    R Murray: The next big change that we have to live through has to do with converting courses to the Ultra course view. Now here at our university we certainly didn’t do it en masse, we went to play with it for at least this term and maybe next. But there are some courses that we decided made a lot of sense to convert to the Ultra course view. Those schools that those courses that are brand new, especially online courses that are brand new, it made sense to develop them directly in the [Ultra] course view.

    Schools are trying out the Ultra Experience in terms of the landing page and cross-course functionality, but by-and-large they are very cautious jumping into the Ultra Course View where most of the functionality resides.

    Based on this situation, we believe that the migration to Learn SaaS might be a better indicator – at least in the short run – than Ultra adoption of whether a school plans to stick with Blackboard. When a school moves to Learn SaaS, they all tend to sign contract extensions for 1 – 3 years or at least internally plan no LMS migrations for more than 1 – 3 years. And the migration to Learn SaaS does not suffer from the vague terminology issues – a school either uses Learn deployed on SaaS (through AWS) or they don’t.
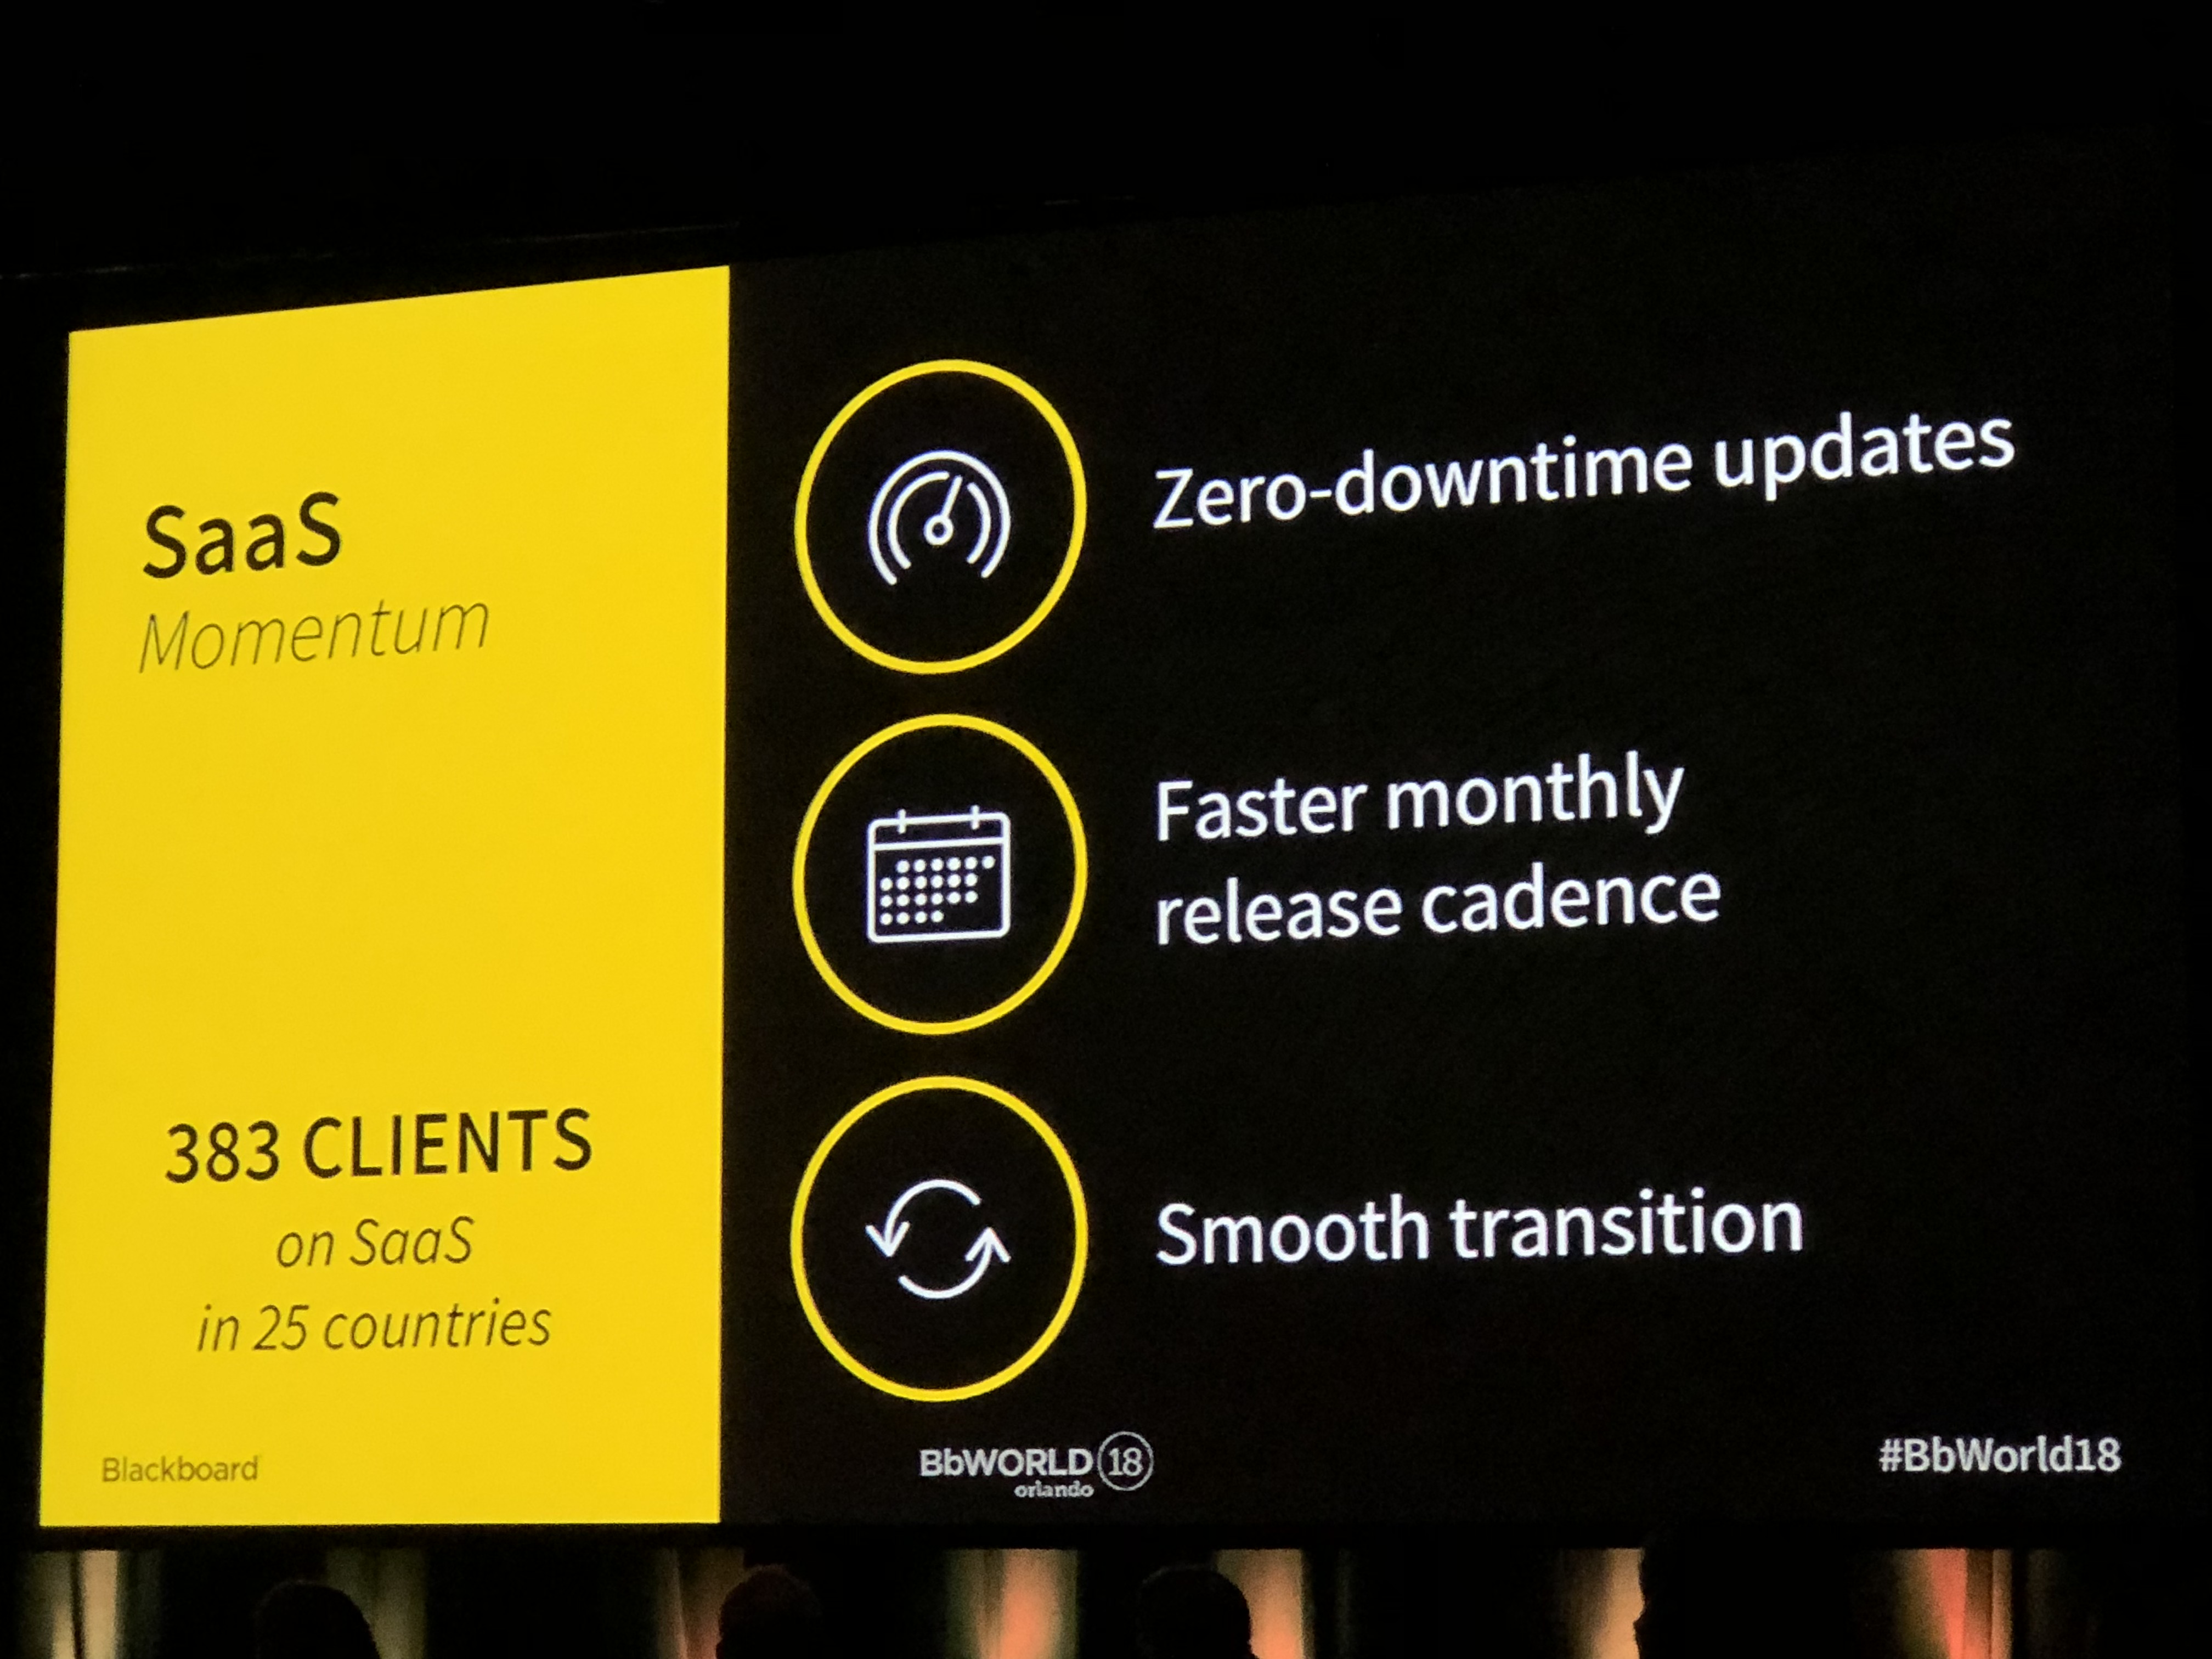
    Learn SaaS progress slide

    383 clients on Learn SaaS as of BbWorld 18 is good progress and easy to understand. This issue is what likely matters more to Blackboard clients today and for the next few years, but in the long run the company needs Learn Ultra to be accepted – including at the course level – in order to become more competitive and pick up new clients.

    In the end, Learn Ultra is partially ready and does matter, more so in the future, but the Learn SaaS migration matters much more today. This answer is a real improvement over the situation a year ago and even from the beginning of this year, but it is still a far cry from a simple yes and yes answer that Blackboard would like to have.

    Update: Fixed name of Rob McCunney
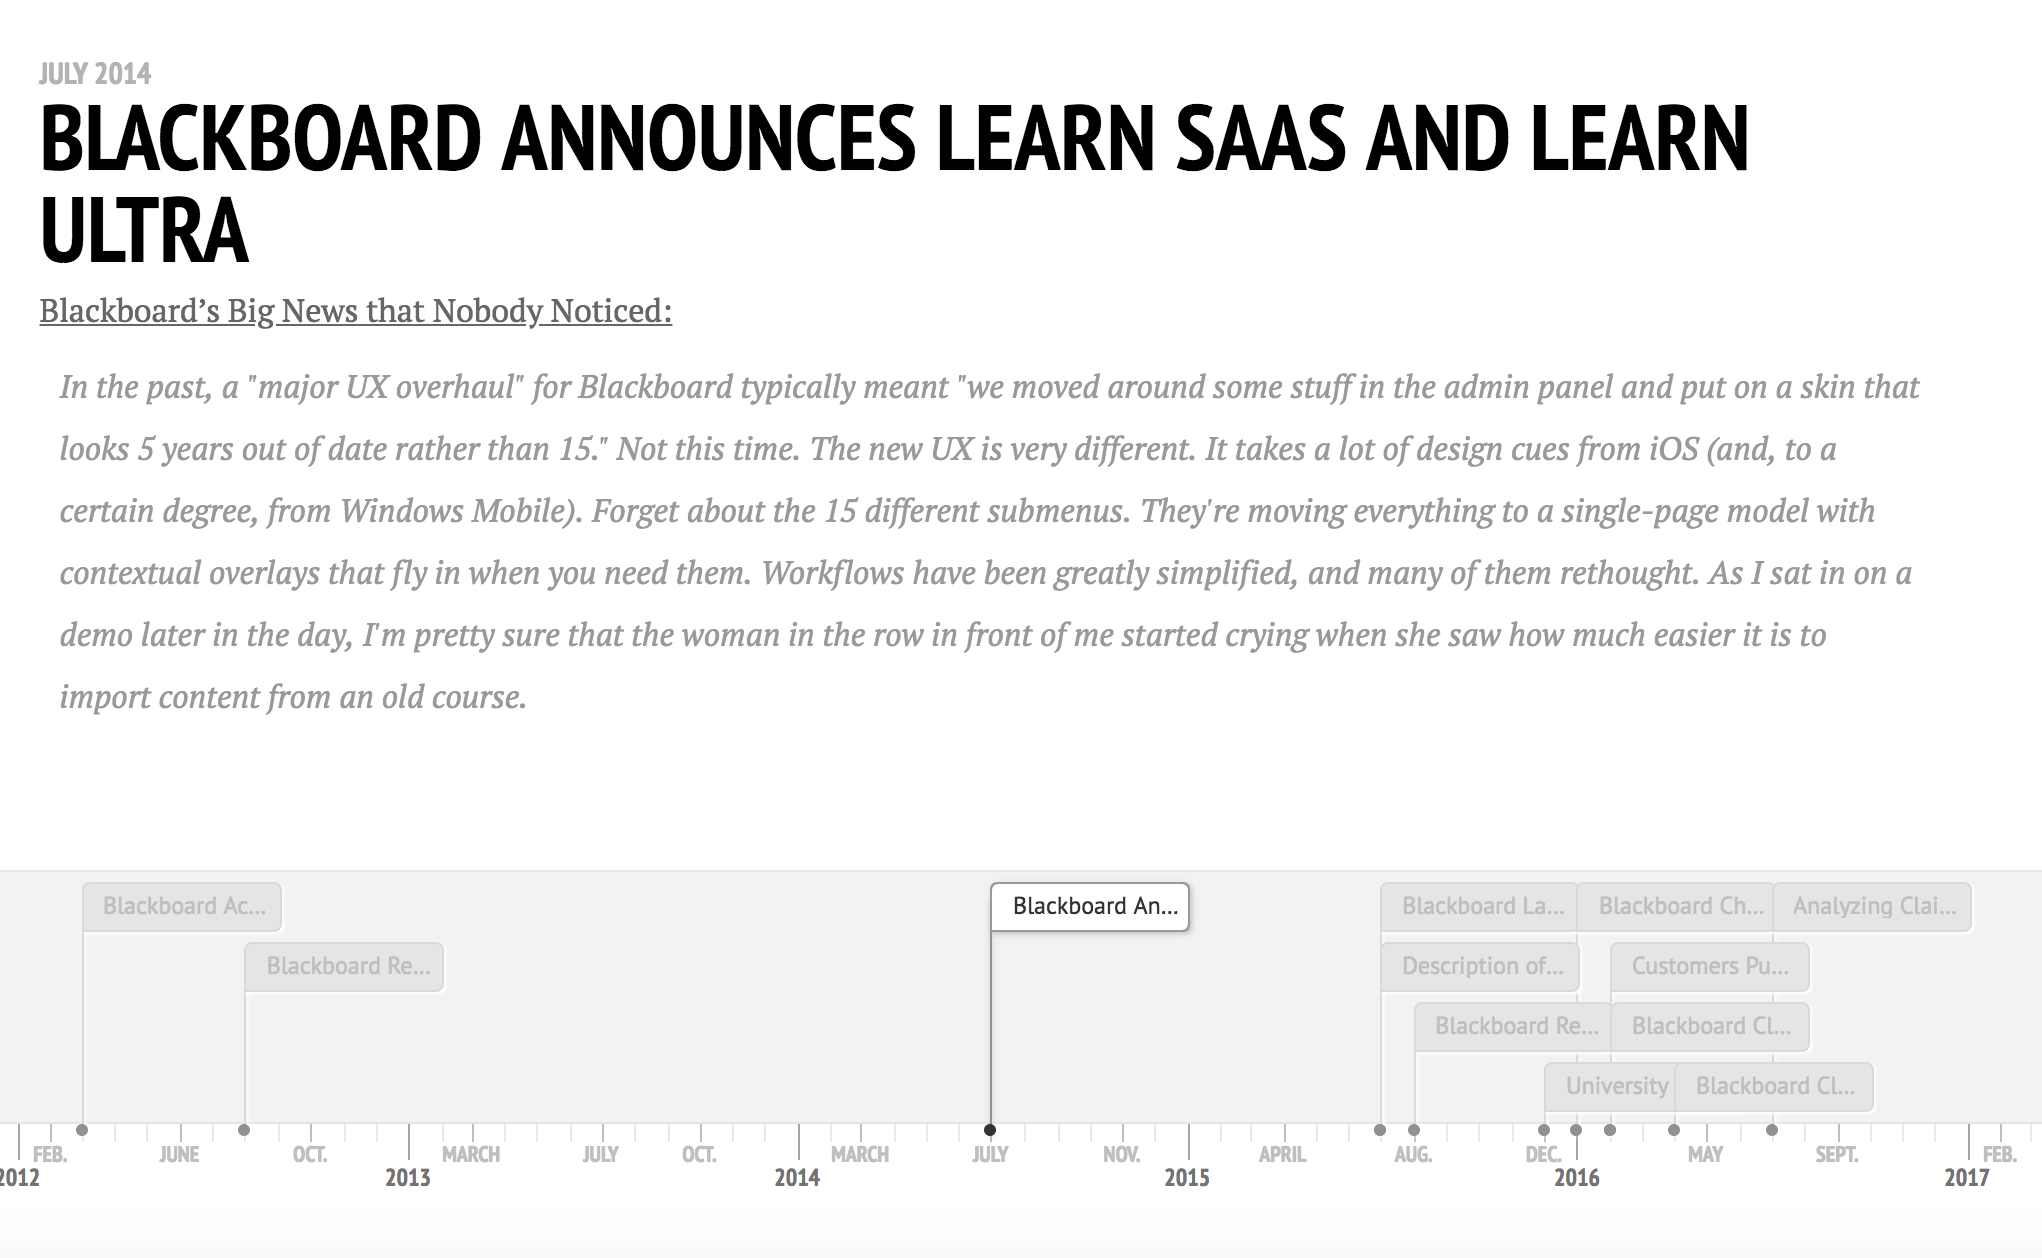
  • Timeline of e-Literate Coverage of Blackboard Learn Ultra

    Timeline of e-Literate Coverage of Blackboard Learn Ultra

    While doing research for an upcoming analysis post on Blackboard Learn, I found myself wanting to have a coherent timeline of past e-Literate coverage on the development and adoption of Learn Ultra. The most useful timeline tool seems to be TimelineJS by Knight Lab out of Northwestern University, so I gave it a try. The result of combining article data with this tool is an interactive timeline that allows the reader to browse relevant posts since 2012, showing the date of publication, a linked post title, and a snippet of content. You can click on the timeline navigation at the bottom, or you can browse through the overall story by using the arrows by text or swiping left / right on mobile devices. It might be easier to view this as a full page timeline instead of the embed within this post.

    Going through this exercise, I was a little surprised to see the two-year gap in coverage between July 2016 and July 2018.

    Let us know if this timeline view is useful. We may create other versions to help navigate topics like the OPM market.


    One sample page:

    Timeline of coverage of Learn Ultra

  • Response to MoodleNews: Some considerations for critical reading of market sizing claims

    Response to MoodleNews: Some considerations for critical reading of market sizing claims

    There is an interesting post at MoodleNews titled “Open Source LMS Alive And Well: Moodle Breaks World Higher Ed Records, Tops North America, Grows Everywhere” looking at some of our recent LMS market data, focusing primarily on what the data reveal about open source systems such as Moodle, Sakai, Claroline, and Chamilo.

    Open Source LMS Alive And Well Moodle Breaks World Higher Ed Records, Tops North America, Grows Everywhere

    We welcome the usage of our data posted at e-Literate for these purposes, ((That’s why the blog is available for use under a Creative Commons Attribution license.)) but there are some misunderstandings evident in the MoodleNews post that we see too often in critical readings of market sizing reports. Unfortunately the misreadings can cloud otherwise valuable analytical reporting.

    The latest e-Literate report on “active LMS” shows Moodle as the incontrovertible LMS leader in global Higher Ed for primary and secondary systems, including North America.

    Incontrovertible seems quite strong, and we at e-Literate try to be very careful in our language and we rarely use words like incontrovertible or unequivocal. ((For the record, in the 14 year history of e-Literate, the former has been used one time and the latter five times.)) The reason is that for most people reading the data is a translation exercise. There is a need to understand the level of confidence the reader should have and what the limits of the claims are.

    It is useful that MoodleNews called out the global nature of data and measure of primary and secondary systems.

    Assuming it uses data provided by self-reporting service LISTedTECH from the last month, it shows dominance in every region, unsurmountable everywhere but the US, and healthy growth rates. The report mentions the “LMS long tail” as well as “the Big Four” (Moodle, Blackboard, Instructure Canvas and D2L Brightspace) but by their own accounting a more accurate distinction would be “the big one.”

    The data set used from our partners LISTedTECH is not a self-reporting service. Read this post for more information on the multiple channels of data collection used.

    But unsurmountable comes out of the blue. The whole point of doing reports like we do is that we don’t know for certain what the future trends will be, and we gather the data to reduce uncertainty. A while back, many would have said that Blackboard has an insurmountable dominance in North America, but we have seen major changes that would have made those claims invalid.

    I can see the argument for describing Moodle as “the big one” as an alternate description to “the Big Four”.

    LISTedTECH sample (apparently totaling 12,879 active LMS) lists 1,419 active Moodle sites in Higher Ed for North America, self-acknowledged as their most complete dataset. It appears that the advantages in Canada compensate for Instructure Canvas’ growth in the US. In July, it had listed 1,000 sites only for Higher Ed in the US.

    The first sentence is a good example of characterizing the data in a useful way, as it gives the reader a sense of the data set while also clarifying usage in a specific global region.

    Unfortunately the article then jumps into some confusing claims based on misreading the data descriptions. The June 2017 post captured percentage of primary systems at degree-granting institutions for each of four global regions with North America = US and Canada combined, the July 2018 post captured primary LMS in … US colleges and universities, and the August 2018 post captured total counts of both primary and secondary system usage in six global regions. We chose this latter method for the August post due to the frequency of long tail and open source LMS systems being used as secondary systems (i.e. some other LMS is the campus standard, or primary system). There is little basis for concluding that Moodle’s advantages in Canada compensate for Instructure Canvas’ growth in the US.

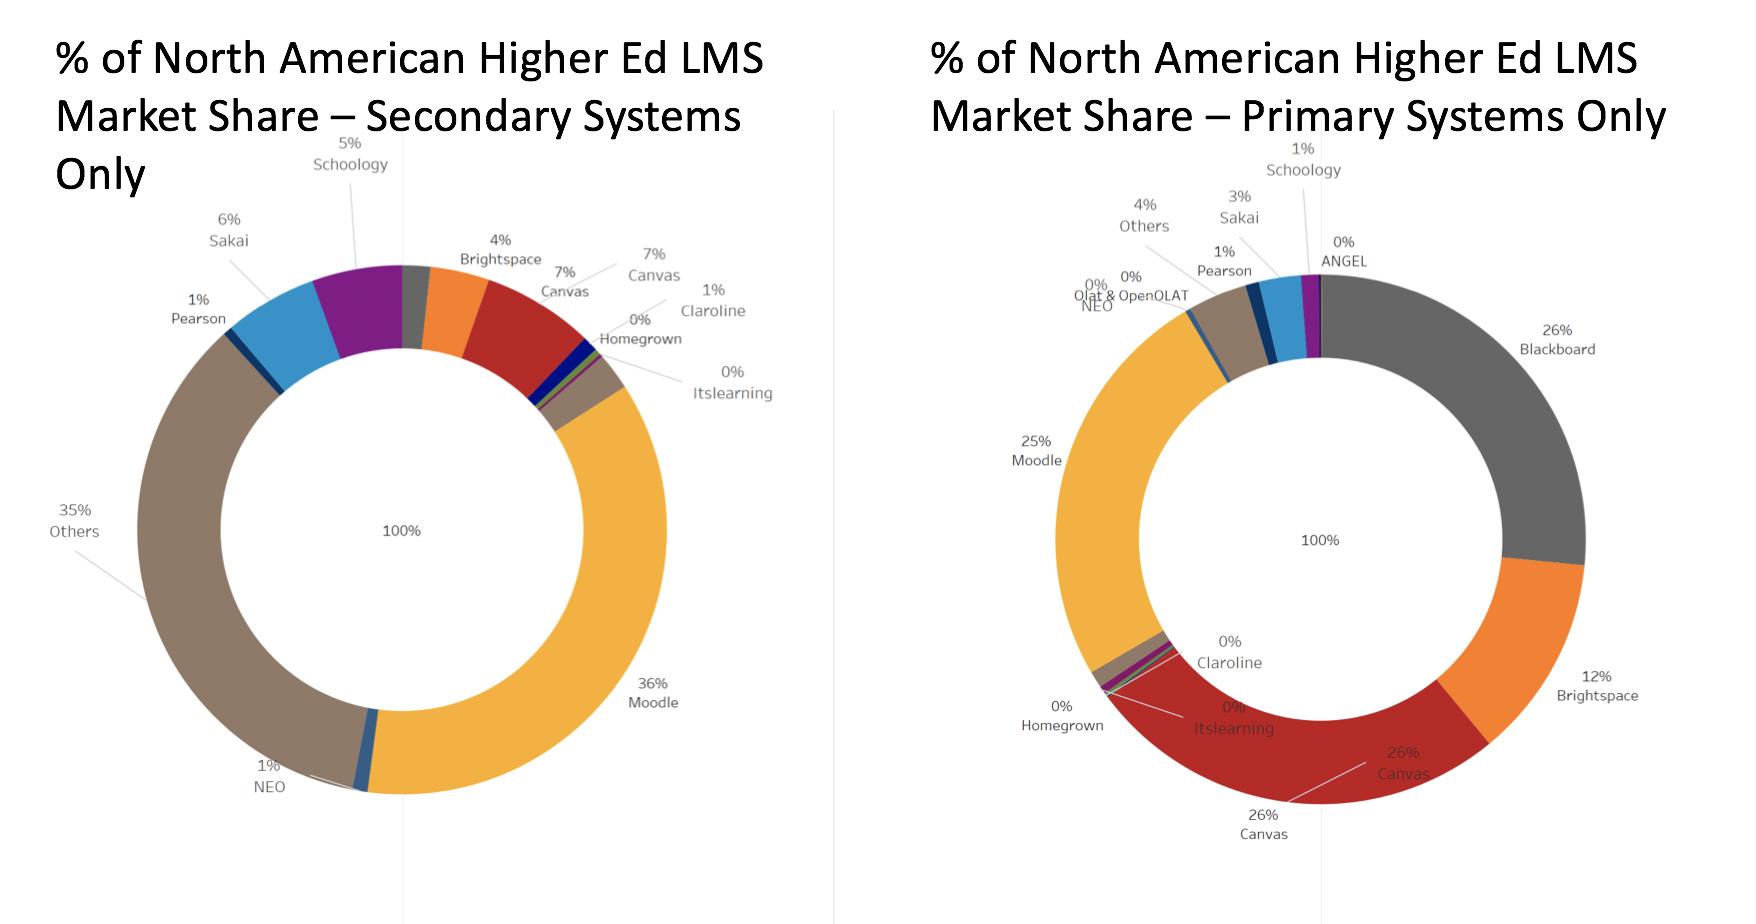
    The larger point here is that there are lots of ways to slice and dice data that end up with similar-lookinggraphs that represent different things – it’s important to read the legends and surrounding text carefully. To give a sense on the issue of primary vs. secondary systems  for North America, consider the difference shown below. ((Graphic shown as clarification, not present in articles referenced by MoodleNews.))

    With MoodleNews’ natural focus on Moodle, it would be accurate to note that Moodle is used quite frequently as a secondary system.

    For comparison, official stats at moodle.net set the total figure at 11,490 as of writing. 9,776 for the US, the biggest Moodle nation; 1,714 for Canada. Moodle does not offer discriminated site data for Higher Ed only.

    This is a helpful comparison and description with a different data set.

    Unfortunately, I need to be careful with further quotations. MoodleNews does not use a creative commons license and clearly limits usage based on the site’s terms of use. So the remainder of this post will have to be limited to short descriptions.

    There is a useful section looking at Moodle’s shares in six different global regions. The main caution I would add comes from our November 2017 post describing the data.

    Market share information provided in percentages and trends are more reliable than absolute counts outside of North America. When we do provide absolute numbers, we advise caution for readers or subscribers to not over-interpret the absolute numbers, at least without us providing additional details to keep the data in context.

    But in this case, MoodleNews also included the percentages for each region, which is helpful.

    The next four paragraphs all focus on market trends (year over year comparisons) that cannot be supported by the data (see above).

    At the end of the MoodleNews post, there is some valuable commentary about other (non-Moodle) open source LMS system and the origins and deployments across various regions.

    Given these clarifications, I would also add the the MoodleNews title has some serious flaws.

    All-in-all, it’s good to see valuable discussions spawned from our CC-BY licensed posts. But readers should be cautios when trying to understand market sizing data and make comparisons and trends analysis carefully.

    Update 8/26: Please see comment from Martin Dougiamas clarifying that MoodleNews “is not associated or affiliated with the Moodle organisation in any way”.

  • D2L Fusion 2018: Product improvements and potential signs of addressing challenges

    D2L Fusion 2018: Product improvements and potential signs of addressing challenges

    This year’s D2L Fusion conference in Houston carved out a space somewhere between the carnival atmosphere of InstructureCon in Keystone and the subdued feel of BbWorld in Orlando (note: we plan another post on each of these conferences to share more details of our observations). This  was the perfect note to hit for where D2L is in its evolution as an educational technology company. A number of things seem to be falling in place for D2L ((Disclosure: Blackboard, Instructure, D2L, and Schoology are subscribers to our LMS Market Analysis service. Blackboard, Instructure, D2L, and Pearson are sponsoring participants in our Empirical Educator Project.)) with its LMS product, but we will have to see if the recently expanded management team will be able to address the ongoing challenges that D2L faces with customer experience and expectations.

    Like Blackboard and Instructure, D2L is in the middle of a transition partially driven by financial considerations. In D2L’s case, the issue is that the two rounds of $165 million aggregate funding in 2012 / 13 lead to expectations of larger market gains. In August of 2017 we shared that “D2L is on a roll, racking up significant client wins in higher education, and the company shows real signs of change in its ability to truly listen to and empathize with customers.” Two months ago we described D2L’s concerted effort to move customers to the cloud and some promising improvements surfacing in the new Daylight user experience. Despite these improvements, however, D2L has lost some marquee customers such as the University of Wisconsin system to offset some of the wins, and the company has remained steady or made slight gains in North America, European and Latin American LMS market share.

    At D2L Fusion, our goal was to get a better read on how actual customers and prospects are reacting to the cloud deployment move and streamlined user experience that we have observed. A second goal we had was to get a better sense of whether D2L will be able to improve its customer service and delivery on promises made to customers.

    Reactions to Cloud and User Experience

    From customers we spoke to at D2L Fusion, the value of the move to the cloud as well as user experience improvements have provided breakthroughs. On the cloud front, D2L now has upwards of 98% of their customer base either hosted through Amazon Web Services (AWS) or in the company’s data centers.  According to a company spokesperson, 55% of what they describe as cloud implementations are hosted by AWS, the remainder by D2L in their leased data centers. All new implementations moving forward will be hosted by AWS and by fall 2019 D2L estimates that nearly all implementations will be on the AWS infrastructure. This will be a significant achievement for a legacy on-premises software provider to make this transition. From our June post:

    D2L has long worked on managed hosting options, but in late 2013 the company introduced Continuous Delivery where software releases are pushed to customers incrementally, such that customers would jointly run the latest versions of Brightspace, their LMS. This move is important, as one primary benefit of cloud deployment is to remove the explosion of software configurations and versions that make it expensive and difficult to diagnose and fix bugs and to release new features.

    Three years later in 2016 D2L announced their move to AWS for cloud deployment.

    At Fusion 2018 we saw a continuation of this strategy, and we heard largely positive reception from customers and prospects, and we are not hearing the grumblings from customers as was evident in late 2016 / early 2017. We should also note that this move to the cloud is more aggressive than that being made by Blackboard and Learn SaaS, but more on that in a future post.

    As for the new user experience and recent changes in product design, it’s useful to first establish context for what’s been happening internally at D2L. About three years ago D2L brought in a new chief operating officer, Cheryl Ainoa, and a new VP of Product, David Koehn. One of their goals was to turn the product development process on its head and, drum roll, put the users first. This means engaging with users, listening to users, understanding their problems and viewing them as partners in the effort to deliver better software. It also means solving the small things that annoy users on a daily basis and shifting away from feature releases as the key metric of progress. For companies that have been engaged in agile methodology and iterative development, this likely sounds basic. For D2L, it was a fundamental cultural shift in how development is done. At this year’s Fusion, we are seeing concrete signs that change has taken root both with the company and with customers.

    Daylight Experience is the name for D2L’s redesign of its streamlined user interface. When it was first announced in early 2017, we were somewhat skeptical as the initial changes were evident in different fonts and cleaner look-and-feel but not significant improvements in the workflow for faculty and students.

    As time goes on and we see more advanced demos, our view is changing. The Daylight Experience does have some real improvements not just in look-and-feel but in fewer and more intuitive clicks to get the same job done. A major focus on the Emerald Release this summer (in time for D2L Fusion users conference) is more fully encouraging usage of the activity stream for higher ed clients (this feature was initially targeted at K-12 market but has been adapted for colleges and universities).

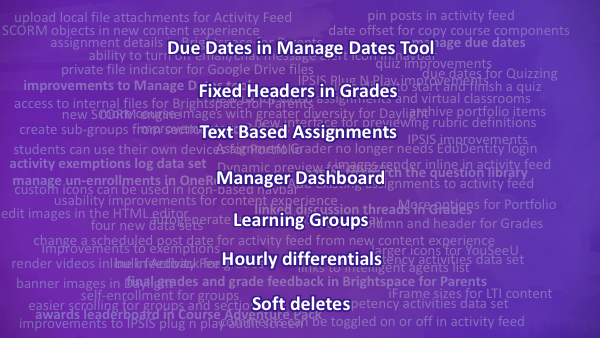
    The product showcase slide that arguably got the most enthusiastic response from the crowd was the one that focused on the small changes that users had been clamoring after for years – things like “Due Dates in Manage Dates Tool”, “Fixed Headers in Grades”, “Learning Groups”.

    New features from D2L Fusion conference

    These are not sexy, headline-making announcements, but they matter to users. D2L has long been viewed as a platform for people and institutions that like to have a lot of control over how to configure and run an LMS; however, the breadth and complexity of options often came at the expense of an intuitive user experience. While D2L has had a solid product for a sub-set of the market for years, they have had difficulty being viewed as ‘intuitive’ or ‘easy to use’, at least since the advent of Canvas and the resultant change in user expectations. The streamlined design afforded by the Daylight Experience, and the progressive disclosure of more advanced features, could change this situation if they’re able to get it in front of potential customers for a serious look.

    Customer Experience and Expectations

    On the second question regarding customer service and delivery on promises there are several reasons to be upbeat, but also reason for concern. Several new customers we spoke with, from Europe, Latin America and North America, all spoke about “partnership” as being a key reason for their choosing D2L over the competition. During lengthy procurement processes, these institutions got the sense that D2L was eager to engage and work with them to achieve their goals with broad service offerings as well as an eagerness to shape product development to suit these new clients.

    That said, D2L has a mixed record on follow through. A number of sources we have spoken with over the past 6-12 months have discussed a pattern of the company over-promising and under-delivering when it comes to implement promised changes. For example, these sources have told us they went into the relationship with this same expectation of a partnership, of having a voice in product direction, only to find out they are having trouble getting D2L staff to respond in a timely manner. It is not clear yet on how prevalent these concerns are, but we do believe they will need to be addressed in order for D2L to make material changes in overall market share.

    D2L has made two key hires in recent months, seemingly in recognition of potential market opportunities as well as persistent internal challenges. One targets growth, the other customer satisfaction. Puneet Arora, a former sales executive with several SaaS companies, has been brought in as chief revenue officer, and April Oman, a veteran customer success executive with a number of enterprise software companies, has been added as as Senior VP of Customer Experience. Arora is new to the education space but seems to be asking a lot of the right questions, and his task is to grow the user base in a meaningful way. Expect to see some changes in how D2L positions itself and who they try to sell to, shifting the balance away from administrators and towards faculty and student end users. Oman’s role is a new one and speaks to the need to develop a stronger relationships and partnerships with customers. This will be critical as D2L tries to establish themselves as much more than a software solution and as they attempt to improve customer experience.

    Better Position but Needing Results

    The center of gravity of D2L’s executive team is more diffuse than it used to be. Much of the longer-tenured leadership of D2L is based out of the Kitchener, Ontario home office: John Baker, CEO; Nick Oddson, CTO; Melissa Howatson, CFO; Jeremy Auger, SVP Strategy; and Ken Chapman, VP of Market Research. Ainoa, Koehn, Arora, and Oman (the new hires), however, are all in the Bay Area in California, and Tracy Strauss, SVP Marketing, is out of Los Angeles. There seems to be a deliberate approach to finding new ways of thinking from a broader field of expertise.

    D2L appears to have largely revamped its approach to product development that is more responsive to customer needs, and is putting resources into building partnerships. Yet they have not made the market gains envisioned after winning the Blackboard patent wars and then raising two large rounds of financing. We still see a two-horse race for new implementations (LMS product switches) in higher education, largely shared between Canvas and D2L, but the second horse that is looking better than it used to still needs to make further adjustments and run faster.

  • Comparing the First Ten Years of Blackboard and Instructure in LMS Market

    Comparing the First Ten Years of Blackboard and Instructure in LMS Market

    Last year Blackboard celebrated their 20th anniversary as a company, and this year Instructure celebrated their 10th. Yes, the company with Canvas, the “new” LMS solution, is a decade old. To gain historical perspective, it is interesting to compare each company’s first ten years in business in terms of primary financials – revenue and income – and performance in their core North American Higher Education market.

    We can only go so far in comparing the companies on this basis, however, due to different circumstances.

    • Most importantly, Blackboard helped create the LMS market and therefore had significant portion of its expansion in a greenfield situation, picking up clients who had not previously used an institution-wide LMS. Canvas entered the market well after saturation, with greater than 90% of institutions already having a standard LMS.
    • Blackboard developed its product line pre-cloud, with on-premise hosting being the primary deployment model. Canvas was cloud-native, developed on top of AWS infrastructure.
    • Blackboard’s growth was heavily based on corporate acquisition of competitors – Prometheus, WebCourse, WebCT in the first decade – while Instructure’s growth has been almost exclusively organic.
    • Both companies sold in more than just the North American Higher Ed (NAHE) LMS market, even if that was the core. Blackboard acquired two companies in 2000 and launched a card-reader transaction business, and they played somewhat in the K-12 and corporate learning space. Instructure developed Bridge for corporate learning, Arc for video platform, and it has a heavy presence in the K-12 LMS market.

    Interestingly, both companies went public in Year 7 (Blackboard in 2004, Instructure in 2015).

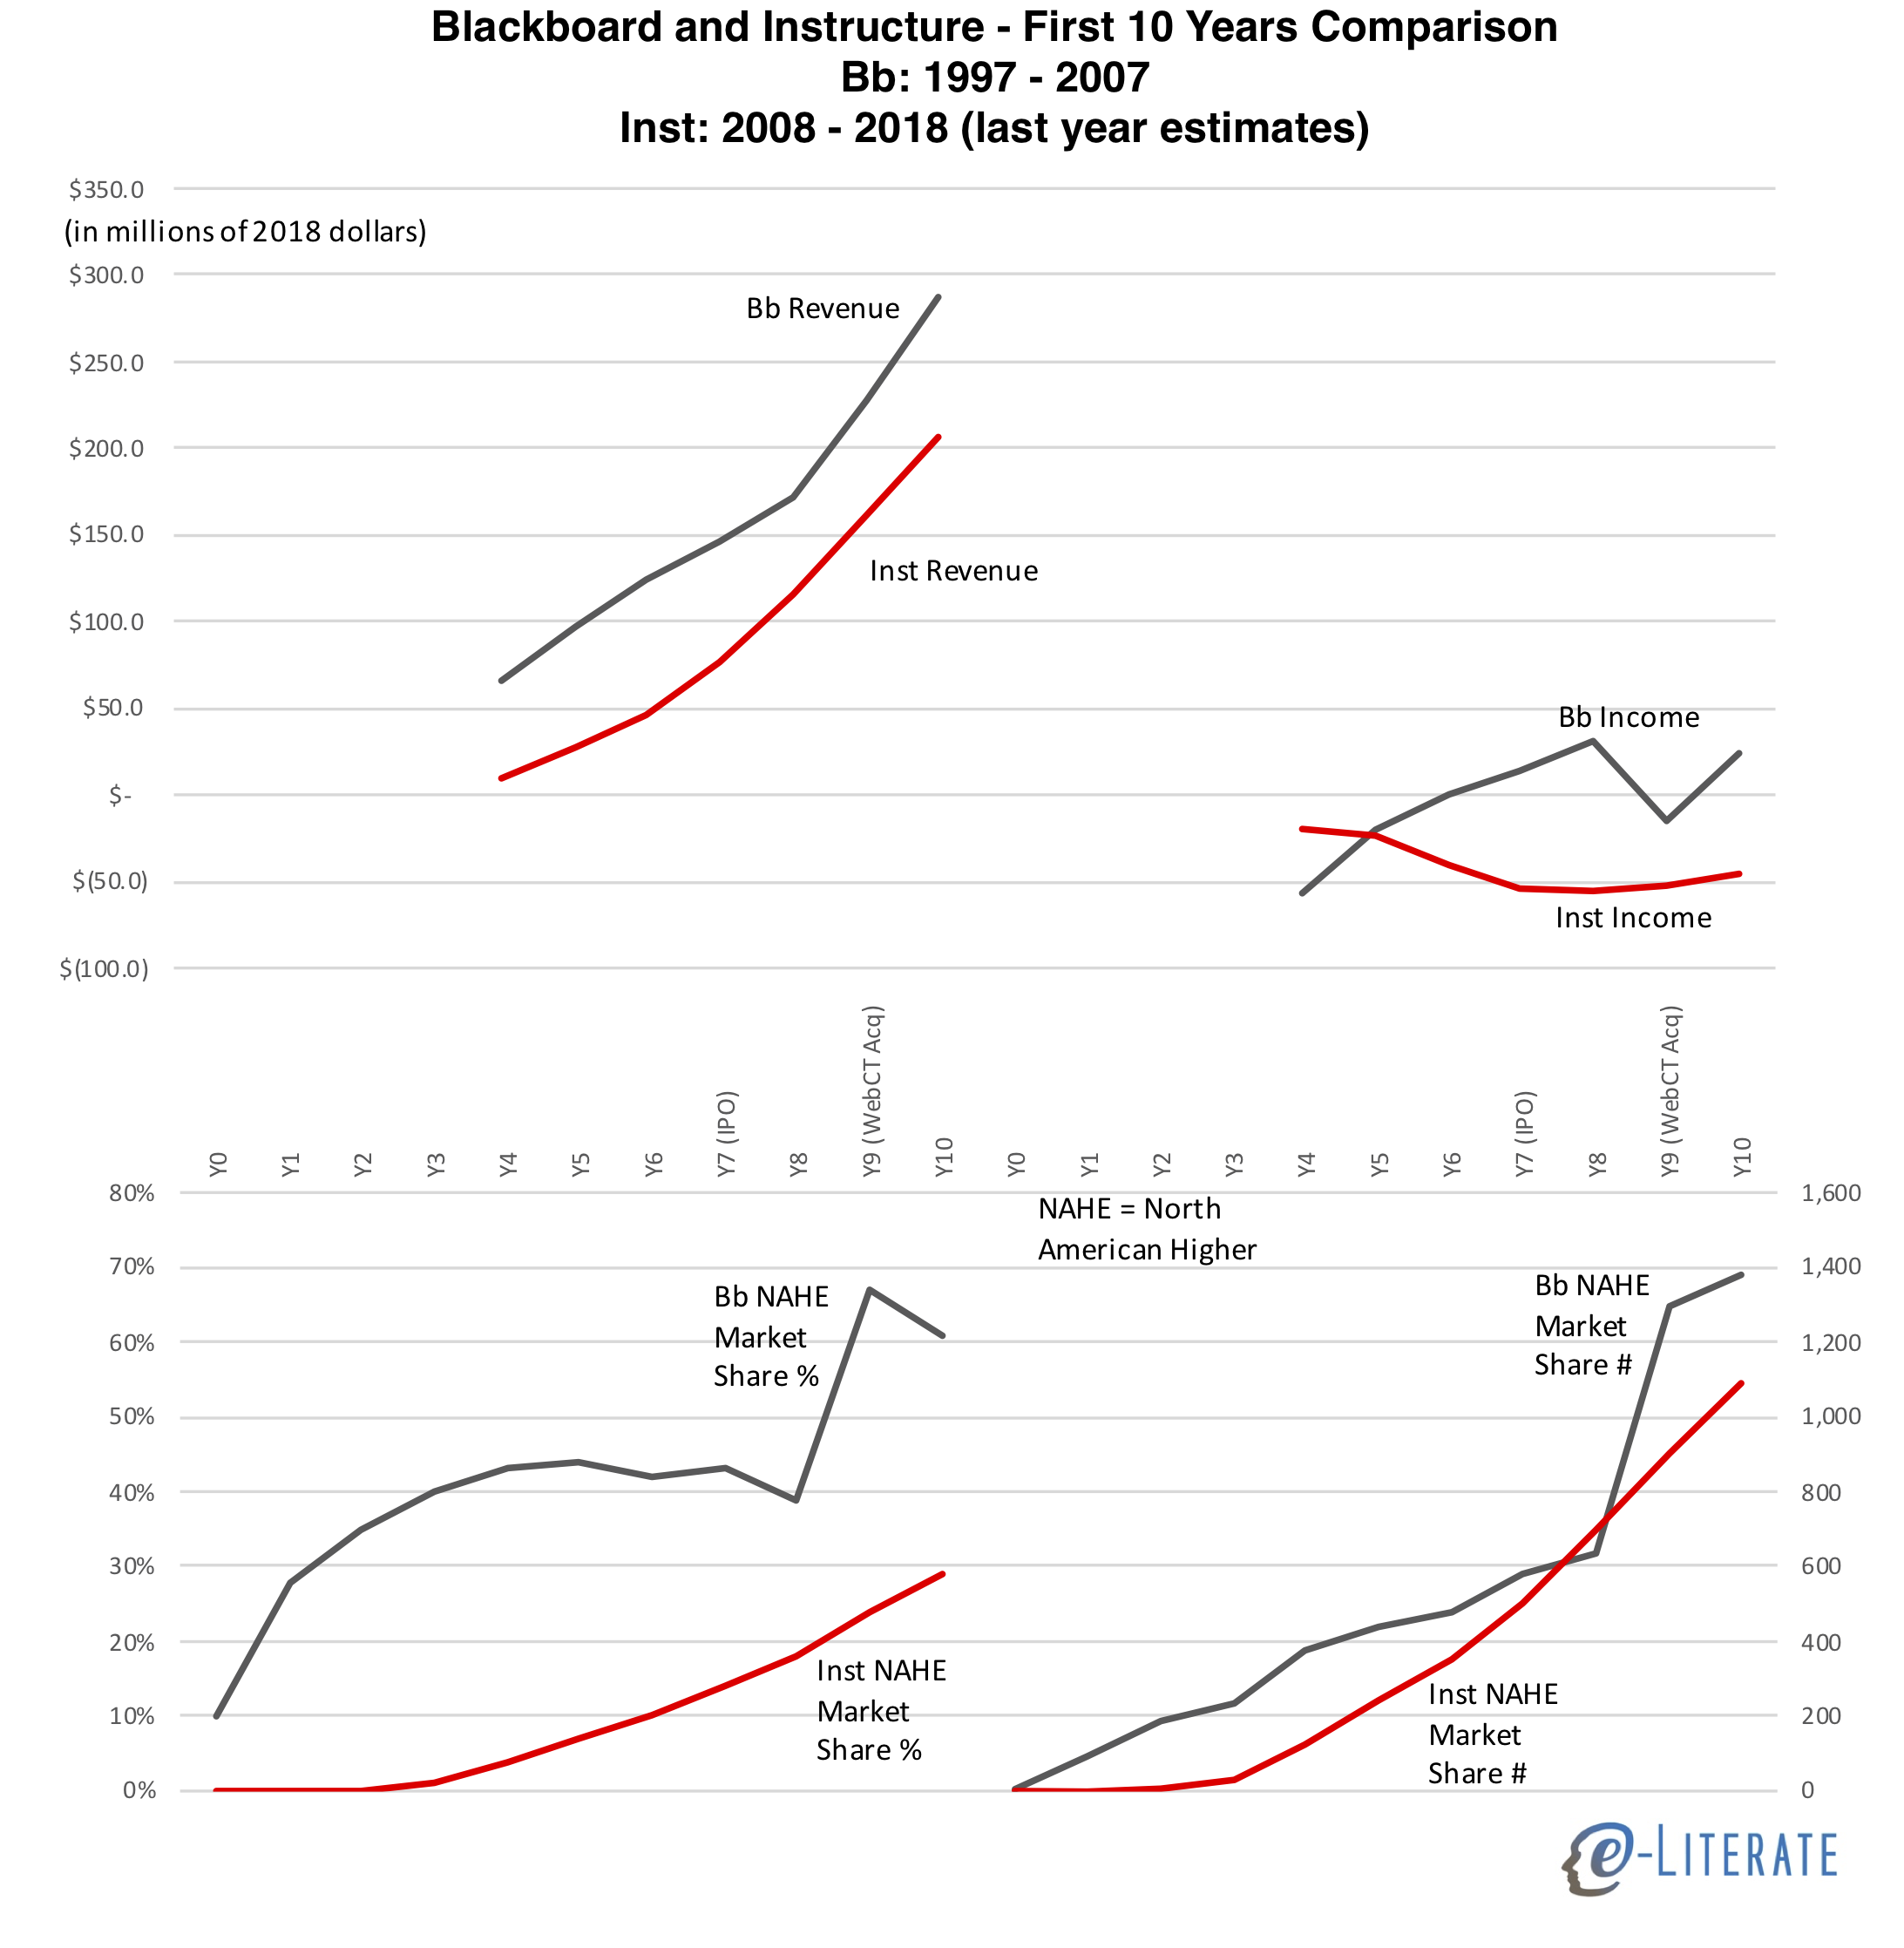
    With that in mind, let’s compare revenue, operating income – both derived from public SEC filings and adjusted to 2018 dollars – and market share in their core NAHE market. The financial data comes from public filings, and data for 2018 for Instructure are estimates based on their outlook presented in the most recent quarterly earnings release. Market share data is based on our LMS Market Analysis service and associated financial analysis for premium subscribers.

    Blackboard and Instructure revenue and income in 2018 dollars, and north american higher ed market share in percentage and numbers

    Some notes:

    • Blackboard raised ~$185 million in venture financing pre-IPO while Instructure raised ~$95 million (both in 2018 dollars). Part of this difference can be attributed to the much higher costs associated with pre-cloud enterprise software deployment models.
    • Blackboard’s revenue was higher than Instructure’s at similar points, and their operating income was mostly positive after Year 6. Instructure has maintained a significant loss each year from operations. One way to explain this difference is that Blackboard’s used funds for corporate acquisitions, thus fueling growth, while Instructure invested funds into sales & marketing and organic growth. This is not the whole story, but it is a big difference between the two companies.
    • In market share represented as a percentage, Blackboard’s growth was much faster, but this was in a period where the market was developing and not all schools had a standard LMS. When viewing this market share in raw numbers, we see that Instructure’s growth would have exceeded Blackboard’s were it not for the Year 9 WebCT acquisition.
    • Blackboard was already showing organic market declines (in NAHE market share %) and slowdowns in raw numbers outside of the immediate WebCT acquisition of customers. Instructure’s organic growth shows no signs yet of slowing down, is less lumpy and more predictable.


  • Moody’s Downgrades Blackboard Debt, Focuses On Learn Ultra Delivery

    Moody’s Downgrades Blackboard Debt, Focuses On Learn Ultra Delivery

    In Spring 2015 Moody’s affirmed their B2 rating for Blackboard’s nearly $1.4 billion in debt as part of the company’s acquisition of Schoolwires, with a negative outlook for the ratings (meaning there was risk of a further downgrade). Three weeks ago, that downgrade took place.

    (“Moody’s”) downgraded Blackboard Inc.’s Corporate Family Rating (“CFR”) by two notches to Caa1, from B2, as well as its Probability of Default Rating, to Caa1-PD, from B2-PD. Moody’s also downgraded Blackboard’s $135 million first-lien revolving credit facility and $920 million (remaining balance) first-lien term loan to B3, from B1, and its $378 million second-lien notes to Caa3, from Caa1. Moody’s also changed Blackboard’s outlook to stable, from negative.

    Put in regular terminology, the previous B2 rating indicated that Blackboard ((Disclosure: Blackboard is a subscriber to our LMS market analysis service and is a sponsor for our recent Empirical Educator Project summit.)) had “the capacity to meet its financial commitments. Adverse business, financial, or economic conditions will likely impair the obligor’s capacity or willingness to meet its financial commitments.” But with the new Caa1 rating, Blackboard “is currently vulnerable, and is dependent upon favorable business, financial, and economic conditions to meet its financial commitments.”

    The rationale for the downgrade is that Blackboard holds a very high amount of debt (now more than $1.4 billion) relative to its earnings, and revenue growth is not coming from its core markets.

    Blackboard’s core North American Higher Education (“NAHE”) and K-12 units, representing 56% of total revenue, continue to show weakening top line results, suggesting that the success of its new Ultra user interface is still uncertain. Blackboard’s international segment, also weak, has shown modest stabilization of late. Only the campus enablement segment, consisting of recently acquired educational community communications and transaction processing services and representing a quarter of Blackboard’s revenues, has shown healthy, reliable revenue growth. Some ratings support is provided by Blackboard’s high level of revenue visibility, with three quarters of 2017 revenues coming from recurring products and services, and underpinned by its 90% renewal rates in 2017. Both of these measures, however, represent declines from prior years.

    The turnaround is stalling, and the credit cards are maxed out. Blackboard has continued to cut costs, including “late-year layoffs”, and Moody’s expects “overall revenues to be flat to down slightly in 2018 as competitors have stifled market share gains”.

    While this is not good news for Blackboard, the ratings action does give the ed tech community additional insight into the operations and health of the company. Blackboard total revenues are between $700 – $720 million, with earnings (EBITDA, adjusted by Moody’s) between $160 – $180 million.

    And in the rationale for the ratings comes specific commentary on Learn Ultra.

    Software renewals have been weaker than expected in the NAHE [North American Higher Ed] segment, as the company strives to sell its latest learning management system (“LMS”) software enhancement, Ultra, into a crowded and very competitive marketplace. Given operating seasonality tied to the academic year, the behind-schedule launch of Ultra, in mid-2016, meant that measurable revenue and EBITDA [Earnings before interest, tax, depreciation and amortization] contributions from it began to be realized only in the 2017 academic year. There are indications that Ultra is gaining traction relative to Canvas and Desire2Learn, and Moody’s believes the packaging of Ultra with transaction- and payment-processing services may support its competitive positioning. But the success of Ultra is far from certain, and the threat from existing and possibly new competitors remains high as barriers to entry, specifically for web-based software, are relatively low. Meanwhile Blackboard, with a brand new CFO, is focusing its research, sales and marketing, and product development resources in an effort to ensure Ultra’s future.

    We have covered the 2014 announcement and ongoing fate of Learn Ultra here at e-Literate, and claiming a “launch of Ultra, in mid-2016” is generous at best. At that point there were educator previews with no ability for institutional adoptions. Fall 2017 is the closest to what I would say is an actual launch. As of a January, 2018 meeting Michael and I had with Blackboard’s management team, they claimed dozens of schools actively piloting Learn Ultra ((I have asked several times for this list, or a subset of this list, of schools piloting Ultra to allow interviews. If and when we receive schools to interview, we will cover in another post.)), and their flagship customer University of Phoenix is beginning rollout of the LMS starting this month.

    What is going well at Blackboard is the movement to a SaaS (software as a service, aka ‘the cloud’) model for the LMS – for both the traditional experience and Ultra experience. As of January there were 284 schools on Learn SaaS and 49 others in migration. In a purchase-only report, Moody’s acknowledged this strength and noted the investment that Blackboard is making in this area (more than $50 m expected in 2018).

    While the company has shown good progress in migrating its legacy Learn customers onto the appropriate SaaS-based platform from which those customers may choose, in turn, to migrate to Ultra, Blackboard’s efforts to make those transitions smooth for its customers have entailed elevated capital expenditures, which will likely continue through 2019, cutting into free cash flow.

    Put this all together, and 2018 is the year that Blackboard needs to transition from ‘wait until Learn Ultra is ready’ to ‘Learn Ultra had better lead to increased sales’.  I have been impressed with the new management team’s transparent approach to dealing with analysts, and with their honest approach to understanding the problems they need to solve. But the company needs to deliver, and this is shaping up to be a newsworthy year for Blackboard, for good or ill. There’s a lot to watch here.

  • Preliminary Data on K-12 LMS Market

    Preliminary Data on K-12 LMS Market

    Over the past several months, we have worked with our partners at LISTedTECH as they ramp up their efforts to collect data on LMS usage in the K-12 market in the United States. This is a massive effort as the market includes more than 130,000 individual public and private schools, and more than 13,600 school districts, according to recent NCES documentation. We are aware of several private data sources with estimates on the K-12 LMS market, but there are no public sources.

    Part of the challenge is that the K-12 market is messier than higher education’s and its roughly 7,200 institutions. One reason is that the general IT infrastructure in K-12 is less mature than in higher ed, and for smaller schools there are a lot of ad hoc implementations running on a local server not even in a data center. Another reason is the availability of free options such as Google Classroom, or freemium options such as that offered by Schoology and Canvas for individual faculty.

    As we build up the data and improve our methods, we believe we are starting to see some interesting trends in the data worth sharing.

    Our initial sample looks at 6,875 public schools from across the country in the NCES-designated primary, middle, high and other (special ed, vocational or alternative) categories. These results were analyzed over several data collection methods along with manual evaluation of that data. That said, we expect to see movement in the numbers as we collect and verify additional data, including LMS usage at private schools.

    As in our analysis of the higher ed market, we are focusing on school-wide implementations of LMS platforms. At many K-12 schools, in the absence of a school-wide implementation, individual teachers opt to use an LMS for their particular classroom, often for free. We do not consider this case a school-wide adoption and therefore do not include those use cases in our data. This methodology does not fully analyze total usage of a platform like Schoology that has a freemium model, including a free option for individual teachers and an enterprise solution which is a school-wide adoption based on a fee per student model. A platform like Google Classroom likewise has usage by individual teachers as well as school-wide implementations.

    Before we share the preliminary data, some caveats are in order to hopefully avoid anyone misrepresenting this information:

    • This is preliminary data that will likely change as we learn more. While we believe there are some broad trends already emerging, there will be refinements as we increase our coverage over time. We expect the changes to be in small adjustments to specific numbers but not in big changes to market shape.
    • This view is based on number of schools that have implemented an LMS, which is a different metric than district-wide implementations (where many or most of the purchasing decisions occur) or implementations scaled by student enrollments. We will add these views in the future.
    • This view is based on installed base (which represents total estimated deployments), which is different than new implementations in a given time period (which would measure market momentum). Again, we will add these views over time, just as we have done for the higher ed LMS market.
    • Due in particular to the free options available in K-12, there will be schools that have more than one LMS available at the institutional level. Google Classroom in particular is often available as an option at a school even when there is another LMS.
    • As is our practice at e-Literate, we’ll describe the caveats and present the data as is. As we learn more, if the relative percentages change significantly, we will share updates.
    • For more information on our data methods, see this post.

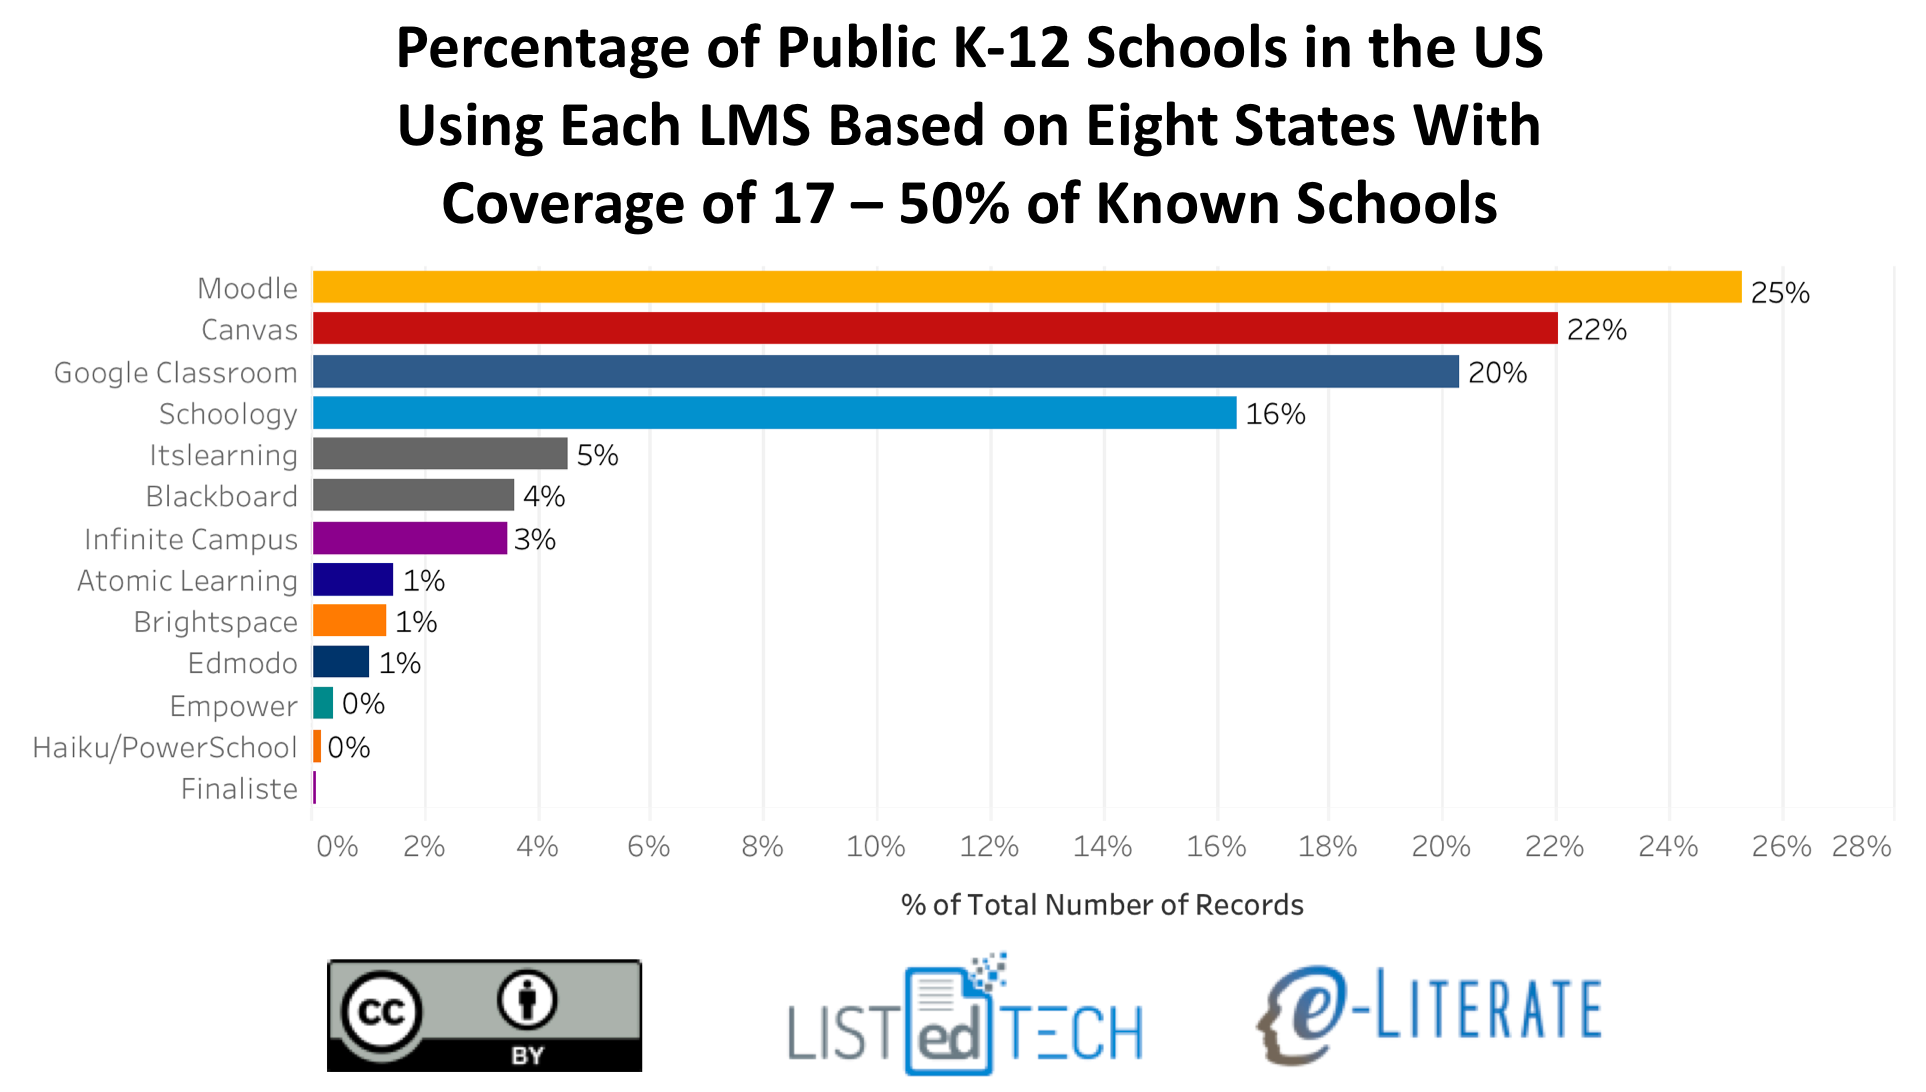
    The first graph presents a view of K-12 school-wide LMS implementations in the United States for the 8 states (and DC) where we have at least 17% coverage of known schools (Alaska, Delaware, District of Columbia, Florida, Massachusetts, Minnesota, Texas, Wisconsin).

    LMS Market Share for K-12 in US, 8 States

    To get a sense of how representative this initial market share is, we made the same calculations across all 6,875 schools from 50 states and DC that in our data thus far. The data for each LMS matched within ~2% for each LMS (e.g. Canvas went from 22% to 24%, Moodle went from 25% to 24%) between the two views.

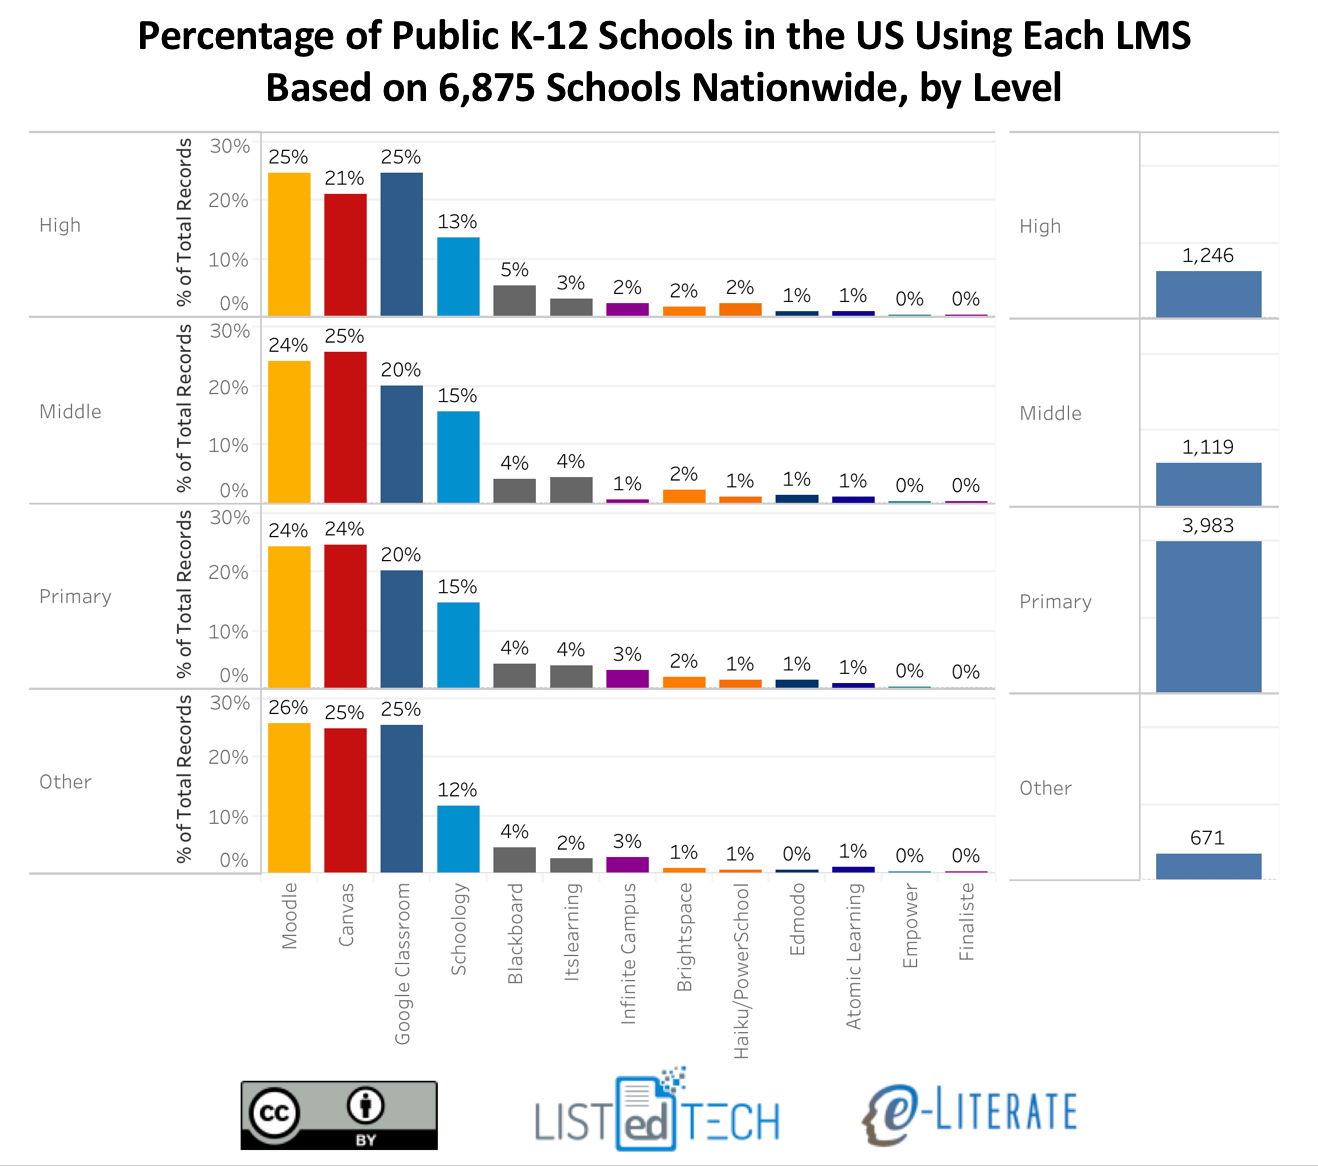
    As in the higher education market, there appears to be four top contenders in K-12 – Moodle, Canvas, Google Classroom, and Schoology – with all others having 5% or less of market share. Moodle and Canvas are both present in the Big Four for both higher education and K-12, but in K-12 Google Classroom and Schoology are the other big players. We believe that this is the first data set showing just how widely Google Classroom has been adopted. ((Disclosure: Instructure, Schoology, Blackboard, and D2L are subscribers to our LMS Market Analysis service; Instructure and Blackboard also are sponsors for an upcoming event we are organizing.))

    The general distribution is somewhat consistent across school levels – primary, middle, high school, and others – with some interesting smaller variations. The following view also gives a sense of our relative data coverage by level. In this case we are using all our data across the 6,875 schools. Note that totals are higher than this number due to multiple systems being available at some schools.

    LMS Market Share for US K-12, By Level

    We hope this new data provides a broader view of the academic LMS market. We’d love to hear your feedback and questions.