e-Literate

Present is Prologue

Tag: Canvas

  • Preliminary Data on K-12 LMS Market

    Preliminary Data on K-12 LMS Market

    Over the past several months, we have worked with our partners at LISTedTECH as they ramp up their efforts to collect data on LMS usage in the K-12 market in the United States. This is a massive effort as the market includes more than 130,000 individual public and private schools, and more than 13,600 school districts, according to recent NCES documentation. We are aware of several private data sources with estimates on the K-12 LMS market, but there are no public sources.

    Part of the challenge is that the K-12 market is messier than higher education’s and its roughly 7,200 institutions. One reason is that the general IT infrastructure in K-12 is less mature than in higher ed, and for smaller schools there are a lot of ad hoc implementations running on a local server not even in a data center. Another reason is the availability of free options such as Google Classroom, or freemium options such as that offered by Schoology and Canvas for individual faculty.

    As we build up the data and improve our methods, we believe we are starting to see some interesting trends in the data worth sharing.

    Our initial sample looks at 6,875 public schools from across the country in the NCES-designated primary, middle, high and other (special ed, vocational or alternative) categories. These results were analyzed over several data collection methods along with manual evaluation of that data. That said, we expect to see movement in the numbers as we collect and verify additional data, including LMS usage at private schools.

    As in our analysis of the higher ed market, we are focusing on school-wide implementations of LMS platforms. At many K-12 schools, in the absence of a school-wide implementation, individual teachers opt to use an LMS for their particular classroom, often for free. We do not consider this case a school-wide adoption and therefore do not include those use cases in our data. This methodology does not fully analyze total usage of a platform like Schoology that has a freemium model, including a free option for individual teachers and an enterprise solution which is a school-wide adoption based on a fee per student model. A platform like Google Classroom likewise has usage by individual teachers as well as school-wide implementations.

    Before we share the preliminary data, some caveats are in order to hopefully avoid anyone misrepresenting this information:

    • This is preliminary data that will likely change as we learn more. While we believe there are some broad trends already emerging, there will be refinements as we increase our coverage over time. We expect the changes to be in small adjustments to specific numbers but not in big changes to market shape.
    • This view is based on number of schools that have implemented an LMS, which is a different metric than district-wide implementations (where many or most of the purchasing decisions occur) or implementations scaled by student enrollments. We will add these views in the future.
    • This view is based on installed base (which represents total estimated deployments), which is different than new implementations in a given time period (which would measure market momentum). Again, we will add these views over time, just as we have done for the higher ed LMS market.
    • Due in particular to the free options available in K-12, there will be schools that have more than one LMS available at the institutional level. Google Classroom in particular is often available as an option at a school even when there is another LMS.
    • As is our practice at e-Literate, we’ll describe the caveats and present the data as is. As we learn more, if the relative percentages change significantly, we will share updates.
    • For more information on our data methods, see this post.

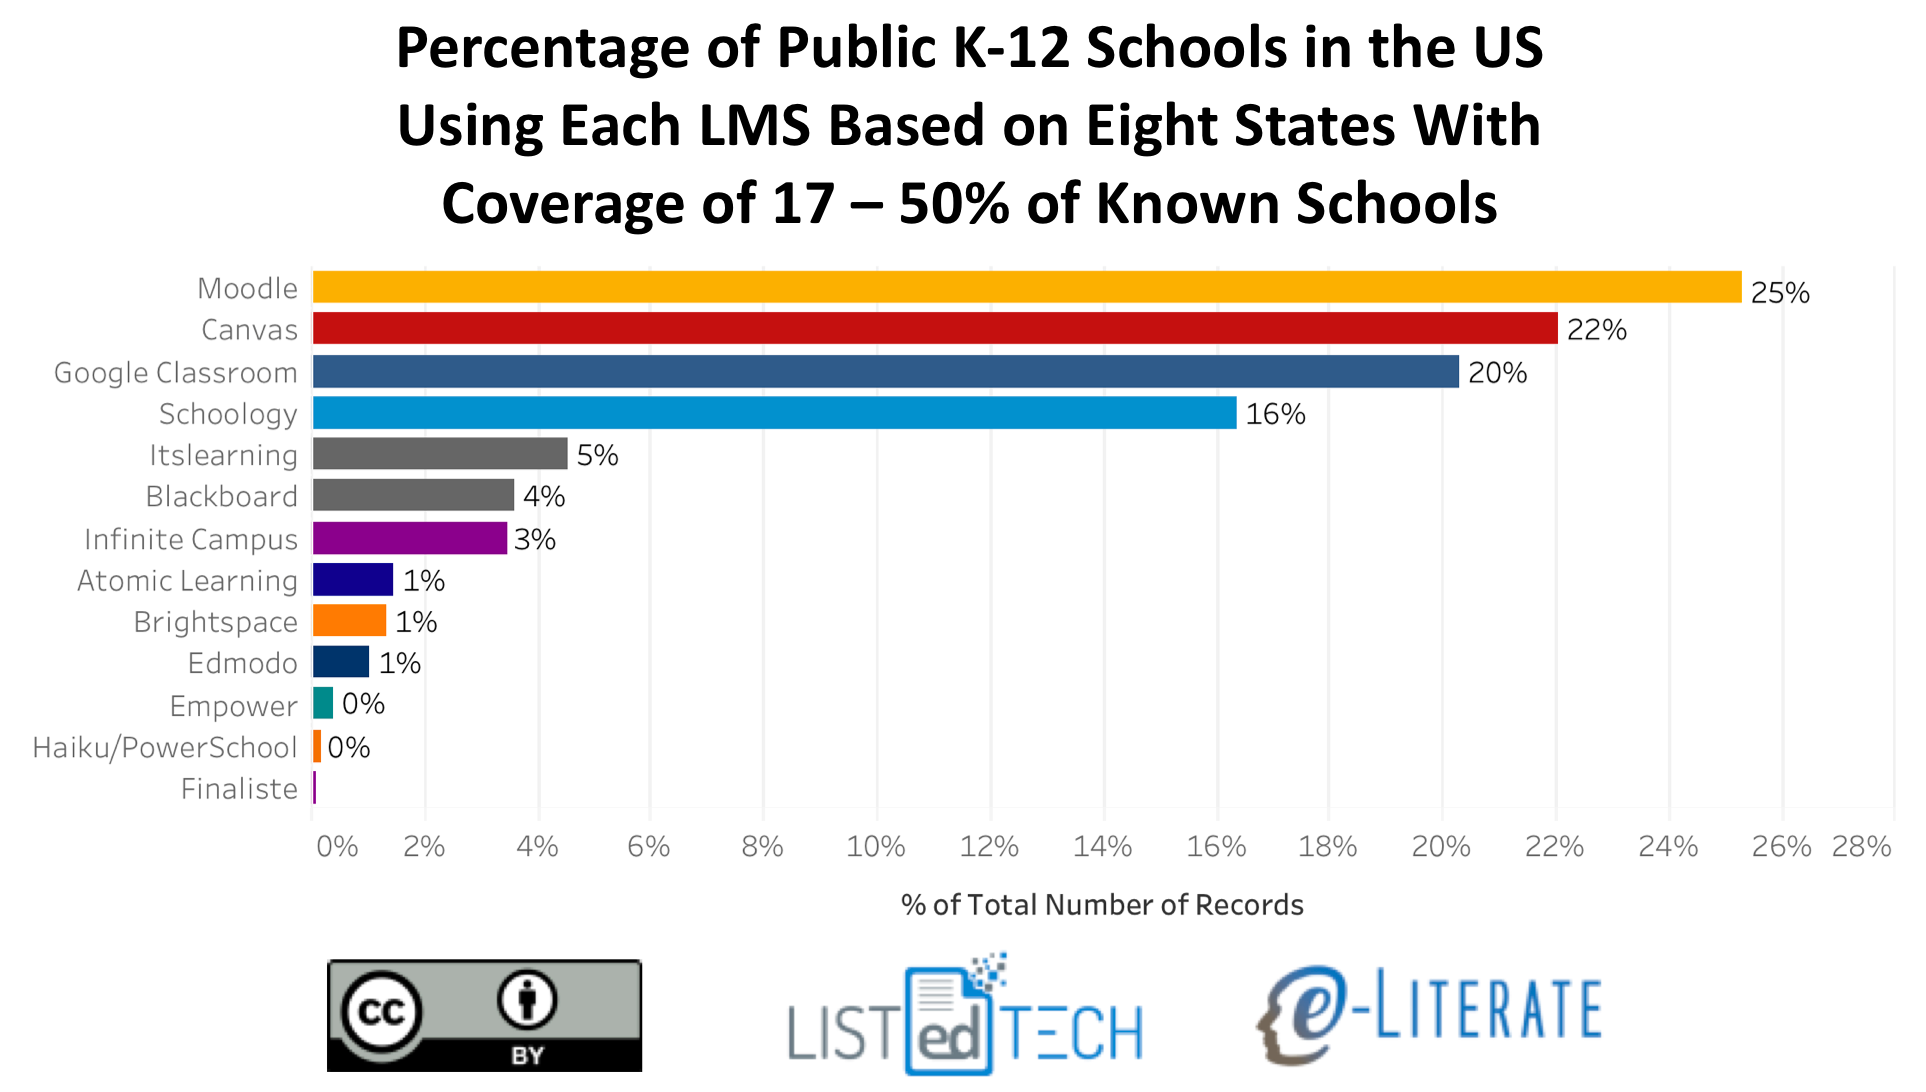
    The first graph presents a view of K-12 school-wide LMS implementations in the United States for the 8 states (and DC) where we have at least 17% coverage of known schools (Alaska, Delaware, District of Columbia, Florida, Massachusetts, Minnesota, Texas, Wisconsin).

    LMS Market Share for K-12 in US, 8 States

    To get a sense of how representative this initial market share is, we made the same calculations across all 6,875 schools from 50 states and DC that in our data thus far. The data for each LMS matched within ~2% for each LMS (e.g. Canvas went from 22% to 24%, Moodle went from 25% to 24%) between the two views.

    As in the higher education market, there appears to be four top contenders in K-12 – Moodle, Canvas, Google Classroom, and Schoology – with all others having 5% or less of market share. Moodle and Canvas are both present in the Big Four for both higher education and K-12, but in K-12 Google Classroom and Schoology are the other big players. We believe that this is the first data set showing just how widely Google Classroom has been adopted. ((Disclosure: Instructure, Schoology, Blackboard, and D2L are subscribers to our LMS Market Analysis service; Instructure and Blackboard also are sponsors for an upcoming event we are organizing.))

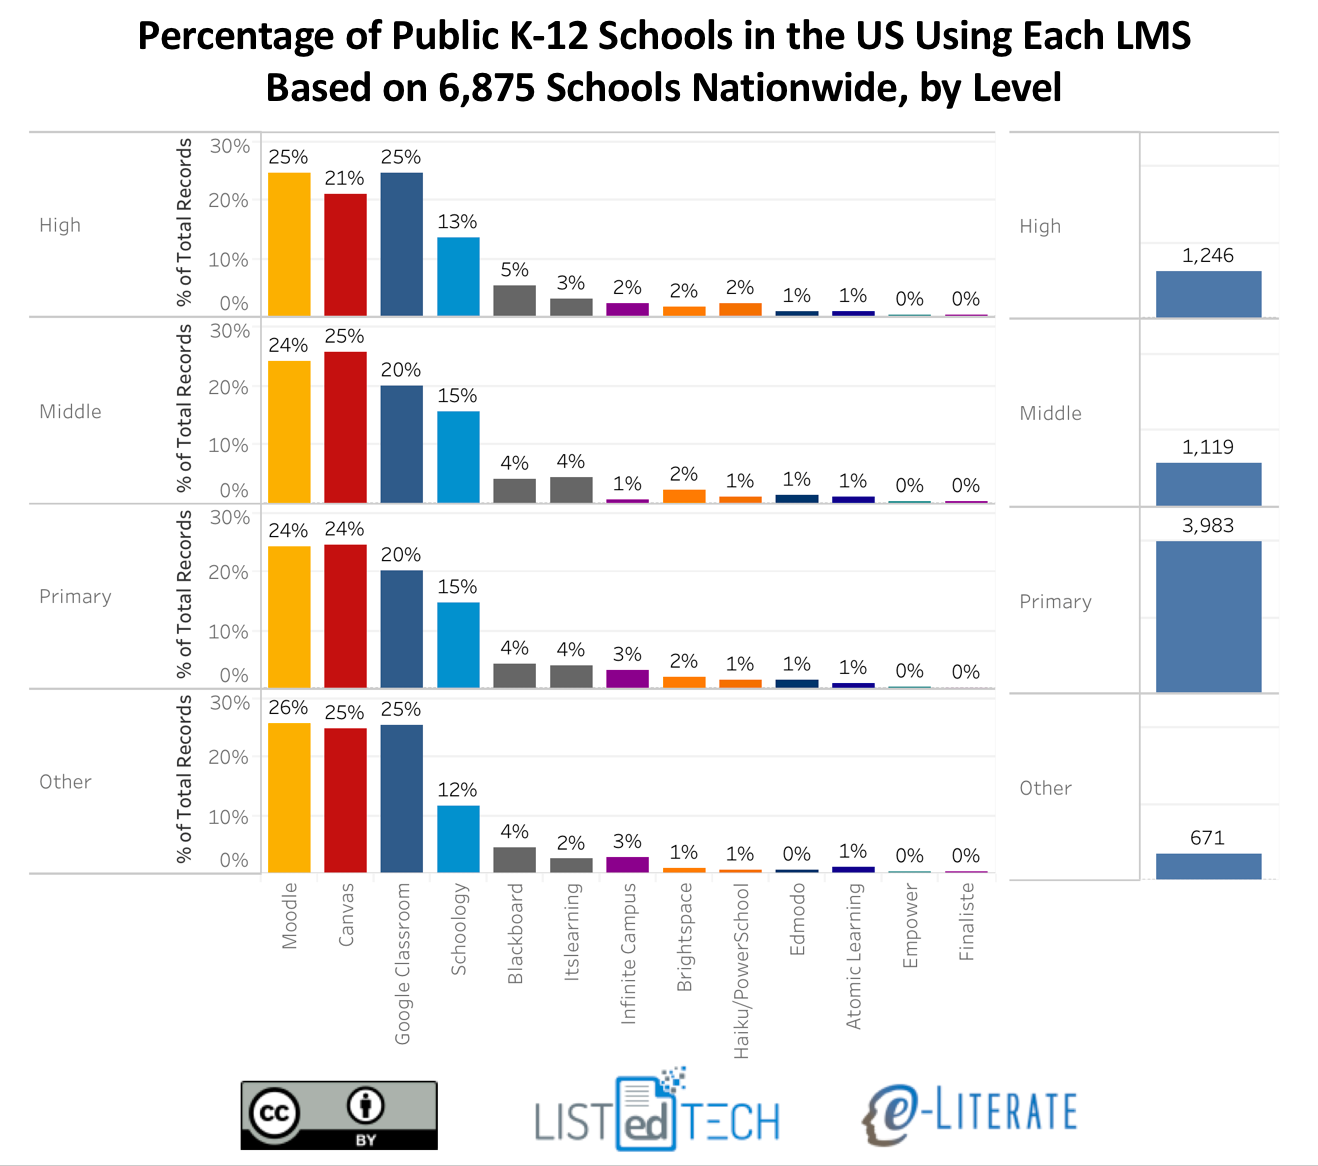
    The general distribution is somewhat consistent across school levels – primary, middle, high school, and others – with some interesting smaller variations. The following view also gives a sense of our relative data coverage by level. In this case we are using all our data across the 6,875 schools. Note that totals are higher than this number due to multiple systems being available at some schools.

    LMS Market Share for US K-12, By Level

    We hope this new data provides a broader view of the academic LMS market. We’d love to hear your feedback and questions.

  • State of Higher Ed LMS Market for US and Canada: Fall 2017 Edition

    State of Higher Ed LMS Market for US and Canada: Fall 2017 Edition

    Now that we’re past the 2017 WCET conference and headed to the EDUCAUSE conference, let’s look at updates on the institutional LMS market for North America (US and Canada). Last year we started our LMS market analysis service, where we are working with LISTedTECH to provide market data and visualizations, and our fall report for subscribers will be released in about a month. Data for 2017 presented below goes through October 1 of this year.

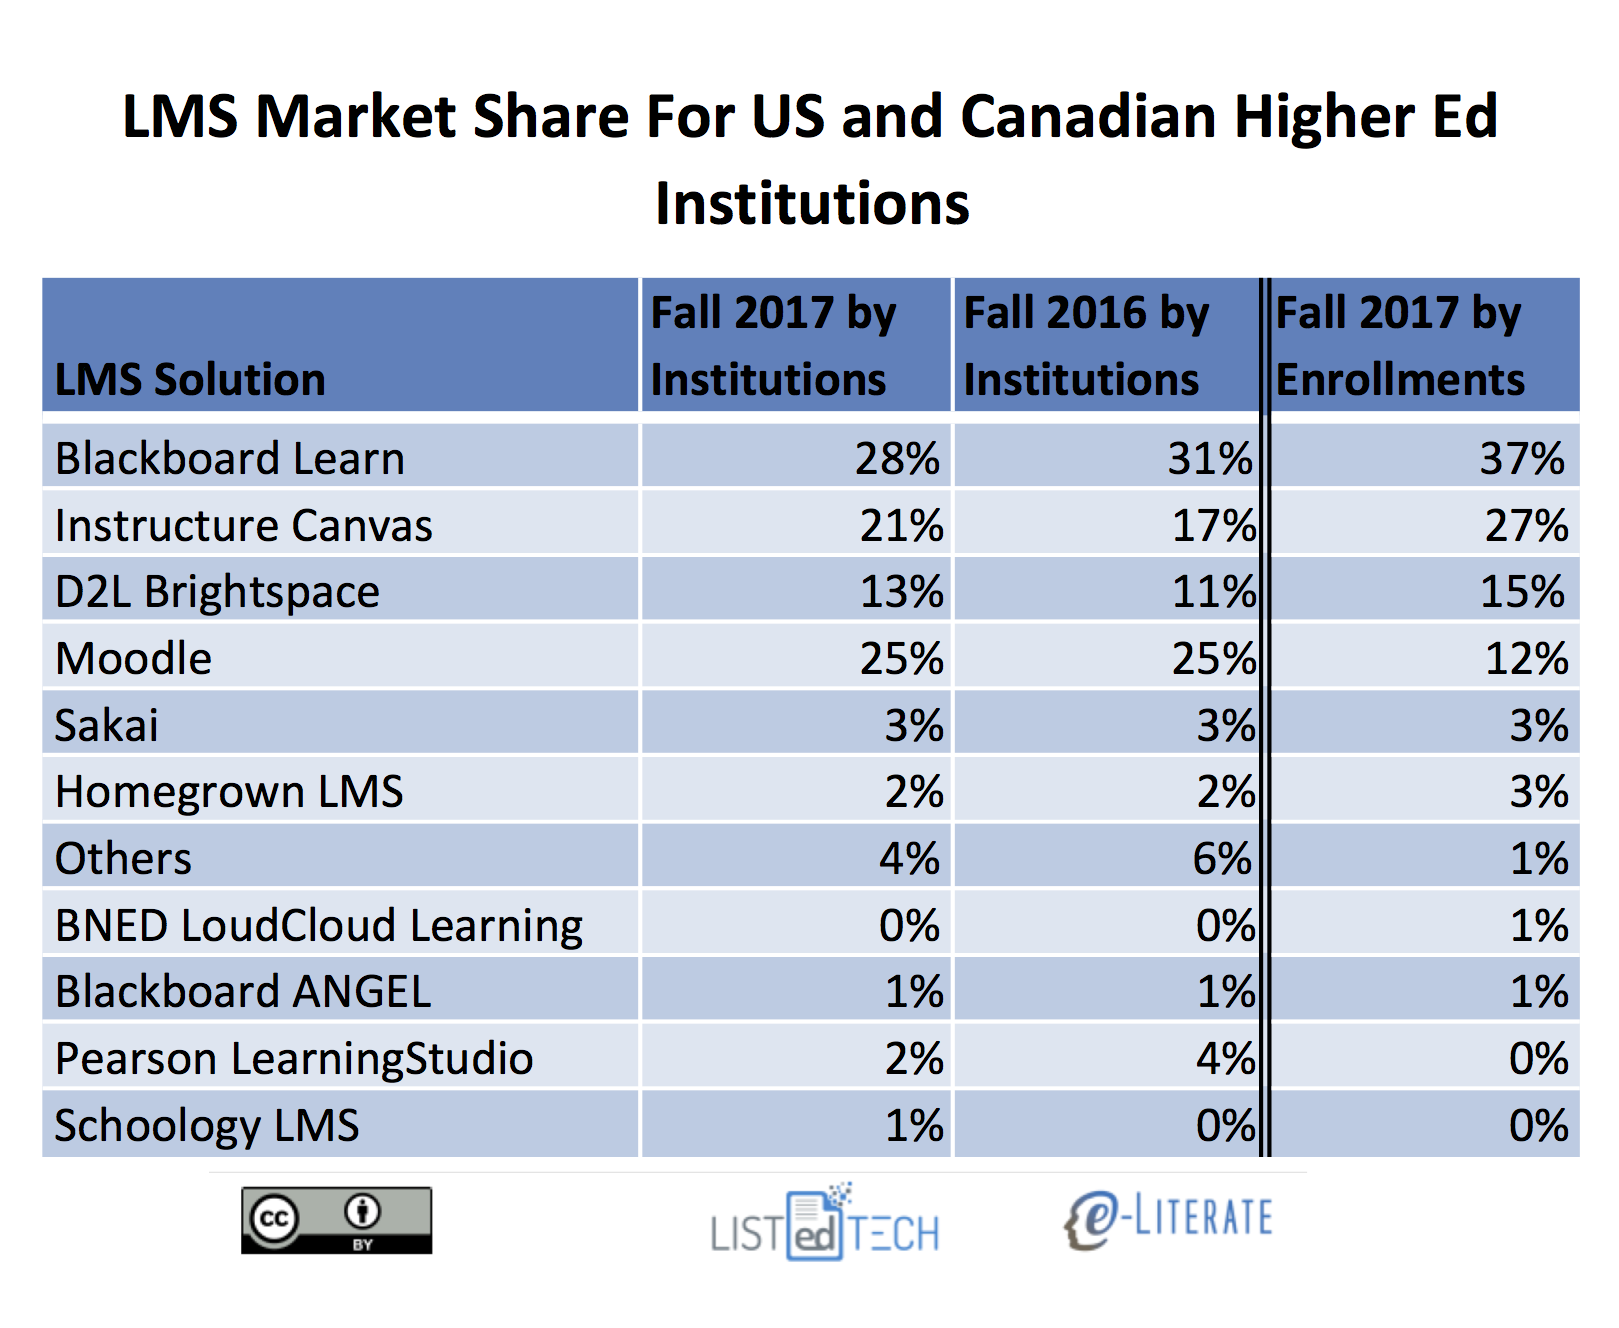
    We present the data “by institutions”, with market share as a percentage of the total number of institutions using each LMS as a primary system, and “by enrollments”, where we scale the institutions by their total enrollment. The latter better captures the business of the LMS market, since most licensing deals are based the number of students. We have also included data from Fall 2016 by institutions for comparison purposes.

    Some notes on the market share as defined by percentage of institutions:

    • In terms of new selections the market continues to be a two-horse race recently with Canvas by Instructure and Brightspace by D2L as the only two solutions with material gains in market share. Canvas grew from 17% to 21% , and Brightspace from 11% to 13%, of the market.
    • Outside of the big four – Blackboard Learn, Canvas, D2L Brightspace, and Moodle – no other system has more than 3% of the market measured either by percentage of institutions or percentage of enrollments. Furthermore, the category of “Others”, capturing systems not listed above and having less than 1% market share, actually dropped from 4% to 2% of the market. This indicates that continued market consolidation.
    • Schoology and BNED LoudCloud grew slightly, but not nearly to the degree of the Canvas and Brightspace.
    • Blackboard Learn fell the farthest, from 31% to 28% of of the market. The second biggest drop was Pearson LearningStudio, from 4% to 2%, based on its end-of-life notice for December 2017.
    • Moodle and Sakai both lost market share of just under 1%, not enough to show up in the rounded numbers in the table but enough to show up in our underlying data.
    • The difference in Moodle’s market share by institutions at 25% and by enrollments at 12% really shows how concentrated their usage is for smaller schools.
    • When viewing market share as defined by percentage of enrollments, Blackboard and Canvas are the most-used systems, at 37% and 27% of the market, followed by D2L at 15% and Moodle at 12%.

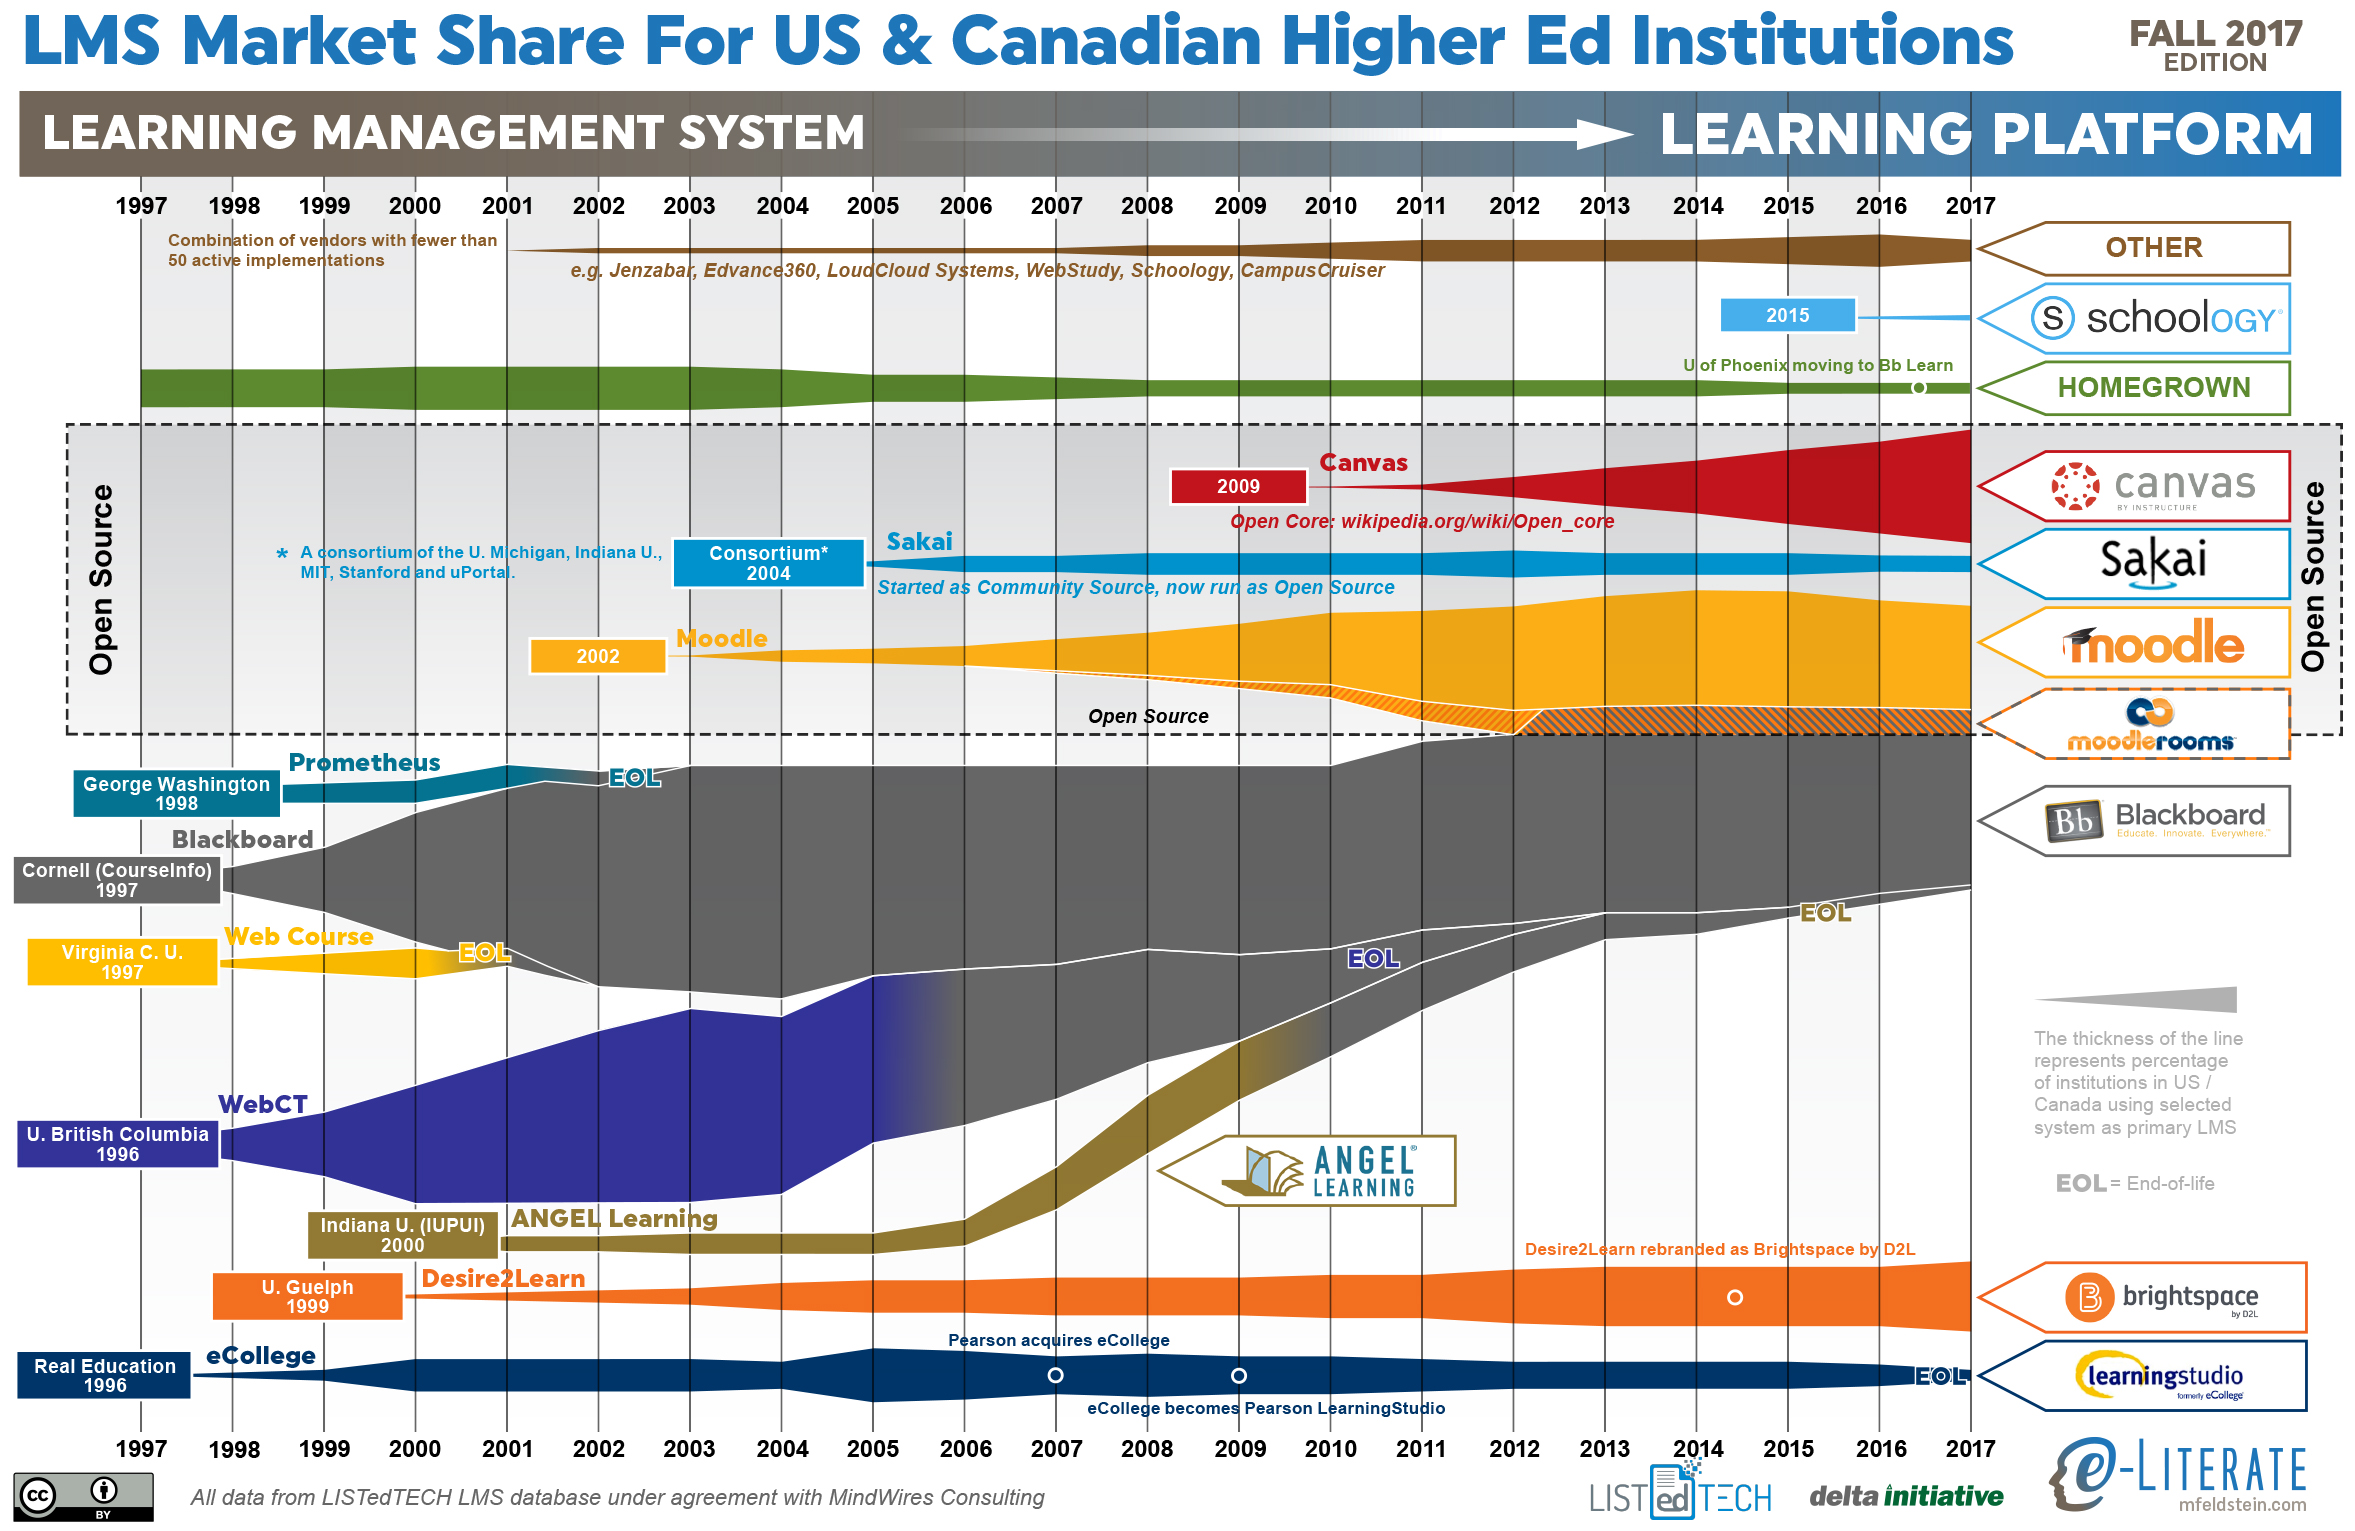
    Stepping back from the immediate data, let’s look at an updated LMS market share graphic, commonly known as the squid graphic, for US and Canadian higher education. The original idea remains – to give a picture of the LMS market in one page, highlighting the story of the market over time. The key to the graphic is that the width of each band represents the percentage of institutions using a particular LMS as its primary system.

    Some additional notes:

    • Blackboard and Moodle have been the market leaders as number one and two in share as they have been for the past decade. However, Canvas is quickly approaching Moodle’s market share.

    We’ll share any updates we discover at the conference this week.

  • Unizin Membership Now Set As Annual Fee Of Up To $427.5k

    Unizin Membership Now Set As Annual Fee Of Up To $427.5k

    I’ve been meaning to provide an update on Unizin now that the consortium is three years old (started officially in July 2014). Thanks to public documents from the University of Minnesota, one of the 11 founding members, we now have additional clarity on the ongoing costs to remain a member of Unizin.

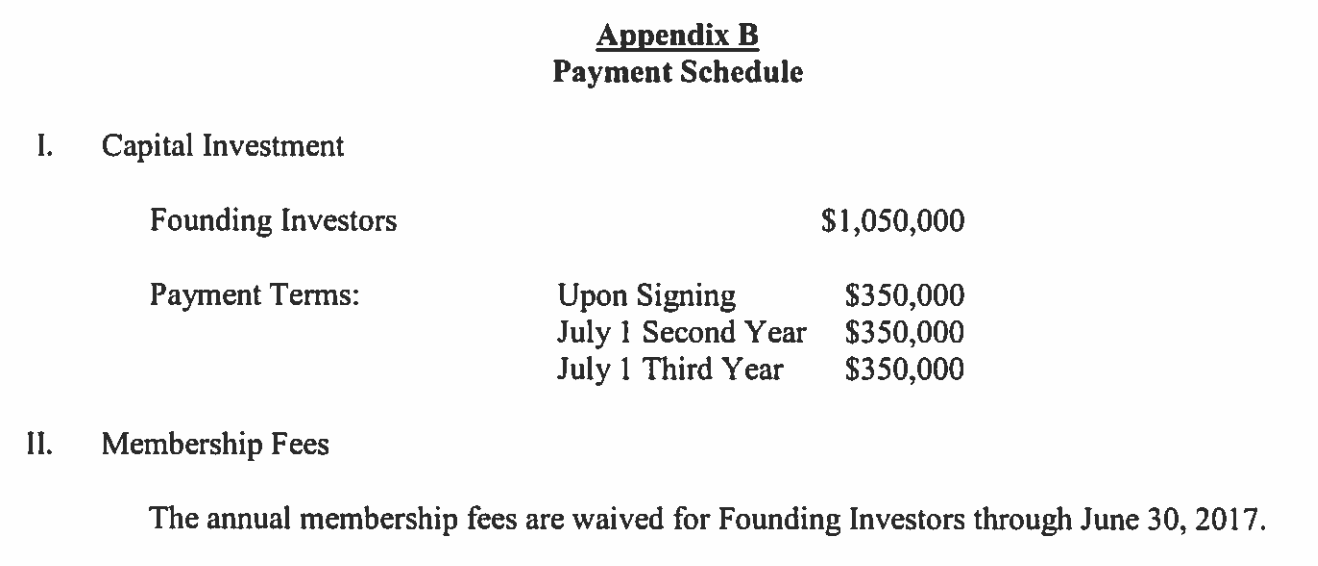
    Membership Fees

    For some background, Colorado State University staff back in April 2014 described the $1,050,000 initial fee in their meeting minutes for the University Technology Fee Advisory Board:

    3. Will this decrease overall costs on our end through collaboration?
    a. We are investing $1 million up front, but there is about a 7-year payback. We are investing in a $10 million product since the other 9 universities are putting their money in as we are too. This will absolutely decrease our costs.

    One year later, when the Florida State University System joined Unizin as associate members, we noted this item from the University of Florida / Unizin Consortium Membership Agreement:

    We noted at e-Literate in our article from 2015:

    Does this mean that founding institutions that “invested” $1.050 million over three years will have to start paying annual fees of $100,000 starting in June 2017? That’s my assumption, but I’m checking to see what this clause means and will share at e-Literate.

    Update (7/17): I talked to Amin Qazi today (CEO of Unizin) who let me know that the annual membership fee for institutional members (currently the 11 schools paying $1.050 million) has not be determined yet.

    Fast forward to 2017 and we have an answer. The University of Minnesota has to submit purchases over $1 million to its board of regents for consent, and at the July 2017 meeting the new Unizin membership fees were presented:

    To Unizin, Ltd. for $1,282,500 for a three-year renewal of membership in the higher education consortium for the Office of Information Technology (OIT) for the period July 1, 2017, through June 30, 2020. The annual payment of membership fees will be covered from OIT’s central O&M funds. The FY18 budget includes planning and funding for this expense.

    That equals $427,500 per year for the next three years for the 70,000+ enrollment university. What this now makes clear is that the up-front investment in Unizin was not a one-time fee broken up into three easy payments. Unizin member has an ongoing annual fee set in three-year periods.

    I again asked Amin Qazi for clarification, including whether all Unizin members were now paying the higher fee ($427.5k vs. $350k for initial three years). Amin confirmed via email:

    Unizin is a non-profit organization and seeks to cover its costs. We have found that our cost to provide our services and tools somewhat scale with the size of the institution. The Unizin Founding Member Fees have been adjusted after the initial three year period. So while larger institutions do pay more, smaller institutions pay less. We anticipate further adjustments as we grow and are able to recognize even greater economies of scale.

    I would then assume that the University of Minnesota, along with University of Michigan and Penn State University, are paying at the highest level and more than $350k, and that smaller schools like the University of Iowa and the University of Nebraska are paying less than $350k.

    LMS Fees

    The same University of Minnesota document also describes their costs for the Canvas ((Disclosure: Instructure is a subscriber to our market analysis service.)) LMS based on the Unizin agreement.

    To Unizin, Ltd. for $5,023,000 for a purchase of Canvas Learning Management System (LMS) for the Office of Information Technology (OIT) for the period July 1, 2017 through June 30, 2022. [snip]

    Unizen [sic], on behalf of its member institutions, conducted a competitive Request for Proposal followed by a detailed evaluation process. Through this process Canvas by Instructure was selected as a Learning Management System (LMS). The University then conducted a two year pilot of Canvas and a majority of the stakeholders preferred Canvas to the University’s current LMS, Moodle. Most of the Big Ten schools have adopted or are adopting Canvas.

    The University receives an additional 30% discount by purchasing Canvas through Unizen [sic] rather than purchasing directly through Infrastructure [sic] and 3% caps on annual increases, rather than 5%, has been negotiated.

    This five-year deal comes out to $12 – $14 per student per year. The document does not specify what level of support they have chosen, although they describe a “dedicated test server”.

    New Associate Members

    In other news, Unizin announced in July that the University of Nebraska system has joined as associate members.

    The Unizin Consortium is thrilled to welcome the full University of Nebraska system, bringing the total number of institutions in the consortium to 25. With the addition, the University of Nebraska at Kearney, University of Nebraska at Omaha, and University of Nebraska Medical Center join Unizin Founding Member the University of Nebraska Lincoln.

    Note that associate members do not pay the same amount as full members. In Florida, the State University System deal costs each associate member $100k per year.

    We’ll likely give updates at e-Literate after the EDUCAUSE conference on how Unizin has evolved in terms of services and potential new members. But for now we at least have more clarity on the financial terms of the consortium.

  • University of Wisconsin System to Migrate From D2L Brightspace to Canvas LMS

    University of Wisconsin System to Migrate From D2L Brightspace to Canvas LMS

    In one of the most significant LMS selection projects of the past few years, the University of Wisconsin System (UWS) has chosen to migrate from D2L’s Brightspace to Canvas as its centrally-supported Learning Management System (LMS). ((Disclosure: UWS, UW Madison, Instructure, and D2L are all subscribers to our market analysis service, and we aided UWS in the needs analysis portion of this project.)) UW Madison already moved to Canvas as part of its Unizin membership, but now the rest of the 180,000 student, 26 campus system will also make the change.

    The decision was first noted on the UWS procurement portal and in a investor analysis note from Raymond James. A representative from UWS confirmed the news and added that “Canvas has been issued the Notice of Intent to Award and a final contract is going to the UW System Board of Regents for formal approval in October”.

    The UWS project page describes the process leading up to the LMS selection, starting with needs analysis kickoff in 2015.

    The Learning Environment Needs Analysis (LENA) project was undertaken as a continuation of a multi-year UW System effort to: 1) understand the current and future learning technology landscape, 2) uncover the wants and needs of UW System institutions with regard to academic technologies that support teaching and learning, and 3) identify gaps that exist in supporting teaching and learning through academic technology. The results of the LENA project were presented to the Learn@UW Executive Committee, along with a recommendation that the Committee charter the process for planning to move into a next generation learning environment for the UW System. The intention was that through this process, UW System would discover potential paths forward to support such an environment.

    Last year UWS developed the request for proposal (RFP) requirements list, and the formal RFP was released in January of 2017.

    Beyond the size of the system, UWS decision is significant due to it being the first major customer of Desire2Learn (as the company was known prior to 2014). Back in 2002 / 2003, most LMS decisions were framed as Blackboard vs. WebCT, and when UWS selected little-known D2L, it sent shock waves through the market. The decision really put D2L on the map as a true contender, and they followed up with wins at the University of Iowa ((Disclosure: In previous consulting company I advised U Iowa on their LMS selection.)), the Ohio State University, Minnesota State Colleges and Universities, and the University System of Georgia.

    We have noted several times at e-Literate and as part of the e-Literate Big Picture: LMS market analysis service that D2L has an impressive record of client retention. The company has been a fierce competitor in keeping customers, as seen when the Colorado Community College System recently chose to remain on D2L Brightspace after their LMS selection process. ((Disclosure: CCCS is a subscriber to our market analysis service. I also advised CCCS when they originally chose D2L in 2008.)) This loss of UWS is the biggest setback for the company in terms of losing clients, and it is a major win for Instructure’s Canvas system.

    Expect more market news to come out in the next month based on WCET and ECUCAUSE conferences.

  • InstructureCon 2017: Culture as a competitive weapon

    InstructureCon 2017: Culture as a competitive weapon

    In our recent coverage of BbWorld and D2L Fusion, Michael and I came away impressed. Both companies are improving and doing so in ways showing them listening to customers, empathizing, and developing product enhancements with more engaging user experiences. Both companies are doing so by attempting to change their company cultures to support these behaviors. Their challenge, however, is that Instructure is already there – their company culture has supported simplicity, customer-centric empathy, and openness from day one. And what struck me (again) at this year’s InstructureCon was how well the company is managed and how consistent is their approach, over time and throughout the organization.

    Instructure launched its Canvas LMS back in 2010, and it is remarkable how Michael’s description from June 2010 could still be applied today.

    If I had to summarize Instructure’s strategy in one sentence, it would be “They use the lessons learned by consumer web companies to clear the clutter out of LMS software design and business model.” They’re not focusing particularly on open education or analytics or any other hot topics in online education, although they are aware of these and do pay some attention to them. Rather, they are looking at core use cases and trying to make them as simple as possible, throwing out some outdated LMS design assumptions in the process.

    From the early days when they had dozens of employees to today, when they have over 1,100 employees, the strategy is the same and the company culture is the same. This despite the departure of both founders and the 2015 IPO and all the resultant pressure from investors.

    This is Instructure’s secret. They continue to manage the company to support the strategy of clearing the clutter out of LMS software design and business models.

    Product News

    The biggest product news at InstructureCon this year:

    • Release of Gauge, an assessment management platform for K-12 usage, which might impact higher ed in the future
    • Redesigned Quiz engine and Gradebook, leading to what we saw as the biggest interest from conference attendees
    • Release of blueprint courses
    • Investment in back-end platform design (e.g. microservices) to increase speed of design improvements
    • Reintroduction of analytics – visualizations initially targeted at faculty usage
    • Introduction of Alexa integration

    The focus on assessments, quizzes and grade books is both problematic and encouraging. Problematic for the industry as we spend too much time on measurements and grading and accountability and too little time on learning and continuous formative assessment. Yes, the quizzing engine can be used for formative assessment, but in most cases the usage is for summative assessment. But even with this viewpoint, it is encouraging that the primary focus of these product enhancements to Canvas is on reducing the time spent on the grading activities. It is a fact of life that an enormous amount of effort is spent by faculty, particularly in the US, on managing grades. It is good to see tools that directly reduce the pain in this area.

    In a standing-room only session, Instructure’s Christi Wruck explained the initial phase of a multi-year effort to redesign and improve the grade book. Most features shown were of the nature of reducing the number of clicks or simplifying the navigation of grading activities. I won’t go into the minutiae here, but this session seemed to generate the most excitement at the conference.

    The (re)introduction of analytics surprised me, as I had seen most public efforts in Canvas lately focusing on getting data out to let customers do their own analytics. The initial analytics in Canvas were introduced in 2012, and there were and are a few cool visualizations for faculty mostly, but there is little meat on the bones. There never seemed to be a real product strategy on the developing role of analytics within an LMS nor a full team to work on this challenge. In the meantime they rolled out Canvas Data, which we have talked to staff from several colleges and universities who are actively playing with and exploring the data. But this year Instructure described how they’ve been hiring a new analytics team and working on new visualizations. As with the previous effort, the initial focus is on helping faculty get a better view of how students are performing. We will have to watch this current focus on analytics to see if a real strategy develops.

    Blueprint Courses is a overdue features set to allow course design templates or components across courses or shared between instructors. This capability finally provides direct support for centralized course design models involving master courses and multiple course shells as typically used in large online programs. While this capability could be considered late, conference attendees seemed to be quite impressed with the design of the new features.

    Market News

    I shared in my post on D2L’s Fusion conference how their Brightspace LMS has made impressive wins recently, particularly for schools with large online programs. Canvas continues to gain market share and lead all competitors in new implementations (schools choosing a new LMS), but over the past 12 months they’ve allowed D2L to at least become a clear competitor.

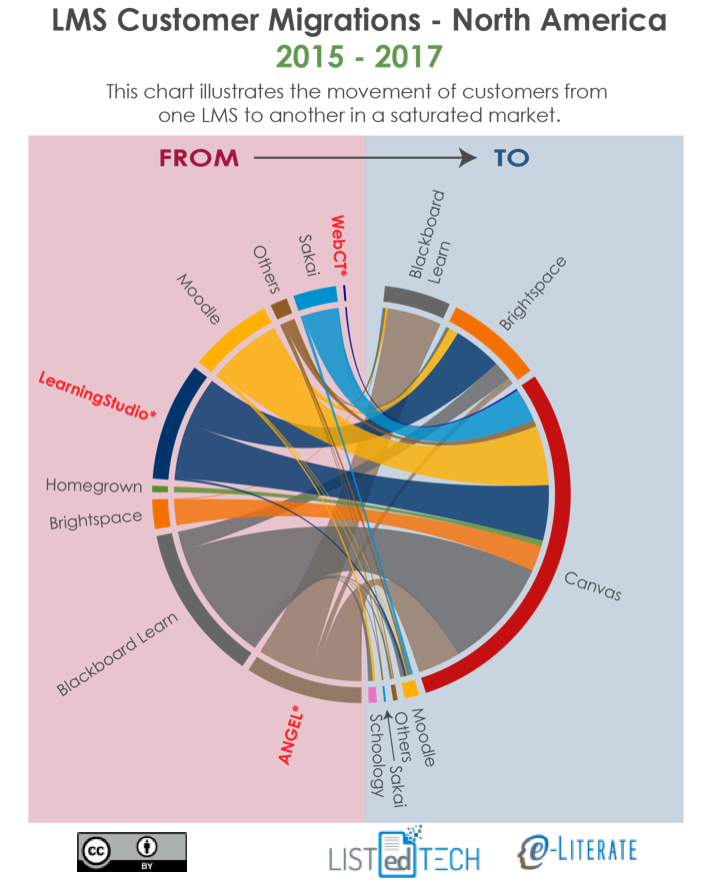
    Michael also shared a view from the North American (US and Canada) market for higher education showing that most of Blackboard’s “wins” over the past few years have come from ANGEL end-of-life migrations. Looking at that same image, however, it becomes even more obvious just how well Canvas has performed for new implementations. It is not just that Canvas has the lion’s share of new implementations, it’s also the breadth of migrations coming from Blackboard Learn, Moodle, ANGEL, LearningStudio, Sakai, and even several from D2L Brightspace.

    Instructure has recorded strong international grown in just the past two years, and this interest was evident at the conference. The most notable difference between the early users conferences and this year’s event was the expansion of the customer base. There must be similar numbers of K-12 attendees as there are higher education attendees, and we’re now seeing clients from Europe, Latin America, and Australia & New Zealand.

    Just 2-3 years ago Canvas as an LMS brand was virtually unknown outside of the US and Canada, but now Canvas is winning more than any others in North America, Europe, Latin America, and Oceania.

    Challenges

    Instructure certainly has challenges to face. In terms of market share, it will be very interesting to look at data for the end of 2017 to see if D2L has maintained its momentum in new implementations. And being a publicly-traded company, investors care not just that Instructure is growing but also whether Instructure is growing fast enough in multiple markets. That’s a lot of pressure.

    On the product front, Canvas was late to the game in terms of supporting mastery learning and associated competency-based education initiatives, although their introduction of MasteryPaths is showing some ability to catch up. Likewise, they certainly are behind their competitors in terms of learning analytics and associated research. And I would even say that they are late in supporting centralized course design models. In all three areas, there are initiatives introduced over the past 12 months to address these product needs. The challenge is for the company to catch up with competitors not necessarily in terms of full feature sets, but more in terms of supporting basic use cases and doing it well.

    When I asked various Instructure management at the conference whom they saw as their greatest competitor, the most common answer was themselves. The company knows they have work to do, and there is a real sense of “we have to do better” that permeates the company. For Instructure’s competitors, the good news is that Canvas has weaknesses. The bad news is that the company knows it.

    Back to Culture

    But the real event of InstructureCon is not really based on product news or market share. As Michael noted last year:

    Throughout the conference, I asked a number of attendees what percentage of their motivation for coming was to find out what the company was planning to develop in the next year. The range of answers averaged between 10% and 20%. They all told me that, while they were looking forward to the roadmap sessions later in the week, they didn’t expect any big surprises and weren’t all that focused on finding out what the developers had been doing. I have never been at an LMS conference where that was true, including Sakai conferences and Moodle Moots.

    Consider the Instructure company profile at Glassdoor. Last year the company was rated #4 best place to work for all small and medium-sized businesses, and Josh Coates was rated #15 for all CEOs in the same category. But also look at the video that Instructure management chose to include in the “Why Work For Us?” section. Other companies tend to put up platitude-filled dreck that tells you very little about their company. But Instructure puts up a 7+ minute video where they talk primarily about company values. In the video, they talk about the behavior the company does and doesn’t want – and even nods that they’ll get rid of people who have have these behaviors – and they avoid all the pseudo-inspirational messages.

    While Canvas is a market-changing platform, that is not really Instructure’s primary strength. Instructure as a company is the real strength.

  • LMS Revival: D2L picking up new customers and showing they can listen

    LMS Revival: D2L picking up new customers and showing they can listen

    D2L the company and Brightspace the company’s LMS are undergoing something of a revival in the past year. It’s not as if they have dropped in terms of market share – in fact the have a history of strong client retention, losing few customers – but the early 2010’s did not lead to rapid customer growth as they had expected after raising two rounds of a combined $165 million in 2012 and 2014. If you read that second post you’ll find that I stated that their growth claims “defied logic” at the time. Recently, however, D2L is on a roll, racking up significant client wins in higher education, and the company shows real signs of change and its ability to truly listen to and empathize with customers.

    As I sat down to write my analysis of the D2L Fusion users conference and what it meant to the Brightspace LMS, I noticed that several of the same themes I described last year applied to this year’s observations – just updated in terms of effect on customers and whether the changes seem to be sticking. To explain my current thoughts it is useful to start with commentary from last year.

    Update on Listening and Product Changes

    From last year’s post:

    As I have described to several executives at D2L, there is an interesting gap between the progress we have seen with the company’s product improvements and the reaction we hear from many of their customers. With the tighter integration with LeaP and the improved usability, particularly in content authoring, I would have expected to hear more customers react to the changes. But when talking directly to many of the institutions using the Brightspace LMS, staff describe D2L as if the company and product line had not changed in several years. What is not clear is whether this gap is due the company missing the mark (and my judgement of improvements not aligning with what colleges and universities want) or whether there is just a lag where it will take time for most customers to believe in and take advantage the new product designs and features.

    2016 has been an eventful year for D2L. [Chief Operating Officer] COO Cheryl Ainoa, a longtime veteran of Yahoo! and most recently Intuit, joined the company in April. Although this move was not advertised through press releases or even blog posts, I believe this is a significant change to how the company operates. [snip]

    And this gets back to the gap noted in the first paragraph. When I talk to people at schools migrating from D2L or considering whether to migrate, I do not hear much about the recent product changes or the new management described above. For several of these schools, the issue isn’t even whether they like or dislike the recent product and management changes, it’s as if these changes are a non issue in their decision-making. No conclusions yet, just noting the gap.

    What I noticed since last year are two updates to the above analysis.

    Listening – Besides adding a new COO, D2L has made several other executive-level hires in the product in the past two years, and to me it seems like we are seeing a new way of thinking largely caused by this new group. The interviews with executives were much more consistent than in past years, and there is a new focus on actively listening to customers. It’s not that D2L didn’t have conversations before; it’s more that they didn’t know how to truly listen and empathize.Part of this change according to D2L exec interviews was that in the past it was easier to talk to CIOs, but now they are learning how to talk to faculty and end users. All interviewees seemed to be singing from the same hymnbook. For the most part.

    Narrow but Excellent – The product focus is less on big-news features and more on small-news everyday items. In the past D2L has seemed too interested in being able to do some chest-thumping “We’ve got CBE. We’ve got Predictive Analytics. We’ve got Adaptive Learning.” while missing something on what current and even prospective customers need in their daily lives. The new focus is more on taking the drudgery out of end-user activities with a mantra of “narrow but excellent”. They are trying to fall in love with problem solving more than in features, even if these problems can be non-sexy.

    One example from the Fusion users conference was making it easier to shuffle questions within a quiz. Sounds trivial, but Canius College staff have a description that captures the essence of the change. Yes, you could have done this before, but it was a chore. Now it’s much easier to the point that more people will want to use it.

    Later this month, D2L will introduce a nice feature for Canisius faculty who use their online quiz/exam tool. D2L’s quiz engine has powerful features for randomizing question order in a quiz or exam, and can even deliver a subset of questions at random from larger question banks. This is nice, but until now it was a bit of a chore if you only wanted to randomize delivery of, say, five to ten questions, since you needed to install those questions in the question library, and then import them into a random section within the quiz. Along the way, there were a lot of clicks and the process wasn’t always so intuitive. With the update coming late July, D2L has installed a checkbox feature within the quiz editor: “Shuffle order of questions at the quiz level.” Simply add your questions directly in the quiz, click that box, and the quiz will deliver those questions in a random order to each student.

    The Brightspace product demonstrations during the conference keynote got significant spontaneous reactions from crowd (along with hallway discussions) likely reflecting this improved ability to listen
    to customers. And the improvement to quiz question shuffling led to one of the biggest reactions.

    Here are the major product announcements / new functionality as of this summer:
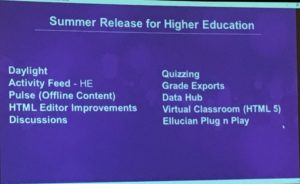
    Another product change worth noting is the new Data Hub. This is a re-architecture of how data can be exported to allow bulk access to data, either manual or through application program interfaces (APIs). The announcement is significant as we have noted in the past that D2L has had challenges getting data reliably and quickly to customers. Data export is not an easy problem to solve due to the complex technical challenges involved in analytics, and D2L had its share of customer challenges several years ago. However, we heard from at least one customer with early access to the Data Hub that their situation is improving. Sounds trivial, but this could be significant. We will have to keep a close watch on this development.

    Update on Market Share

    In last year’s post I noted:

    On the sales front, D2L has experienced somewhat slow but steady growth in new US / Canadian higher education clients as seen below, but they have not had the big-name wins of the caliber of UMUC, Tennessee Board of Regents, University System of Georgia, as they had 2013 and earlier.

    They had won Kaplan University as of last year, but since then they’ve also won with EDMC, Saint Leo University, University of Cardiff, University of Ottawa, Bournemouth University, and most recently Southern New Hampshire University (SNHU), among others. In other words, over the past 12 months D2L has won several big-name accounts in higher education. ((Disclosure: I advised UMUC during their strategy and evaluation process in 2011-2012. Bournemouth, SNHU, and D2L are subscribers to our LMS market analysis service.))

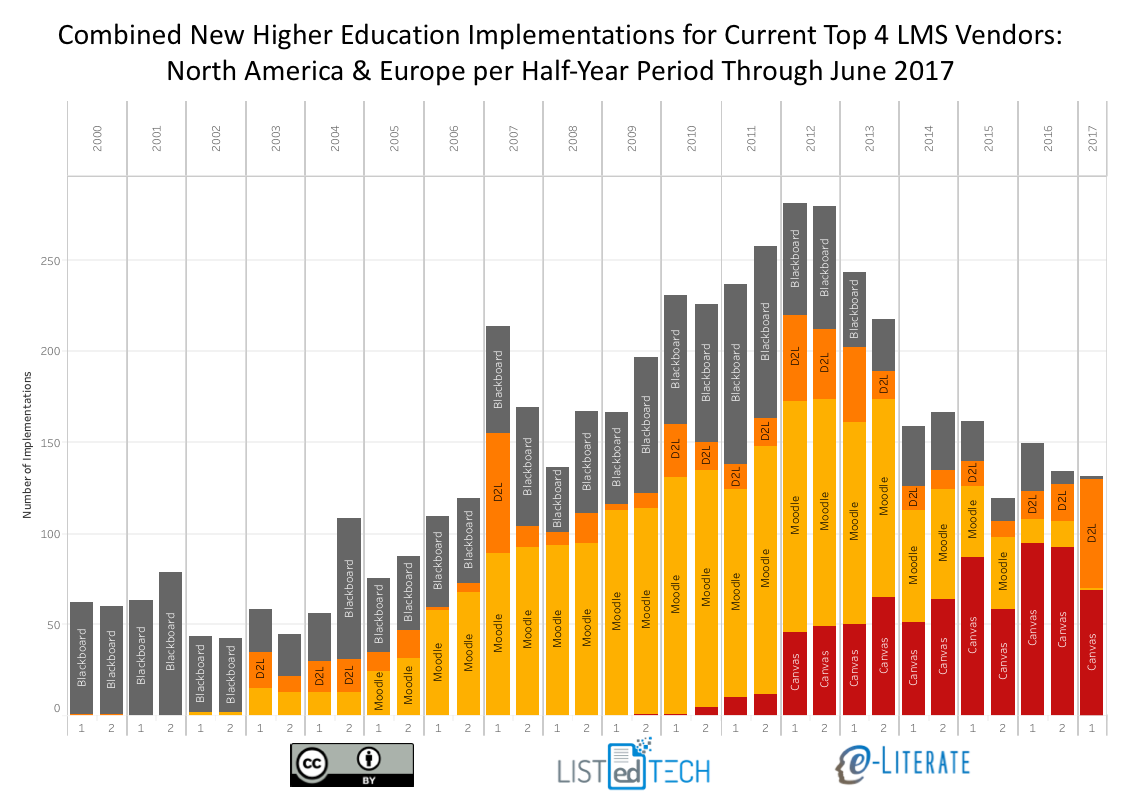
    The net effect has been a dramatic uptick in the percentage of new implementations (schools switching from another LMS to a new one) for D2L. The following chart looks at new implementations in North America (US and Canada) and Europe highlighting the top four academic LMS solutions (Blackboard, Moodle, Canvas, D2L) in half-year increments, with a remarkable spike in D2L’s activities in the past 12 months.
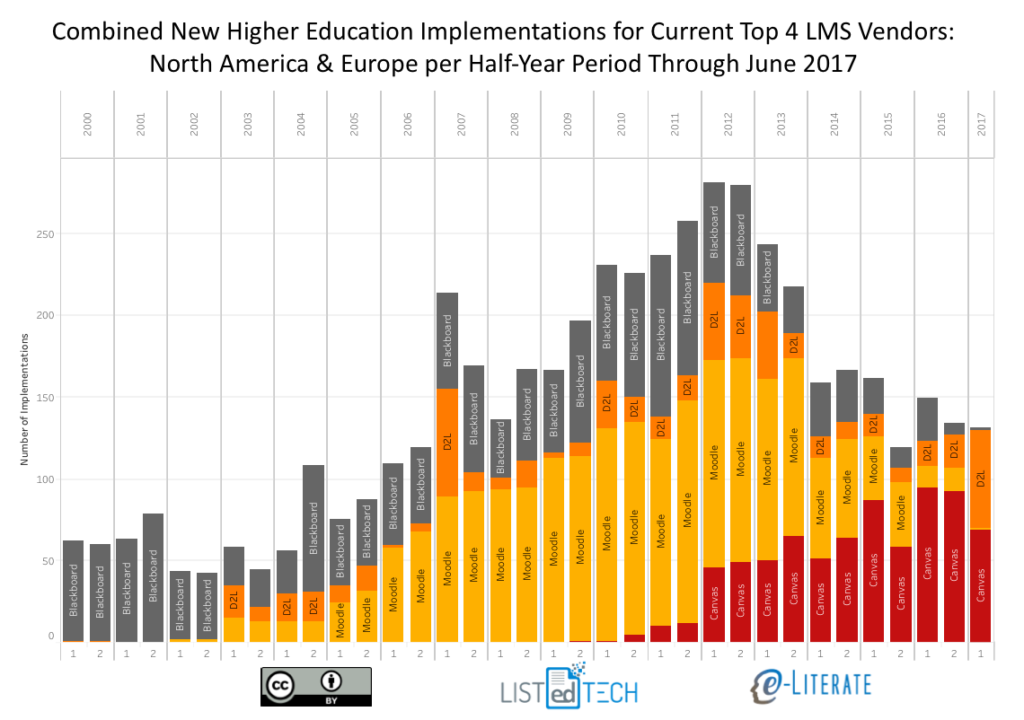
    This data aligns with our anecdotal conversations where, more often than not, there seems to be a pattern of new implementations going to Canvas or D2L – an emerging two-horse race for new implementations.

    Part of the reason for the recent acceleration and for the unknown future is the fact that quite a few of D2L’s wins for Brightspace have been large systems (single decision affecting multiple campuses, e.g. Kaplan University) or large enrollment single institutions (e.g. SNHU). And many of these are for schools with large, centrally-managed online operations. The large systems have benefitted from the Pearson LearningStudio (aka eCollege) end-of-life forcing many for-profit systems to change LMS, with that activity mostly running its course by the end of this calendar year. Big wins, but quite dependent on a small number of deals.

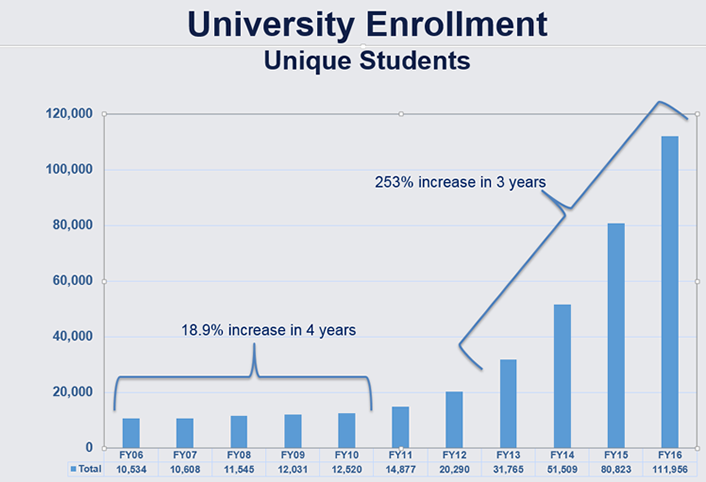
    The recent win at SNHU is very important to understand, however. It is not driven by end-of-life (SNHU moving off of Blackboard Learn in a voluntary migration), and this comes from a long-time Blackboard customer. Quite often people equate SNHU with its College for America (CfA), one of the leading competency-based education (CBE) programs in the country. But SNHU is much bigger than CfA, and it is the fastest-growing university in North America overall. According to an article last year in EDUCAUSE Review, SNHU’s online enrollment has grown at 253% per year over the past several years.
    It certainly seems probable that this increase in market wins is related to the change in how D2L listens to customers and the resultant change in emphasis from big-news capabilities towards smaller-news but customer-pleasing improvements to everyday functionality. It is important that Brightspace has such a deep feature set, but have the company understand customer everyday needs is more important.

    What we do know is that D2L has increased its number of higher education wins over the past 12 months. What we don’t know is whether and how strongly this trend will continue.

    Update on Conference Attendance

    This was the first on-site Fusion visit we’ve had in a couple of years, leading to the title and commentary in last year’s post “Changes at D2L: A second-hand view from users conference”:

    The reason I titled this post as a second-hand view is that D2L is the only major LMS provider (and I include Moodle and Sakai here) that discouraged our participation in their users conference (and we did not attend), citing concerns over direct conversations with attendees without getting their permission first. Other providers are happy to allow and even encourage this type of interaction. In the nature of full disclosure, we think it is important for the reader to understand this difference in access.

    Michael and I value the ability to not just hear official presentations and get in-depth demos, but to also go, roam, and talk to customers.

    True to their word, D2L management have changed their approach on how analysts can be involved in their conference. This year we were invited to attend (along with others), and more importantly, we were allowed to freely talk to the users and prospective users at the conference. I even had several people from D2L pass me in the hallway and ask if I was getting the access to customers that I needed. I did.

    This change aligns with the aforementioned improvements and focus on how D2L as a company listens to customers. Less control and more desire to learn (sorry, couldn’t help myself). A welcome change.

    Open Questions

    While most of what we’ve seen in the market and at the conference has been an improvement over the past few years, it is important to understand the tall order of the changes being made.

    Learning to listen, especially to end users, really represents a cultural change, and these changes are not easy. They take a lot of management time and energy to implement, and they take patience. Will these changes take hold and further permeate the organization? Certainly we’re seeing results over the past 12 months, but companies have plenty of pressures to fall back into old habits.

    In terms of market positioning, the competition is not standing still. We’re also seeing improvements coming from Blackboard’s change in executive team, and we’re seeing Instructure to continue their strong improvements to Canvas and their support. New entrants like Schoology and older solutions like Moodle are also improving, albeit more slowly than the big commercial vendors. Further complicating the matter, a lot of D2L’s new business came from a handful of large decisions. Will D2L’s market momentum of new implementations continue, particularly in North America and Europe? I expect we’ll learn a lot when we look at the data at the end of this calendar year.

  • Academic LMS Market Share By Enrollments, Part Deux

    Academic LMS Market Share By Enrollments, Part Deux

    Based on our recent publication of market share data and graphics, we have had multiple requests to share similar data by enrollment. In Friday’s post I shared a non-traditional view of the LMS market based on the percentage of institutions within small, medium, and large enrollment bands for North America (US and Canada) and Europe. This view gave some interesting insights, particularly with large positive correlation (Canvas) and negative correlation (Moodle)  between enrollment bands and market share in North America. Meanwhile, there were other LMS solutions (D2L and Sakai in particular) that have fairly consistent distribution in market share.

    For this second view, instead of showing percentage of institutions within each enrollment band, the data is aggregated for all North American institutions and scaled by each institution’s official enrollment data (e.g. the US data is from IPEDS). The net result shows the percentage of enrollments across the region that have different LMS solutions as their primary system at their school. As always, the underlying data for these market share studies is provided by our partner LISTedTECH.

    Some Notes:

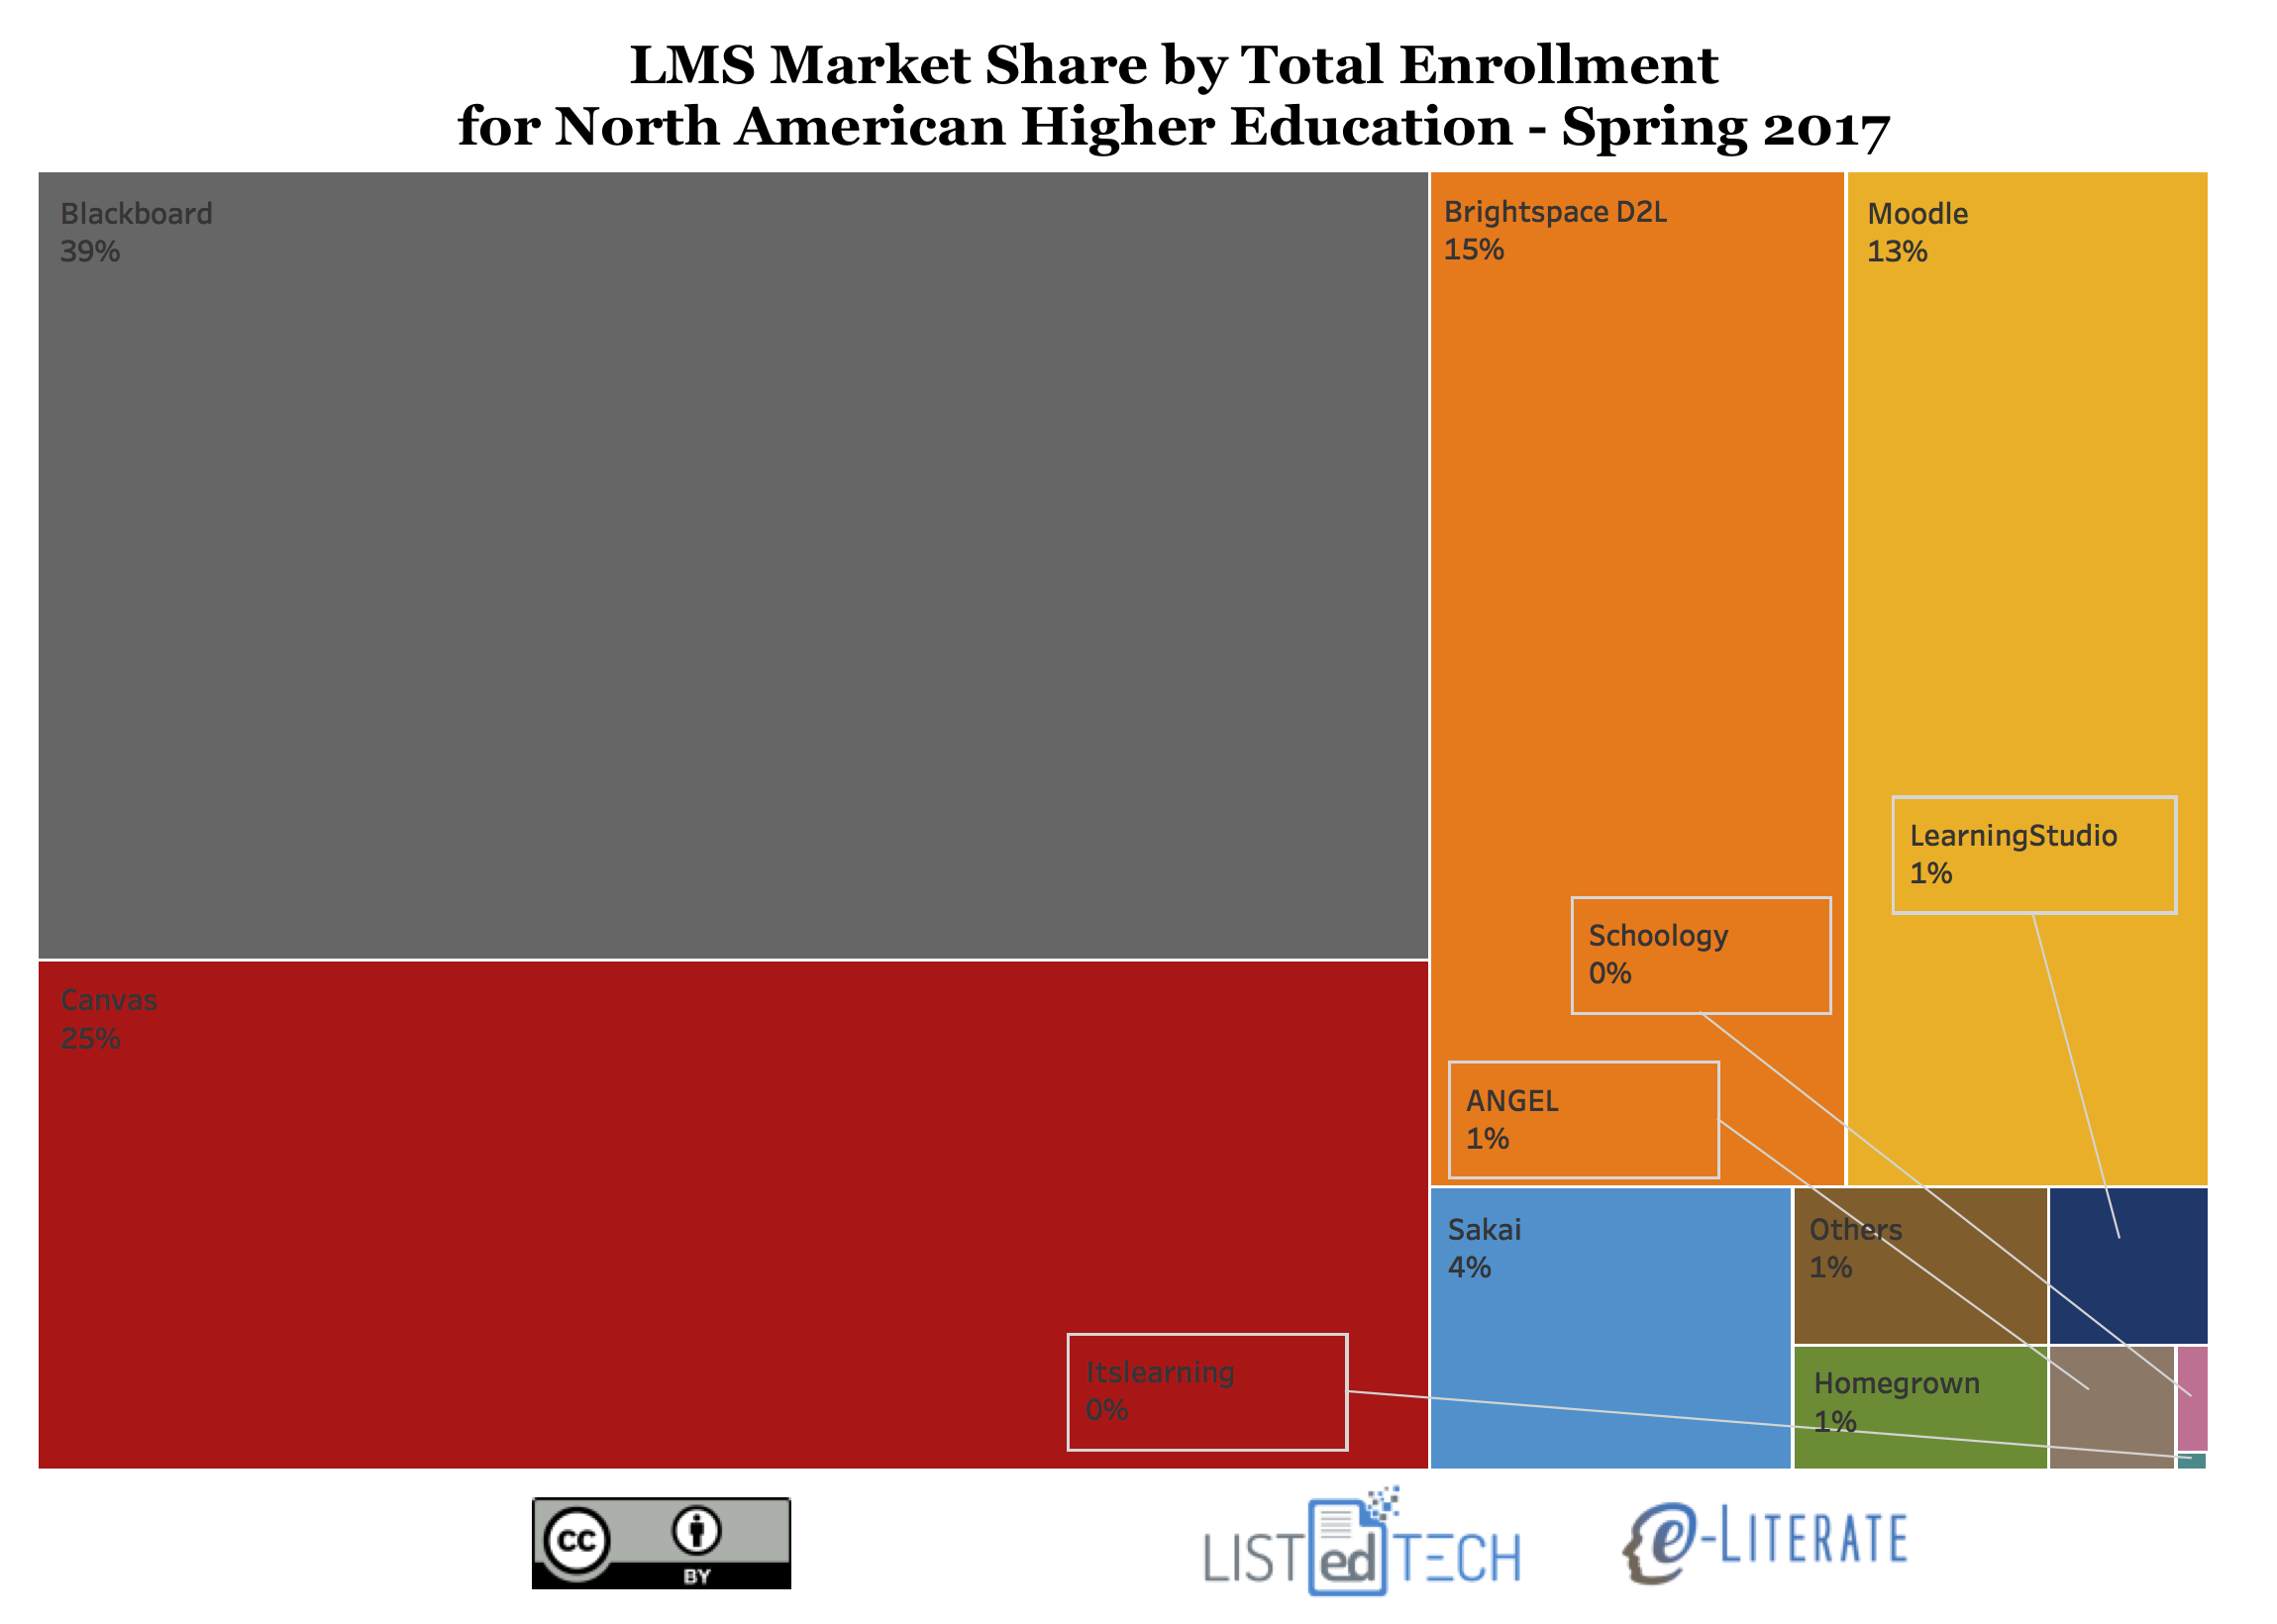
    • For North American Higher Education, Blackboard Learn at 39% is still in first place, Canvas is second at 25%, D2L Brightspace is third at 15%, Moodle is fourth at 13%, and Sakai is fifth at 4%.
    • It has been widely reported when just looking at percentages of institutions that Moodle has long been the second most-used system in North America, but in this view both Canvas and D2L Brightspace have a larger market share.

    It is useful to look at different views using institutional and enrollment metrics to get a deeper understanding of the academic LMS market dynamics.