e-Literate

Present is Prologue

Tag: edutechnica

  • LMS Market Updates, Dec 2015

    There seems to be a series of news and analysis on the LMS higher education market worth summarizing.

    Major Adoption News

    I posted last weekend about University of Phoenix (UoP) and their LMS. UoP is well-known for being the biggest user of a homegrown LMS for well over a decade, but in the past several years they rolled out “Classroom”, an entirely new adaptive-learning based design. In a major strategic change, UoP is abandoning this effort and moving to a commercial provider.

    What we can now confirm at e-Literate is that the “learning platform” selected by the University of Phoenix is Blackboard Learn Ultra. This is the cloud-based redesign of Learn that Michael and I have described in several posts. Even with the University of Phoenix’s reduced enrollment, I consider this news to be the most important new client acquisition for Blackboard since at least 2011.

    Today Campus Technology reported that Stanford is moving to adopt Canvas as their campus-wide LMS. Previously Stanford was a founding member of Sakai, with its implementation called CourseWork.

    The university has been piloting Instructure Canvas since the 2014-2015 academic year. The vice provost for teaching & learning (VPTL) said in a statement that about 80 percent of faculty in the pilot reported being “very or somewhat satisfied” with the new platform; even more students (94 percent) found it “very or somewhat easy” to use.

    Alongside the pilot, two Stanford schools had already adopted the application independently. The Graduate School of Education moved to Canvas in 2013-2014, and the Graduate School of Business did so in 2014. Both adoptions were considered successes.

    During this school year, the migration was accelerated. Some 300 classes switched to Canvas. And the plan is to migrate the remaining 4,200 classes still using the legacy LMS software over the next academic year.

    (more…)

  • Instructure Files for IPO

    This doesn’t exactly come as a shock, but Instructure has filed for an IPO, and is expecting a post-IPO valuation of somewhere between $500 million and $800 million. Whenever a private company does this, they have to file a form called an S-1 with the SEC, which contains all kinds of financial and strategic information. You can find Instructure’s here.

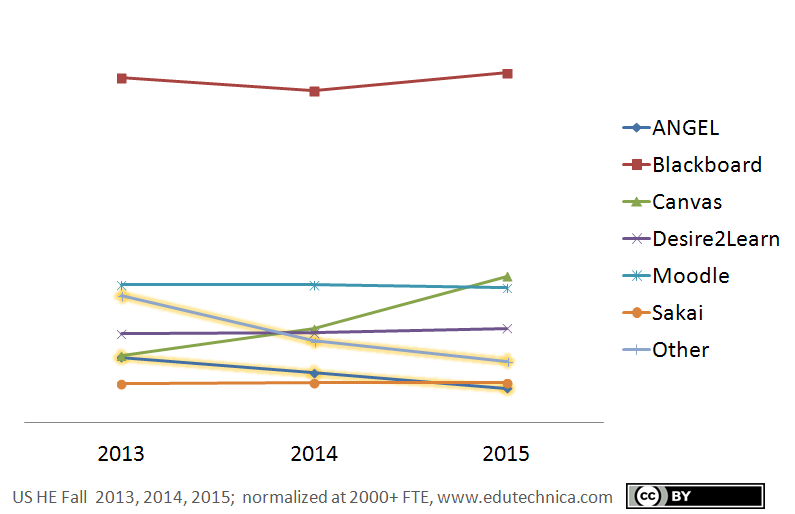
    Also not a big surprise, but the numbers in the report show big growth. Subscription revenue rose 72% from 2013 to 2014. Coincidentally, Edutechinica just published its 3rd annual LMS Data Update. As you can see, Canvas went through the roof in US higher ed while the other major LMS players were either flat or close to it:
    But in order to achieve that growth, they have been running at a loss. The problem seems to be in high expenses rather than low revenues, which suggests that the losses are coming from the company bulking up rather than from them undercutting the competition on price. Also, most of those revenues still come from the US. Instructure has offices in London, Hong Kong, and Sydney. That’s not a huge international presence. And as it happens, Eductechnica has data for the UK and Australia:
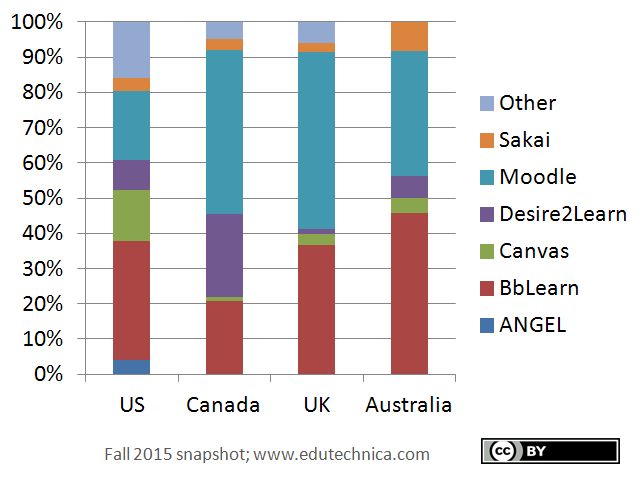
    You can see that Instructure has not made a major dent yet in either country. (You can also see that their biggest competitor by far in those two countries is Blackboard, particularly when you consider that Blackboard now owns major Moodle hosting operations in both countries.)

    One last bit that jumped out at me after a quick scan of the S-1 wasn’t financial. Their characterization of analytics was interesting. Throughout the document, they try to make the case that high user engagement and utilization lead to better learning analytics. For example,

    Strong User Engagement Leads to Robust Data Analytics

    Given today’s focus on accountability and performance, both academic institutions and companies are striving to improve learning outcomes. To do so, an organization must first understand the variables that impact results, such as attendance metrics, user engagement, and the efficacy of various learning content and technologies for individual learners. A learning management system has the potential to provide significant insight to educators and administrators on their students’ and employees’ progress toward meeting learning objectives and the factors impacting performance. In addition, such learning management systems can facilitate insightful benchmarking to allow organizations to explore other drivers of learning outcomes.

    Strong user engagement with learning management systems is critical to maximize the potential of data analytics. High utilization enables the learning management system to capture more data, and leads to more insightful analyses on user behavior, quality of individual courses and effectiveness of digital content. Better analytics enables instructors and administrators to make more informed decisions about instruction and materials that in turn drive improved learning outcomes and performance for individuals and companies. This virtuous cycle among user engagement, data analytics and learning outcomes represents the evolution of learning technology. We believe that the market increasingly is demanding learning management software that delivers both robust analytics and strong user engagement.

    They later go on to say,

    Over eight million instructors, students and employees have used our software over the 12 months ended June 30, 2015. According to self-reported data in an ECAR 2014 survey, 58% of faculty in higher education use a learning management system to share content with students, while our internal analysis of higher education institutions using Canvas shows that 71% of faculty use Canvas to share content with students.

    But their claim in terms of what they actually have for data analytics is fairly weak:

    Our platform provides users with open API access to data analytics. We deliver the analytics in an easy to understand and consumable way, that is optimized for independent analysis. This open visibility allows learners to view their own progress in real-time, educators to adjust programs and personalize curricula for maximum effectiveness and organizations to benchmark user data internally and respond to patterns observed.

    They are not arguing that they have good analytics, but rather that the high utilization of the software plus open APIs will enable customers to build good analytics themselves.

  • Year-end Updates on e-Literate News Posts

    For my final 2014 post, I thought it would be interesting to provide year-end updates to some news posts on e-Literate over the past year. You’ll notice that there is somewhat of an emphasis on negative stories or implications. For most positive stories, companies and institutions are typically all too happy to send out press releases with the associated media paraphrasing, and we have little need here to cover as news. The following non-exhaustive list is in date order.

    D2L Growth Claims

    In December 2013 I described layoffs at Desire2Learn (now officially named D2L). The significance of this story is that it calls into question D2L’s growth claims and trumpeting of massive new investment of $85 million. Some updates:

    IPEDS Data on Online Learning

    (more…)

  • e-Literate Top 20 Posts For 2014

    I typically don’t write year-end reviews or top 10 (or 20) lists, but I need to work on our consulting company finances. At this point, any distraction seems more enjoyable than working in QuickBooks.

    We’ve had a fun year at e-Literate, and one recent change is that we are now more willing break stories when appropriate. We typically comment on ed tech stories a few days after the release, providing analysis and commentary, but there are several cases where we felt a story needed to go public. In such cases (e.g. Unizin creation, Cal State Online demise, management changes at Instructure and Blackboard) we tend to break the news objectively, providing mostly descriptions and explanations, allowing others to provide commentary.

    The following list is based on Jetpack stats on WordPress, which does not capture people who read posts through RSS feeds (we send out full articles through the feed). So the stats have a bias towards people who come to e-Literate for specific articles rather than our regular readers. We also tend to get longer-term readership of articles over many months, so this list also has a bias for articles posted a while ago.

    With that in mind, here are the top 20 most read articles on e-Literate in terms of page views for the past 12 months along with publication date.

    1. Can Pearson Solve the Rubric’s Cube? (Dec 2013) – This article proves that people are willing to read a 7,000 word post published on New Year’s Eve.
    2. A response to USA Today article on Flipped Classroom research (Oct 2013) – This article is our most steady one, consistently getting around 100 views per day.
    3. Unizin: Indiana University’s Secret New “Learning Ecosystem” Coalition (May 2014) – This is the article where we broke the story about Unizin, based largely on a presentation at Colorado State University.
    4. (more…)

  • New LMS Market Data: Edutechnica provides one-year update

    In Fall 2013 we saw a rich source of LMS market data emerge.

    George Kroner, a former engineer at Blackboard who now works for University of Maryland University College (UMUC), has developed what may be the most thorough measurement of LMS adoption in higher education at Edutechnica (OK, he’s better at coding and analysis than site naming). This side project (not affiliated with UMUC) started two months ago based on George’s ambition to unite various learning communities with better data. He said that he was inspired by the Campus Computing Project (CCP) and that Edutechnica should be seen as complementary to the CCP.

    The project is based on a web crawler that checks against national databases as a starting point to identify the higher education institution, then goes out to the official school web site to find the official LMS (or multiple LMSs officially used). The initial data is all based on the Anglosphere (US, UK, Canada, Australia), but there is no reason this data could not expand.

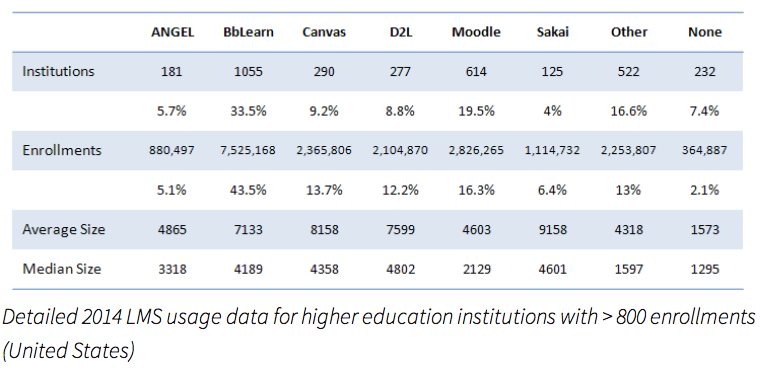
    There is new data available in Edutechnica’s one-year update, with year-over-year comparisons available as well as improvements to the methodology. Note that the methodology has improved both in terms of setting the denominator and in terms of how many schools are included in the data collection.

    The Fall 2014 data which now includes all schools with more than 800 enrollments:

    (more…)

  • Say What? Buzzfeed follows up on D2L story with solid reporting

    In a post last month I questioned the growth claims that D2L was pushing to the media based on their recent massive funding round. A key part of the article was pointing out the lack of real reporting from news media.

    It is worth noting that not a single media outlet listed by EDUKWEST or quoted above (WSJ, Reuters, Bloomberg, re/code, edSurge, TheStar) challenged or even questioned D2L’s bold claims. It would help if more media outlets didn’t view their job as paraphrasing press releases.

    I should give credit where it’s due: Education reporter Molly Hensley-Clancy at Buzzfeed has done some solid reporting with her article out today.

    In response to detailed questions from BuzzFeed News about figures to back up its claims of record growth in higher education and internationally, the company released a statement to BuzzFeed News, saying “As a private company, D2L does not publicly disclose these details. The past year has been one of record growth for D2L, culminating in the recent $85 million round of financing.” A representative declined to make the company’s CEO, or any other executive, available for an interview related to the company’s growth.

    The stonewalling didn’t come as a surprise to former employees with whom BuzzFeed News spoke.

    “The picture they’re painting of growth is not accurate,” said one former employee, who left the company within the last year and asked to remain anonymous, citing his confidentiality agreement with the company. “If you look at actual metrics, they tell a different story. They’re very likely not seeing growth in higher education.”

    (more…)

  • D2L raises $85 million but growth claims defy logic

    Yesterday D2L announced a second round of investment, this time raising $85 million (a mix of debt and equity) to go with their $80 million round two years ago (see EDUKWEST for a useful roundup of news and article links). While raising $165 million is an impressive feat, does this funding give us new information on the LMS market?

    First, here are the claims by D2L as part of this round of financing, from EdSurge:

    The deal comes on the heels of what the company calls “a year of record growth in the higher education, K-12 and corporate markets.” John Baker, founder and CEO, says the company currently serves 1,100 institutions and 15 million learners–up from 850 and 10 million, respectively, at this time last year. The company also recently opened offices in Latin America, Asia Pacific and Europe.

    That’s a 29% growth in the number of institutions and a 50% growth in the number of learners in just one year. Quite impressive if accurate.

    Yet the company went through a significant round of layoffs in late 2013 that let go more than 7% of its workforce, and according to both LinkedIn data and company statements they have had no significant growth in number of employees over the past year.  (more…)