e-Literate

Present is Prologue

Tag: graduation rates

  • College Scorecard: With victories like these, who needs failures?

    Goldie Blumenstyk had a fascinating interview with the Depart of Education’s Ted Mitchell on Friday that is well worth reading and / or watching (they have video of the interview along with full transcript). One of Mitchell’s key points jumped off the page for me.

    I think it [College Scorecard] was one of the department and the administration’s greatest victories

    Really? I can see the consolidation of student loans, a strong focus on college affordability, shifting of conversation away from just elite schools, and significant push on funding public schools as worthy victories to mention. But the College Scorecard – I don’t buy it.

    Blumenstyk pushed back on Mitchell, which led to this interesting exchange [emphasis added].

    GOLDIE BLUMENSTYK: I’m glad you mentioned the College Scorecard. I was thinking about that a little bit. It’s probably one of the places where the department had perhaps its biggest defeat, or maybe you might consider it a retreat. We were originally envisioning the Scorecard as a tool for accountability. Obviously, a lot of colleges and a lot of other people opposed that idea. And it became a complicated process even to create the effective scorecard. What did you learn from that process?

    TED MITCHELL: So I guess I would have a slightly different interpretation.

    GOLDIE BLUMENSTYK: I would imagine. (more…)
  • College Scorecard: ED quietly adds in 700 missing colleges

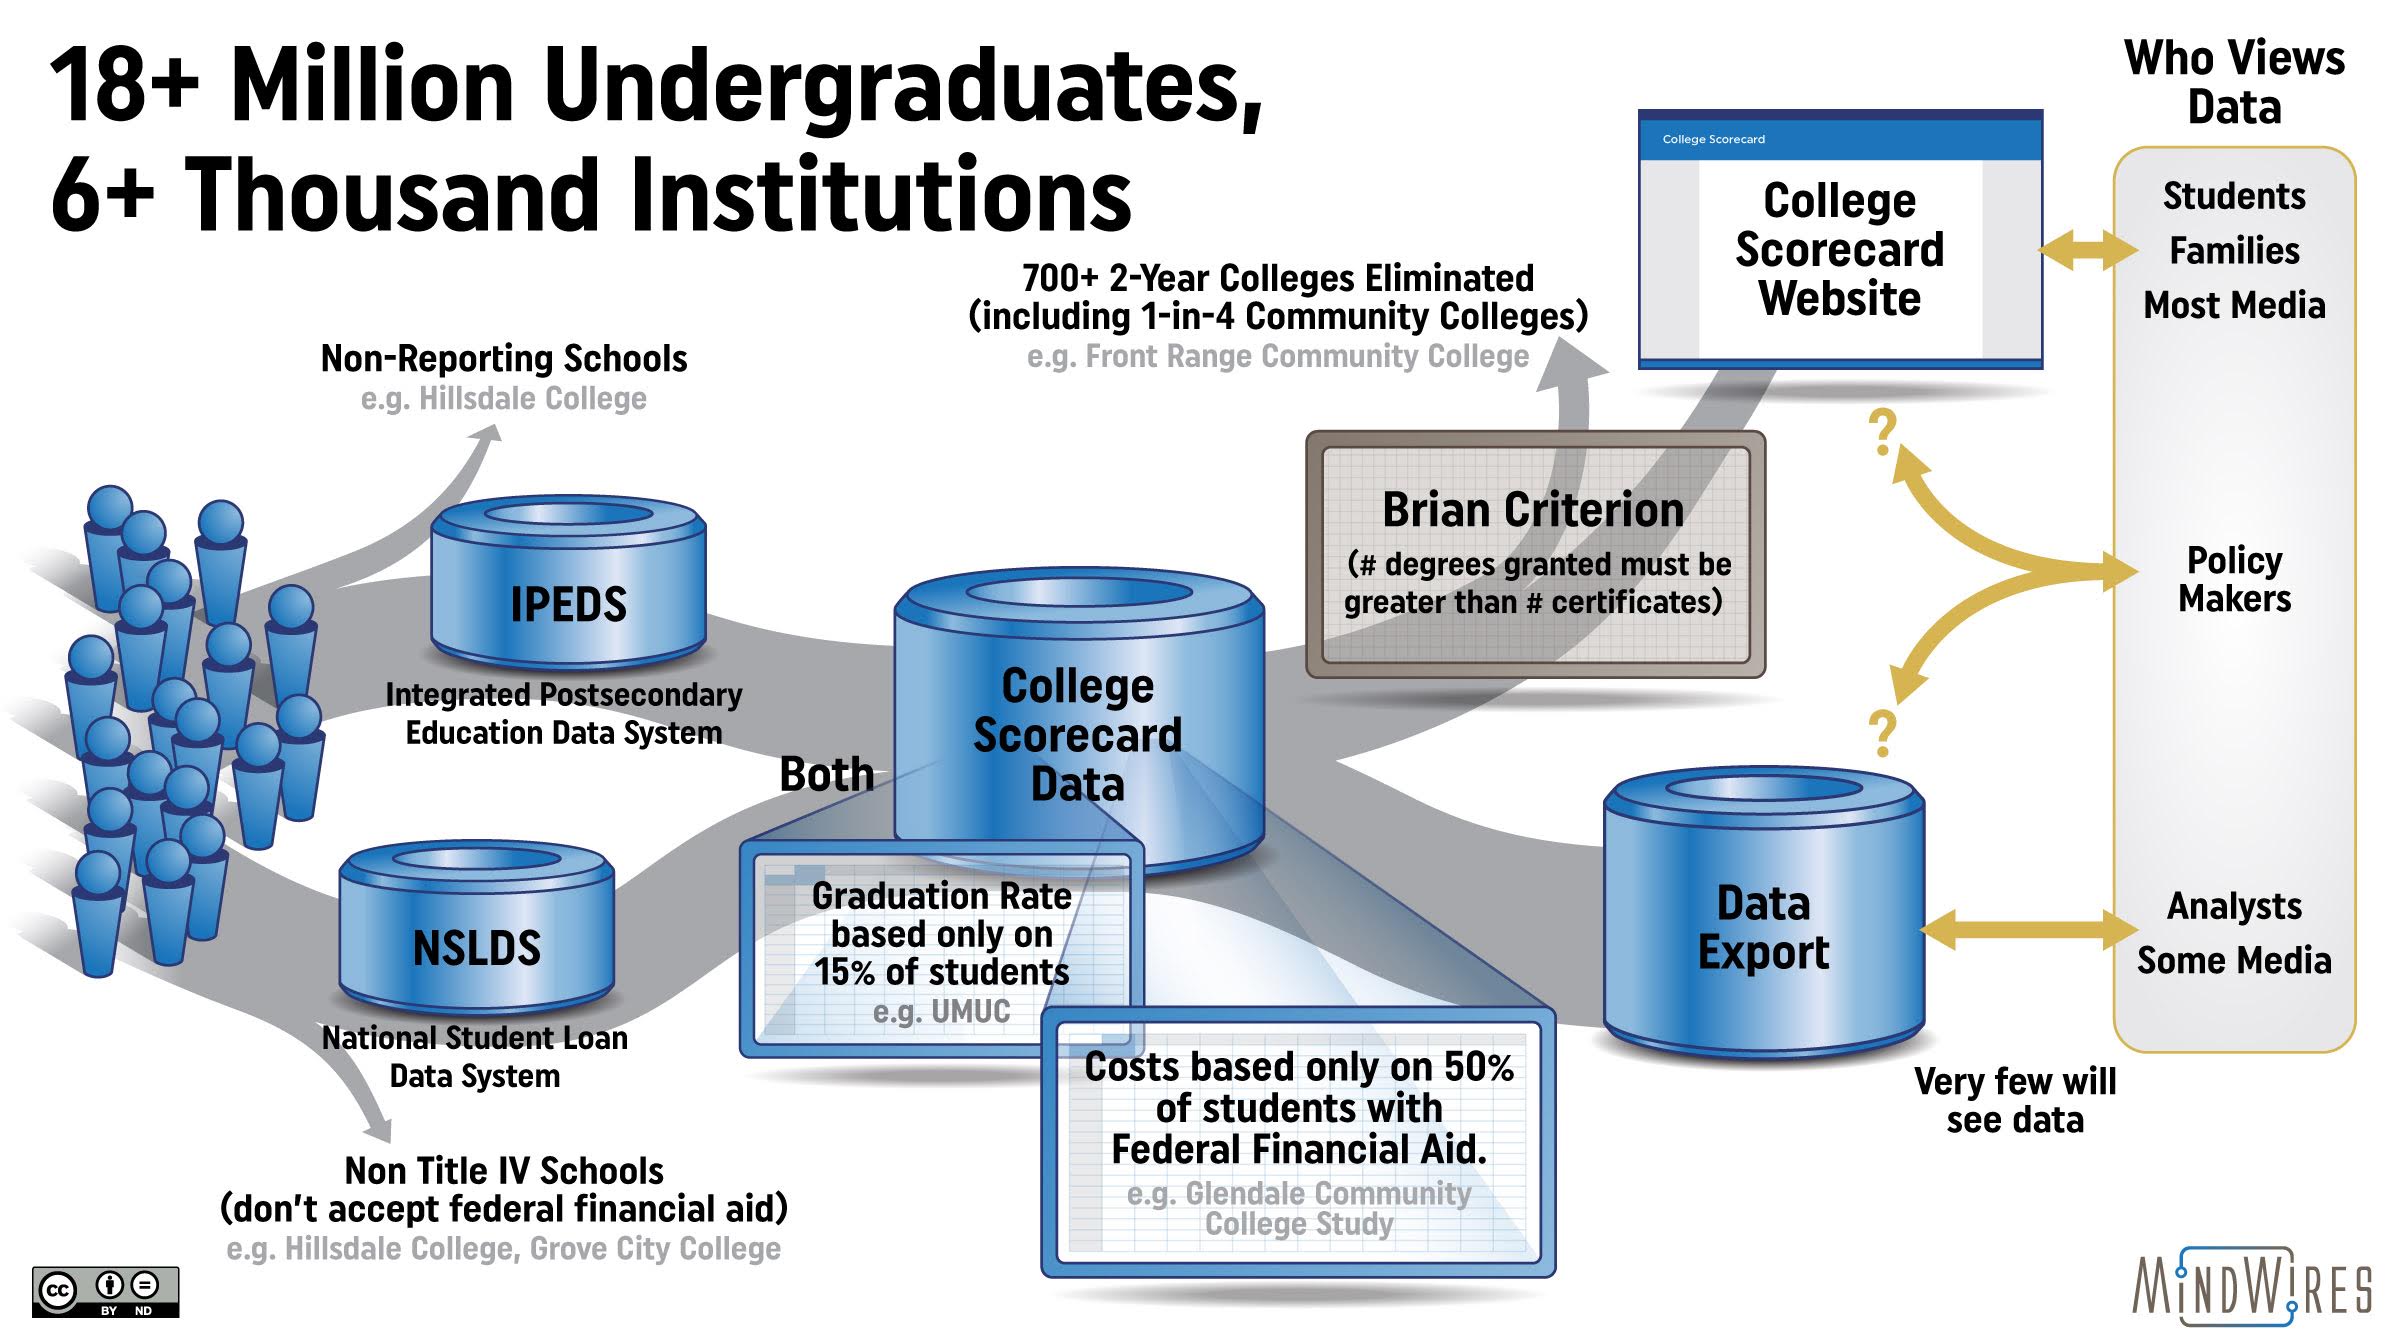
    It’s worth giving credit where credit is due, and the US Department of Education (ED) has fixed a problem that Russ Poulin and I pointed out where they had previously left ~700 colleges out of the College Scorecard.

    When the College Scorecard was announced, Russ noticed a handful of missing schools. When I did the whole data OCD thing, I discovered that more than 700 2-year institutions were missing, including nearly 1-in-4 community colleges. Eventually we published an article in the Washington Post describing this (and other) problems.

    The missing community colleges were excluded on purely statistical grounds. If the college granted more certificates (official awards of less than a degree) than degrees in a year, then they were excluded as they were not “primarily degree-granting” institutions. We label this the “Brian Criterion” after the person authoring two discussion board posts that explained this undocumented filter. (more…)

  • College Scorecard Article Published In Washington Post

    I have written several posts looking at the new College Scorecard and its inherent flaws in the data, often starting with observations from Russ Poulin at WCET. Today Susan Svrluga, education reporter at the Washington Post, posted a new article co-written by me and Russ and titled “Hundreds of colleges missing from Obama’s College Scorecard?”. The gist of the article is taking a holistic view of data problems and why they exist.

    In a nutshell, the College Scorecard combines data from multiple sources – primarily from the Education Department’s own Integrated Postsecondary Education Data System (IPEDS) and National Student Loan Data System (NSLDS) – and publishes the results of both as a consumer-facing Web site and an analyst-friendly data download. The essence of the problem is that throughout this process the data is filtered based on questionable assumptions, leading to the fuzzy lens viewing subsets of the real data.

    Poulin Hill College Scorecard Graphic

  • College Scorecard Problem Gets Worse: One in three associate’s degree institutions are not included

    Late yesterday I posted about the Education Department (ED) new College Scorecard and how it omits a large number of community colleges based on an arbitrary metric.

    In particular, the Education Department (ED) is using a questionable method of determining whether an institution is degree-granting rather than relying on the IPEDS data source. In a nutshell, if an institution awarded more certificates than degrees, then it is not labeled as “predominantly awarded 2-year or 4-yeard degrees” and therefore excluded.

    I am not quite confident that the explanation for the vast majority of missing schools is based on this finding. In short, if an institutions awards more certificates than degrees, ED removes them from the public-facing website even if they are technically degree-granting institutions.

    Originally it appeared this situation encompassed 17% of all community colleges, but further analysis shows it to be more significant. (more…)

  • 17% Of Community Colleges Are Not Included In College Scorecard

    In addition to the highly-misleading usage of ‘first-time full-time’ qualification for official graduate rates reported in the College Scorecard, there appears to be another major issue with the data. In particular, the Education Department (ED) is using a questionable method of determining whether an institution is degree-granting rather than relying on the IPEDS data source. In a nutshell, if an institution awarded more certificates than degrees, then it is not labeled as “predominantly awarded 2-year or 4-yeard degrees” and therefore excluded.

    Russ Poulin noted in his WCET post that several community colleges were missing from the Scorecard based on a quick spot check:

    • Colorado – Aims, Front Range, Pueblo, and Otero Community Colleges.
    • Arizona – Rio Salado College.
    • California – Bakersfield College.

    The consumer website itself offers no explanation that certain degree-granting schools are excluded. The Technical Paper that corresponds to the data release explains that selection of schools on page 28: (more…)

  • College Scorecard: An example from UMUC on fundamental flaw in the data

    Russ Poulin at WCET has a handy summary of the new College Scorecard produced by the Education Department (ED) and the White House. This is a “first read” given the scorecard’s Friday release, but it is quite valuable since Russ participated on an ED Data Panel related to the now-abandoned Ratings System, the precursor to the Scorecard. Russ describes the good, the “not so good”, and the “are you kidding me?” elements. One area in particular highlighted by Russ is the usage of the “dreaded first-time, full-time completion rates”:

    I knew this would be the case, but it really irks me. Under current data collected by the Department’s IPEDS surveys. They the group on which they base their “Graduation Rate” as: “Data are collected on the number of students entering the institution as full-time, first-time, degree/certificate-seeking undergraduate students in a particular year (cohort), by race/ethnicity and gender; the number completing their program within 150 percent of normal time to completion; the number that transfer to other institutions if transfer is part of the institution’s mission.”

    This rate has long been a massive disservice to institutions focused on serving adults and community colleges. Here are some example rates: Empire State: 28%, Western Governors University: 26%, University of Maryland University College: 4%, Charter Oak Colleges: no data, and Excelsior College: no data.. The problem is that these numbers are based on incredibly small samples for these schools and do not reflect the progress of the bulk of the student body.

    I won’t quote data for community colleges because they are all negatively impacted. They often serve a large number of students who are not “first-time” or define “success” in other ways.

    I know that they are working on a fix to this problem in the future. Meanwhile, who atones for the damage this causes to these institution’s reputation. This data display rewards colleges who shy away from non-traditional or disadvantaged students. Is this what we want?

    Russ is not the only one noting this problem. Consider this analysis from Friday [emphasis added]: (more…)

  • Alternate Ledes for CUNY Study on Raising Graduation Rates

    Last week MDRC released a study on the City University of New York’s (CUNY) Accelerated Study in Associate Programs (ASAP) with near breathless terms.

    Title page

    • ASAP was well implemented. The program provided students with a wide array of services over a three-year period, and effectively communicated requirements and other messages.
    • ASAP substantially improved students’ academic outcomes over three years, almost doubling graduation rates. ASAP increased enrollment in college and had especially large effects during the winter and summer intersessions. On average, program group students earned 48 credits in three years, 9 credits more than did control group students. By the end of the study period, 40 percent of the program group had received a degree, compared with 22 percent of the control group. At that point, 25 percent of the program group was enrolled in a four-year school, compared with 17 percent of the control group.
    • At the three-year point, the cost per degree was lower in ASAP than in the control condition. Because the program generated so many more graduates than the usual college services, the cost per degree was lower despite the substantial investment required to operate the program.

    Accordingly the media followed suit with breathless coverage ((And this article comes from a reporter for whom I have tremendous respect.)). Consider this from Inside Higher Ed and their article titled “Living Up to the Hype”: (more…)