e-Literate

Present is Prologue

Tag: Higher Ed

  • State of Higher Ed LMS Market for US and Canada: 2018 Year-End Edition

    State of Higher Ed LMS Market for US and Canada: 2018 Year-End Edition

    This is the eleventh year I have shared the LMS market share graphic, commonly known as the squid graphic, for US and Canadian higher education. This past year we at e-Literate shifted our LMS Market Analysis reports from Spring / Fall to Mid-Year / End-of-Year to better allow analysis of entire years. With the release of our end-of-2018 report last week to subscribers, it’s time for us to look at updates on the institutional LMS market for North America (US and Canada) higher education. Note that our coverage for the market analysis includes Europe, Latin America, Oceania (Australia, New Zealand, and surrounding island countries) as well as emerging coverage of the Middle East.

    We present the following data “by institutions”, with market share as a percentage of the total number of institutions using each LMS as a primary system, and “by enrollments”, where we scale the institutions by its total enrollment. The latter better captures the business of the LMS market, since most licensing deals are based the number of students.

    But first, let’s look at an updated LMS market share graphic, commonly known as the squid graphic, for US and Canadian higher education. The original idea remains – to give a picture of the LMS market in one page, highlighting the story of the market over time. The key to the graphic is that the width of each band represents the percentage of institutions using a particular LMS as its primary system.
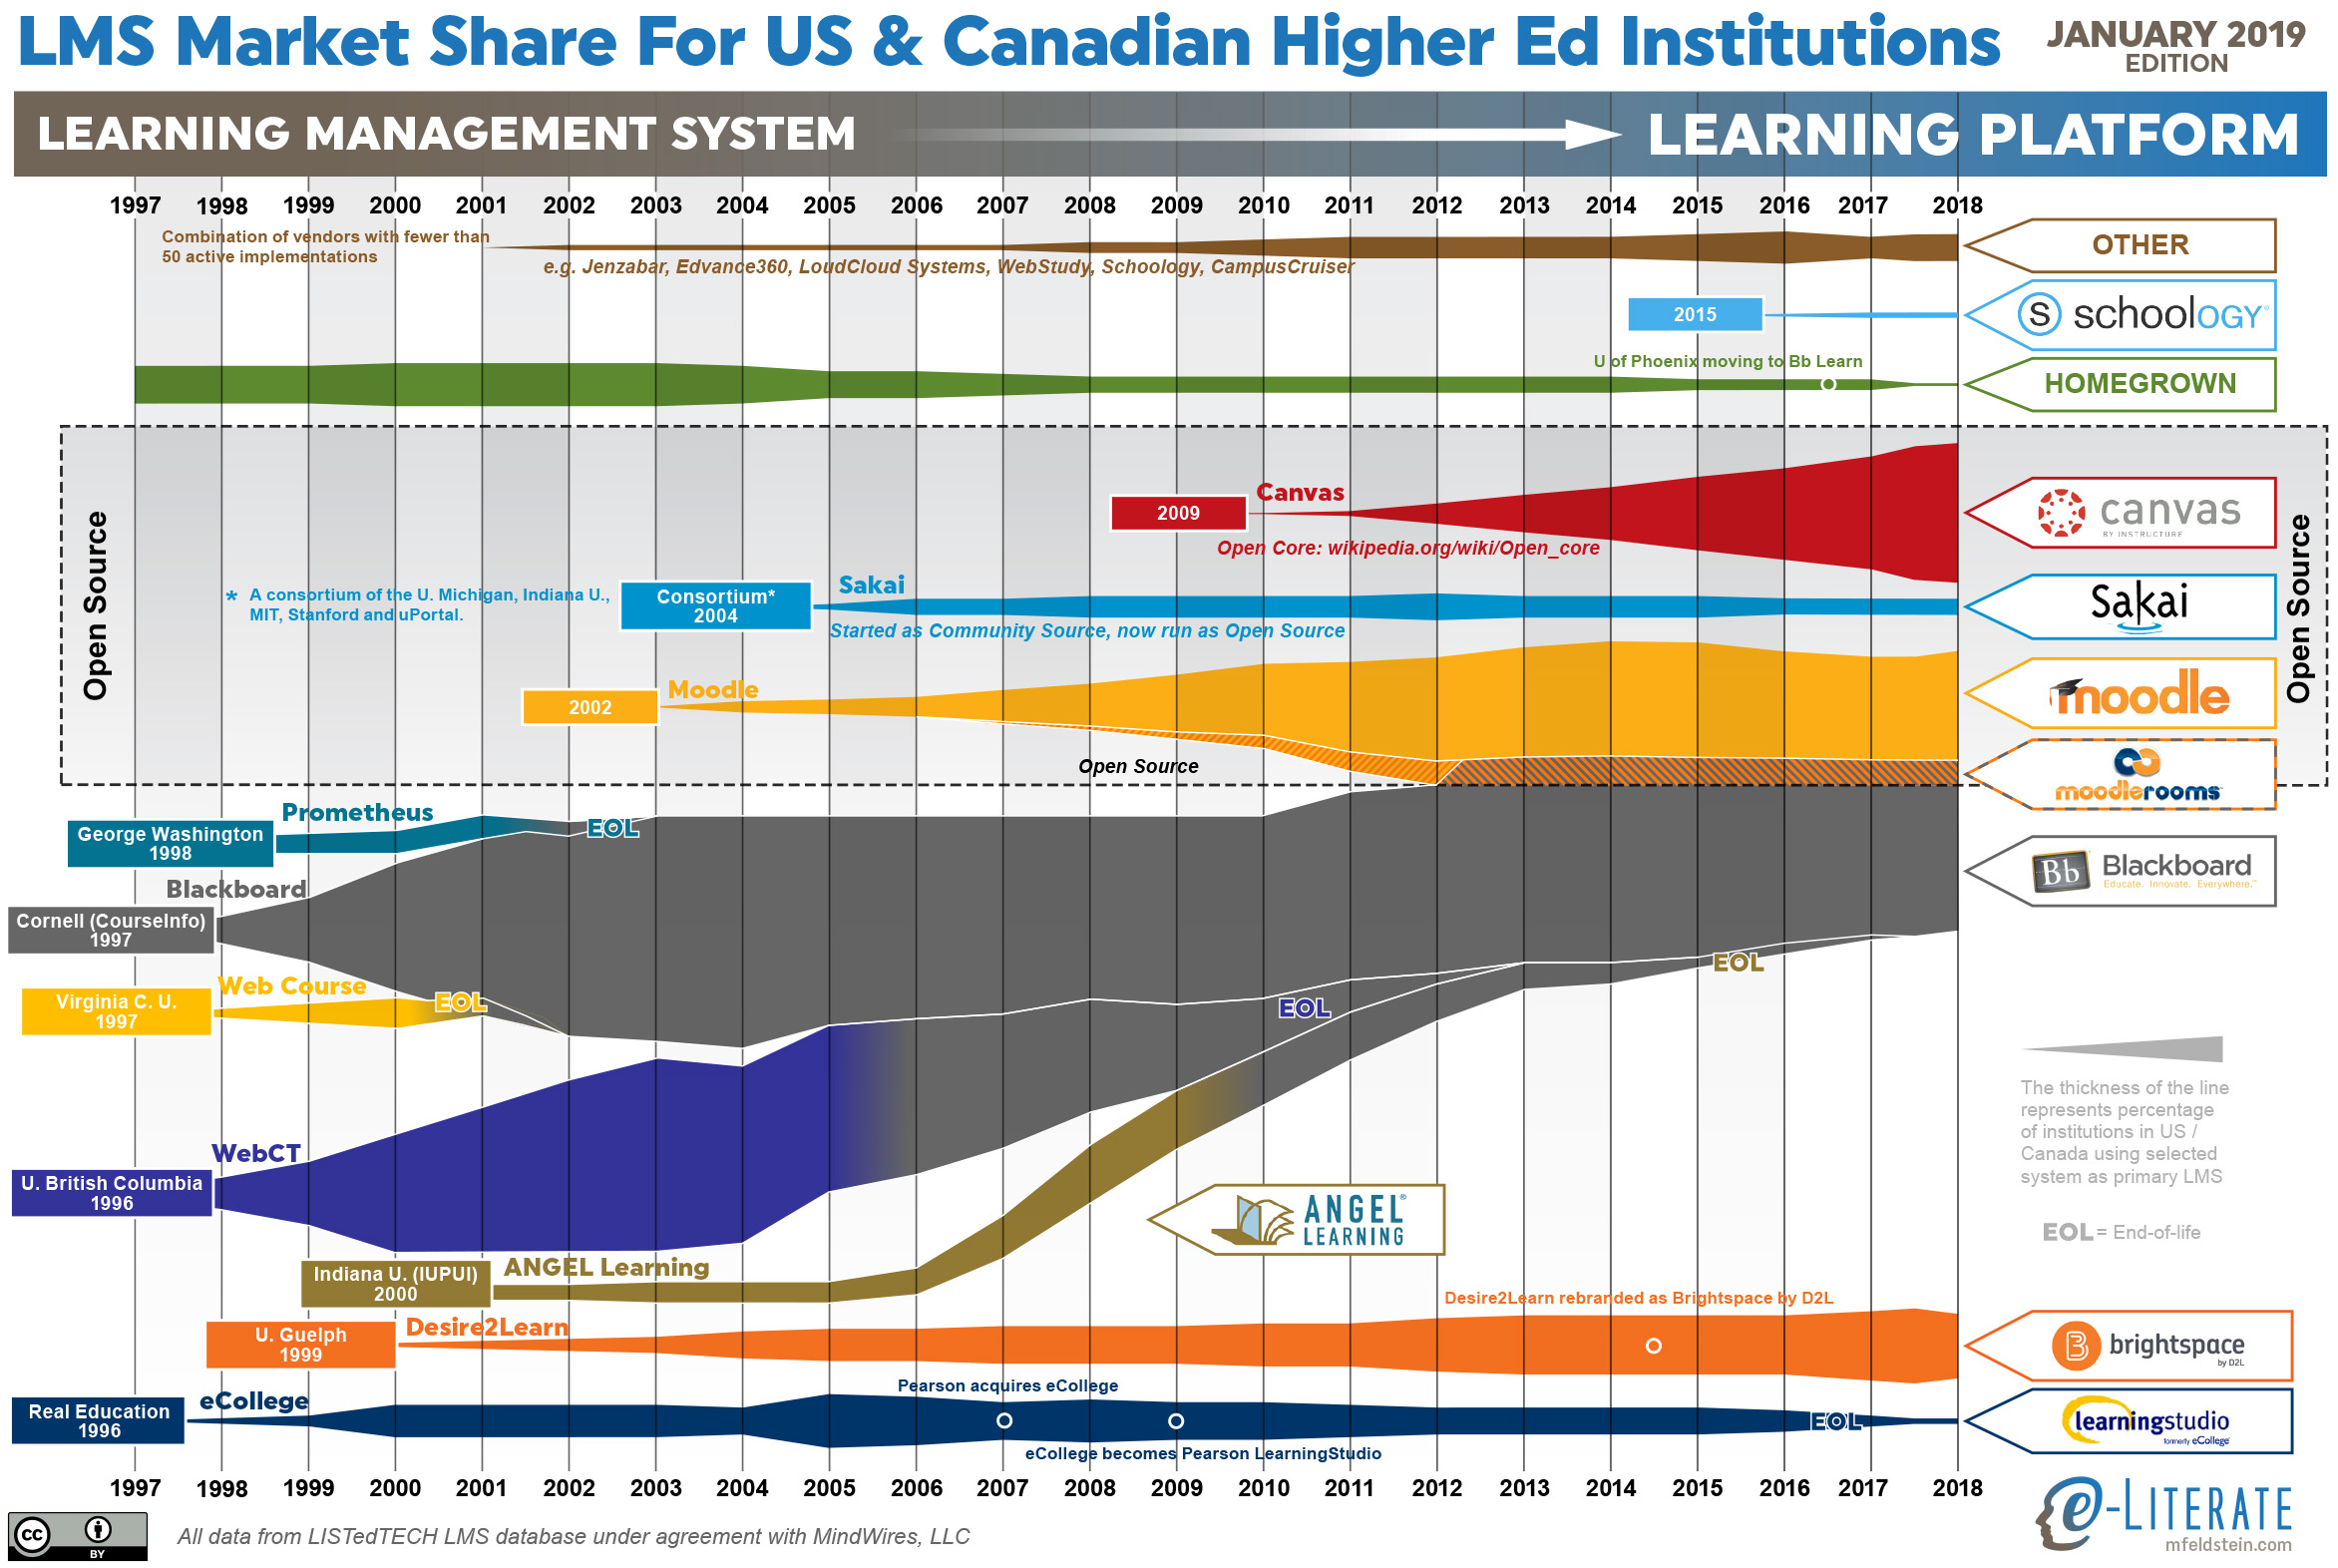
    Higher ed LMS market share for US and Canada, January 2019

    This year there are two inter-related trends that deserve a broader explanation -the LMS market slowed down with less activity overall, and Canvas and Blackboard continue to be neck-and-neck in the top spot of this market.

    We recently described the overall market activity slowdown in that there are fewer LMS formal evaluations taking place since mid 2018, with initial data pointing to a 20 – 25% drop from a year earlier. This slowdown seems to be a type of plateau rather than a continuing trend, and we are watching to see if it is temporary or not.

    Last summer we shared the symbolic passing of the torch where Canvas surpassed Blackboard in US market share, which was the first time Blackboard was not the top system since the market emerged two decades ago. What is interesting is that half a year later, the two systems are still neck-and-neck. In the US Canvas is still slightly ahead, and in North America (adding in Canada), Blackboard remains in the top spot by 0.4% (26.8% to 26.4%). Why is Canvas not continuing to extend its lead? Looking at the underlying data, there seems to be three reasons to consider:

    • The overall market slowdown means that there are fewer deals for Canvas to win lately.
    • Blackboard continues its University of Phoenix implementation, which still includes dozens of campuses despite its enrollment drop.
    • The shutdown in December of the for-profit Education Corporation of America (Virginia College and Brightwood College systems) meant that Canvas lost several dozen campuses.

    The latter two points should fully play out in the next three months, possibly making this a one-time change in trends, but it is important to call this situation out.

    Some other notes:

    • The market continues to consolidate around the Big Four – Blackboard, Canvas, D2L Brightspace, and Moodle.
    • The Homegrown option for LMS usage is going away, at least in a statistical sense. Only a handful of schools even consider this option.
    • D2L shares the challenge of having picked up several large for-profit systems that are closing campuses and therefore hurting market share. In D2L’s case, the biggest one is the former EDMC schools – the Art Institutes, Argosy University, and South University – that were sold out of bankruptcy to a non-profit entity and have closed dozens of campuses over the past year. These losses offset many of D2L’s wins in 2018.
    • Moodle had a few new wins in North America.

    Sticking with North America, we can also show LMS market share scaled by the enrollment of each institution, giving a different measure worth considering.
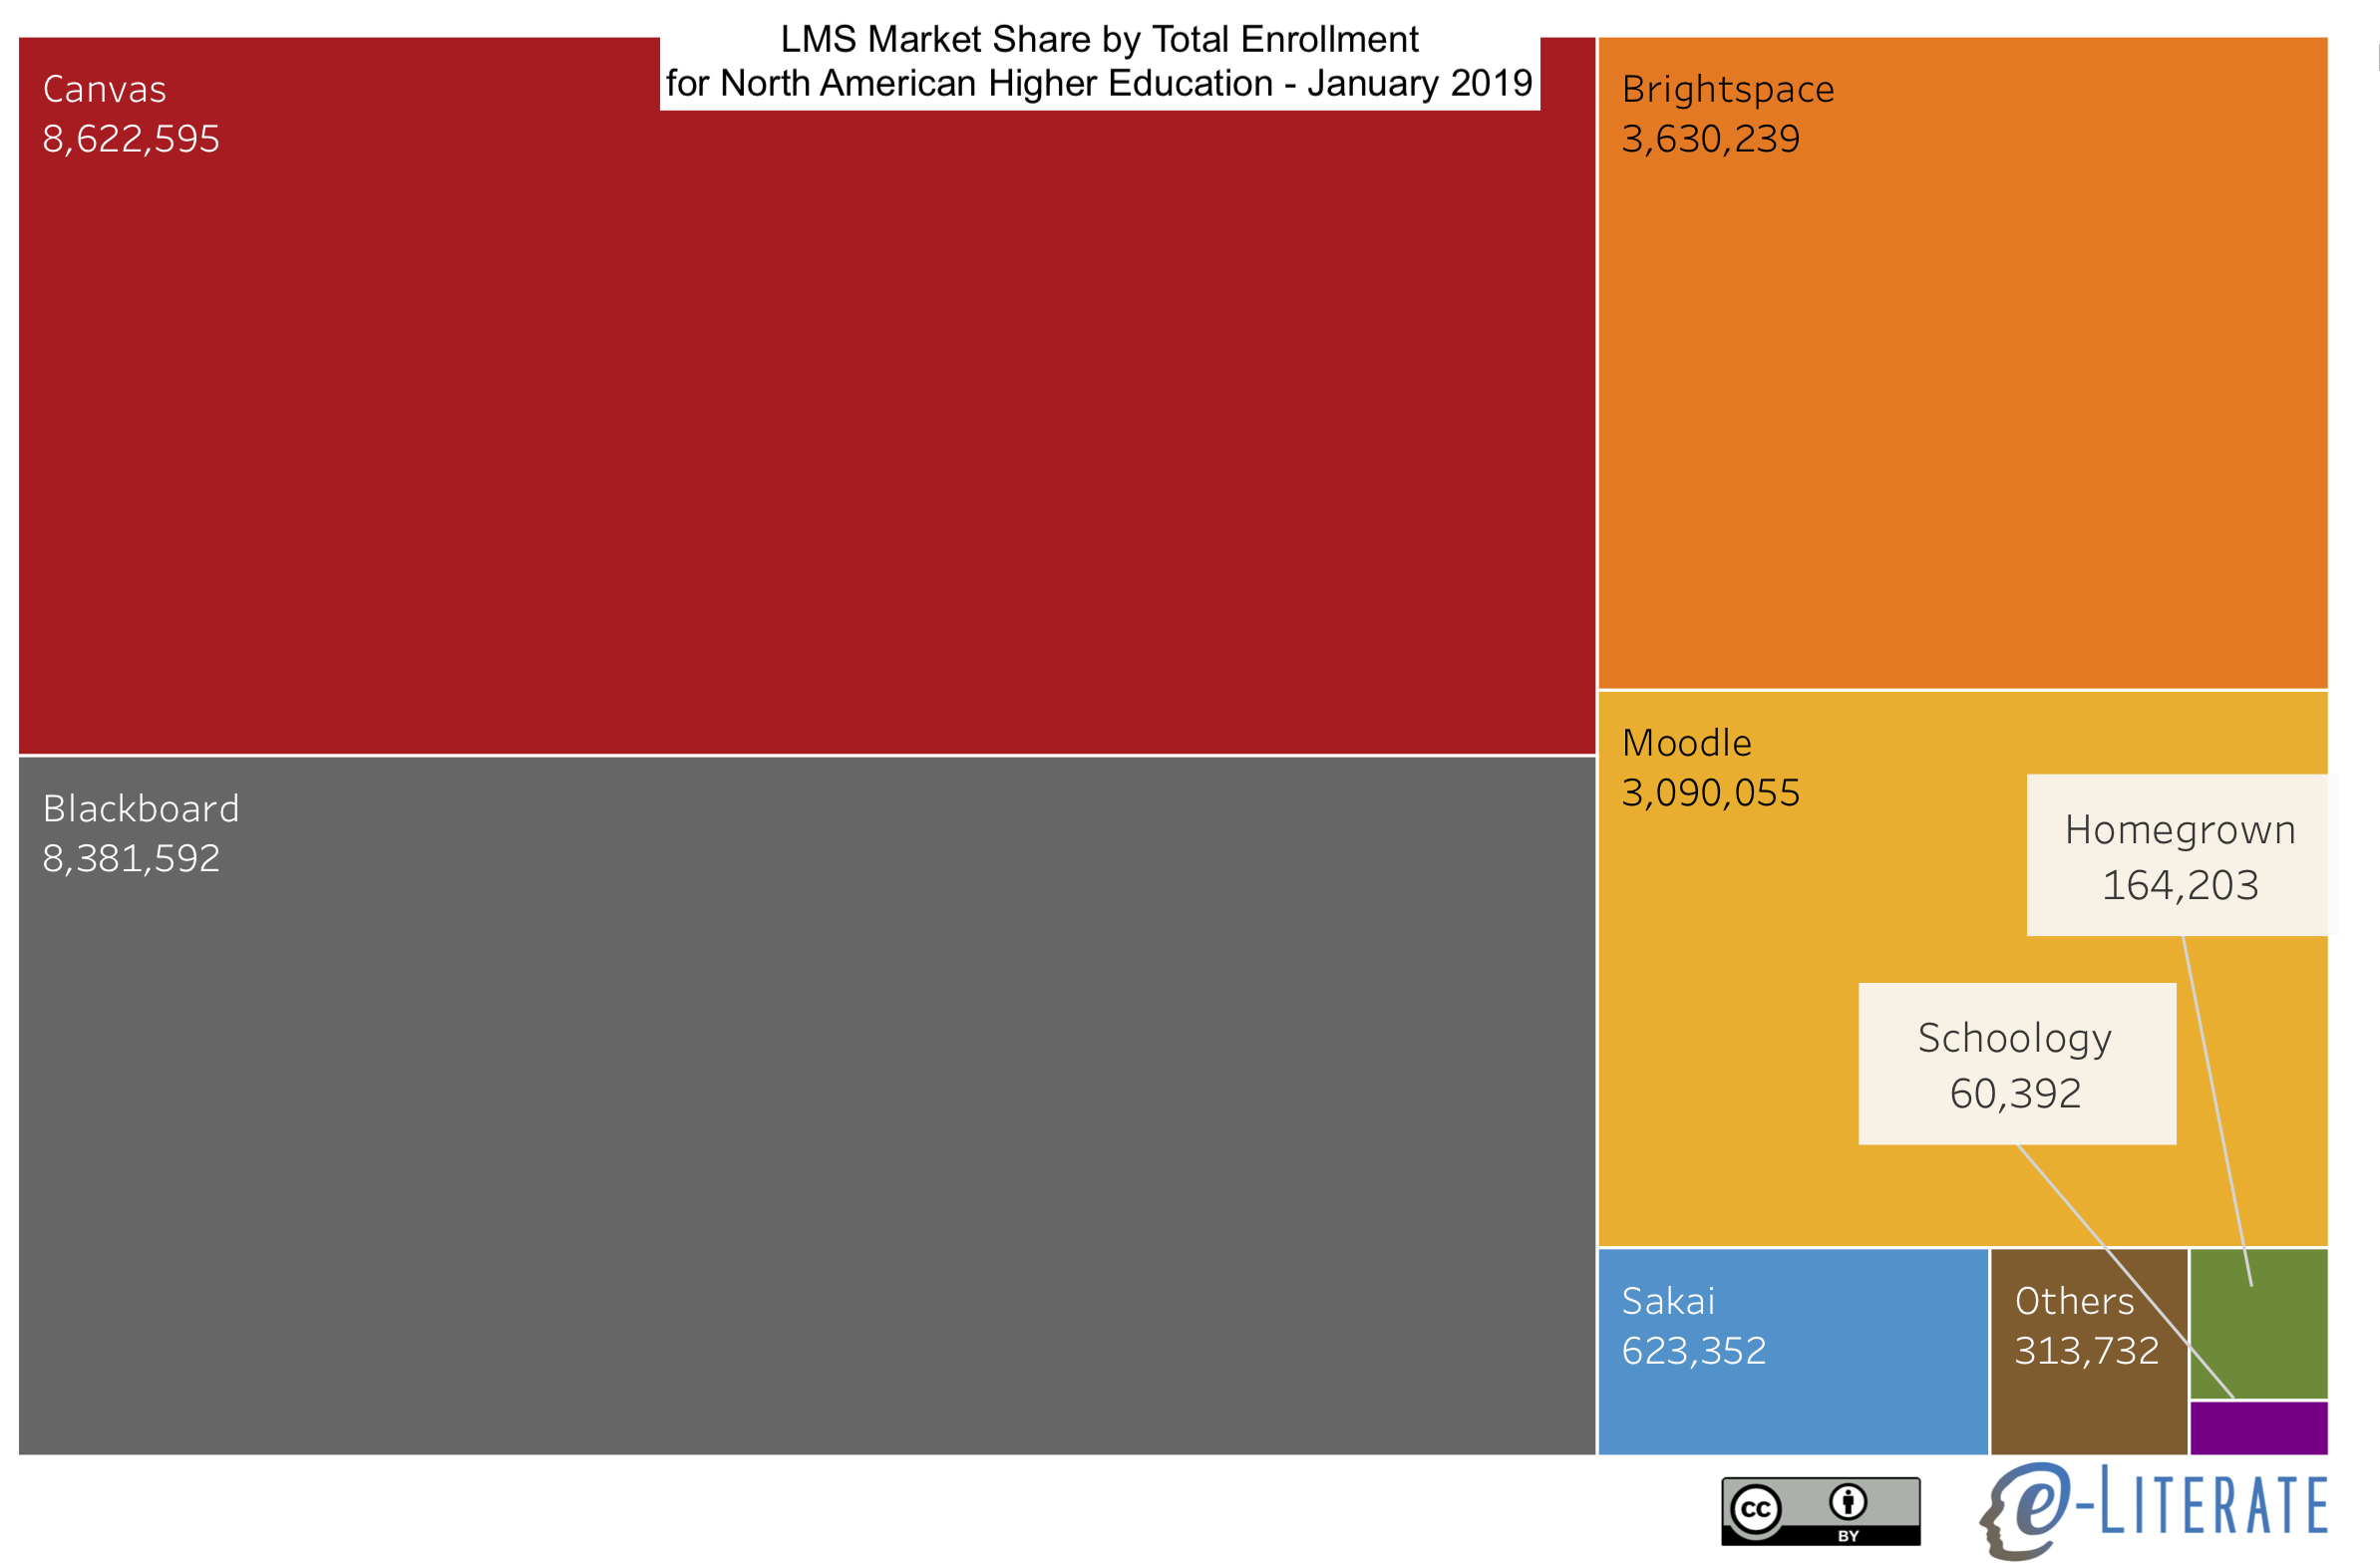
    NA LMS Market Share by Enrollment

    We’ll share more information on other global regions in the coming months.

  • State of Higher Ed LMS Market for US and Canada: Fall 2017 Edition

    State of Higher Ed LMS Market for US and Canada: Fall 2017 Edition

    Now that we’re past the 2017 WCET conference and headed to the EDUCAUSE conference, let’s look at updates on the institutional LMS market for North America (US and Canada). Last year we started our LMS market analysis service, where we are working with LISTedTECH to provide market data and visualizations, and our fall report for subscribers will be released in about a month. Data for 2017 presented below goes through October 1 of this year.

    We present the data “by institutions”, with market share as a percentage of the total number of institutions using each LMS as a primary system, and “by enrollments”, where we scale the institutions by their total enrollment. The latter better captures the business of the LMS market, since most licensing deals are based the number of students. We have also included data from Fall 2016 by institutions for comparison purposes.

    Some notes on the market share as defined by percentage of institutions:

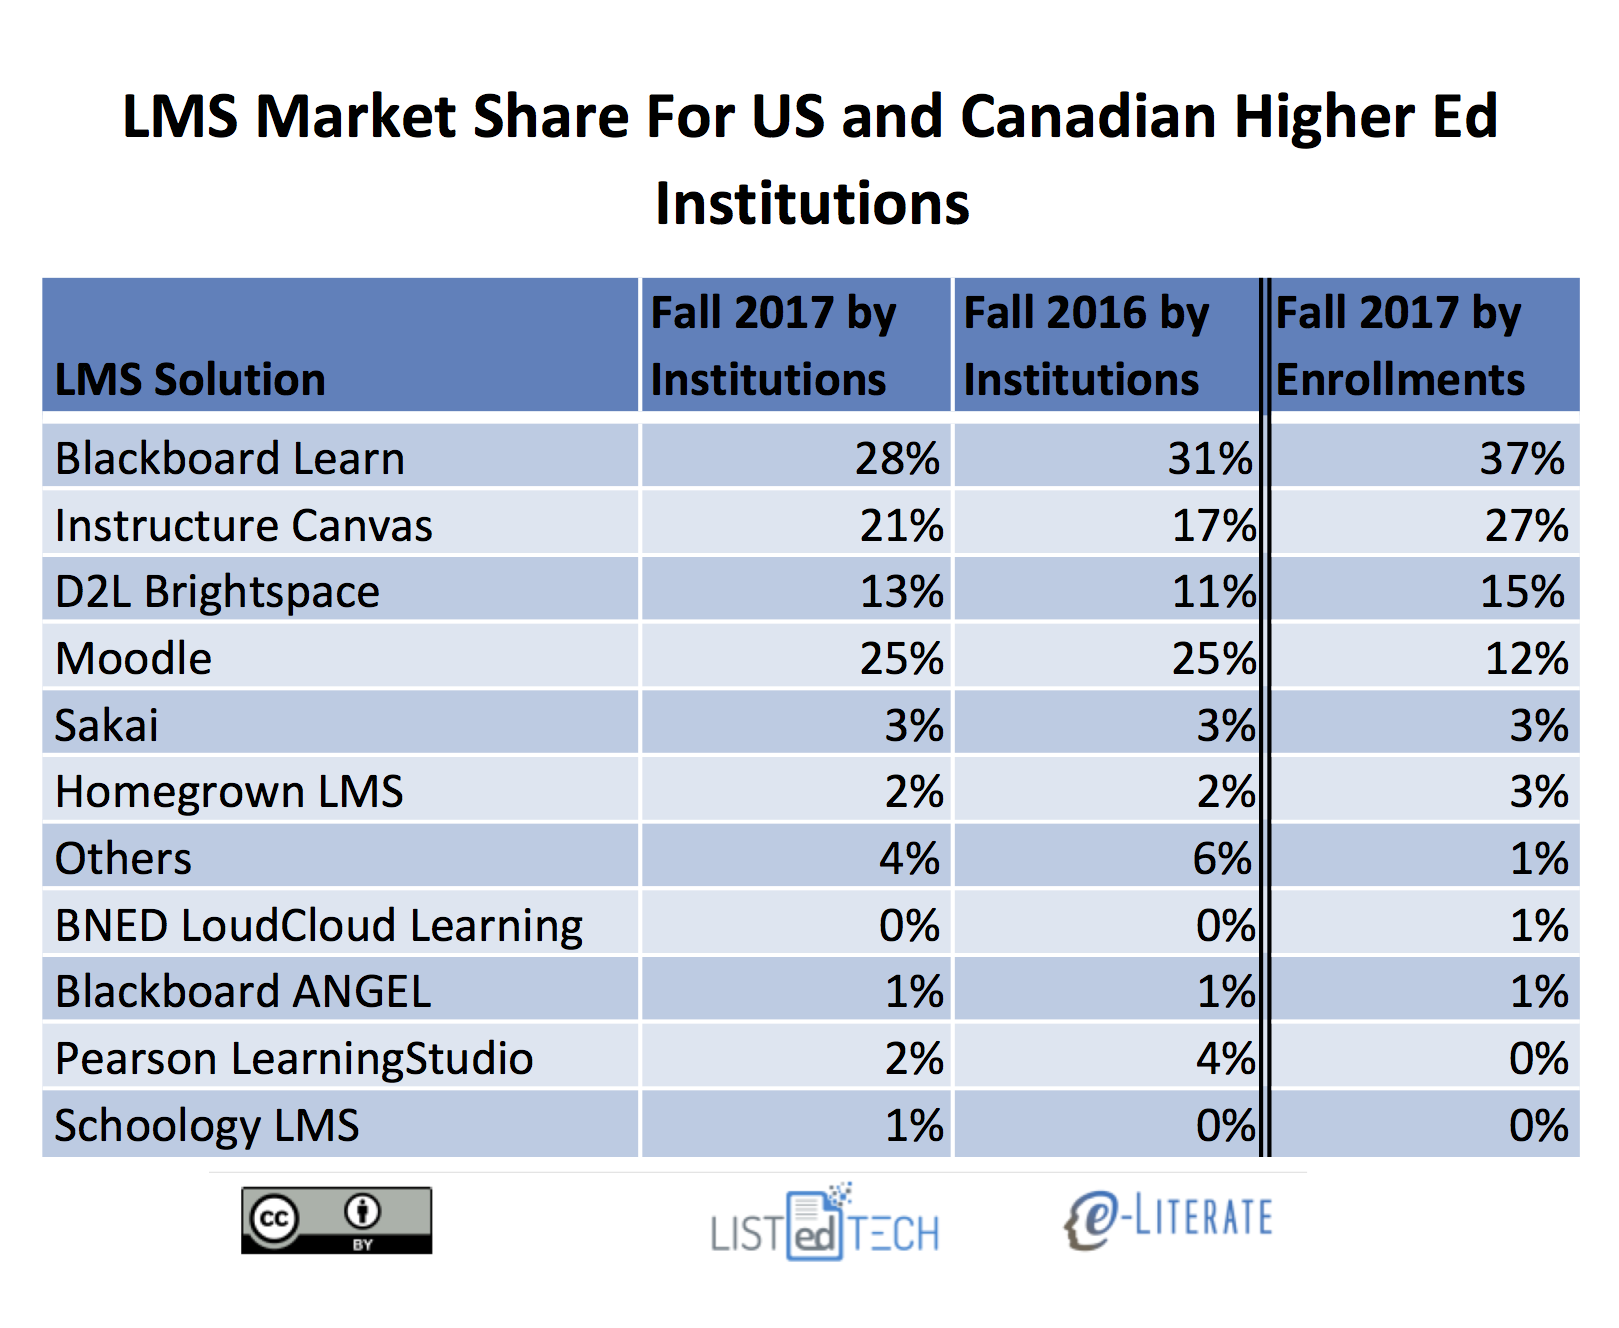
    • In terms of new selections the market continues to be a two-horse race recently with Canvas by Instructure and Brightspace by D2L as the only two solutions with material gains in market share. Canvas grew from 17% to 21% , and Brightspace from 11% to 13%, of the market.
    • Outside of the big four – Blackboard Learn, Canvas, D2L Brightspace, and Moodle – no other system has more than 3% of the market measured either by percentage of institutions or percentage of enrollments. Furthermore, the category of “Others”, capturing systems not listed above and having less than 1% market share, actually dropped from 4% to 2% of the market. This indicates that continued market consolidation.
    • Schoology and BNED LoudCloud grew slightly, but not nearly to the degree of the Canvas and Brightspace.
    • Blackboard Learn fell the farthest, from 31% to 28% of of the market. The second biggest drop was Pearson LearningStudio, from 4% to 2%, based on its end-of-life notice for December 2017.
    • Moodle and Sakai both lost market share of just under 1%, not enough to show up in the rounded numbers in the table but enough to show up in our underlying data.
    • The difference in Moodle’s market share by institutions at 25% and by enrollments at 12% really shows how concentrated their usage is for smaller schools.
    • When viewing market share as defined by percentage of enrollments, Blackboard and Canvas are the most-used systems, at 37% and 27% of the market, followed by D2L at 15% and Moodle at 12%.

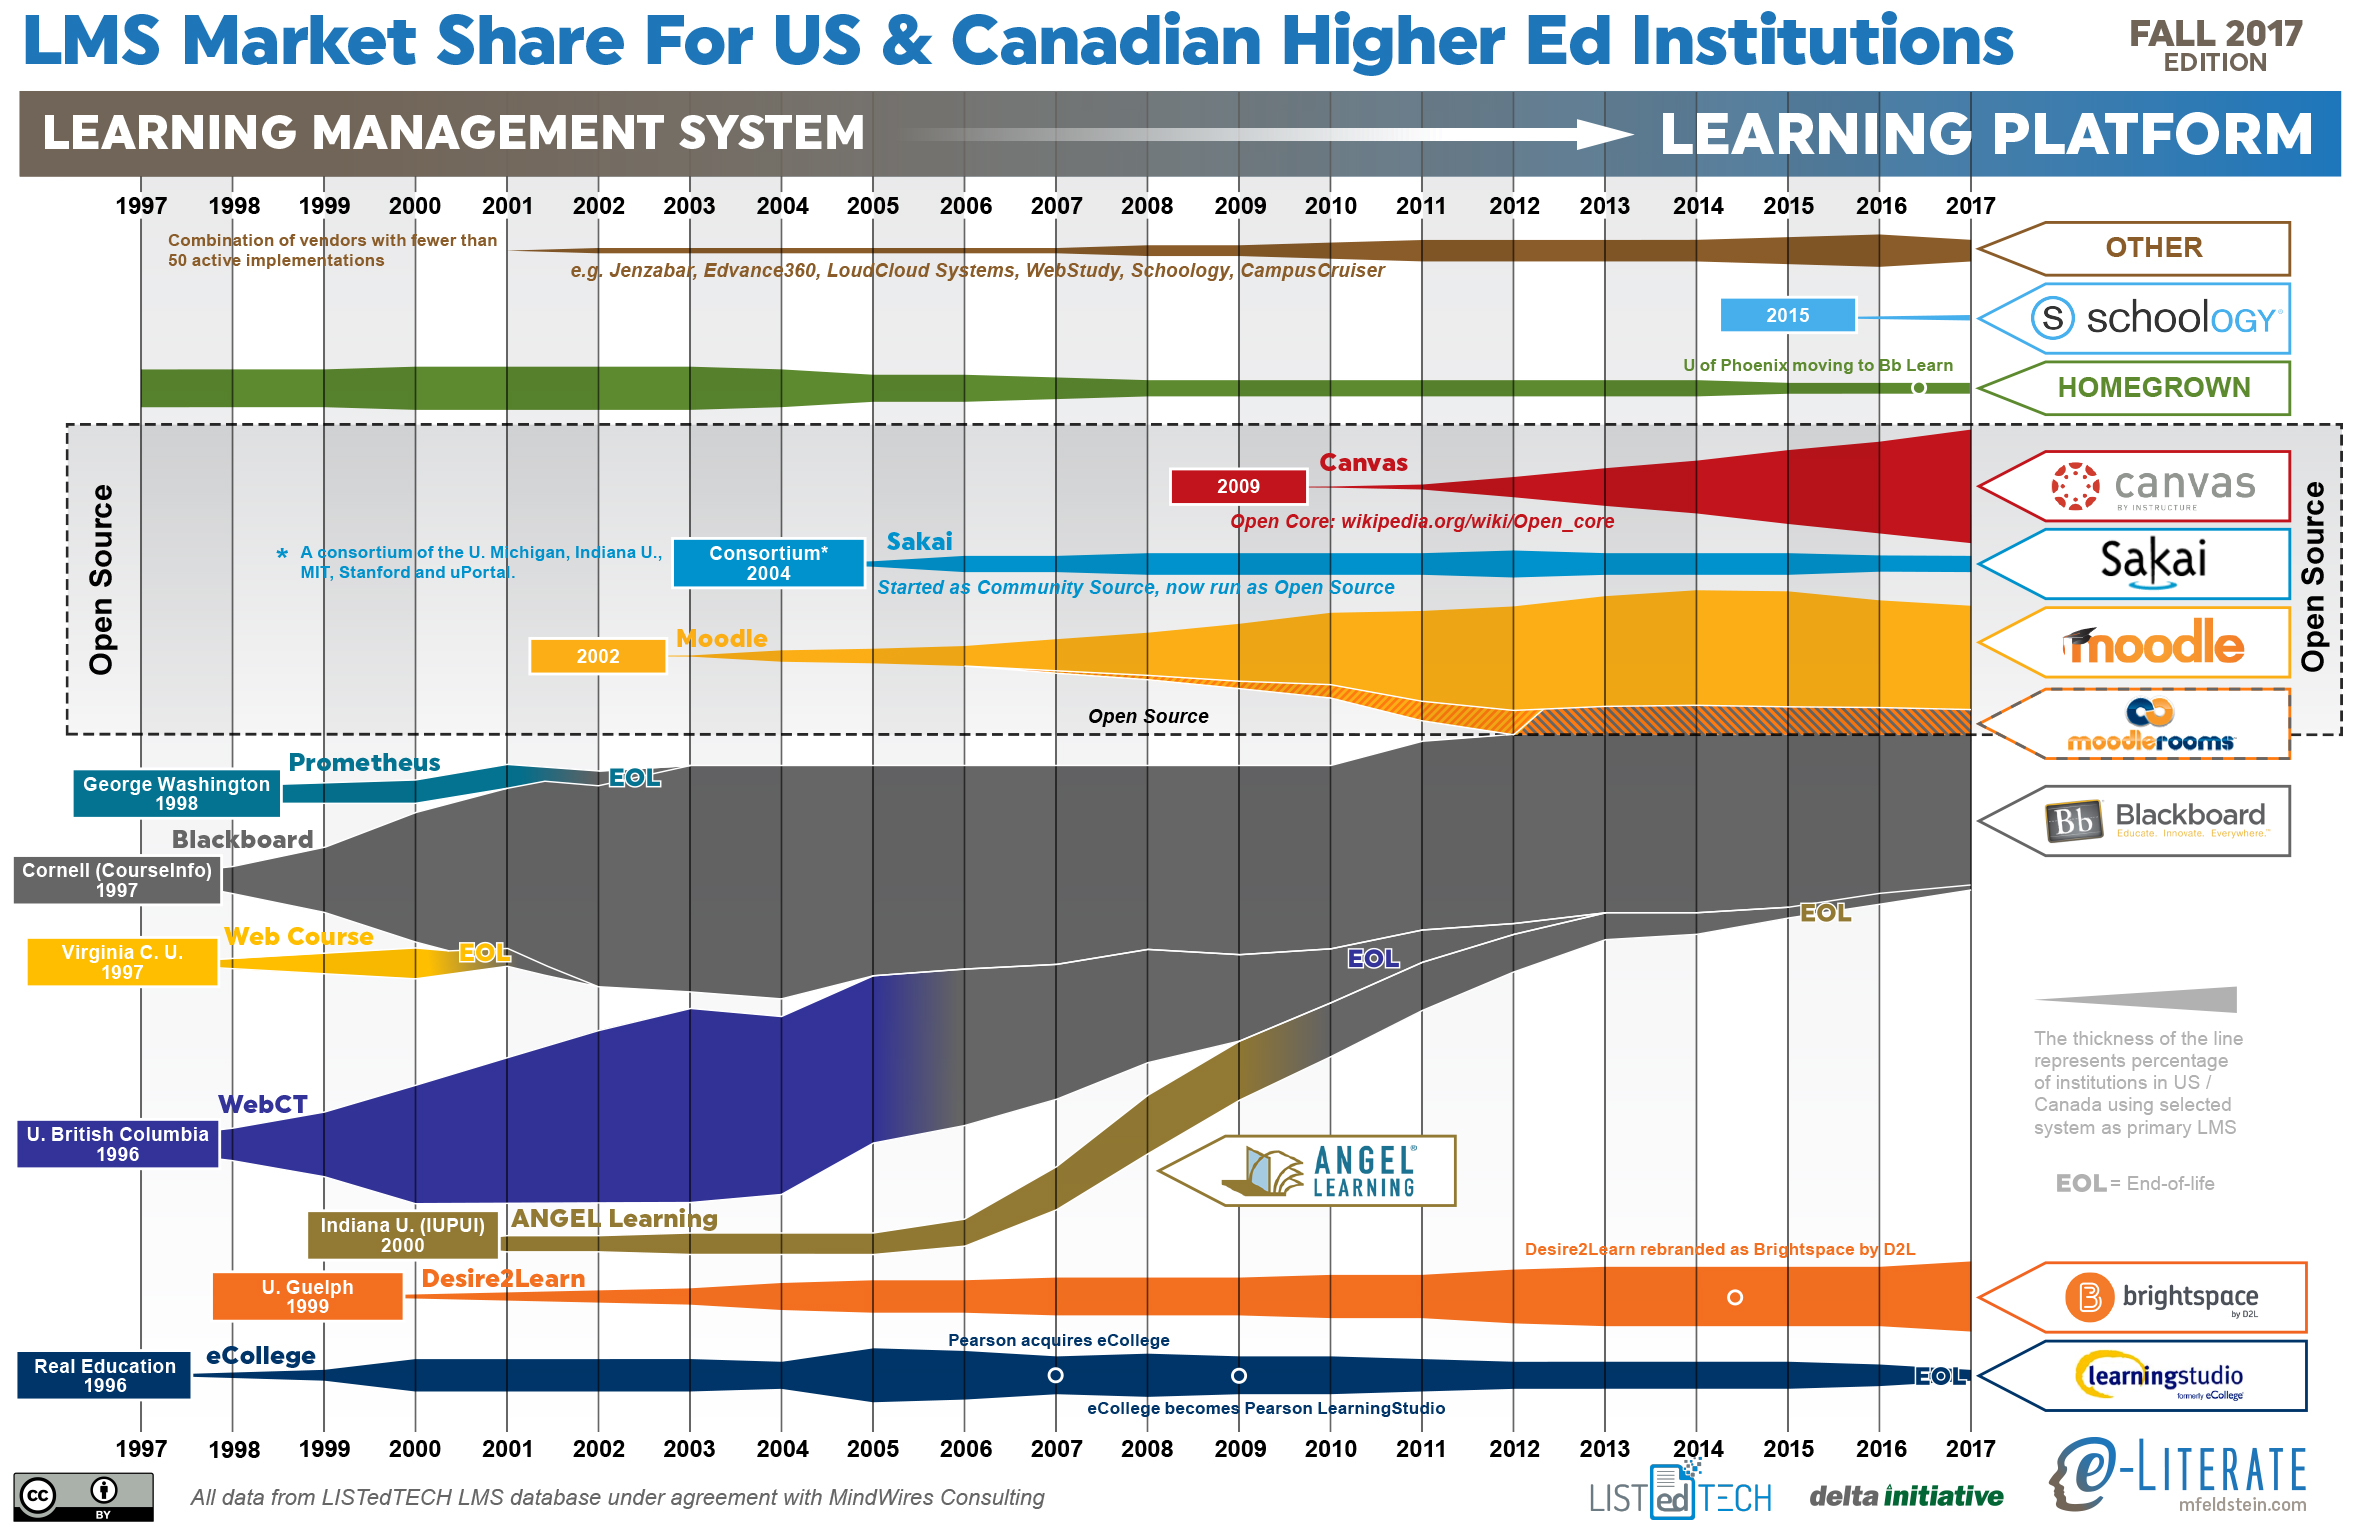
    Stepping back from the immediate data, let’s look at an updated LMS market share graphic, commonly known as the squid graphic, for US and Canadian higher education. The original idea remains – to give a picture of the LMS market in one page, highlighting the story of the market over time. The key to the graphic is that the width of each band represents the percentage of institutions using a particular LMS as its primary system.

    Some additional notes:

    • Blackboard and Moodle have been the market leaders as number one and two in share as they have been for the past decade. However, Canvas is quickly approaching Moodle’s market share.

    We’ll share any updates we discover at the conference this week.

  • State of Higher Ed LMS Market for US and Canada: Spring 2017 Edition

    State of Higher Ed LMS Market for US and Canada: Spring 2017 Edition

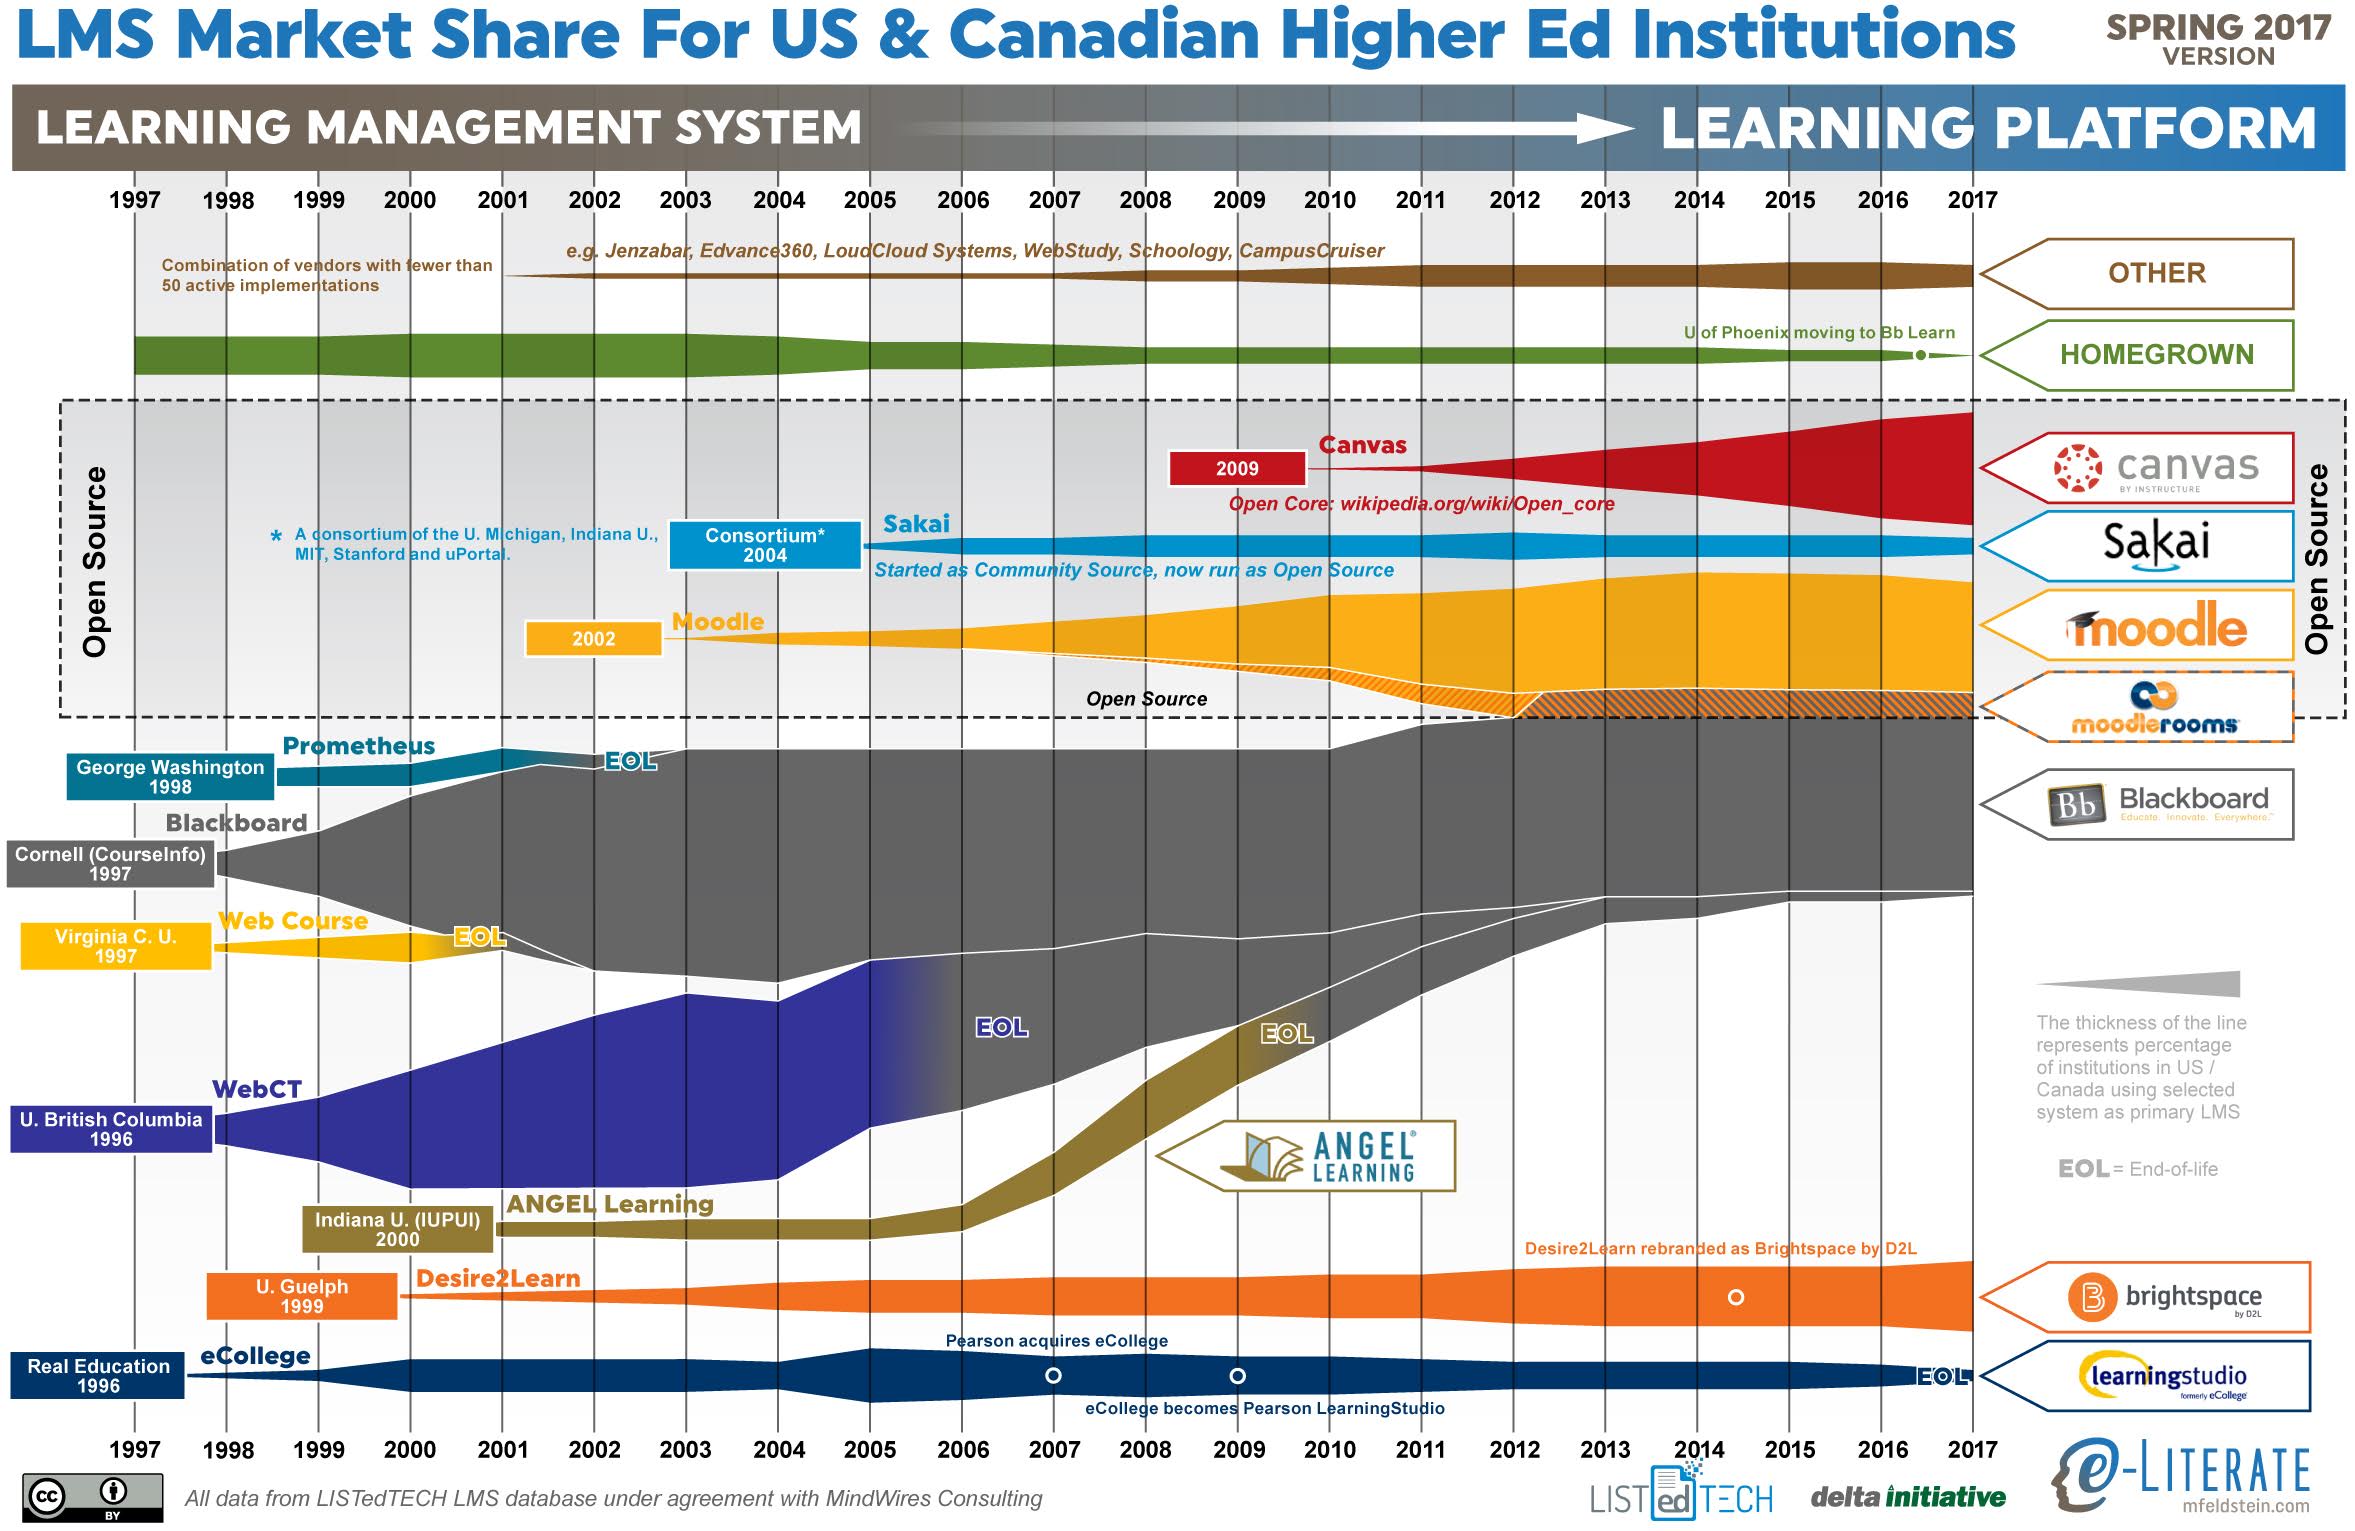
    This is the ninth year I have shared the LMS market share graphic, commonly known as the squid graphic, for US and Canadian higher education. The original idea remains – to give a picture of the LMS market in one page, highlighting the story of the market over time. The key to the graphic is that the width of each band represents the percentage of institutions using a particular LMS as its primary system.

    Last year we made a big shift based on our LMS market analysis service – we are working with LISTedTECH to provide market data and visualizations. This data source provides historical and current measures of institutional adoptions, allowing new insights into how the market has worked and current trends. Our spring report for subscribers will be released this month. Data for 2017 goes through April 1 of this year.

    (more…)

  • Coursera: The pivot to corporate learning becomes clear

    Last week I had a post in the Chronicle titled “MOOCs Are Dead. Long Live Online Higher Education.” triggered by the departure of Daphne Koller from her day-to-day role at Coursera.

    Mr. Ng left Coursera in 2014 for Baidu, focusing on deep learning research. Mr. Thrun stepped down as chief executive of Udacity in April of this year to reduce his day-to-day responsibilities. He is now president of Kitty Hawk, a company focused on the development of flying cars. And Ms. Koller recently left Coursera to become chief computing officer at Calico, a company that researches human aging.

    Addressing the question of business models:

    So will these changes in corporate vision and leadership change the long-term trajectory of MOOCs?

    I would argue that there never was a viable vision for MOOCs in higher education in the first place. The big three MOOC providers’ trial-and-error efforts to find a viable business model are what led to their shifts in strategy and ultimately the departure of their founders for fields outside of education. It may be that making meaningful changes in higher ed is more difficult or at least more frustrating than designing flying cars or tackling the complexities of aging.

    With today’s announcement from Coursera, their pivot continues, building on their move over the past year to go to on-demand courses. Coursera is making a big shift to corporate workforce development as described by CEO Rick Levin on the company blog this morning. (more…)

  • MarketsandMarkets: Getting the LMS market wrong

    New LMS market analysis with a leader list that includes a company that is retiring its LMS and ignores the company who has a 5x lead in new implementations for its core market? Sign me up.

    Over the next week or two, we plan several posts at e-Literate based on the various LMS users conferences we recently attended. We already covered Sakai and Blackboard, and we will have commentary on Moodle, Schoology, D2L, and Canvas soon. But before we do so, I wanted to call out the recent analysis by MarketsandMarkets, which requires some commentary as it is leading to some media coverage that could misinform those trying to understand the LMS market. The headline of their recent market report:

    Learning Management System (LMS) Market Worth 15.72 Billion USD by 2021

    According to a new market research report, “Learning Management System Market by Application, Delivery Mode (Distance Learning and Instructor-Led Training), Deployment (On-Premises and Cloud), User Type (Academic and Corporate), Vertical, and Region – Global Forecast to 2021”, published by MarketsandMarkets, the LMS market size is expected to grow from USD 5.22 Billion in 2016 to USD 15.72 Billion by 2021, at a CAGR of 24.7%.

    (more…)

  • State of Higher Ed LMS Market for US and Canada: Spring 2016 Edition

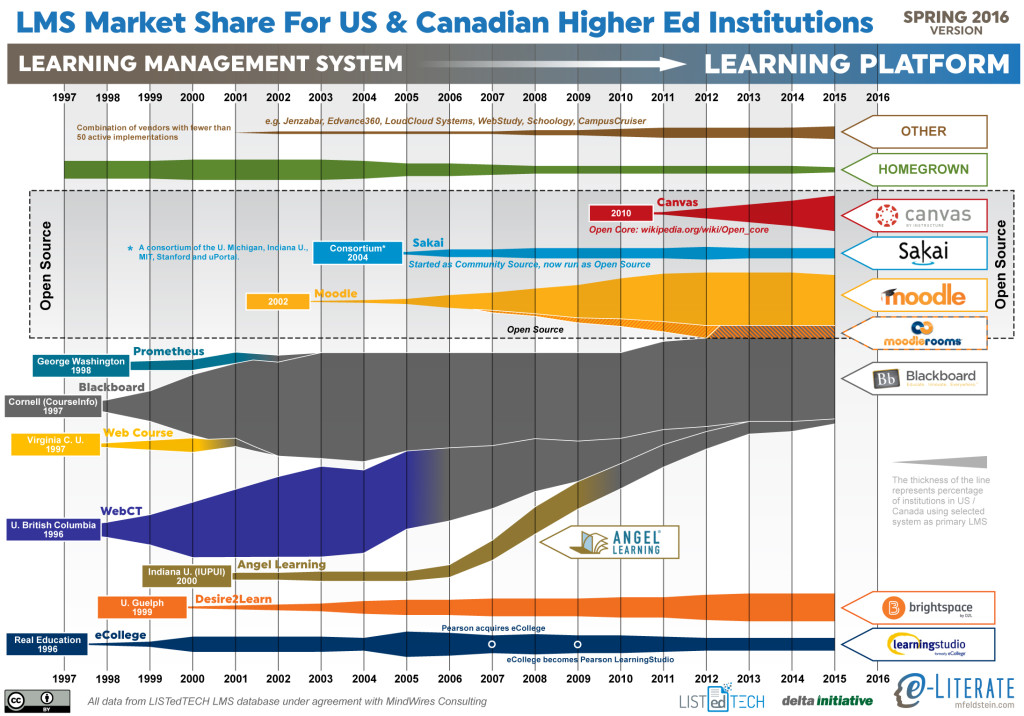
    This is the eighth year I have shared the LMS market share graphic, commonly known as the squid graphic, for (mostly) US higher education. The original idea remains – to give a picture of the LMS market in one page, highlighting the story of the market over time. The key to the graphic is that the width of each band represents the percentage of institutions using a particular LMS as its primary system.

    This year marks a significant change based on our upcoming LMS subscription service. We are working with LISTedTECH to provide market data and visualizations. This data source provides historical and current measures of institutional adoptions, allowing new insights into how the market has worked and current trends. This current graphic gets all of its data from LISTedTECH. Where previous versions of the graphic used an anchoring technique, combining data from different sources in different years, with interpolation where the data was unavailable. Now, every year’s data is based on this single data source.

    This graphic has been in the public domain for years, however, and we think it best to keep it that way. In this way we hope that the new service will provide valuable insight for subscribers but also improve what we continue to share here on the e-Literate blog.

    Since we have data over time now and not just snapshots, we have picked the end of each year for that data. For this reason, the data goes through the end of 2015. We have 2016 data but chose not to share partial-year results in an effort to avoid confusion.

    LMS_MarketShare_20160316

    A few items to note:

    • As noted in previous years, the fastest-growing LMS is Canvas. There is no other solution close in terms of matching the Canvas growth.
    • Blackboard continues to lose market share, although the vast majority of that reduction over the past two years has been from customers leaving ANGEL. Blackboard Learn lost only a handful of clients in the past year.
    • While the end-of-life occurs next year, Pearson’s has announced LearningStudio’s end-of-life for the end of 2017.
    • With the new data set, the rapid rise and market strength of WebCT becomes much more apparent than previous graphics.
    • There is a growing line for “Other”, capturing the growth of those systems with less than 50 active implementations as primary systems; systems like Jenzabar, Edvance360, LoudCloud Systems, WebStudy, Schoology, and CampusCruiser.
    • While we continue to show Canvas in the Open Source area, we have noted a more precise description as an Open Core model.

    For a better description of the upcoming LMS subscription service, read this post and / or sign up for more information here.

  • Wheaton College Selects Schoology As New LMS In Surprise Decision

    Schoology, a social cloud-based LMS known mostly used in the K-12 market, has set its sights on expanding into the higher education market using their recent $32 million funding round. Last January, Colorado State University’s Global Campus selected Schoology to replace Blackboard Learn, yet the market impact of this decision was limited, partially due to the non-traditional nature of the online-only campus. What Schoology has needed to gain more market credibility and awareness is a second set of higher ed institutions selecting Schoology in an open competition. Enter Wheaton College in Illinois, which recently selected Schoology as its new LMS. This is the most significant new selection that I have seen.

    I interviewed CIO Wendy Woodward from Wheaton to find out more on the nature of this decision. For context, Woodward became Wheaton’s CIO in January 2015, moving from her previous job at Northwestern University. Based on her listening tour to understand campus needs, the decision to replace the LMS was listed near the top of the list. Given Northwestern’s recent move to Canvas, Woodward related that there was a common assumption that Wheaton would do the same. The faculty committee fully went through the evaluation process, however, and ended up selecting Schoology after inviting responses from 10 different solutions. The campus has already begun pilots and plans to be fully migrated to the new system by Fall 2016. (more…)