e-Literate

Present is Prologue

Tag: Higher Ed

  • State of the US Higher Education LMS Market: 2015 Edition

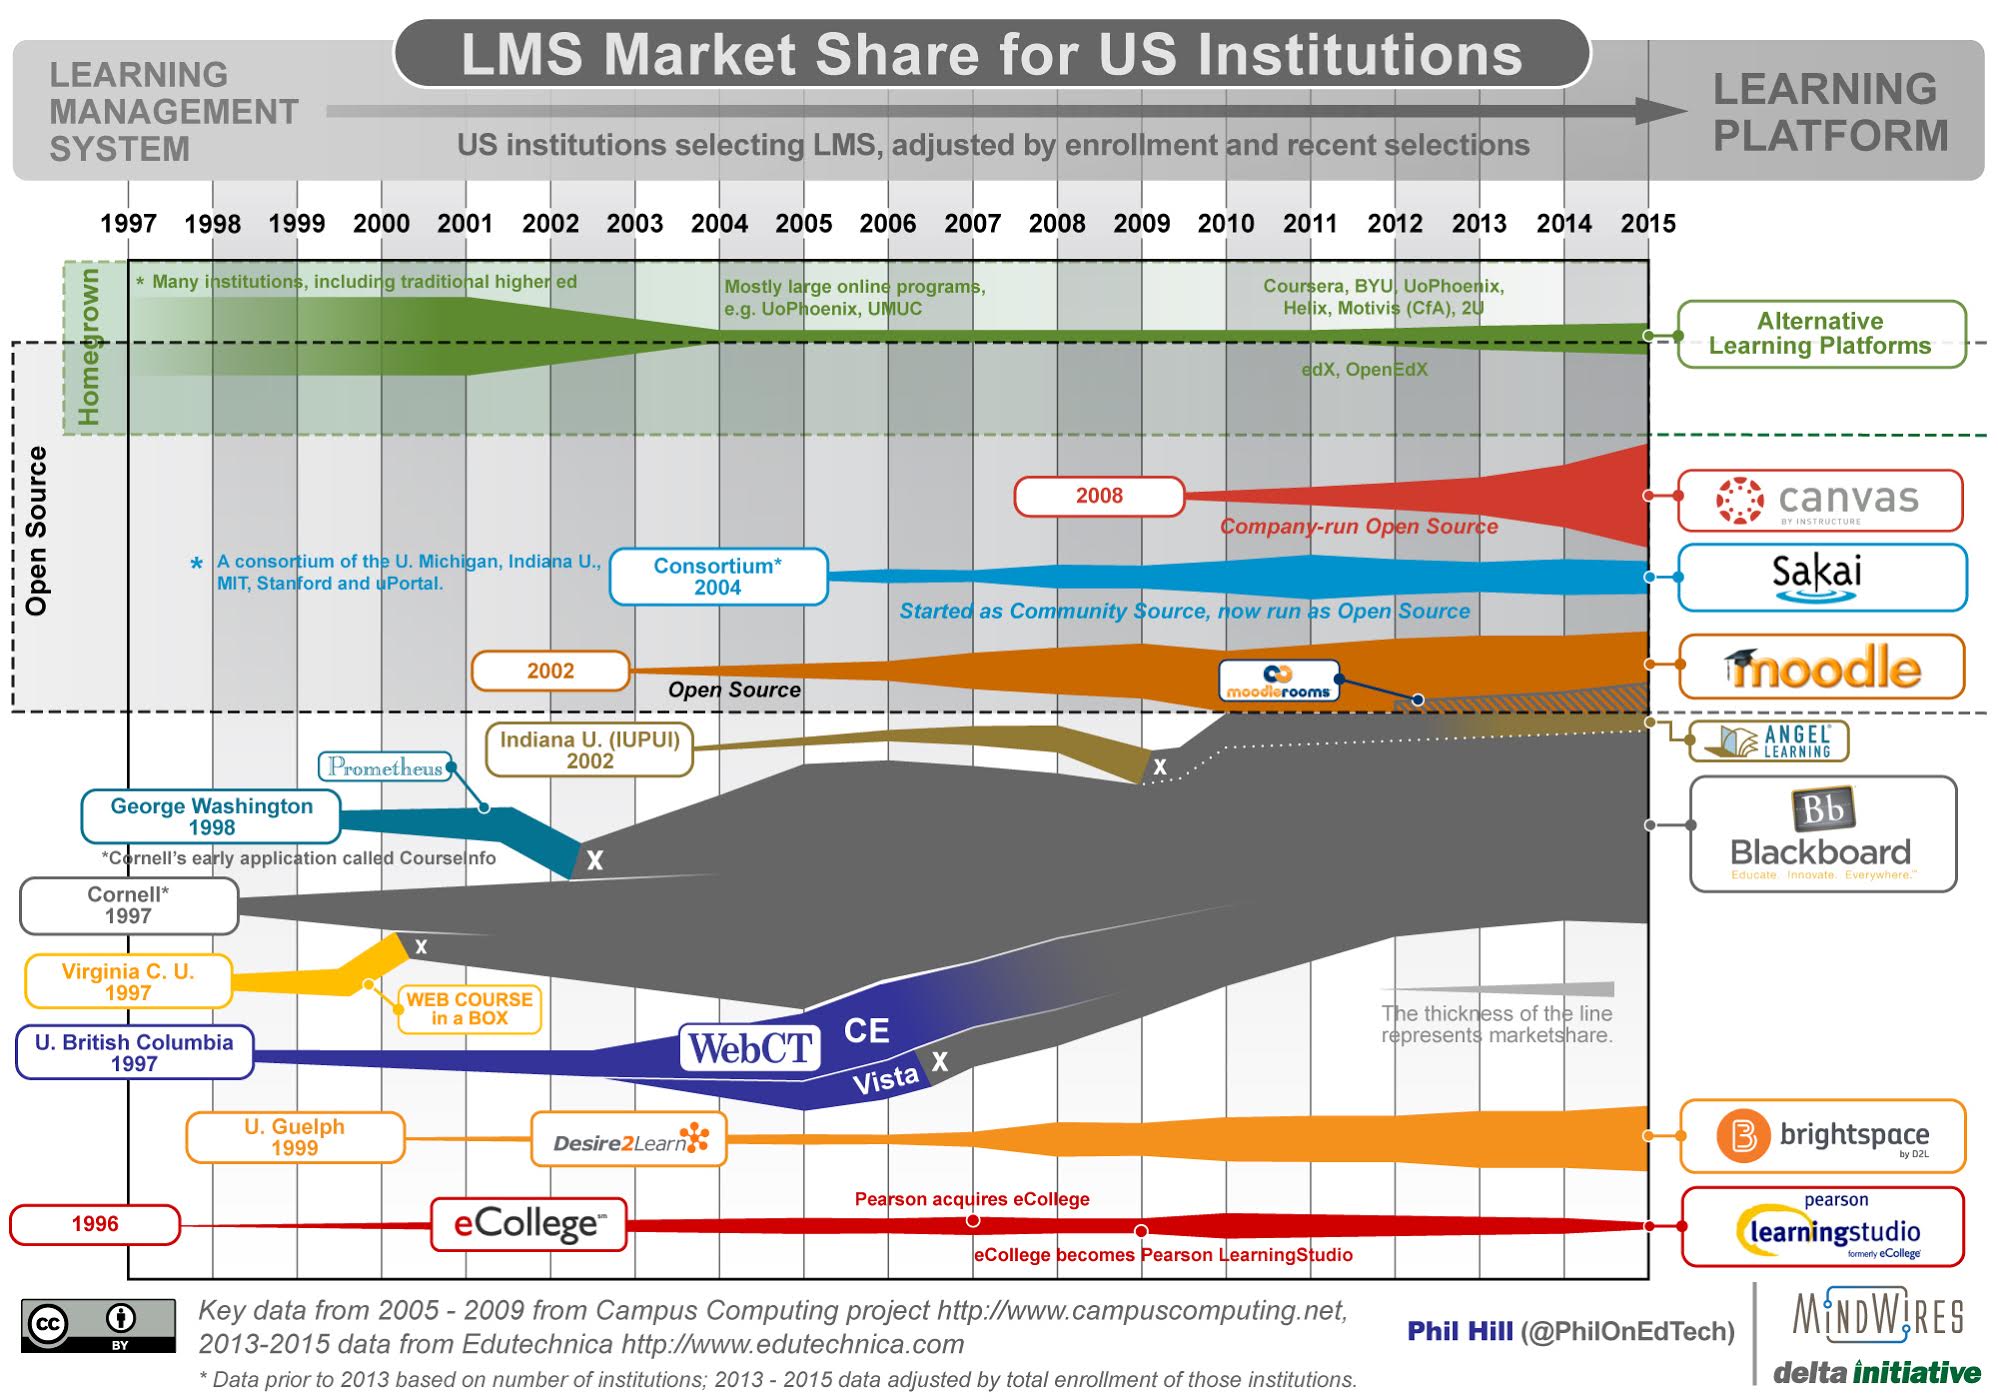
    I shared the most recent graphic summarizing the LMS market in October 2014, and thanks to revised data sources it’s time for an update. As with all previous versions, the 2005 – 2009 data points are based on the Campus Computing Project, and therefore is based on US adoption from non-profit institutions. This set of longitudinal data provides an anchor for the summary.

    The primary data source for 2013 – 2015 is Edutechnica, which not only does a more direct measurement of a larger number of schools (viewing all schools in IPEDS database with more than 700 FTE enrollments), but it also allows scaling based on enrollment per institution. This means that the latter years now more accurately represent how many students use a particular LMS. This post at Edutechnica provides the most recent data for Fall 2015.

    A few items to note:

    • The most important recent feature of the market – the rapid rise of Canvas, surpassing D2L and quickly closing in on Moodle – is quite visible now.
    • Blackboard Learn appears to have stopped its well-documented losses in US higher ed and has even risen in the past year. Its market share is far smaller than at its 2009 peak, but the company is no longer losing large numbers of clients each year.
    • D2L, Sakai, and Moodle have risen ever so slightly, but in effect have hit a plateau.
    • ANGEL and eCollege have lost market share.
    • There is a growing area of “Alternative Learning Platforms” that includes OpenEdX, 2U, Helix and Motivis (the newly commercialized learning platform from College for America).
    • While the data is more solid than 2012 and prior years, keep in mind that you should treat the graphic as telling a story of the market rather than being a chart of exact data.
    • Update (10/16): Removed “Curtin University as origin of Moodle based on Martin’s comments. Mea culpa – should have caught this earlier.
    • Update (10/23): Changed graphic title to refer to US and not North America.
    LMS_MarketShare_20151023

  • Instructure: Accelerating growth in 3 parallel markets

    I’m not sure which is more surprising – Instructure’s continued growth with no major hiccups or their competitors’ inability after a half-decade to understand and accept what is at its core a very simple strategy. Despite Canvas LMS winning far more new higher ed and K-12 customers than any other vendor, I still hear competitors claim that schools select Canvas due to rigged RFPs or being the shiny new tool despite having no depth or substance. When listening to the market, however, (institutions – including faculty, students, IT staff, academic technology staff, and admin), I hear the opposite. Canvas is winning LMS selections despite, not because of, RFP processes, and there are material and substantive reasons for this success.

    The only competitor I see that seems to understand the depth of the challenge they face is Blackboard. Other LMS solutions are adding “cloud” options or making incremental improvements to usability, but only Blackboard is going for wholesale changes to both its User Experience (UX) and cloud hosting architecture. Unfortunately, I question whether Blackboard will be able to execute this strategy, but that is a story for another post.

    Like last year’s post about InstructureCon, I believe that the company growth chart ((The chart shows the number of clients, which is essentially the number of contracts signed with institutions, school districts, or statewide systems adopting either Canvas or Bridge LMS products.)) gives a lot more information than just “gosh, we’re doing well”. (more…)

  • State of the US Higher Education LMS Market: 2014 Edition

    I shared the most recent graphic summarizing the LMS market in November 2013, and thanks to new data sources it’s time for an update. As with all previous versions, the 2005 – 2009 data points are based on the Campus Computing Project, and therefore is based on US adoption from non-profit institutions. This set of longitudinal data provides an anchor for the summary.

    The primary data source for 2013 – 2014 is Edutechnica, which not only does a more direct measurement of a larger number of schools (viewing all schools in IPEDS database with more than 800 FTE enrollments), but it also allows scaling based on enrollment per institution. This means that the latter years now more accurately represent how many students use a particular LMS.

    A few items to note:

    • Despite the addition of the new data source and its inclusion of enrollment measures, the basic shape and story of the graphic have not changed. My confidence has gone up in the past few years, but the heuristics were not far off.
    • The 2013 inclusion of Anglosphere (US, UK, Canada, Australia) numbers caused more confusion and questions than clarity, so this version goes back to being US only.
    • The Desire2Learn branding has been changed to Brightspace by D2L.
    • The eCollege branding has been changed to Pearson LearningStudio.
    • There is a growing area of “Alternative Learning Platforms” that includes University of Phoenix, Coursera, edX and OpenEdX, 2U, Helix and Motivis (the newly commercialized learning platform from College for America).
    • While the data is more solid than 2012 and prior years, keep in mind that you should treat the graphic as telling a story of the market rather than being a chart of exact data.

    LMS_MarketShare_20141107

    Some observations of the new data taken from the post on Edutechnica from September:

    • Blackboard’s BbLearn and ANGEL continue to lose market share in US -[1] Using the 2013 to 2014 tables (> 2000 enrollments), BbLearn has dropped from 848 to 817 institutions and ANGEL has dropped from 162 to 123. Using the revised methodology, Blackboard market share for > 800 enrollments now stands at 33.5% of institutions and 43.5% of total enrollments.
    • Moodle, D2L, and Sakai have no changes in US – Using the 2013 to 2014 tables (> 2000 enrollments), D2L has added only 2 schools, Moodle none, and Sakai 2 schools.
    • Canvas is the fasted growing LMS and has overtaken D2L – Using the 2013 to 2014 tables (> 2000 enrollments), Canvas grew ~40% in one year (from 166 to 232 institutions). For the first time, Canvas appears to have have larger US market share than D2L (13.7% to 12.2% of total enrollments using table above).
  • Opening Up the LMS Walled Garden

    In yesterday’s post I described where I (and many others) see the LMS market heading in terms of interoperability.

    At the same time, the LMS does a very poor job at providing a lot of the learning technologies desired by faculty and students. There is no way that a monolithic LMS can keep up with the market – it cannot match functionality of open internet tools especially without adding feature bloat.

    I would add that part of the cause of the “false binary position” that D’Arcy points out is that much of the public commentary focuses on where the LMS has been rather than where it is going. There is a significant movement based on interoperability that is leading, perhaps painfully and slowly, to a world where the LMS can coexist with open educational tools, with even end users (faculty and students) eventually having the ability to select their tools that can share rosters and data with the institutional LMS.

    Coexistence and interoperability, however, should not imply merely having links from the LMS to external tools as is too often the case.

    The Walled Garden

    The LMS (which George Station rightly points out was really called the Course Management System in the early years) started out as a walled garden with basic functionality of syllabus sharing, announcements, gradebook, email, and a few other tools.

    walledgarden

    (more…)

  • LMS and Open: The false binary is based on past, not future markets

    D’Arcy Norman has an excellent blog post up titled “On the false binary of LMS vs. Open” that captures a false framing issue.

    We’re pushed into a false binary position – either you’re on the side of the evil LMS, working to destroy all that is beautiful and good, or you’re on the side of openness, love, and awesomeness. Choose. There is no possible way to teach (or learn) effectively in an LMS! It is EVIL and must be rooted out before it sinks its rotting tendrils into the unsuspecting students who are completely and utterly defenseless against its unnatural power!

    While D’Arcy is a proponent of open tools, he rightly calls out the need to understand institutional responsibilities.

    But. We can’t just abdicate the responsibility of the institution to provide the facilities that are needed to support the activities of the instructors and students. That doesn’t mean just “hey – there’s the internet. go to it.” It means providing ways for students to register in courses. For their enrolment to be automatically processed to provision access to resources (physical classrooms, online environments, libraries, etc…). For students’ grades and records to be automatically pushed back into the Registrar’s database so they can get credit for completing the course. For integration with library systems, to grant acccess to online reserve reading materials and other resources needed as part of the course.

    This is an important point, in that the institutional LMS is important and will not, and should not, go away anytime soon. I have pointed out recently that the LMS is one of the very few technologies now used in a majority of courses within an institution, and the institutional responsibility described above helping to explain why. (more…)

  • ITC Survey: Four trends to watch in LMS market for community colleges

    The Instructional Technology Council (ITC), an affiliated council of the American Association of Community Colleges (AACC), has conducted a distance education survey since 2004 focusing on online education trends among community colleges in the US and Canada. With this focus, the member colleges tend to be those with a stronger interest in online education programs and therefore are more progressive in technology usage than the general community college population. One part of the ITC survey is on general LMS usage at member schools, and this provides another source of data on the higher ed LMS market.

    The survey this year was based on 142 responses out of the 375 member institutions (39%), and there are a few caveats that should be noted:

    • Prior to 2012 the survey was emailed to all AACC colleges, but due to uneven responses the survey changed to just survey ITC colleges; and
    • “No answer” responses are not listed in percentages, thus totals will not always equal 100%.

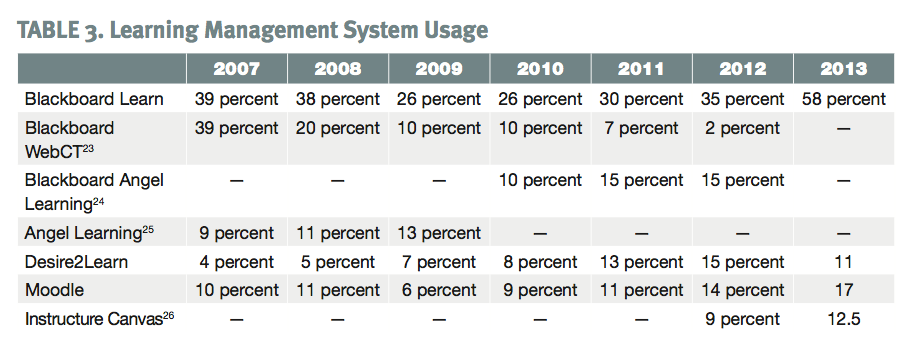
    Despite those caveats, “70 percent of the annual submissions have come from the same campuses during the nine years of the survey”, which means that it is worth exploring some broad trends for the LMS market for community colleges. Here is the data presented on LMS usage this year on page 15 (April 2014 report of Fall 2013 survey data):

    Table 3


    (more…)

  • The Resilient Higher Ed LMS: Canvas is the only fully-established recent market entry

    For a few years starting in 2009, it seemed one of the best ways to raise VC funds or corporate internal investment was to say “we can beat Blackboard with a new cloud-based platform”. Witness Coursekit / Lore, Instructure / Canvas, OpenClass, LoudCloud Systems, Helix, and even more recently MOOC platforms. There were many articles written as these new systems entered the market, but what if we look back and ask whether the LMS market has actually changed recently? The picture that emerges is one of surprising resiliency by the established LMS providers.

    In fact, I would argue that in the past eight years (at least in North America) the only new system that has fully established itself in the LMS market is Canvas. Note that I have combined WebCT and ANGEL within the Blackboard umbrella, but even these systems established themselves more than a decade ago.

    (more…)