Now that we’re past the 2017 WCET conference and headed to the EDUCAUSE conference, let’s look at updates on the institutional LMS market for North America (US and Canada). Last year we started our LMS market analysis service, where we are working with LISTedTECH to provide market data and visualizations, and our fall report for subscribers will be released in about a month. Data for 2017 presented below goes through October 1 of this year.
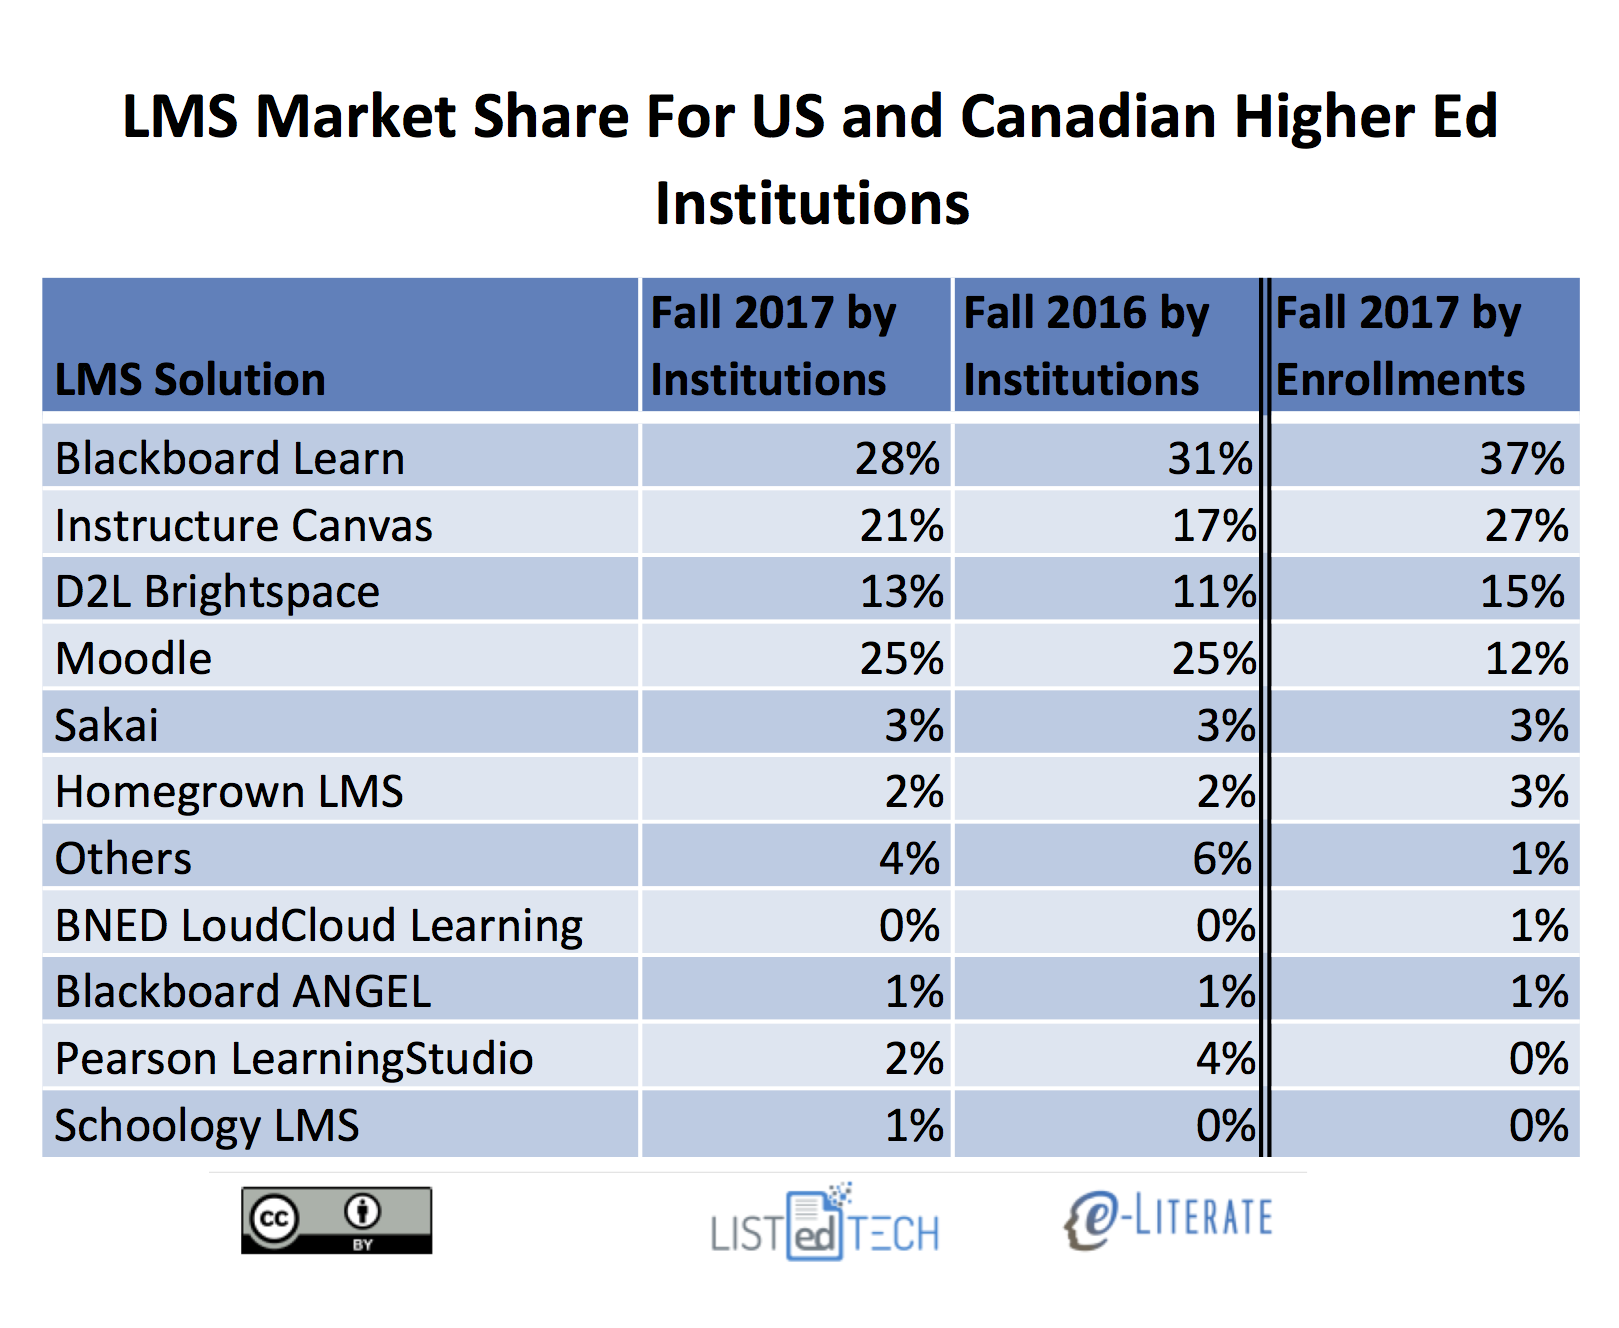
We present the data “by institutions”, with market share as a percentage of the total number of institutions using each LMS as a primary system, and “by enrollments”, where we scale the institutions by their total enrollment. The latter better captures the business of the LMS market, since most licensing deals are based the number of students. We have also included data from Fall 2016 by institutions for comparison purposes.
Some notes on the market share as defined by percentage of institutions:
In terms of new selections the market continues to be a two-horse race recently with Canvas by Instructure and Brightspace by D2L as the only two solutions with material gains in market share. Canvas grew from 17% to 21% , and Brightspace from 11% to 13%, of the market.
Outside of the big four – Blackboard Learn, Canvas, D2L Brightspace, and Moodle – no other system has more than 3% of the market measured either by percentage of institutions or percentage of enrollments. Furthermore, the category of “Others”, capturing systems not listed above and having less than 1% market share, actually dropped from 4% to 2% of the market. This indicates that continued market consolidation.
Schoology and BNED LoudCloud grew slightly, but not nearly to the degree of the Canvas and Brightspace.
Blackboard Learn fell the farthest, from 31% to 28% of of the market. The second biggest drop was Pearson LearningStudio, from 4% to 2%, based on its end-of-life notice for December 2017.
Moodle and Sakai both lost market share of just under 1%, not enough to show up in the rounded numbers in the table but enough to show up in our underlying data.
The difference in Moodle’s market share by institutions at 25% and by enrollments at 12% really shows how concentrated their usage is for smaller schools.
When viewing market share as defined by percentage of enrollments, Blackboard and Canvas are the most-used systems, at 37% and 27% of the market, followed by D2L at 15% and Moodle at 12%.
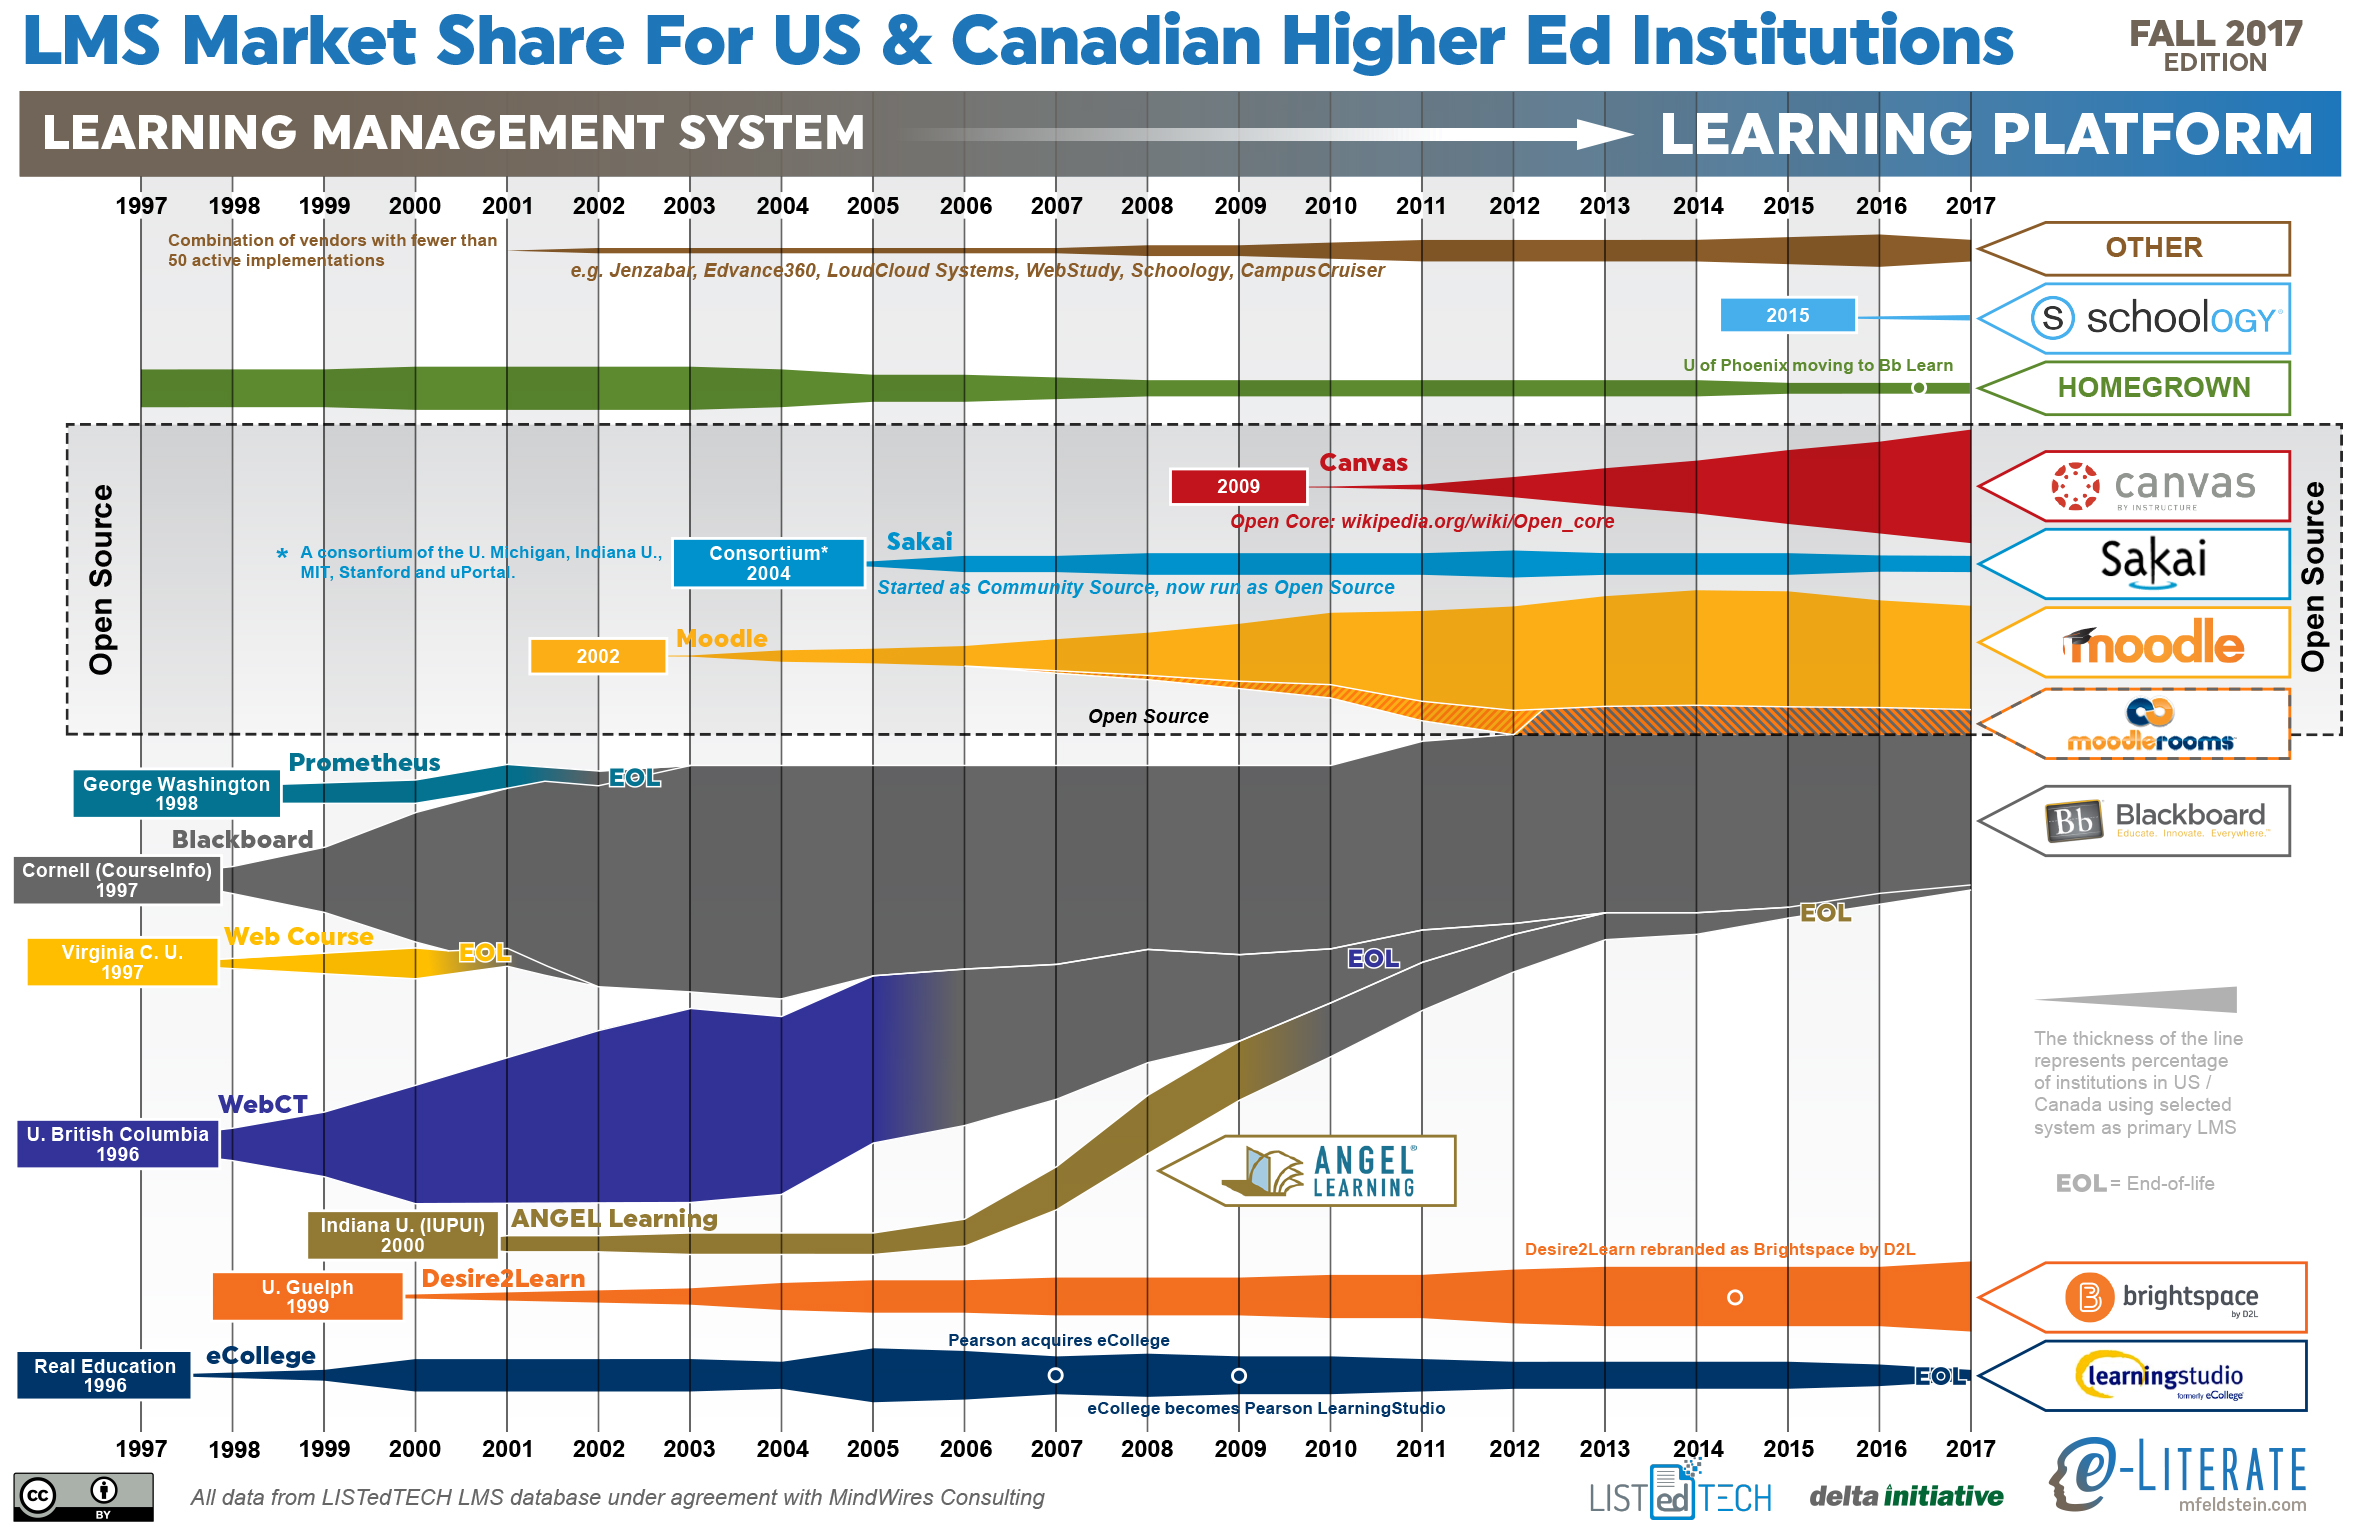
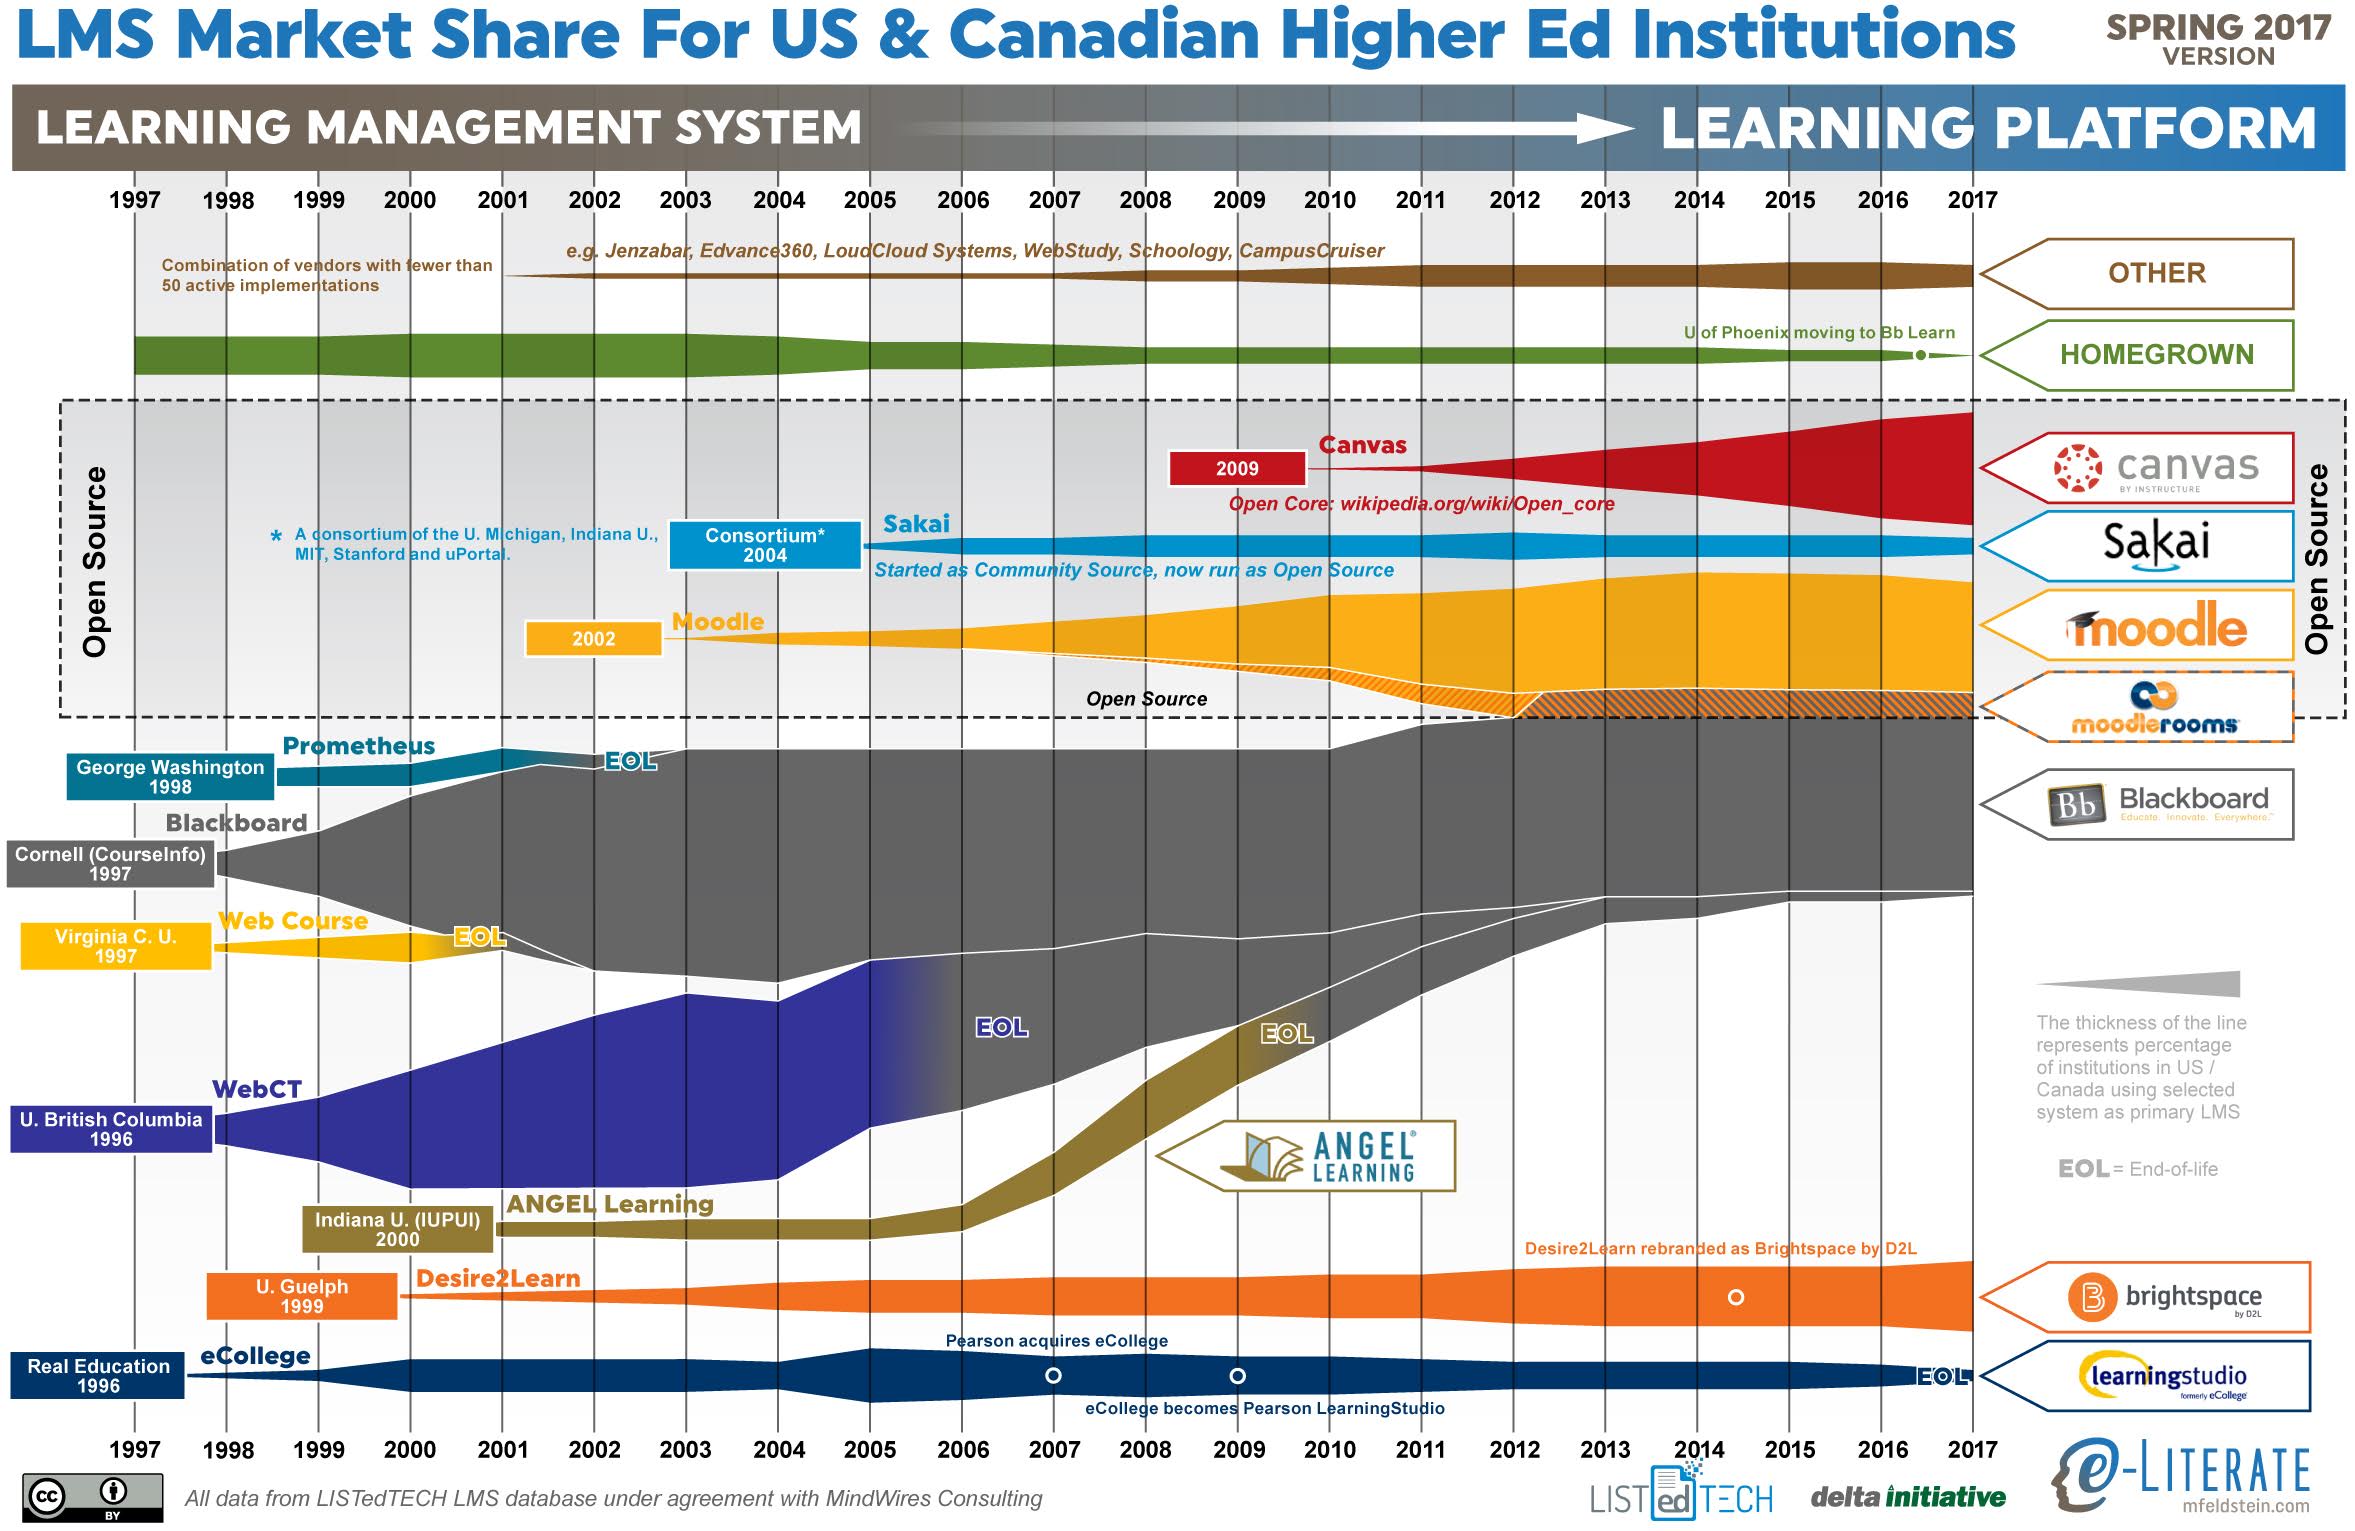
Stepping back from the immediate data, let’s look at an updated LMS market share graphic, commonly known as the squid graphic, for US and Canadian higher education. The original idea remains – to give a picture of the LMS market in one page, highlighting the story of the market over time. The key to the graphic is that the width of each band represents the percentage of institutions using a particular LMS as its primary system.
Some additional notes:
Blackboard and Moodle have been the market leaders as number one and two in share as they have been for the past decade. However, Canvas is quickly approaching Moodle’s market share.
We’ll share any updates we discover at the conference this week.
In one of the most significant LMS selection projects of the past few years, the University of Wisconsin System (UWS) has chosen to migrate from D2L’s Brightspace to Canvas as its centrally-supported Learning Management System (LMS). ((Disclosure: UWS, UW Madison, Instructure, and D2L are all subscribers to our market analysis service, and we aided UWS in the needs analysis portion of this project.)) UW Madison already moved to Canvas as part of its Unizin membership, but now the rest of the 180,000 student, 26 campus system will also make the change.
The decision was first noted on the UWS procurement portal and in a investor analysis note from Raymond James. A representative from UWS confirmed the news and added that “Canvas has been issued the Notice of Intent to Award and a final contract is going to the UW System Board of Regents for formal approval in October”.
The UWS project page describes the process leading up to the LMS selection, starting with needs analysis kickoff in 2015.
The Learning Environment Needs Analysis (LENA) project was undertaken as a continuation of a multi-year UW System effort to: 1) understand the current and future learning technology landscape, 2) uncover the wants and needs of UW System institutions with regard to academic technologies that support teaching and learning, and 3) identify gaps that exist in supporting teaching and learning through academic technology. The results of the LENA project were presented to the Learn@UW Executive Committee, along with a recommendation that the Committee charter the process for planning to move into a next generation learning environment for the UW System. The intention was that through this process, UW System would discover potential paths forward to support such an environment.
Last year UWS developed the request for proposal (RFP) requirements list, and the formal RFP was released in January of 2017.
Beyond the size of the system, UWS decision is significant due to it being the first major customer of Desire2Learn (as the company was known prior to 2014). Back in 2002 / 2003, most LMS decisions were framed as Blackboard vs. WebCT, and when UWS selected little-known D2L, it sent shock waves through the market. The decision really put D2L on the map as a true contender, and they followed up with wins at the University of Iowa ((Disclosure: In previous consulting company I advised U Iowa on their LMS selection.)), the Ohio State University, Minnesota State Colleges and Universities, and the University System of Georgia.
We have noted several times at e-Literate and as part of the e-Literate Big Picture: LMS market analysis service that D2L has an impressive record of client retention. The company has been a fierce competitor in keeping customers, as seen when the Colorado Community College System recently chose to remain on D2L Brightspace after their LMS selection process. ((Disclosure: CCCS is a subscriber to our market analysis service. I also advised CCCS when they originally chose D2L in 2008.)) This loss of UWS is the biggest setback for the company in terms of losing clients, and it is a major win for Instructure’s Canvas system.
Expect more market news to come out in the next month based on WCET and ECUCAUSE conferences.
Josh Kim wrote a post yesterday at Inside Higher Ed questioning some claims about the LMS market size.
The first result that comes up in Google is from Zion Market Research. Their estimate is that the global LMS market is valued at $5.19 billion in 2016, and expected to reach $19 billion by 2022.
According to Statista, the LMS market in 2016 was valued at $3.21 billion. CNBC claims that the learning management system market is worth $5.2 billion today, and will grow to $16 billion in four years.
Can these numbers be right?
Josh then did a quick analysis based on Instructure’s revenue and came up with much smaller numbers.
If we assume that the cost of Canvas is about average for LMS companies, we can get an estimate of the total market size by multiplying Instructure’s revenues by five. This gives us an estimate for the total size of the LMS market $555 million.
He extended this by 50% based on Instructure growth to give an estimate of $555 – $832 million, which is way below the big numbers claimed by Zion, MarketsandMarkets, and other market analysts.
The biggest difference here is that all of these analysts combine corporate learning markets with academic LMS usage, and corporate learning platforms account for somewhere between $2 – $4 billion, with best estimates (although outdated) coming from Bersin. This point has already been pointed out in the comments at IHE.
tl;dr – the ~$5 billion number is reasonable if you combine academic and corporate LMS markets.
There are two caveats, however.
First, the market growth claims are marketing fluff to generate interest in buying the reports, as companies love to show growth potential to investors. Anything close to $20 billion in a few years is ludicrous.
Second, as Michael commented on this approach based on a post I wrote criticizing MarketsandMarkets:
If anything, my Phil understates the case here. Lumping higher ed, K12, and corporate LMSs into the same category is a little bit like lumping railroad cars together with automobiles because they are both called cars, have wheels, and carry things and/or people from one place to another. On top of that, nobody has decent data on the size of the global market, never mind the growth of it. MarketsandMarkets’ “analysis” effectively gives us made-up numbers about a mythical automobile/train car market.
So a better question is what is the size of the global academic LMS markets, combining K-12 and postsecondary?
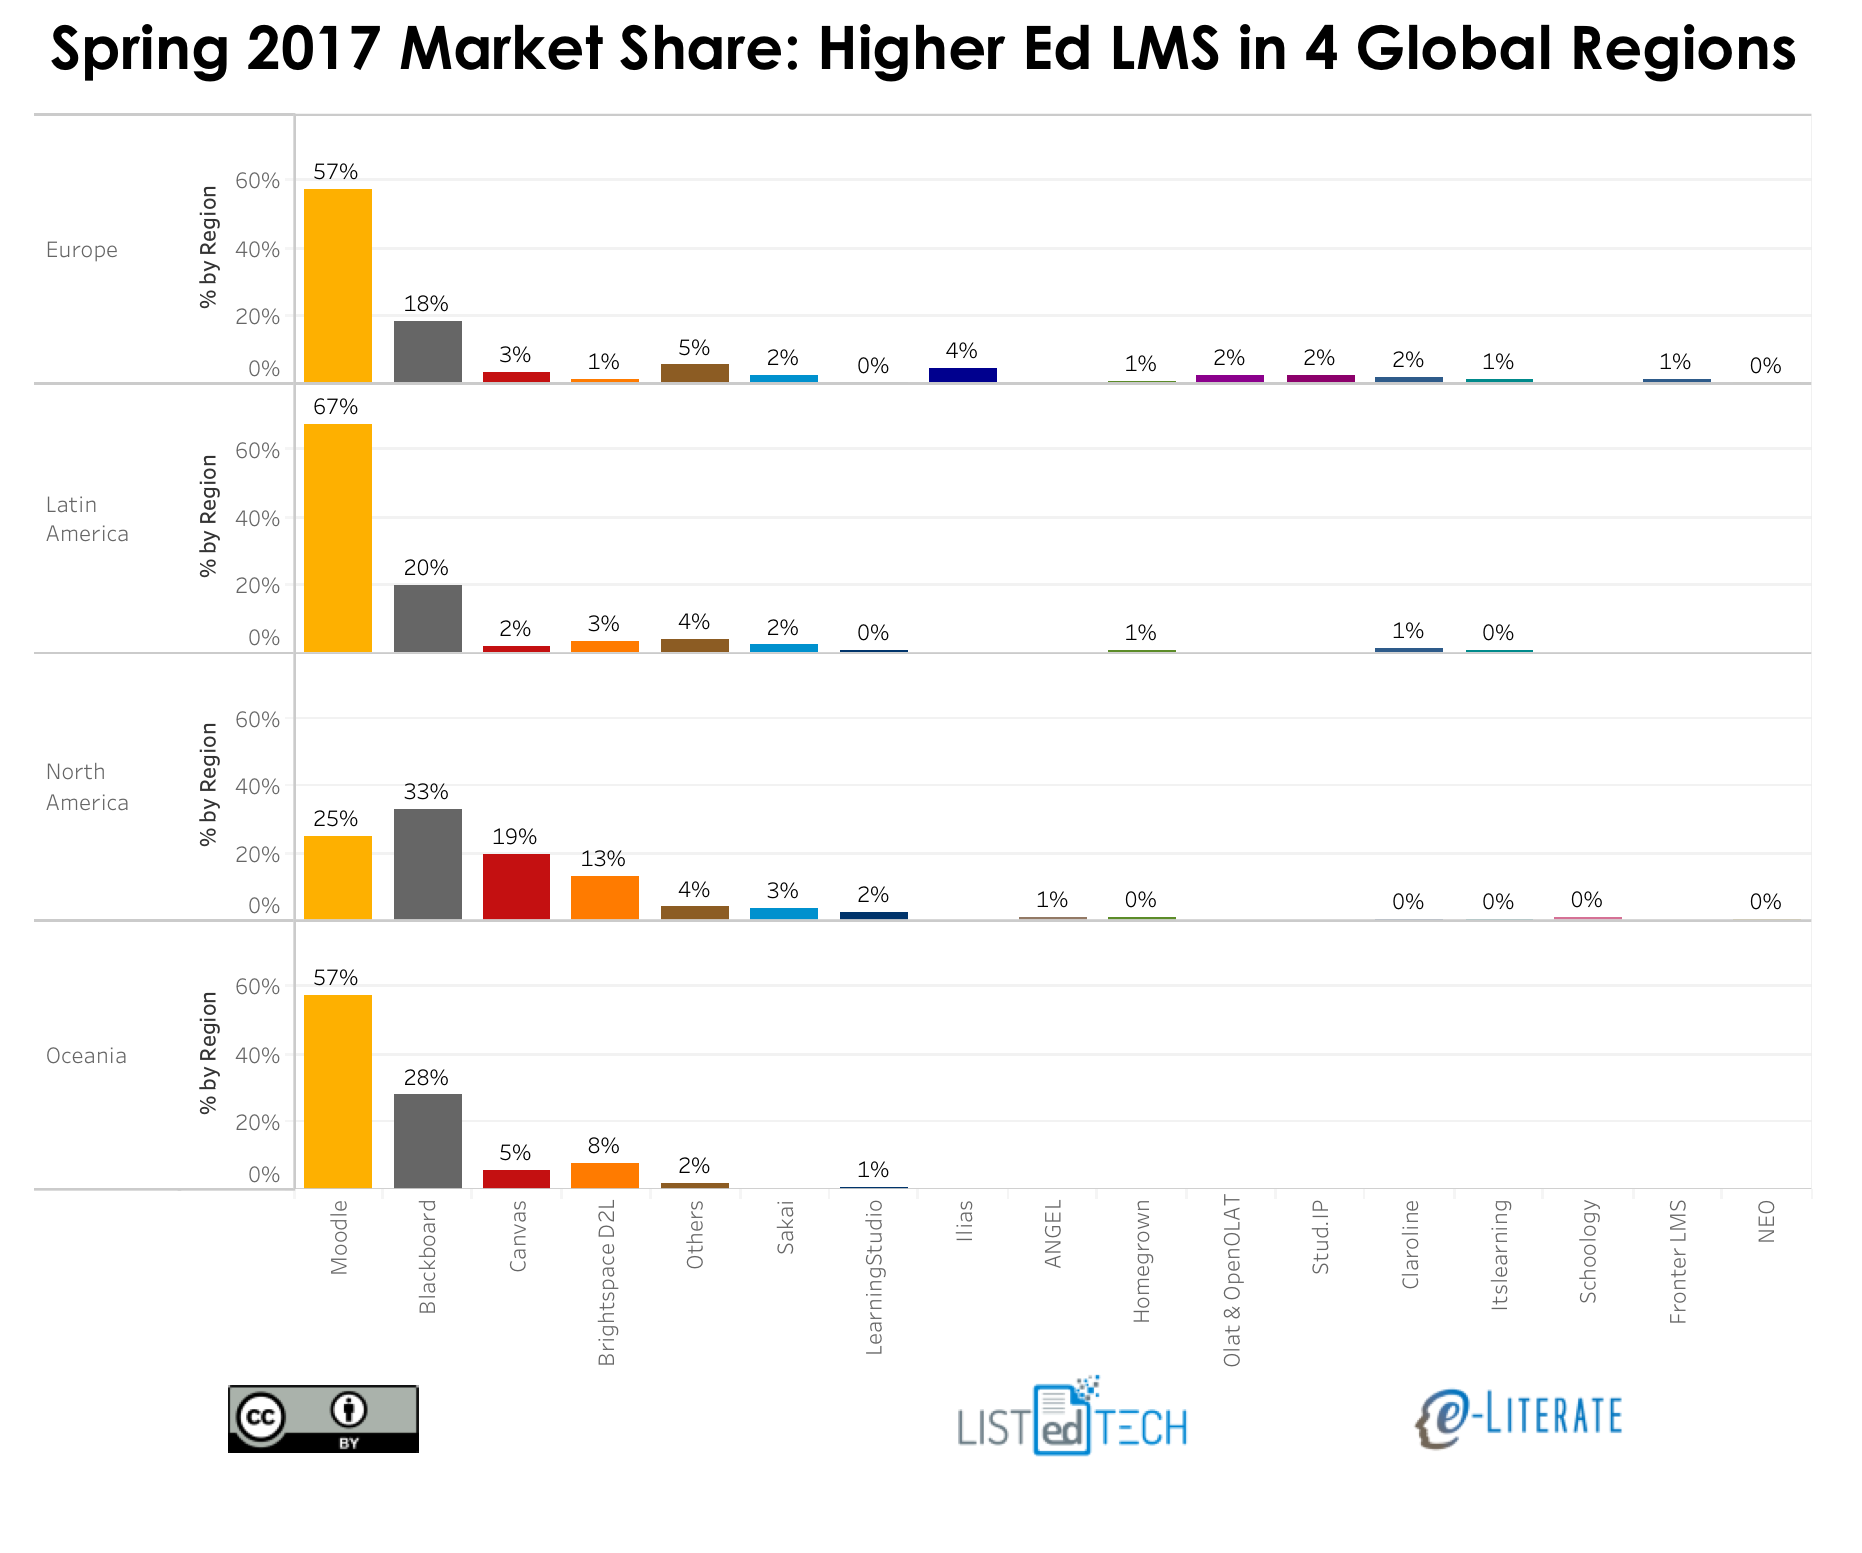
One issue from the IHE post is that Josh used our 20% market share as basis for extrapolating Instructure’s market share, but that number is only for North American higher education. Globally, Instructure’s market share is much smaller as shown in our recent analysis (data provided by our partners LISTedTECH).
Furthermore, while Canvas by Instructure and Schoology seem to be leading vendors for new adoptions in the K-12 market, at least in the US, no one has reasonable measures of market share in this area. Long and short – we need a different approach than extrapolation from Instructure alone.
LISTedTECH estimated the global LMS market just in higher education as $1.7 billion based on (# of students) * (average cost of LMS per student) = annual spending approach. In the US, the best estimates I’ve seen in that K-12 learning platform markets are worth 30 – 40% of higher ed market. This likely is smaller globally, as anecdotally there is not a big emphasis on LMS usage outside North American and Northern Europe. So one very rough estimate is that academic LMS market is worth approximately $2 billion per year.
If you want to use the company revenue method, then I would use additional data. Blackboard’s LMS revenue is likely $450 – $550 million per year based on reviews of corporate debt filings and extrapolation from their time as a public company. D2L’s revenue is smaller than Instructure’s, so let’s assume the two companies combined have $200 million revenue. Note that in all of these companies this is global revenue for K-12 and higher ed combined. The question is how to scale this $700 million combined revenue from all three companies. Is it reasonable that global spending for academic LMS could be 2 – 3x larger than this number? When you add in all of the Moodle hosting – both Moodle Partners and unofficial Moodle hosting – as well as Chinese market adoption, European providers, and K-12 players like Schoology and Powerschool/Haiku, this seems at least believable.
So my highly-researched, thoroughly-documented estimate of the global academic LMS market is $1.5 – 2.0 billion per year. And it is forecast to grow to $8.2134526 billion by June 3, 2022.
In our recent coverage of BbWorld and D2L Fusion, Michael and I came away impressed. Both companies are improving and doing so in ways showing them listening to customers, empathizing, and developing product enhancements with more engaging user experiences. Both companies are doing so by attempting to change their company cultures to support these behaviors. Their challenge, however, is that Instructure is already there – their company culture has supported simplicity, customer-centric empathy, and openness from day one. And what struck me (again) at this year’s InstructureCon was how well the company is managed and how consistent is their approach, over time and throughout the organization.
Instructure launched its Canvas LMS back in 2010, and it is remarkable how Michael’s description from June 2010 could still be applied today.
If I had to summarize Instructure’s strategy in one sentence, it would be “They use the lessons learned by consumer web companies to clear the clutter out of LMS software design and business model.” They’re not focusing particularly on open education or analytics or any other hot topics in online education, although they are aware of these and do pay some attention to them. Rather, they are looking at core use cases and trying to make them as simple as possible, throwing out some outdated LMS design assumptions in the process.
From the early days when they had dozens of employees to today, when they have over 1,100 employees, the strategy is the same and the company culture is the same. This despite the departure of both founders and the 2015 IPO and all the resultant pressure from investors.
This is Instructure’s secret. They continue to manage the company to support the strategy of clearing the clutter out of LMS software design and business models.
Product News
The biggest product news at InstructureCon this year:
Release of Gauge, an assessment management platform for K-12 usage, which might impact higher ed in the future
Redesigned Quiz engine and Gradebook, leading to what we saw as the biggest interest from conference attendees
Release of blueprint courses
Investment in back-end platform design (e.g. microservices) to increase speed of design improvements
Reintroduction of analytics – visualizations initially targeted at faculty usage
Introduction of Alexa integration
The focus on assessments, quizzes and grade books is both problematic and encouraging. Problematic for the industry as we spend too much time on measurements and grading and accountability and too little time on learning and continuous formative assessment. Yes, the quizzing engine can be used for formative assessment, but in most cases the usage is for summative assessment. But even with this viewpoint, it is encouraging that the primary focus of these product enhancements to Canvas is on reducing the time spent on the grading activities. It is a fact of life that an enormous amount of effort is spent by faculty, particularly in the US, on managing grades. It is good to see tools that directly reduce the pain in this area.
In a standing-room only session, Instructure’s Christi Wruck explained the initial phase of a multi-year effort to redesign and improve the grade book. Most features shown were of the nature of reducing the number of clicks or simplifying the navigation of grading activities. I won’t go into the minutiae here, but this session seemed to generate the most excitement at the conference.
The (re)introduction of analytics surprised me, as I had seen most public efforts in Canvas lately focusing on getting data out to let customers do their own analytics. The initial analytics in Canvas were introduced in 2012, and there were and are a few cool visualizations for faculty mostly, but there is little meat on the bones. There never seemed to be a real product strategy on the developing role of analytics within an LMS nor a full team to work on this challenge. In the meantime they rolled out Canvas Data, which we have talked to staff from several colleges and universities who are actively playing with and exploring the data. But this year Instructure described how they’ve been hiring a new analytics team and working on new visualizations. As with the previous effort, the initial focus is on helping faculty get a better view of how students are performing. We will have to watch this current focus on analytics to see if a real strategy develops.
Blueprint Courses is a overdue features set to allow course design templates or components across courses or shared between instructors. This capability finally provides direct support for centralized course design models involving master courses and multiple course shells as typically used in large online programs. While this capability could be considered late, conference attendees seemed to be quite impressed with the design of the new features.
Market News
I shared in my post on D2L’s Fusion conference how their Brightspace LMS has made impressive wins recently, particularly for schools with large online programs. Canvas continues to gain market share and lead all competitors in new implementations (schools choosing a new LMS), but over the past 12 months they’ve allowed D2L to at least become a clear competitor.
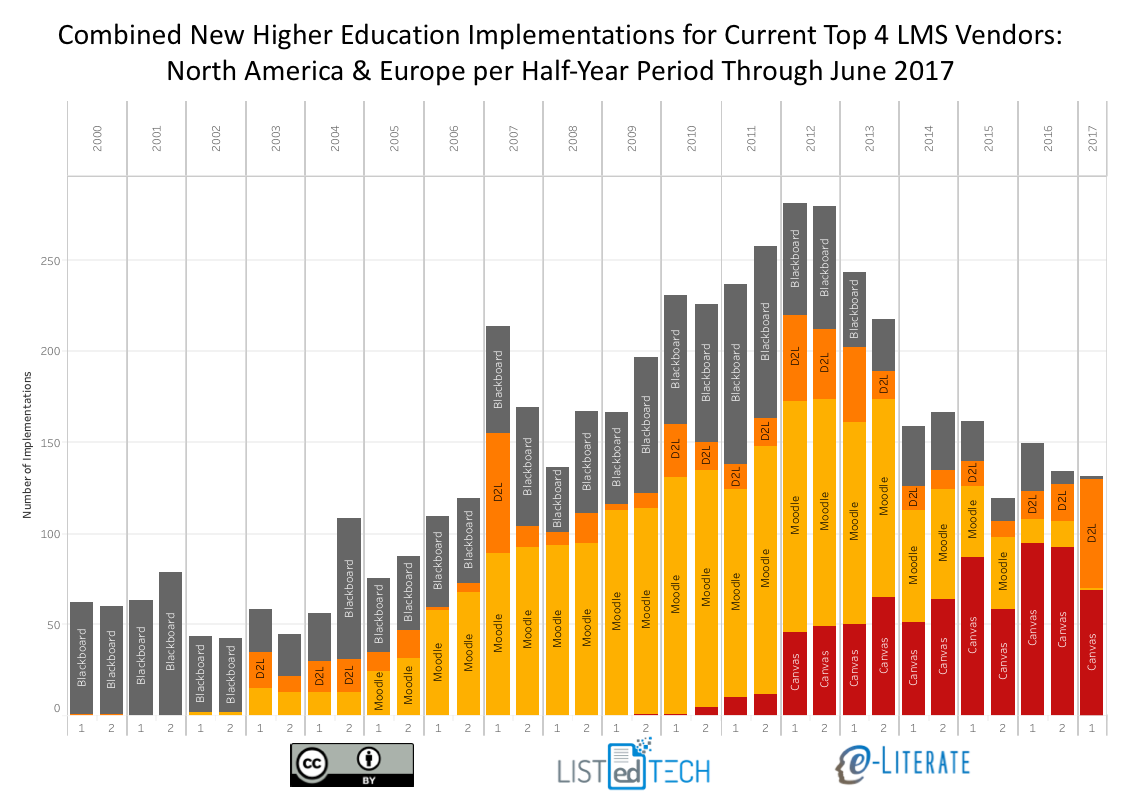
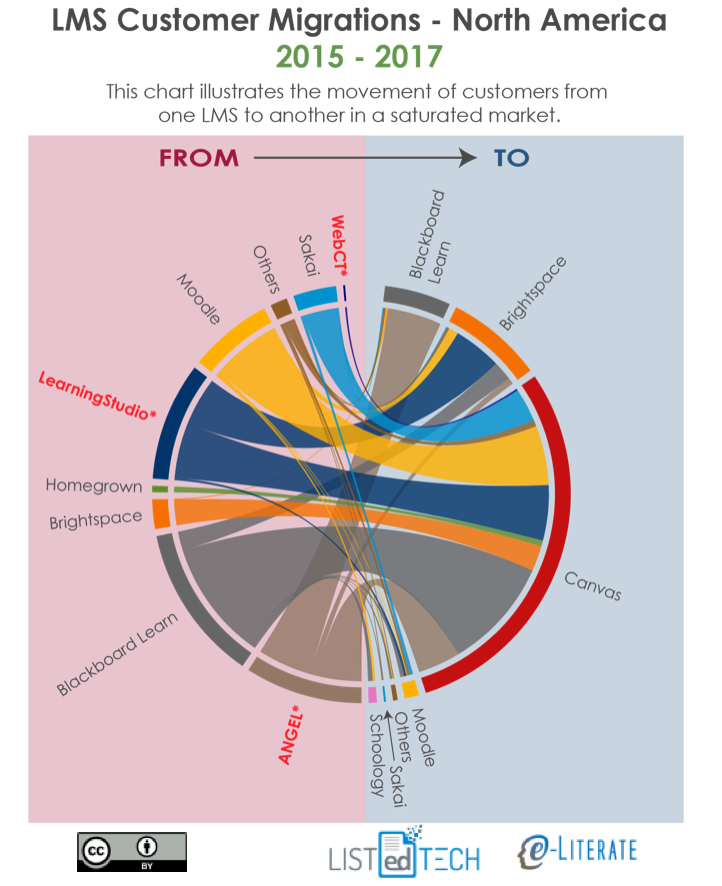
Michael also shared a view from the North American (US and Canada) market for higher education showing that most of Blackboard’s “wins” over the past few years have come from ANGEL end-of-life migrations. Looking at that same image, however, it becomes even more obvious just how well Canvas has performed for new implementations. It is not just that Canvas has the lion’s share of new implementations, it’s also the breadth of migrations coming from Blackboard Learn, Moodle, ANGEL, LearningStudio, Sakai, and even several from D2L Brightspace.
Instructure has recorded strong international grown in just the past two years, and this interest was evident at the conference. The most notable difference between the early users conferences and this year’s event was the expansion of the customer base. There must be similar numbers of K-12 attendees as there are higher education attendees, and we’re now seeing clients from Europe, Latin America, and Australia & New Zealand.
Just 2-3 years ago Canvas as an LMS brand was virtually unknown outside of the US and Canada, but now Canvas is winning more than any others in North America, Europe, Latin America, and Oceania.
Challenges
Instructure certainly has challenges to face. In terms of market share, it will be very interesting to look at data for the end of 2017 to see if D2L has maintained its momentum in new implementations. And being a publicly-traded company, investors care not just that Instructure is growing but also whether Instructure is growing fast enough in multiple markets. That’s a lot of pressure.
On the product front, Canvas was late to the game in terms of supporting mastery learning and associated competency-based education initiatives, although their introduction of MasteryPaths is showing some ability to catch up. Likewise, they certainly are behind their competitors in terms of learning analytics and associated research. And I would even say that they are late in supporting centralized course design models. In all three areas, there are initiatives introduced over the past 12 months to address these product needs. The challenge is for the company to catch up with competitors not necessarily in terms of full feature sets, but more in terms of supporting basic use cases and doing it well.
When I asked various Instructure management at the conference whom they saw as their greatest competitor, the most common answer was themselves. The company knows they have work to do, and there is a real sense of “we have to do better” that permeates the company. For Instructure’s competitors, the good news is that Canvas has weaknesses. The bad news is that the company knows it.
Back to Culture
But the real event of InstructureCon is not really based on product news or market share. As Michael noted last year:
Throughout the conference, I asked a number of attendees what percentage of their motivation for coming was to find out what the company was planning to develop in the next year. The range of answers averaged between 10% and 20%. They all told me that, while they were looking forward to the roadmap sessions later in the week, they didn’t expect any big surprises and weren’t all that focused on finding out what the developers had been doing. I have never been at an LMS conference where that was true, including Sakai conferences and Moodle Moots.
Consider the Instructure company profile at Glassdoor. Last year the company was rated #4 best place to work for all small and medium-sized businesses, and Josh Coates was rated #15 for all CEOs in the same category. But also look at the video that Instructure management chose to include in the “Why Work For Us?” section. Other companies tend to put up platitude-filled dreck that tells you very little about their company. But Instructure puts up a 7+ minute video where they talk primarily about company values. In the video, they talk about the behavior the company does and doesn’t want – and even nods that they’ll get rid of people who have have these behaviors – and they avoid all the pseudo-inspirational messages.
While Canvas is a market-changing platform, that is not really Instructure’s primary strength. Instructure as a company is the real strength.
This is the ninth year I have shared the LMS market share graphic, commonly known as the squid graphic, for US and Canadian higher education. The original idea remains – to give a picture of the LMS market in one page, highlighting the story of the market over time. The key to the graphic is that the width of each band represents the percentage of institutions using a particular LMS as its primary system.
Last year we made a big shift based on our LMS market analysis service – we are working with LISTedTECH to provide market data and visualizations. This data source provides historical and current measures of institutional adoptions, allowing new insights into how the market has worked and current trends. Our spring report for subscribers will be released this month. Data for 2017 goes through April 1 of this year.
We’re coming up on our one-year anniversary of the e-Literate Big Picture: LMS market analysis service and getting our Spring 2017 report ready. One of the things that I love about working with LISTedTECH as our partners for this service is that their data goes beyond a snapshot in time and well beyond the North American market. Not to mention their skills with visualization of data.
During a session today at the ASU/GSV Summit, Instructure CEO Josh Coates described how the company tests out new ideas – making bets and getting rapid feedback – and one example used was seeing if they could sell the Canvas LMS into a new country, Spain in this case. (more…)
Three and a half years ago Phil wrote a post “Snapshot of LMS Market for Large Online Programs in the US” giving a view into this growing segment of higher education. Large online enrollment institutions typically mean a centrally-coordinated provision of online courses, often with duplicate course sections, and these programs tend to use more of the LMS than ad hoc online courses or blended courses. Further, these programs are dynamic – they are far more likely to grow significantly or shrink significantly than face-to-face or blended programs. As such, this segment can have different usage patterns than the broader market. Thanks to the partnership between e-Literate and LISTedTECH for our LMS subscription service, we have a much richer data set now. One of our subscribers asked a question over the weekend about this subject, so it seemed time to update this view.
What we are showing below are the 50 institutions with the greatest number of students taking at least one online class based on the IPEDS database, for graduate and undergraduate combined. The most recent enrollment data set was for Fall 2014, so the enrollment data is slightly out of date. But the LMS listings should be up-to-date. In fact, we are showing some leading data, such as the University of Phoenix usage of Blackboard Learn and Kaplan University usage of D2L Brightspace – neither school has fully transitioned to the new LMS, but they have made official decisions and begun deployment. We have grouped the schools by sector, as well. (more…)