e-Literate

Present is Prologue

Tag: IPEDS

  • Flawed AEI Report on Online Education: The good, the bad, and the ugly

    Flawed AEI Report on Online Education: The good, the bad, and the ugly

    To paraphrase the intro paragraph from January’s post on the George Mason University report, another year month and another deeply flawed report about online education in US higher education, this time by Di Xu (assistant professor of educational policy and social context at the University of California
    Irvine and a visiting fellow at AEI) and Ying Xu (Ph.D. candidate at the School of Education at the University of California Irvine). The report is titled “The promises and limits of online higher education: Understanding how distance education affects access, cost, and quality”.
    AEI Report Cover

    While the supply and demand for online higher education is rapidly expanding, questions remain regarding its potential impact on increasing access, reducing costs, and improving student outcomes. Does online education enhance access to higher education among students who would not otherwise enroll in college? Can online courses create savings for students by reducing funding constraints on postsecondary institutions? Will technological innovations improve the quality of online education?

    This report finds that, to varying degrees, online education can benefit some student populations. However, important caveats and trade-offs remain.

    In many ways this report takes a similar approach to the GMU report and a prior one by Caroline Hoxby from Stanford University, which was subsequently withdrawn, in asking important questions but providing flawed analysis to support conclusions. The problems with the American Enterprise Institute (AEI) report lie in its description of the history of online education and the 50 percent rule, the usage of data to describe the “supply side” of online, and some misinterpretations of IPEDS data. The flaws are hard to overlook, which is a shame, in that much of the qualitative discussion on online education provides a nuanced set of answers to the questions posed above.

    The Good

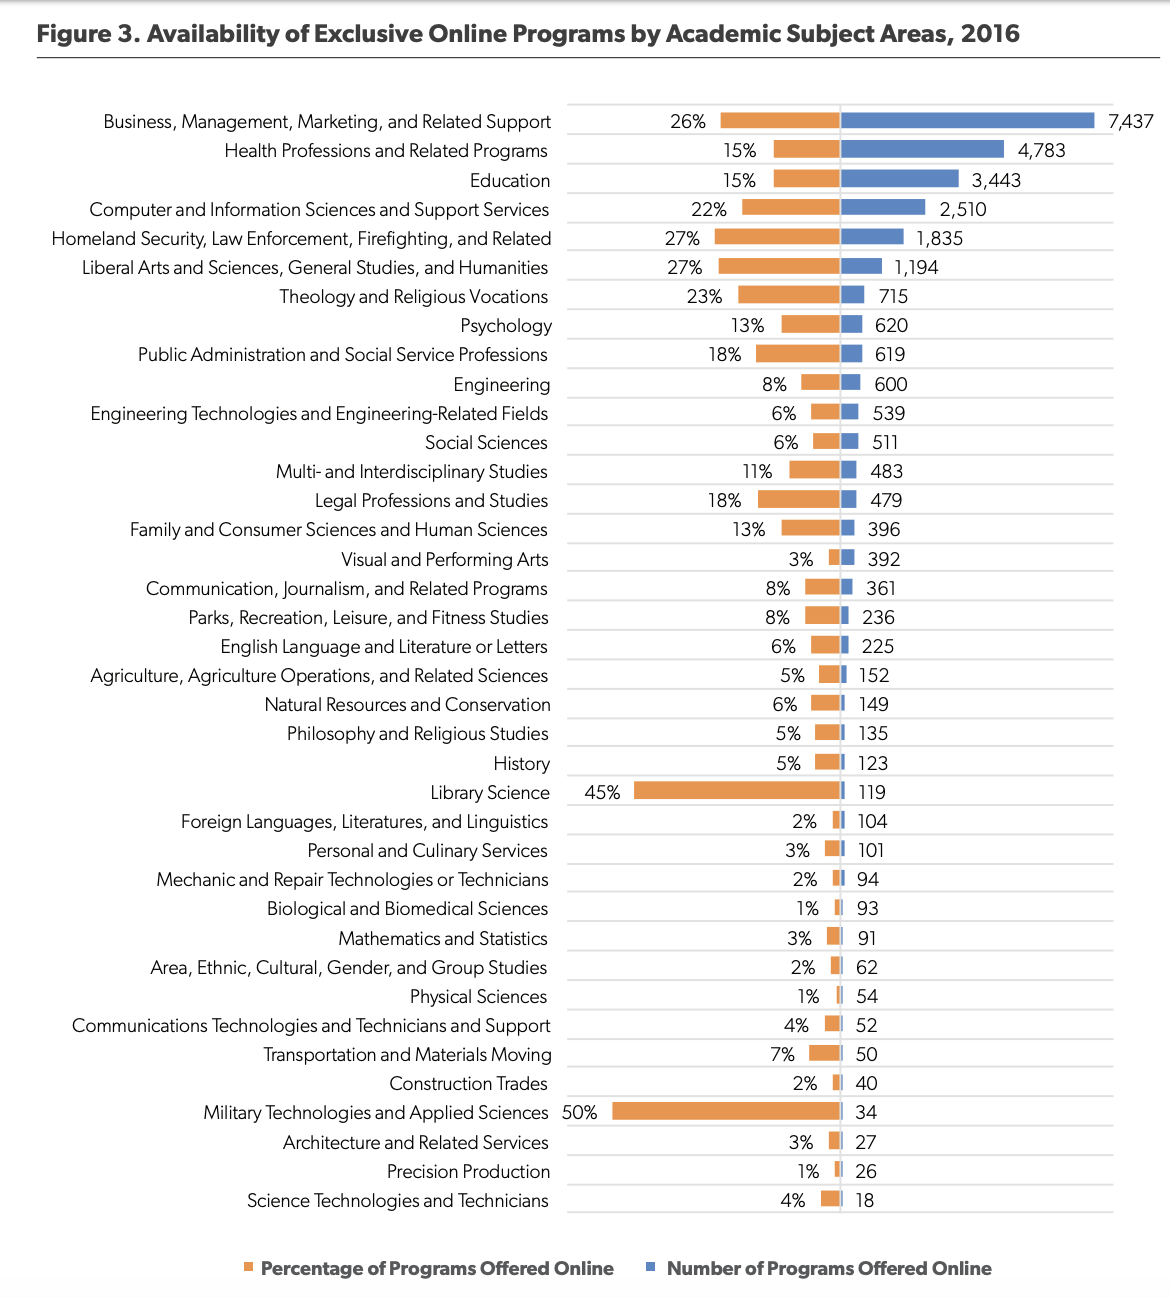
    The AEI report takes a look at a little-used portion of the IPEDS data set – The Completions survey and its program-level data on whether an institution offers certain programs at all and whether they are offered as a fully online (distance education) offering. This data has its flaws, which we’ll get to below, but it was quite interesting to get a summary view at the program level.
    program-level AEI summary of IPEDS data for online

    After a relatively solid discussion of research findings on Online Education and Student Outcomes, which summarizes positive and negative results along with the context and limitations of the relevant research, the report presents its discussion of known strategies to improve online education. This is a welcome relief, as many studies view online as a conclusion to be made about online vs. face-to-face, while this one summarizes known methods to continue improvements of a necessary modality.

    Based on the growing knowledge regarding the specific challenges of online learning and possible course design features that could better support students, several potential strategies have emerged to promote student learning in semester-long online courses. The teaching and learning literature has a much longer list of recommended instructional practices. However, research on improving online learning focuses on practices that are particularly relevant in virtual learning environments. These include strategic course offering, student counseling, interpersonal interaction, warning and monitoring, and the professional development of faculty.

    The Bad

    The introduction relies heavily on the “50 percent rule” and 1998 and 2006 changes to this rule as key points in the expansion of online education. This regulation did have an effect, but so did a number of other factors not mentioned in the report. To make matters worse, the wording of the rule conflates students and institutions. For example, in an email conversation with Russ Poulin from WCET, he noted how the following is inaccurate:

    Sim­ilarly, the HEA also denied access to certain types of federal financial aid and loans for students who took more than half their courses through distance courses.

    yet this statement is accurate:

    …the rule dictated that institutions that offered more than 50 percent of their courses through distance edu­cation or enrolled more than half of their students in distance education courses would not be eligible for federal student aid programs.

    The regulation applied to institutions and in no way measured this usage at the student level. I find that this article from New America does a much better job describing this regulation’s history and impact.

    Update 3/8: Poulin also noted (see comment below):

    After talking to you Phil, the oddity of the 50% discussion being front and center hit me even more. The lifting of the 50% rule had an impact on only a small number of institutions. Several for-profits and a small number of non-profit and public universities. The vast growth in distance learning has primarily been in institutions that get nowhere near the 50% mark, so the change in that rule was not a direct influence in their decision to enter the distance education market. To place it front and center seemed odd to me and not a real reflection of the motivations for most college leaders.

    The report also confuses institutional vs. student level data in looking at per-state online statistics.

    Finally, considering that state-level policies may shape online learning in unique ways, Figure 13 shows online enrollment by state in the 2016–17 school year. Unsurprisingly, the most populated states, such as California, Florida, and Texas, also had the largest number of online course takers. Once accounting for between-state differences in overall higher education enrollment, four states have the largest share of students who enrolled in at least one online course in 2016: Arizona (61 percent), Idaho (52 percent), New Hampshire (58 percent), and West Virginia
    57 percent).

    This might be nitpicking, but the IPEDS data referenced is for institutions located in each state, not students located in each state. But a report trying to make sense of a complex subject should get this information correct and not add to the confusion.

    The Ugly

    The worst aspects of the report can be seen in figure 1 and an attempt to summarize changes in the supply side of online education. The authors chose to define the supply side as number of institutions offering at least one online course or one online program, using the aforementioned Completions / program-level data.
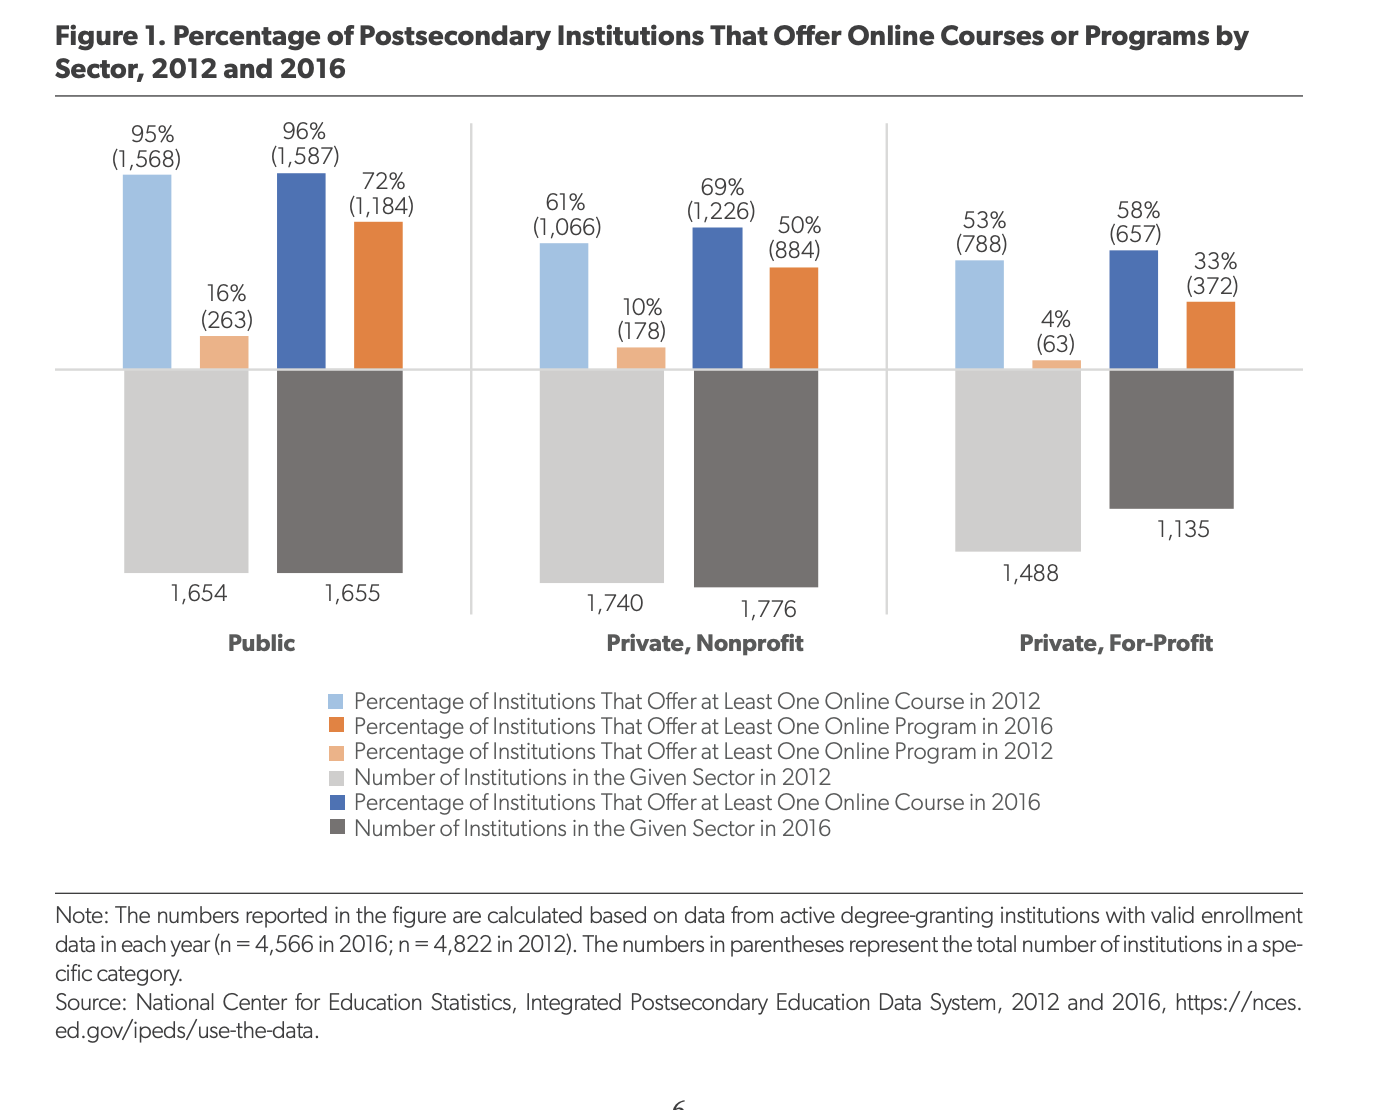
    AEI analysis of IPEDS dataI’ll wait while you take the necessary 5 minutes to decipher the worst color-legend usage in a chart that I’ve seen in years . . . Not yet? . . .

    When I shared this image on Twitter, Kevin Carey pointed out some results that seems non-sensical.

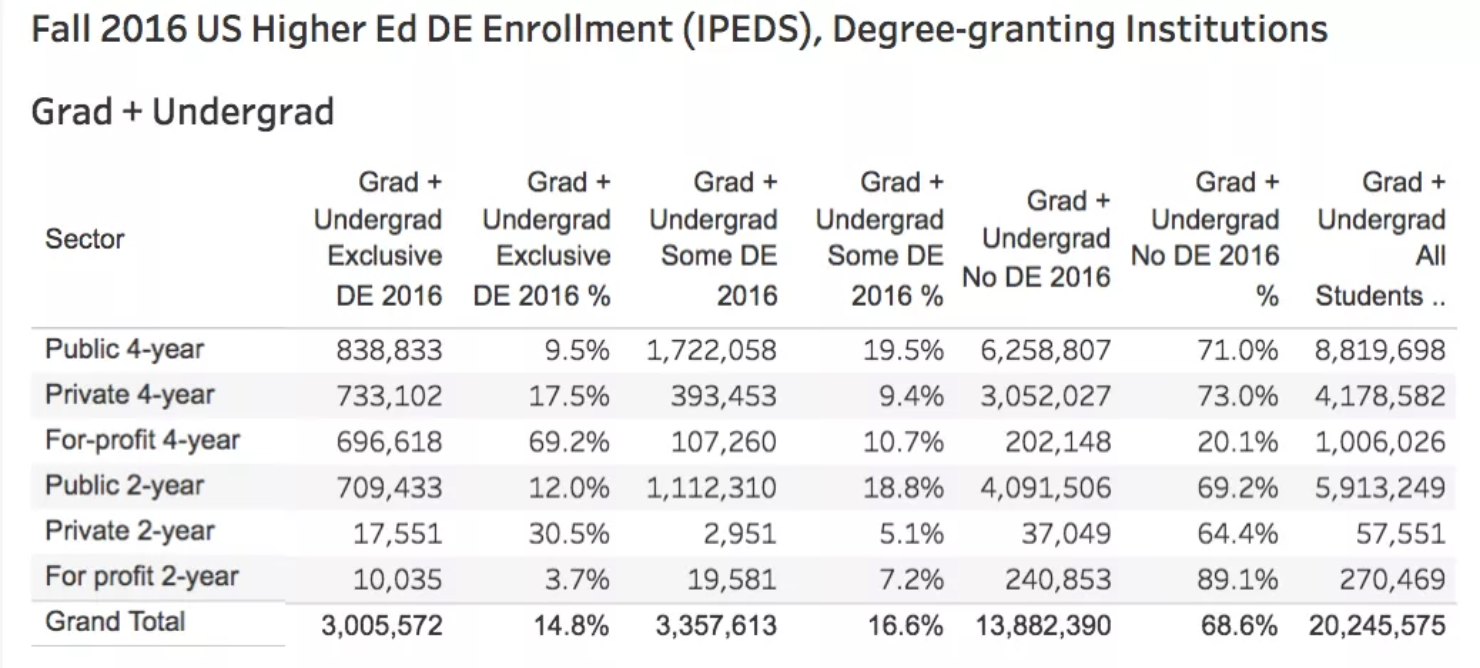
    The GMU report and the Stanford / Hoxby report made the more common mistake of essentially conflating online education with the for-profit sector, but this data makes little sense on the surface – implying that the for-profit sector offers relatively few online programs compared to public and private institutions. Looking at our 2016 IPEDS profile, you can see that 4-year for-profits by far have the greatest percentage of students in fully online programs (69%). How does AEI measure for-profits as much lower in offering fully-online programs?
    IPEDS 2016 data

    It took a while to figure out, but I think the authors made two mistakes. One is that they combined all for-profits together (2-year and 4-year), which is confusing since 2-year for-profits have the lowest usage of online education and a bunch of really small schools. This combination cuts the for-profit numbers dramatically. Look at the 2012 summary data below, where I show data for each sector and then combining 2-year and 4-year sectors together for public, private, and for-profit.

    The second issue is that simply measuring for-profits by institution using Completions program-level data is an unreliable approach to understanding online education supply, particularly for the for-profit sectors. Most for-profit systems own a number of smaller campuses, each with their own IPEDS code, yet the online programs are offered centrally by the system. And the Completions survey DE data has major holes in it. Consider South University (part of EDMC as of the 2012 data shown below):
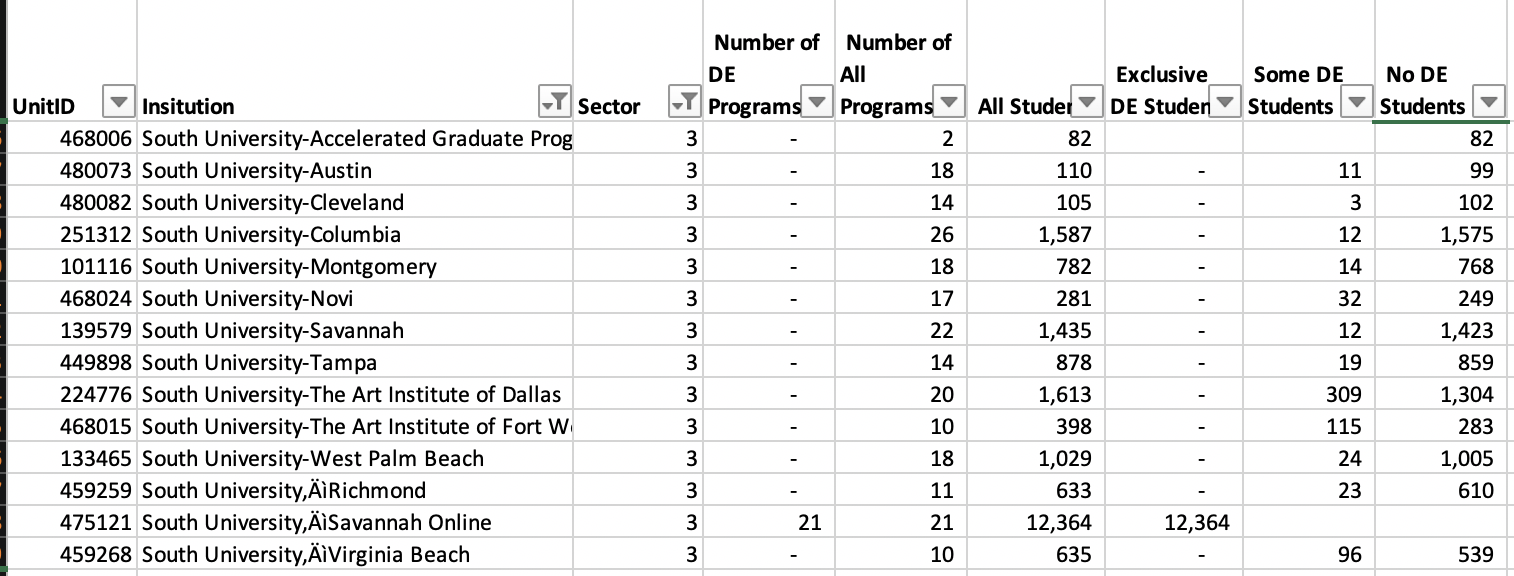
    All 21 online programs are offered through the online campus, with over 12,364 taking exclusively DE courses and 8,898 taking no DE courses. Using the AEI methodology, 13 of the 14 institutions have no online courses or programs – almost no supply of online education in their language.

    Also consider DeVry University, which does not list a centralized online campus yet has significant online presence. For whatever reason, they report the student enrollment data per campus, but they did not fill out the Completions program-level data at all. Zero supply of online education in AEI’s approach.
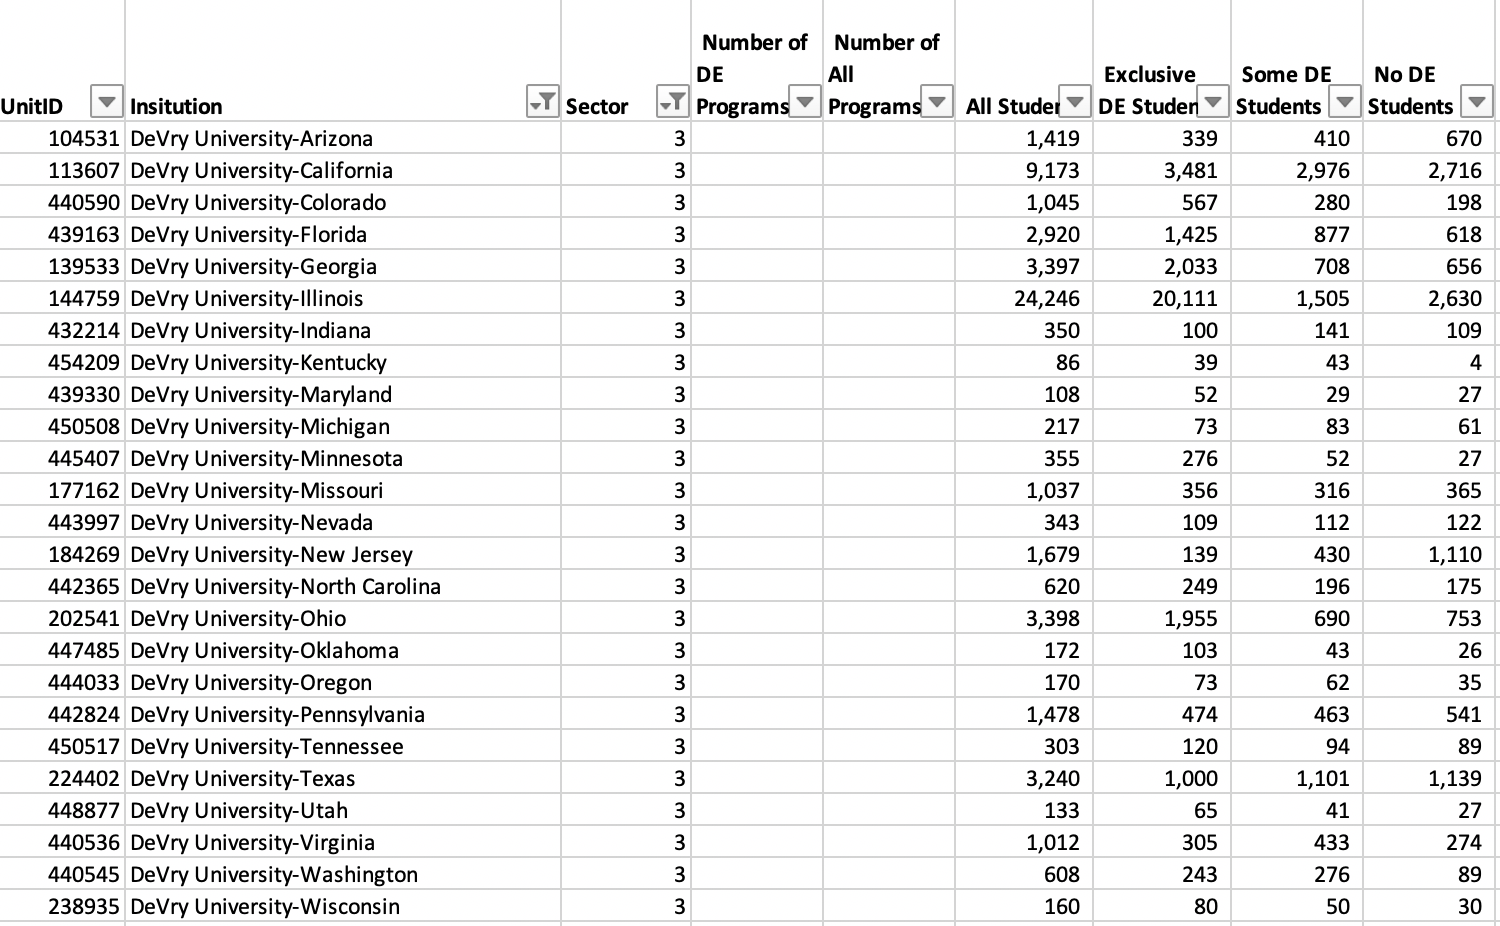
    My therapists jumped in at this point and convinced me to not fully duplicate the AEI findings (serenity now!!!). What’s important here is that the basis of AEI’s description of online education supply, using institutional metrics that are dubious and ignore how the for-profit sector works, is flawed and misleading. Technically they used data in IPEDS, but they misunderstood its usage and limitations.

    Yes, there are valuable parts of this report. But like the GMU and Stanford reports, the flaws in analysis make it very difficult to separate the good from the bad and the ugly. This type of report from well-funded organizations aimed at policy-makers should inform, not confuse, but yet again we are faced with some serious flaws. We need better.

  • Deeply Flawed GMU Report on Online Education Asks Good Questions But Provides Misguided Analysis

    Deeply Flawed GMU Report on Online Education Asks Good Questions But Provides Misguided Analysis

    Another year and another deeply flawed report about online education in US higher education, this time by Spiros Protopsaltis (associate professor and director of the Center for Education Policy and Evaluation at George Mason University, as well as former aide to Senate Democrats) and Sandy Baum (a fellow at the Urban Institute and professor emerita of economics at Skidmore College, as well as former advisor to Hillary Clinton’s presidential campaign). As Inside Higher Ed described the report, titled “Does Online Education Live Up to Its Promise? A Look at the Evidence and Implications for Federal Policy”:

    Online education has not lived up to its potential, according to a new report, which said fully online course work contributes to socioeconomic and racial achievement gaps while failing to be more affordable than traditional courses.

    The report aims to make a research-driven case discouraging federal policy makers from pulling back on consumer protections in the name of educational innovation.

    In many ways this report takes a similar approach to the report by Caroline Hoxby from Stanford University, which was subsequently withdrawn, in asking important questions but providing flawed analysis to support conclusions. But unlike the previous report, the GMU one documents its sources well with 165 end notes, and for the most part this new report describes the underlying analysis accurately. Where the major problems arise is in conflating online education in general with the for-profit sector and in drawing conclusions that are not supported by the evidence.

    The report is not easy to wade through, largely from its wide-ranging discussion of for-profits, online history, past federal policy, a snapshot of research on learning outcomes, and a discussion of current policy debates. Let’s take the primary conclusions and discuss the analysis provided.

    “Online education is the fastest-growing segment of higher education and its growth is overrepresented in the for-profit sector.”

    The report accurately describes the growth of online education, rising to point where one in three postsecondary students take at least one online course.

    Figure 1 online ed growth

    There is a disturbing tendency to describe this growth as “explosive” (mentioned five times in report) and an unexplained reliance in many cases on six year old data when new data exists. But the conclusion about growth is accurate.

    The phrasing “overrepresented in the for-profit sector” and “concentration in the for-profit sector” in describing online education is very misleading, however. It is true that for-profit schools have a larger percentage of their students studying fully online, but the topic of the report is online education in general, and for-profits represent a rapidly shrinking minority of this case. Never mentioned in the report is the most salient point about for-profits – the sector is in major decline. As documented by IPEDS:

    For-profit enrollment trends 2002-2016

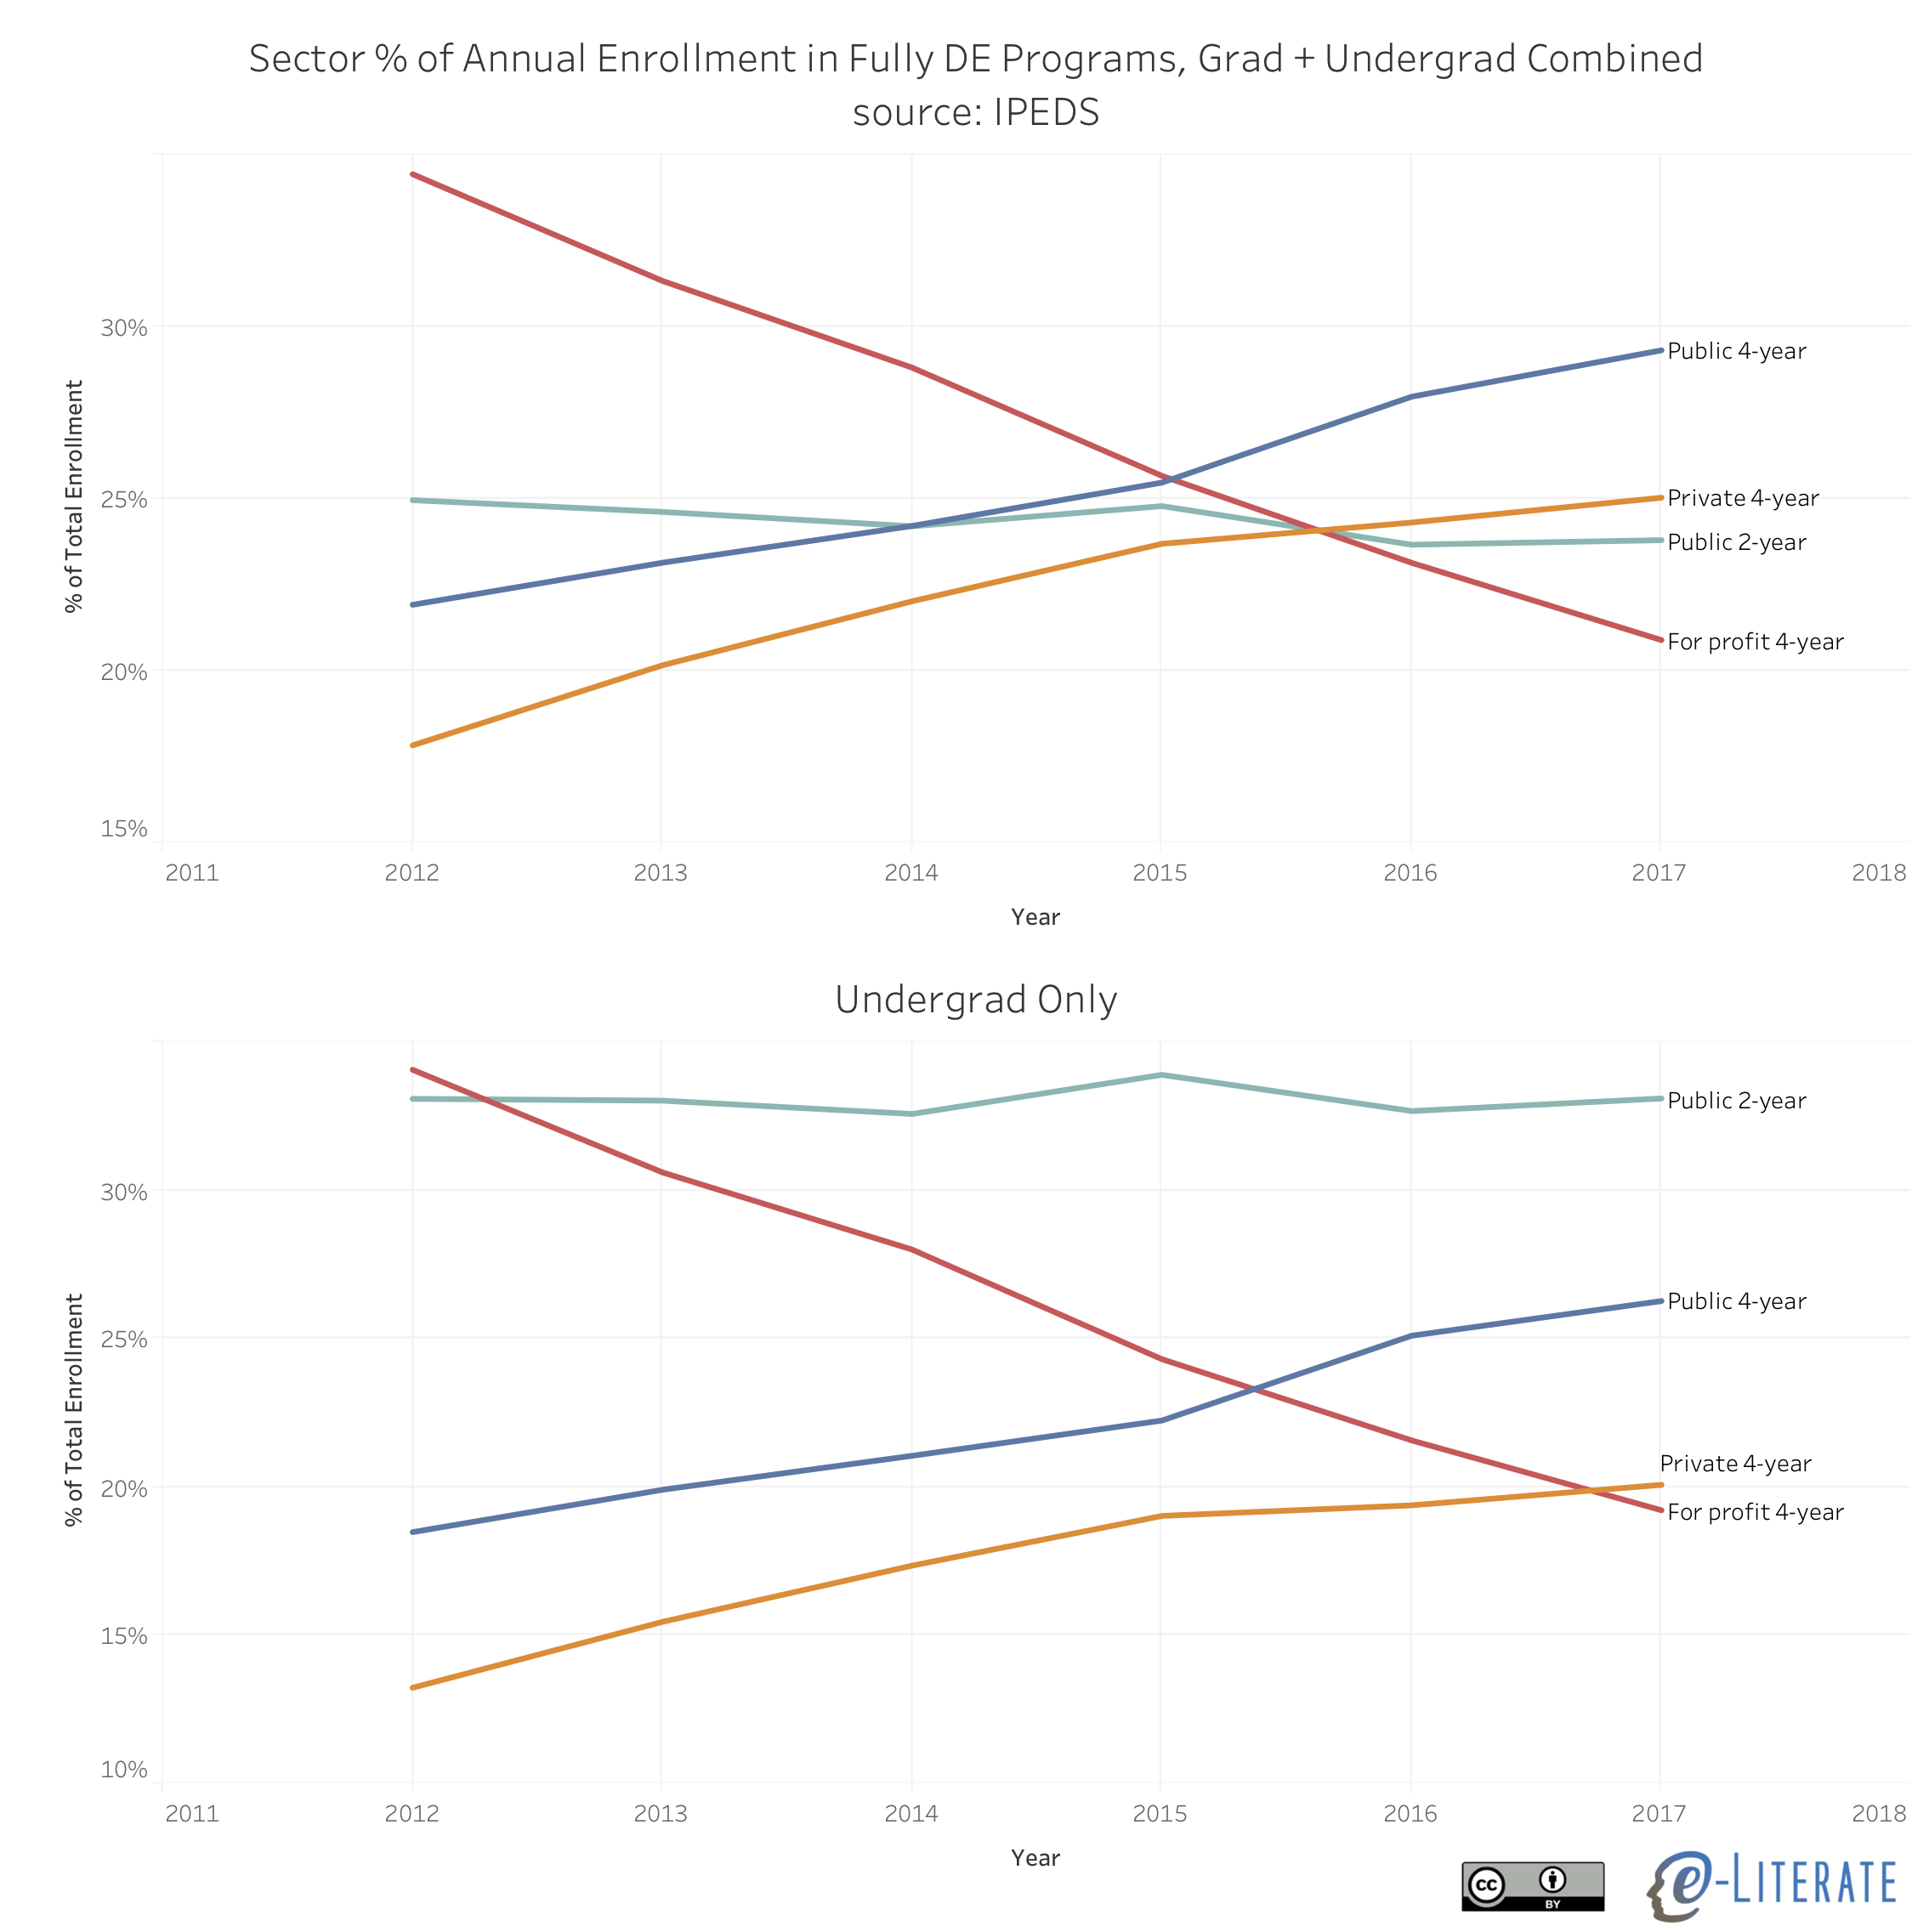
    This decline seems relevant, even if you then look at fully-online programs (e-Literate analysis of IPEDS data).

    Trends in online enrollment by sector

    Even in 2012, just two years after the for-profit peak, the for-profit sector accounted for less than 35% of fully online student enrollment, and as of Fall 2017 it was down to 21% with a clear trend. For-profits are rapidly becoming less and less relevant to the topic of online education, with no evidence to back up Protopsaltis claims that the for-profit sector is about to make a big comeback. It is high time that responsible analysts and scholars cease conflating online ed with for-profit schools, and the authors of this report should know better. If you want to study the for-profit sector, then describe it accurately and don’t extrapolate beyond what the data supports.

    “A wide range of audiences and stakeholders—including faculty and academic leaders, employers and the general public—are skeptical about the quality and value of online education, which they view as inferior to face-to-face education.”

    I find it strange to put this much emphasis on perceptions from an organization that purports to provide “timely, sound, evidence-based analysis”, but perceptions are somewhat important to understand. The body of the report describes a variety of research sources, but it is inaccurate to summarize that the wide range of stakeholders “view [online education] as inferior to face-to-face education.” Especially if you look at more recent data sources.

    Consider the 2018 Inside Higher Ed / Gallup survey of faculty (starting page 32), where they found that faculty with actual experience teaching online have surprising high confidence in the quality potential of online education. For those who have taught online, the percentage that agree or strongly agree that “for-credit online courses can achieve student learning outcomes that are at least equivalent to those of in-person courses in the following context”, 39% for any institution, 52% at my institution, 54% in my department or discipline, and 58% in courses that I teach. Put simply, a majority of faculty who have experience teaching online think results can be at least equivalent to in-person.

    Consider the 2019 Inside Higher Ed / Gallup survey of Chief Academic Officers, where fully 83% of them report plans to increase investment in online programs at their institution.

    Consider the 2018 Northeastern University Survey on the Use and Value of Educational Credentials in Hiring, where they found that “Online credentials are now mainstream, with a solid majority (61%) of HR leaders believing that credentials earned online are of generally equal quality to those completed in-person, up from lower percentages in years past.”

    Yes, perception issues are important. But the report’s conclusions are misleading and out of date.

    “Students in online education, and in particular underprepared and disadvantaged students, underperform and on average, experience poor outcomes. Gaps in educational attainment across socioeconomic groups are even larger in online than in traditional coursework.”

    This topic deserves its own report, and the GMU authors are right to point out that simply comparing online to face-to-face outcomes can obscure the important issue of underprepared and disadvantaged student experiences. On the surface, the conclusion about achievement gaps being “larger in online than in traditional coursework” is also accurate. But the more important question is not whether there is a problem, but rather how to minimize or reverse the achievement gap.

    The report references several studies from the California Community College system, mostly from years ago, describing how students “were less likely to complete online courses and when they completed them, less likely to pass them”. Yet the authors did not look at the trends within this system, as easily found in the most recent Distance Education report from the system, where the gap in performance overall for online versus tradition is closing rapidly.

    CCCS improvements in gap of online ed

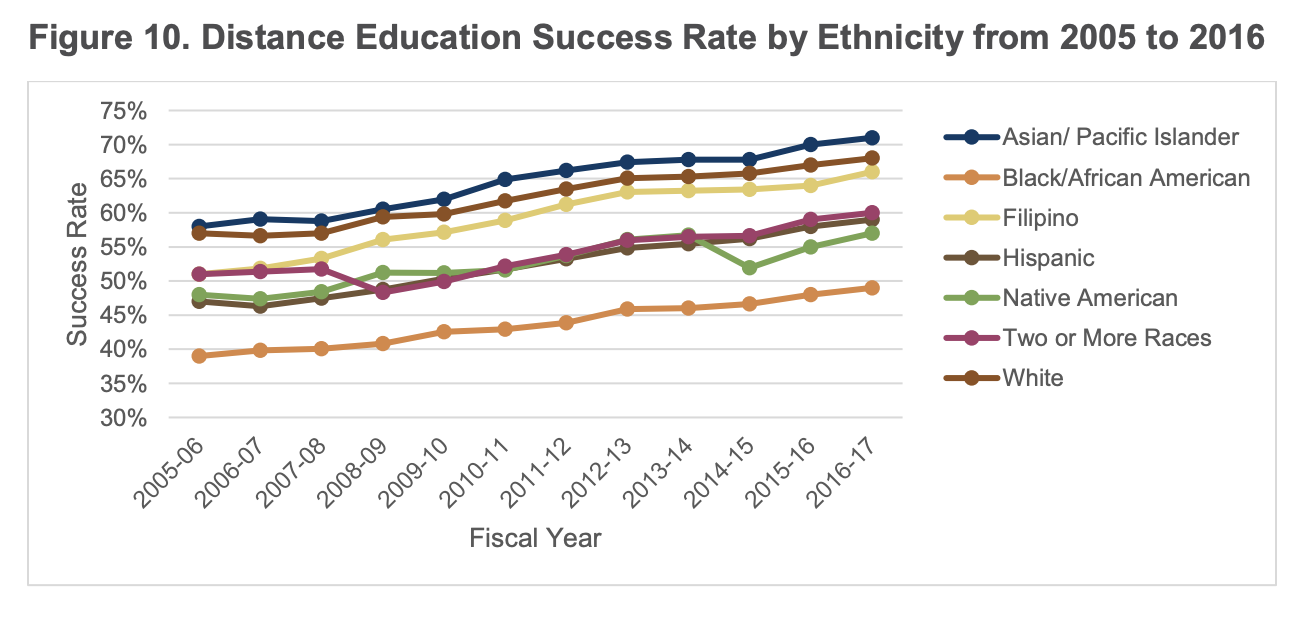
    More importantly, the achievement gains applied to all ethnic groups.

    CCCS Online performance by ethnicity

    It does appear that the performance gaps within online education are not closing by ethnicity despite the broad improvements. That is a real question to consider. Rather than viewing a simplistic view that online = bad results, we should focus on how to maintain current improvements while figuring out how to do even better in providing equal opportunity.

    “Online education has failed to improve affordability, frequently costs more, and does not produce a positive return on investment.”

    This conclusion is largely based on the NBER Hoxby report that was subsequently withdrawn, and for which I provided a detailed critique. I was not able to get a response from the report author. Beyond a gross mischaracterization of the source data, the Hoxby report made a fundamental flaw in its ROI analysis.

    This view of online education – students choosing between non-selective face-to-face institutions or online institutions – takes a zero-sum approach, as if you have the same student population just choosing between institution types. This view ignores the large and growing number of working adults who can only attend college – often in degree-completion programs or masters level programs – because of an online option. Their real choice should be seen as online institution or not at all.

    The GMU report relies on the withdrawn Hoxby report and does not even describe that it was withdrawn.

    There is an excellent point made that pricing for students has largely not been lower for online education, but there are specific examples (UF Online, SNHU, WGU, to name a few) where they specifically provide much lower-priced offerings to students than comparable face-to-face programs. It would be interesting to study enrollment trends and student outcomes for lower-priced online programs compared to comparably-priced programs.

    “Regular and substantive student-instructor interactivity is a key determinant of quality in online education; it leads to improved student satisfaction, learning, and outcomes.”

    “Online students desire greater student-instructor interaction and the online education community is also calling for a stronger focus on such interactivity to address a widely recognized shortcoming of current online offerings.”

    These last two points get to the primary purpose of the GMU report – current federal policy making efforts that include a re-evaluation of the Regular and Substantive Interaction (RSI) requirement for programs to be classified as online education and no correspondence courses.

    The GMU report describes a large body of work documenting the importance of interaction to online student success, and the report accurately describes how “the online education community has also emphasized recently the importance of student-instructor interaction for ensuring quality.” This point is crucial – the vast majority of educators working in online education understand and accept the importance of interaction; there is not significant disagreement on the subject.

    What the GMU report gets wrong is conflating actual quality interaction within courses with federal regulations. Much of the basis of the GMU analysis is a series of Office of Inspector General (OIG) reports calling out weak implementation of the RSI regulations. In the biggest case – a report on Western Governors University (WGU) and its competency-based model – this conflation is unwarranted, as I described in a detailed analysis of that action. There were two particular problems with the OIG findings in my view – the first is that the OIG defined their own terms due to the ambiguous nature of the RSI regulation.

    The OIG used a binary role-based approach (you are an instructor or you are not) leading to conclusion that only course mentors and evaluators could be considered as instructors, however. The basis of this determination was an instructor must “provide instruction on course content” – clearly a content-dissemination view that rejects alternative pedagogies. And this interpretation that the OIG treats as unambiguous is not based on law, regulations, or commonly-accepted educational terminology. [snip]

    This is why I call the audit methodology as hyper-literal. Somehow the OIG thinks they can determine – without any disagreement or ambiguity – the “ordinary meaning of those terms” based on their own interpretations.

    The second problem was that the OIG did not evaluate the actual courses or even address the issue of course quality.

    Also note that the determination was entirely based on course design materials – think syllabus and course outlines. The OIG did not look at interactions arising during the course of actual course work, just whether there were pre-defined webinars, meetings, and student-instructor interactions. [snip]

    These views essentially reject not just WGU’s approach to CBE but also the broader movement of faculty from “sage on the stage to guide on the side”. Instructors, from the OIG view, must provide instruction on course content and interactions must be pre-planned in the course design materials, at least for online courses.

    The OIG did not look at student outcomes, applied its own hyper-literal translation of an ambiguous regulation, and did not look at the course interactions themselves – just whether pre-planned course materials described future course interactions. Note, however, that despite the weakness of the OIG report, this does not mean that WGU is off the hook. Likewise, this report’s over-reliance on the OIG reports mistakes regulation for actual interaction quality, but that does not mean that there is not an issue where many or most online courses could improve faculty-student interaction.

    It is broadly understood that the RSI regulation is important but flawed. I agree with the GMU report that a simple elimination of the regulation would be a mistake. But it is overly simplistic and completely subjective for the GMU report to conclude that “unbundled faculty models that have difficulty complying should make changes to match the law instead of changing the law to match the needs of such models.” That is a policy position and not based on “timely, sound, evidence-based analysis”.

    In Conclusion

    This last point gets to the danger of this GMU report. It is a subjective set of policy recommendations disguised as extensively-documented evidence-based research. There is value in the questions asked, in much of the research documented in the footnotes, and in the clear policy position presented on regular and substantive interaction. But there is more harm than good from the report due to the mischaracterizations, selective data usage, and flawed analysis provided. Read it as a policy paper and not a research report.

    Paul Fain from Inside Higher Ed provided a valuable, pithy summary at the end of his article on the report.

    The report’s co-authors and its critics agreed that further research is needed on the rapidly evolving field of online education, particularly as more high-quality colleges and universities ramp up their online offerings.

  • Fall 2017 IPEDS Data: New Profile of US Higher Ed Online Education

    Fall 2017 IPEDS Data: New Profile of US Higher Ed Online Education

    Update 19 Dec 2018: Images and interactive chart have been updated to fix mistake with sector of multiple institutions. Overall totals have not changed but allocations for each sector have. Thanks to reader Drew Bagley for discovering issue and even looking at data to point me in direction of fix. Post publish date has been updated accordingly.

    The National Center for Educational Statistics (NCES) and its Integrated Postsecondary Education Data System (IPEDS) provide the most official data on colleges and universities in the United States. I have been analyzing and sharing the data since the inaugural Fall 2012 dataset.

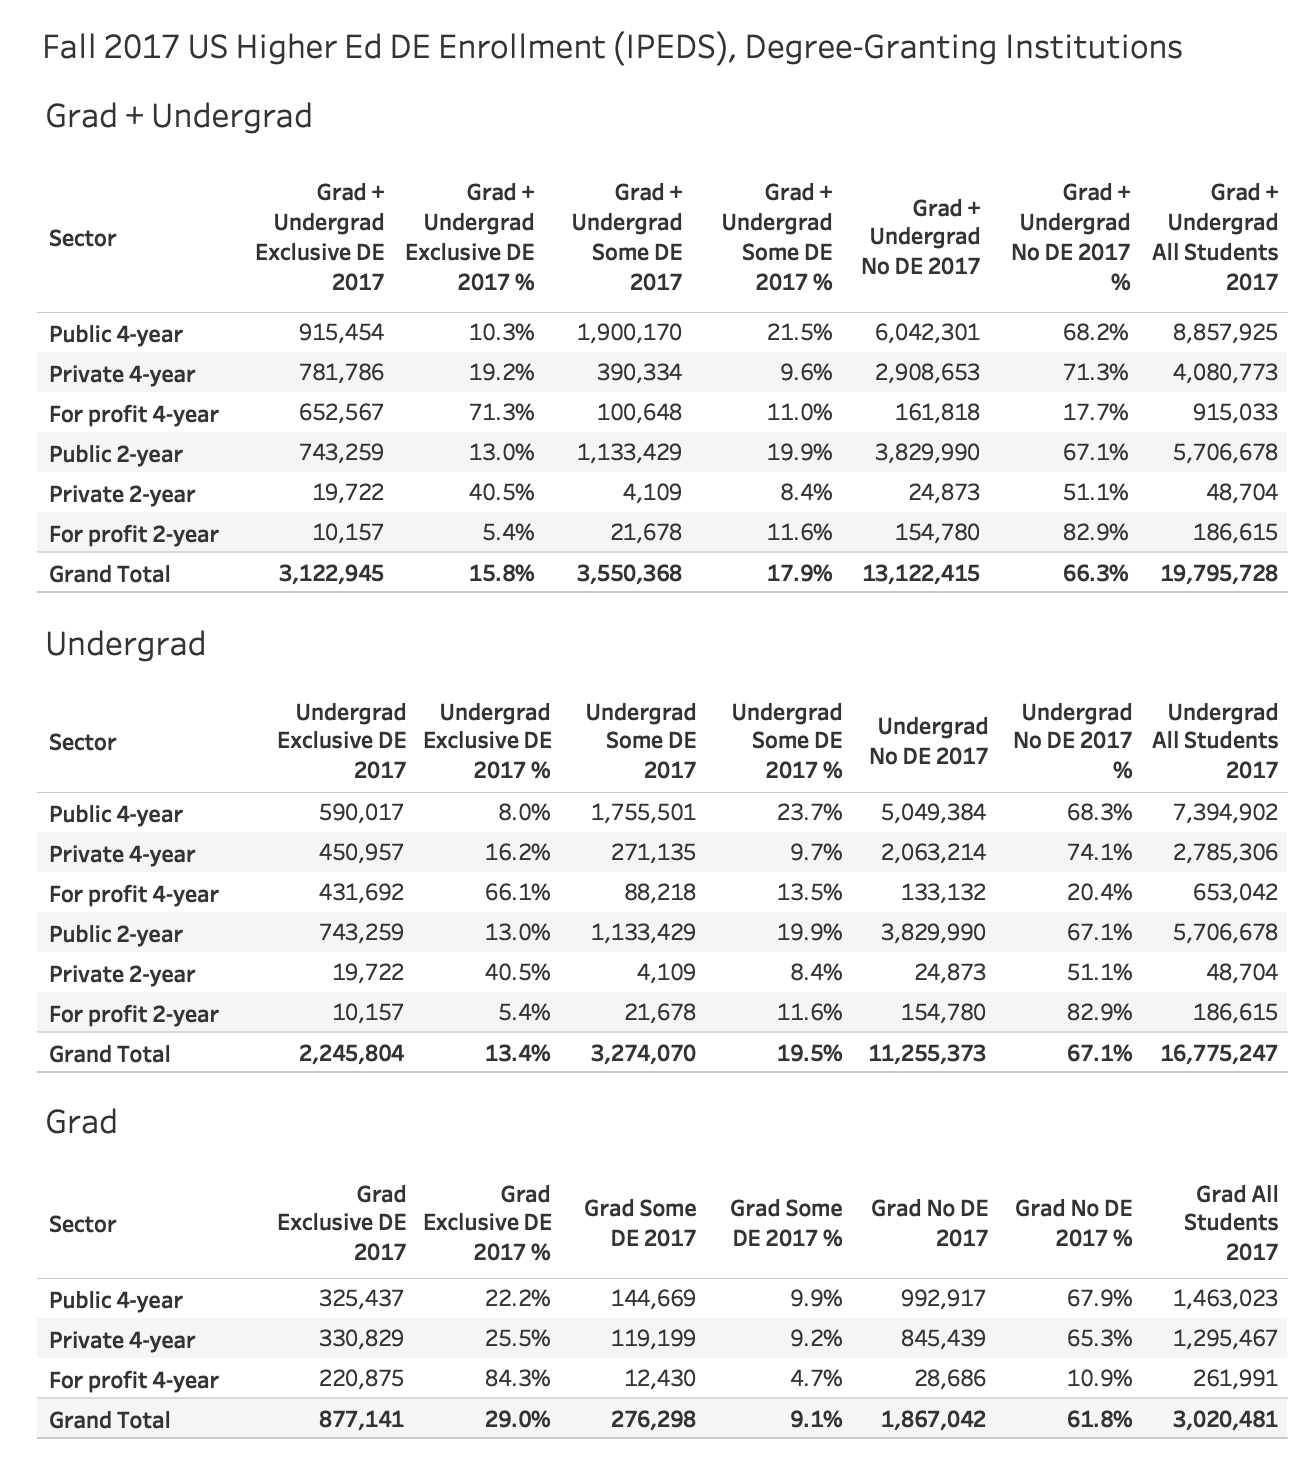
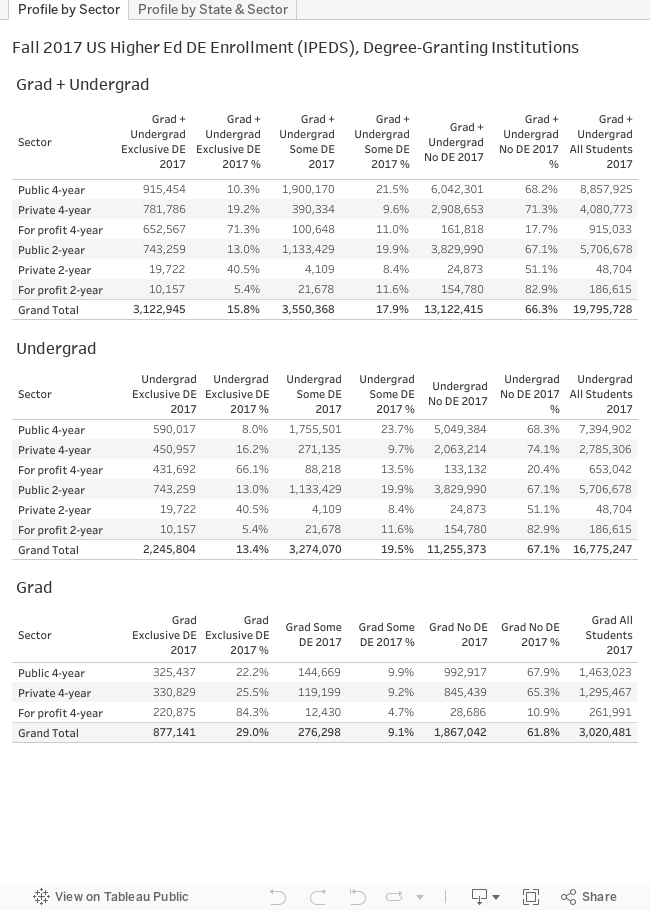
    Below is a profile of online education in the US for degree-granting colleges and university, broken out by sector and for each state for the most recent, Fall 2017, data.

    Please note the following:

    • There are multiple ways to filter and select data. For this set, I have limited to U.S. degree-granting institutions in six sectors – public 4-year, private 4-year, for profit 4-year, public 2-year, private 2-year, and for profit 2-year. For undergraduate totals I have included degree-seeking and non-degree-seeking students (degree-granting institutions can offer non-degree programs). Note that this will give different totals than what was reported in the NCES First Look report.
    • For the most part distance education and online education terms are interchangeable, but they are not equivalent as DE can include courses delivered by a medium other than the Internet (e.g. correspondence course).
    • I have provided some flat images as well as an interactive graphic at the bottom of the post. The interactive graphic has much better image resolution than the flat images.
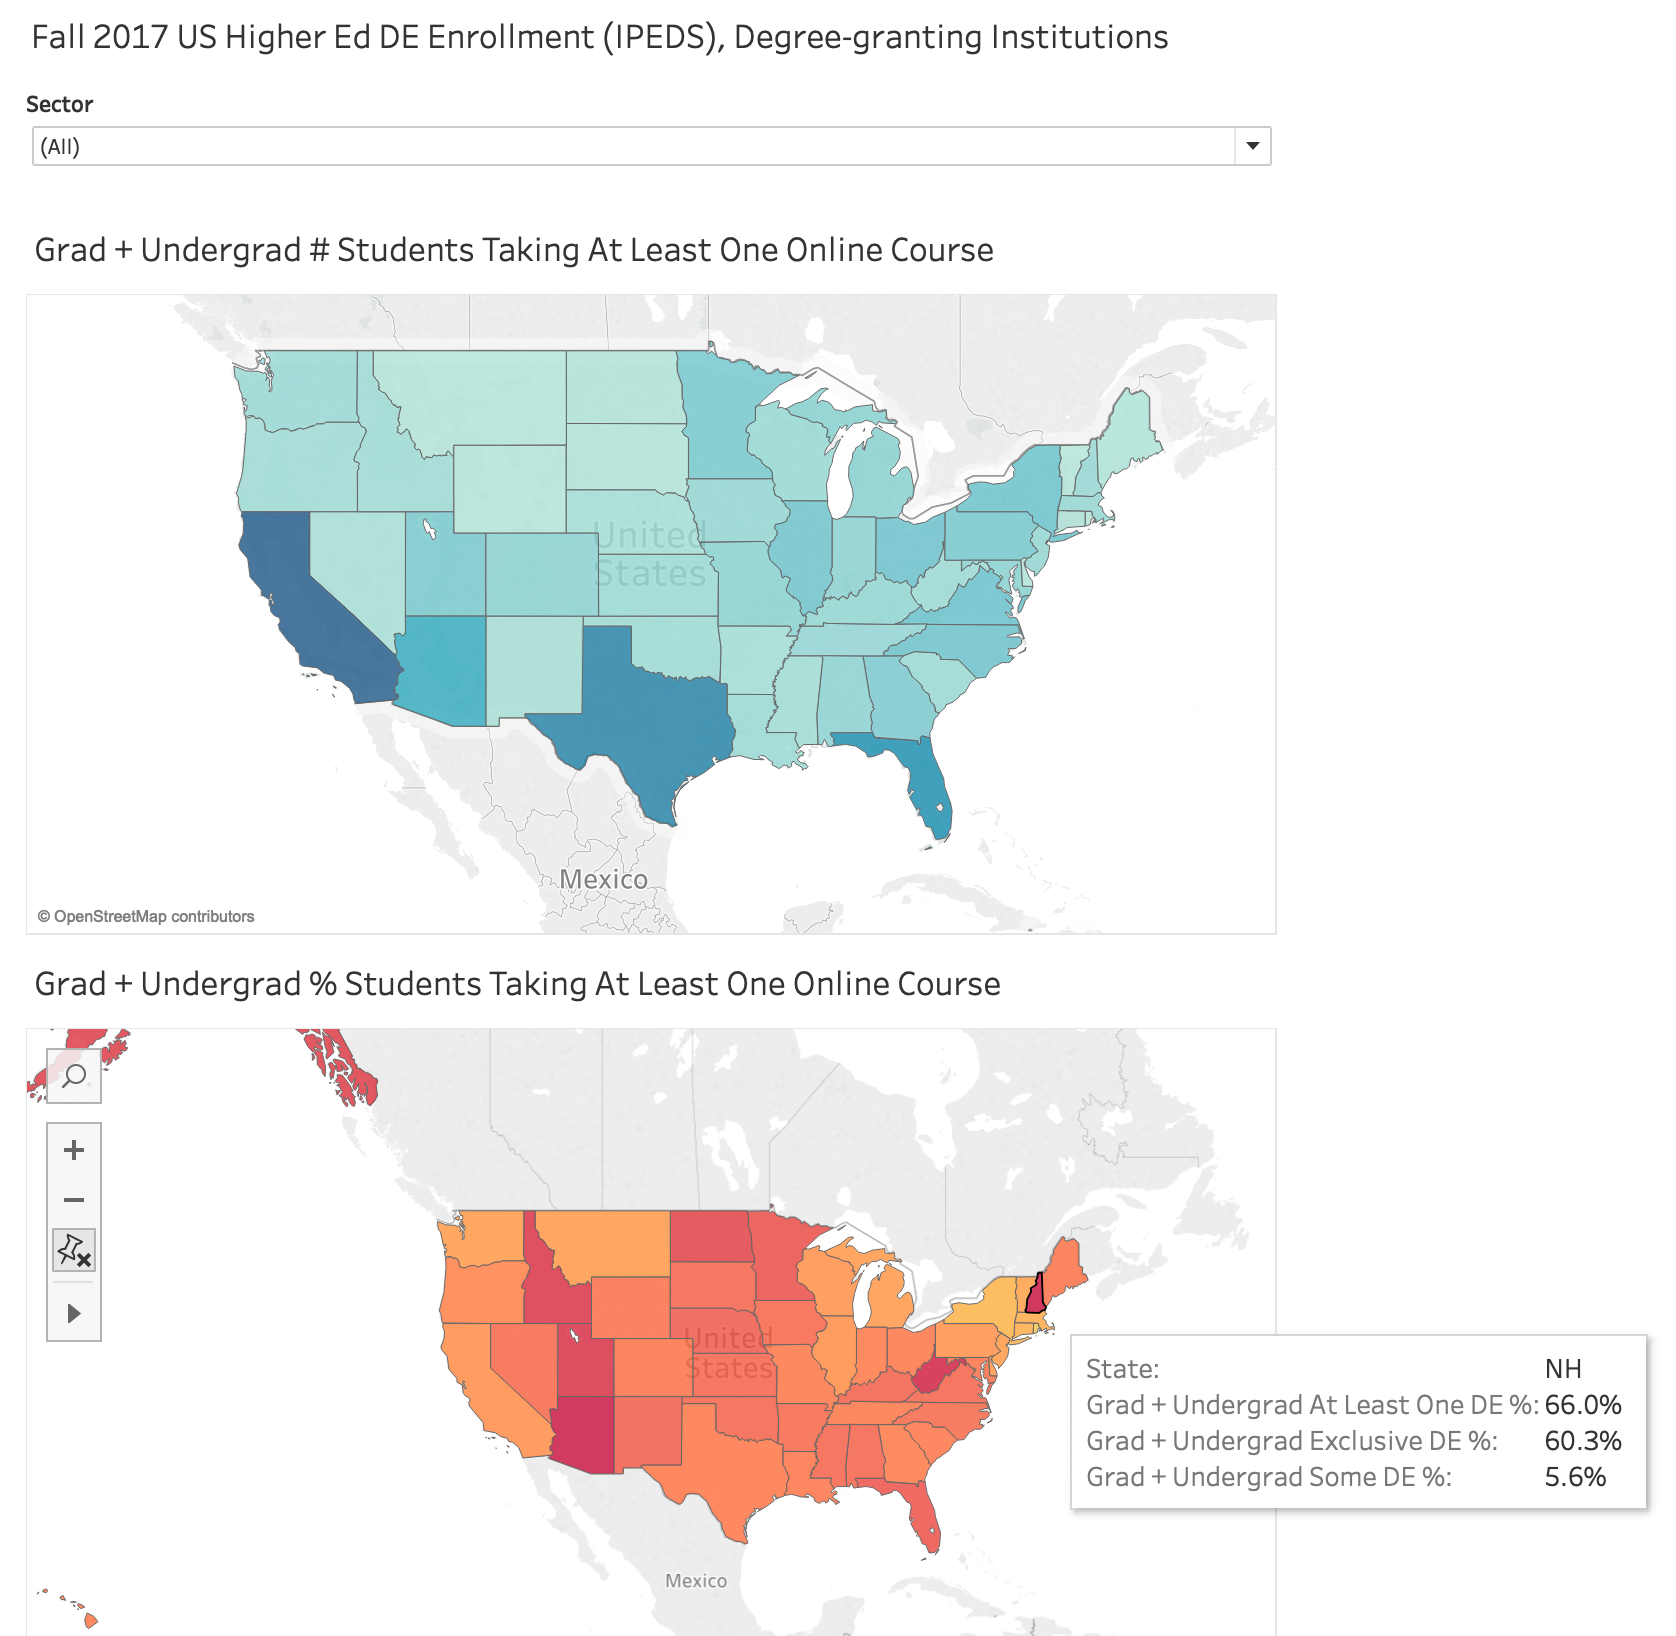
    • There are two tabs below in the interactive graphic – the first shows totals for the US by sector and by level (grad, undergrad); the second shows a map view allowing filtering by sector.

    Fall 2017 IPEDS data on distance education enrollment

    Here is the map view of state data colored by number of, and percentage of, students taking at least one online class for each sector. If you hover over any state you can get the basic data. As an example, here is a view highlighting New Hampshire institutions.

    Interactive Graphic

    For those of you who have made it this far, below is the interactive graphic, which can also be found here. Enjoy the data.

  • Fall 2017 Top 30 Largest Online Enrollments In US – With LMS Usage and Trends Since 2012

    Fall 2017 Top 30 Largest Online Enrollments In US – With LMS Usage and Trends Since 2012

    The National Center for Educational Statistics (NCES) and its Integrated Postsecondary Education Data System (IPEDS) provide the most official data on colleges and universities in the United States. This is the sixth year of data on distance education enrollments, and we have an opportunity to view trends over time.

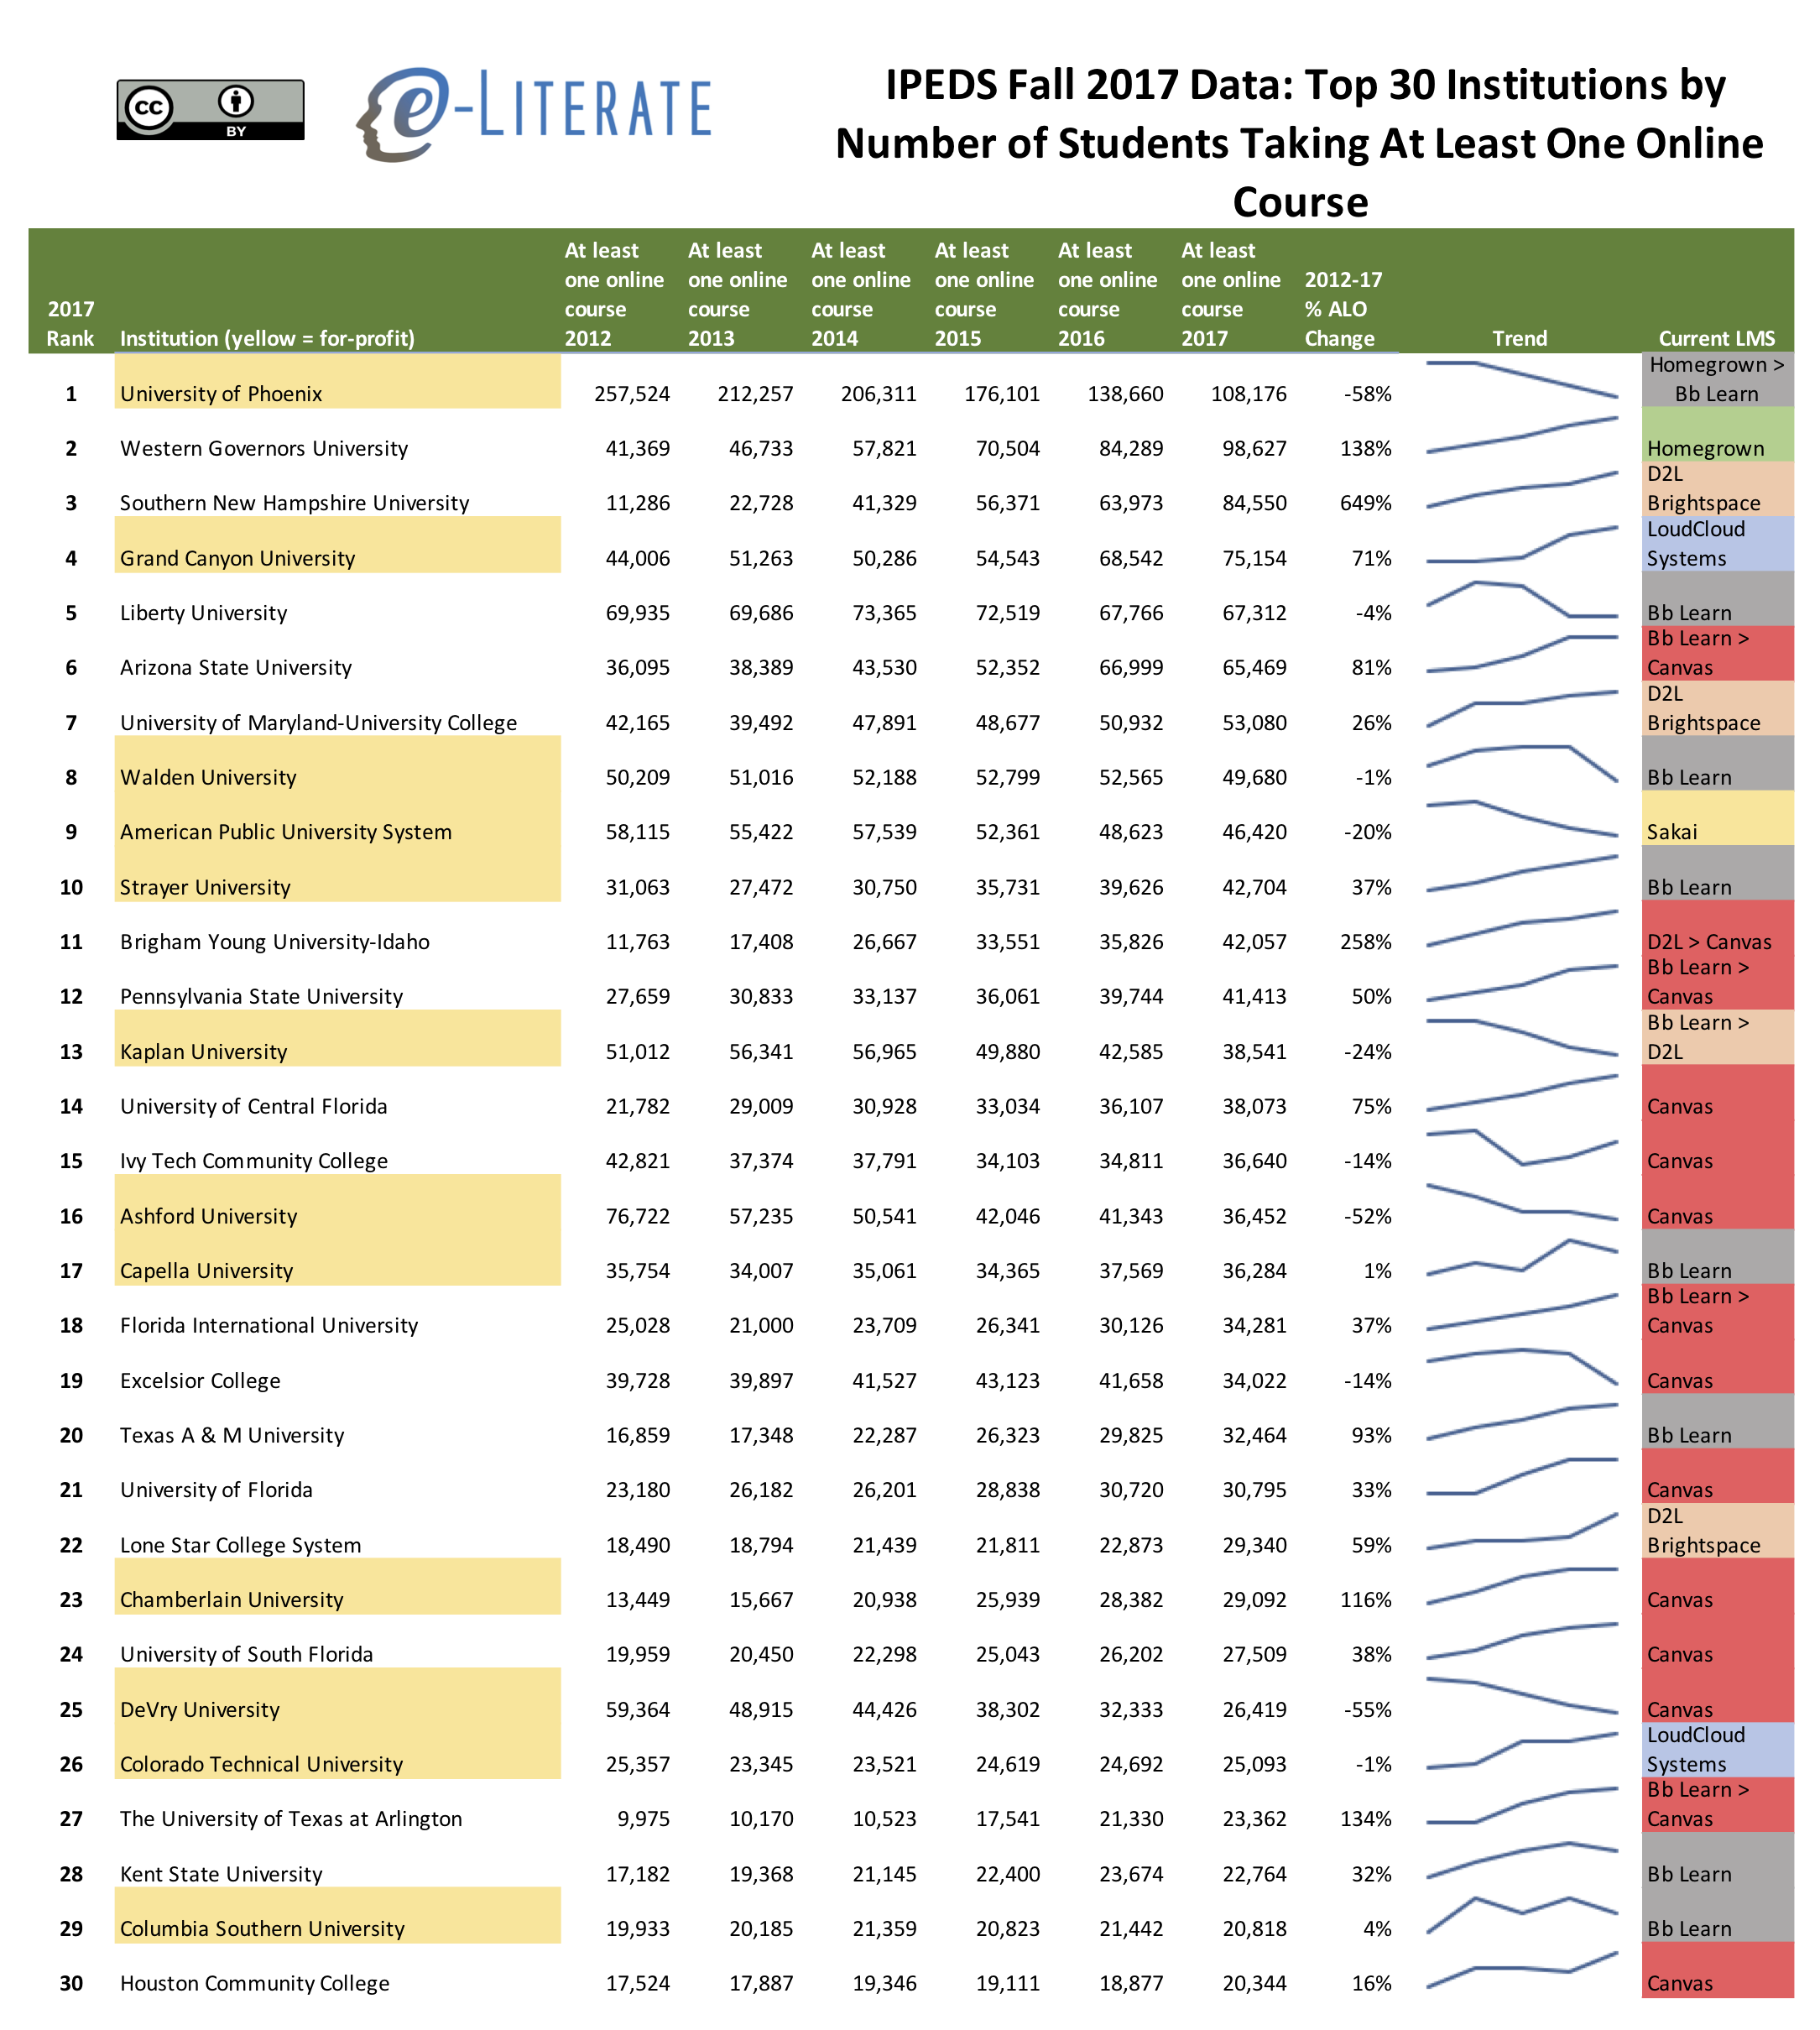
    Let’s look at the top 30 online programs for Fall 2017 (in terms of total number of students taking at least one online course for grad and undergrad levels combined) in the US. Some notes on the data:

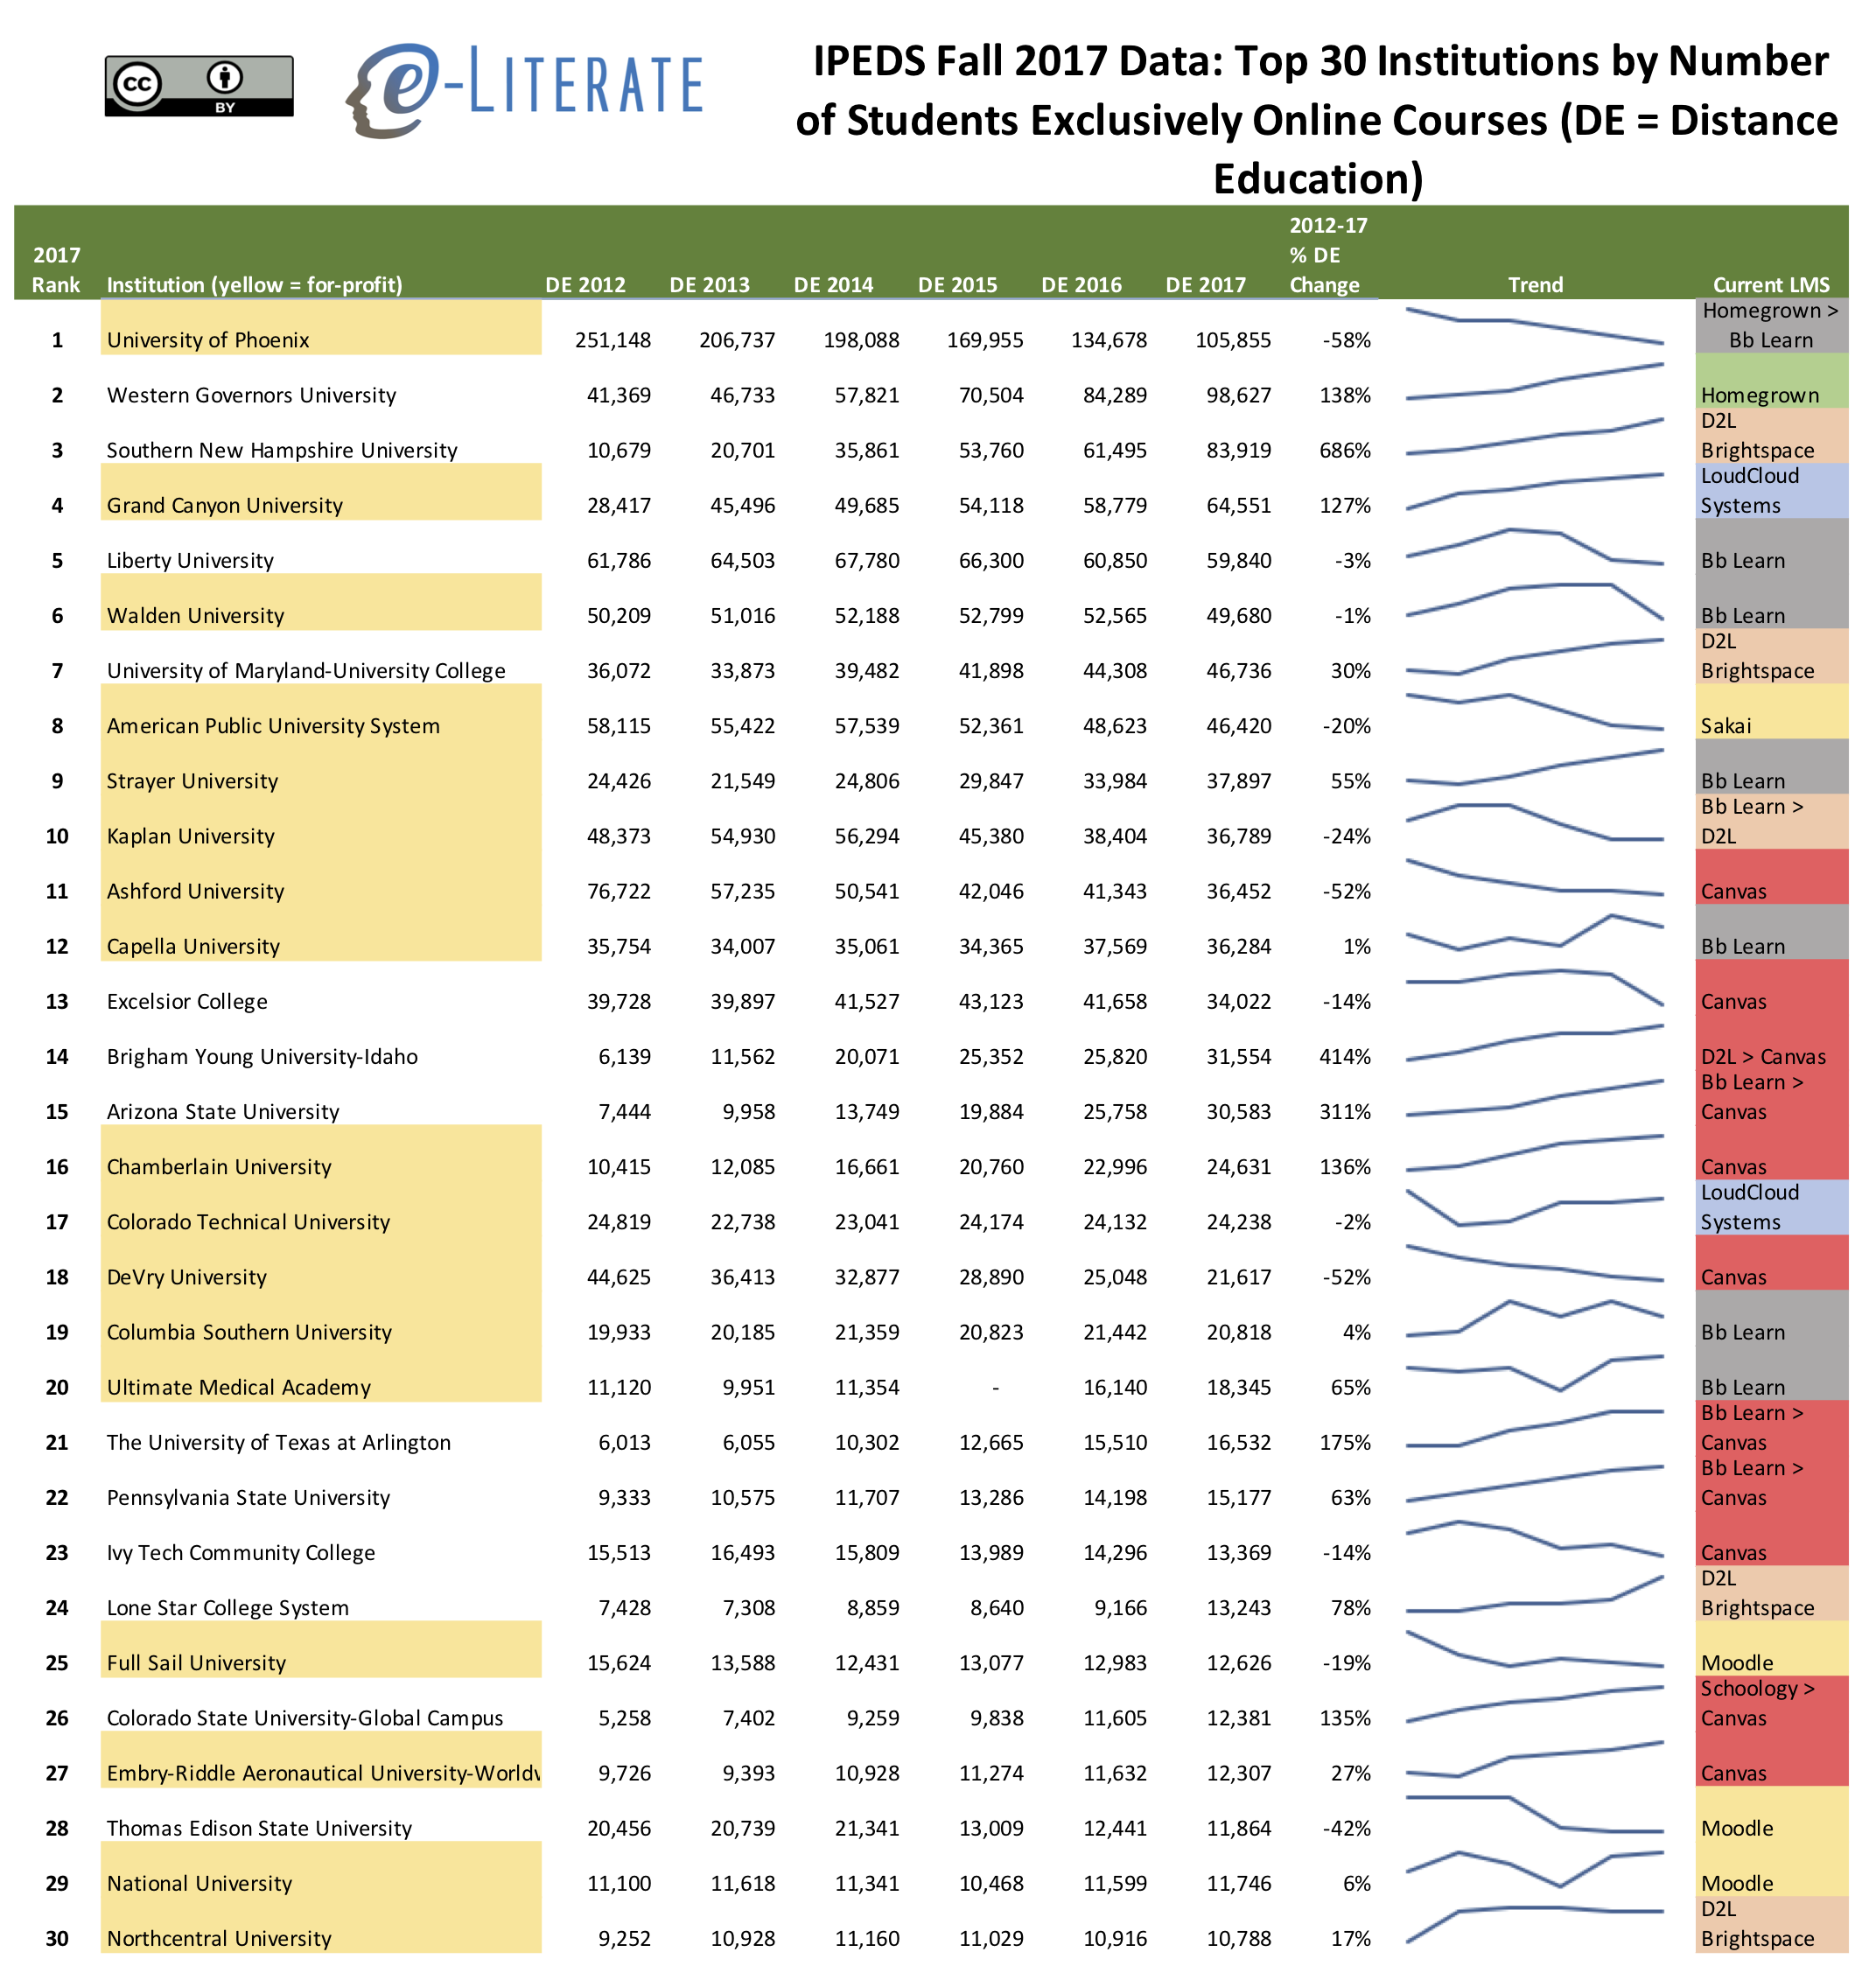
    • The first view combines the categories ‘students exclusively taking distance education courses’ and ‘students taking some but not all distance education courses’ to obtain the ‘at least one online course’ category; the second view shows just the ‘students exclusively taking distance education courses’.
    • Note that IPEDS captures distance education enrollment data based on Fall 20xx reports using a census date of October 15; this approach does not fully capture programs with multiple start dates throughout the year.
    • IPEDS tracks data based on the accredited body, which can differ for systems – this data has combined most for-profit systems into one institution entity as well as Arizona State University and a handful of not-for-profit systems that operate as one entity.
    • There is a new column this year showing changes in enrollment in each case between Fall 2012 and Fall 2017 data.
    • Both views highlight for-profit institutions in yellow and added sparklines to help visualize trends. There has been a wave of for-profits converting in one form or another of not-for-profit institutions (e.g. Grand Canyon University, Kaplan / Purdue Global), but these conversions for the most part had not taken place as of the Fall 2017 reporting period.
    • There is another new column this year showing which LMS is currently in usage at each of the schools listed, and in cases where there is a transition in 2018, both systems are shown with a direction > sign.
    • See this post for Fall 2017 profile by sector and state.

    Largest 30 online enrollments in US

    Looking at the case where students exclusively take online courses in a distance education (DE) mode, we see some differences in the list with a greater concentration of for-profit schools.

    Top 30 distance ed institutions

    Finally, it’s worth looking at the top 30 trend over time. Obviously the University of Phoenix is no longer the 800 pound gorilla in distance education, with two not-for-profits – Western Governors University and Southern New Hampshire University – poised to overtake Phoenix in the next year or two. This view also shows the tendency for most institutions to top out at approximately 60,000 students, but this may be changing with the three counter-examples above as well as Grand Canyon University.

    IPEDS Top 30 trend 2012-17

    Based on a reader request, I have added a Google Sheet for the data used above. There are tabs for Top 200 and Top 30 listings for each category (ALO and DE), but the LMS data was added manually and only available in Top 30.

    Update 11/26: Fixed mistake in 2012-17% calculations, updated first two images. Added downloadable Google Sheet for data access.

  • Postscript on Rio Salado Coverage: Clarity about different outcome types

    Postscript on Rio Salado Coverage: Clarity about different outcome types

    After my two posts two weeks ago calling into question whether Rio Salado College has demonstrated clear student outcomes that justify its usage as an exemplar institution, college officials have responded through the WCET blog and in an article from Paul Fain at Inside Higher Ed. I recommend reading the IHE article in particular to get an understanding of the challenging an nuanced question of what is “good enough” in terms of college completion, and for even more detail read Rio’s written response. Unfortunately, the lengthy explanations on graduation rates from Rio end up obscuring a critical distinction between awarding degrees versus certificates of completion. The reason this matters is that Rio appears to be doing a better than average job supporting student transfers to four-year degree programs, a worse than average job of helping students complete two-year degrees, and an unknown job of providing students with non-degree stand-alone certificates.

    Before dealing with this issue, I’d like to point out how useful this dialog has been and how open Rio has been in sharing internal metrics. One example that I wish other institutions used, and that can help us clarify how to understand completion data, is based on student goals.

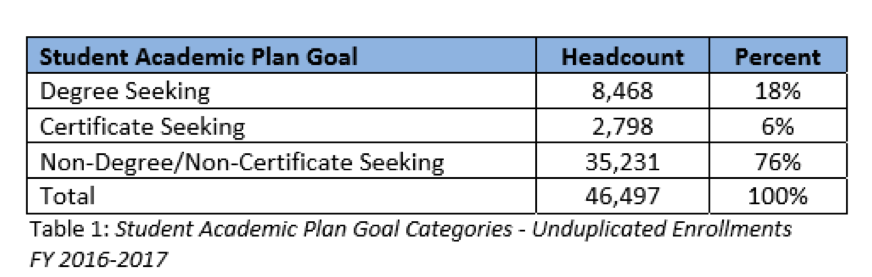
    Rio Student Intentions

    Fully 76% of Rio students have no intention to get a degree or certificate, and of this group 33% (11,628) indicated earning transferable credit as the key reason to enroll. As Sally Johnstone said in the IHE article, “It’s a feeder school for Arizona State University”. This transfer of credit mission can be good or bad – it depends on how well these students perform in getting an ASU degree. In the written response, but not in WCET or IHE articles, Rio shares an interesting but incomplete metric.

    Additionally, as part of the work RSC does related to accountability, we track the success of our transfer students to the three public universities in Arizona (The 2010/11 – 2015/16 5 year trend shows a 77.10% increase in bachelor degrees awarded to students that had completed a minimum of 12 credit hours (up to 60 or more hours) at Rio Salado College).

    Increase to what and over what? It is not clear if this is comparing to Arizona university students who do not transfer any credits from Rio, or those who transfer less than 12, or those who transfer from other colleges. Nevertheless, this is an indicator of the college helping students obtain four-year degrees through credit transfers.

    Once you get beyond non-degree / non-certificate seeking students, the numbers are murkier, and this is the area that needs clarity. One out of four Rio students are there to get an award – how successful are they? Rio recommends we look at the Voluntary Framework for Accountability (VFA) measures, instead of IPEDS, with the following results.

    • 2-year graduation rate is higher than peer institutions: Rio 13%; Peer Institutions 10%
    • 6-year graduation rate for credential-seeking cohort is 36.2%
    • The credential seeking cohort far outperformed sister institutions in completion: Rio 42%; Peer Institutions 16%

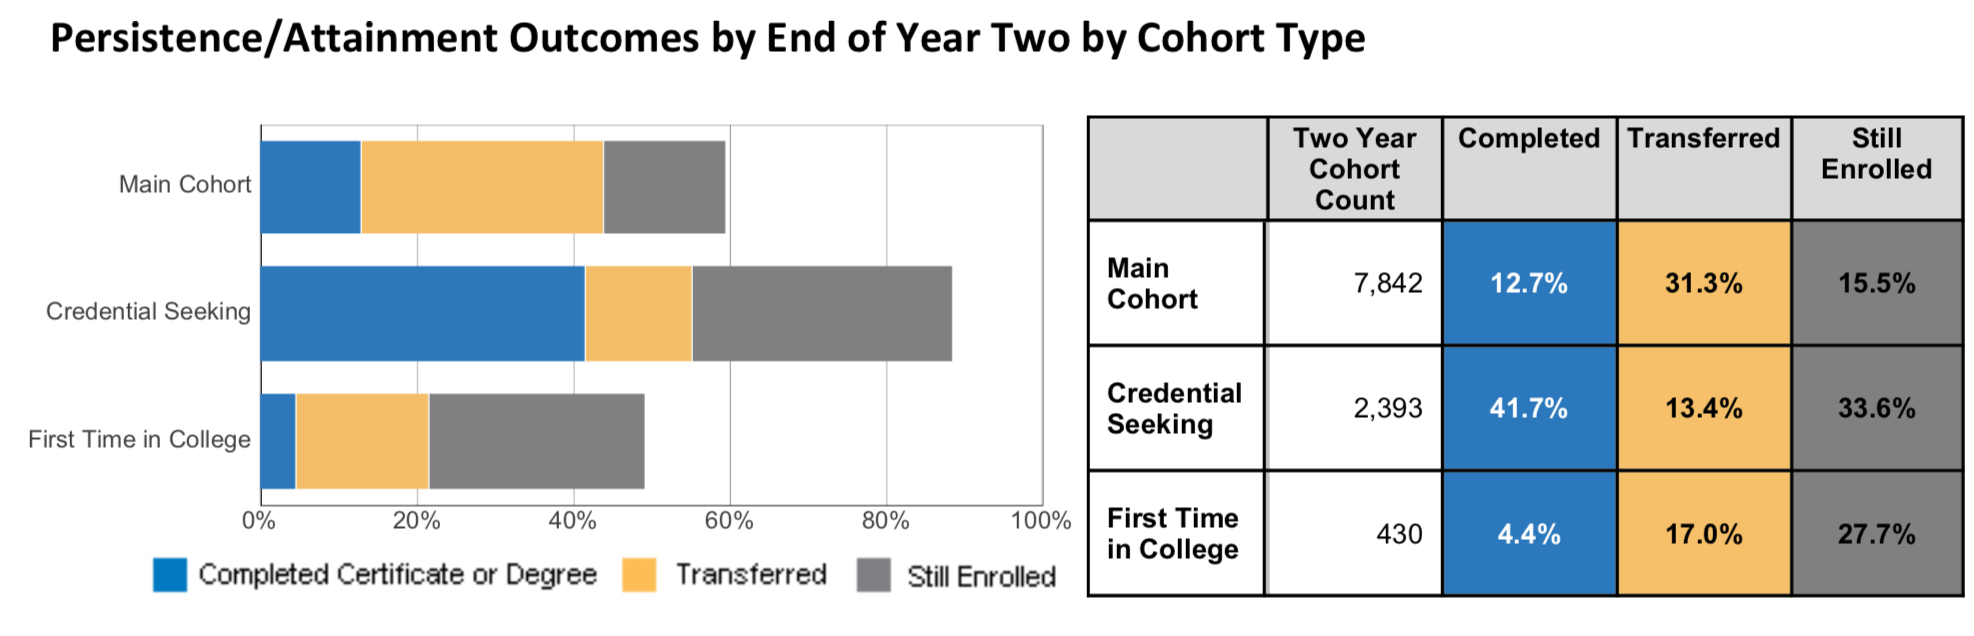
    I do not know why Rio uses the term graduation rate, as VFA instead describes Percent Students Completed a Formal Award, but from the numbers used we can see where the data comes from. The first and third bullets come from the VFA Two-Year Progress measures (blue column under Completed). ((The VFA definition of the cohorts: Main Cohort = fall entering, first time at reporting college; “all students”; Credential Seeking = earned 12 credits by end of year two.))

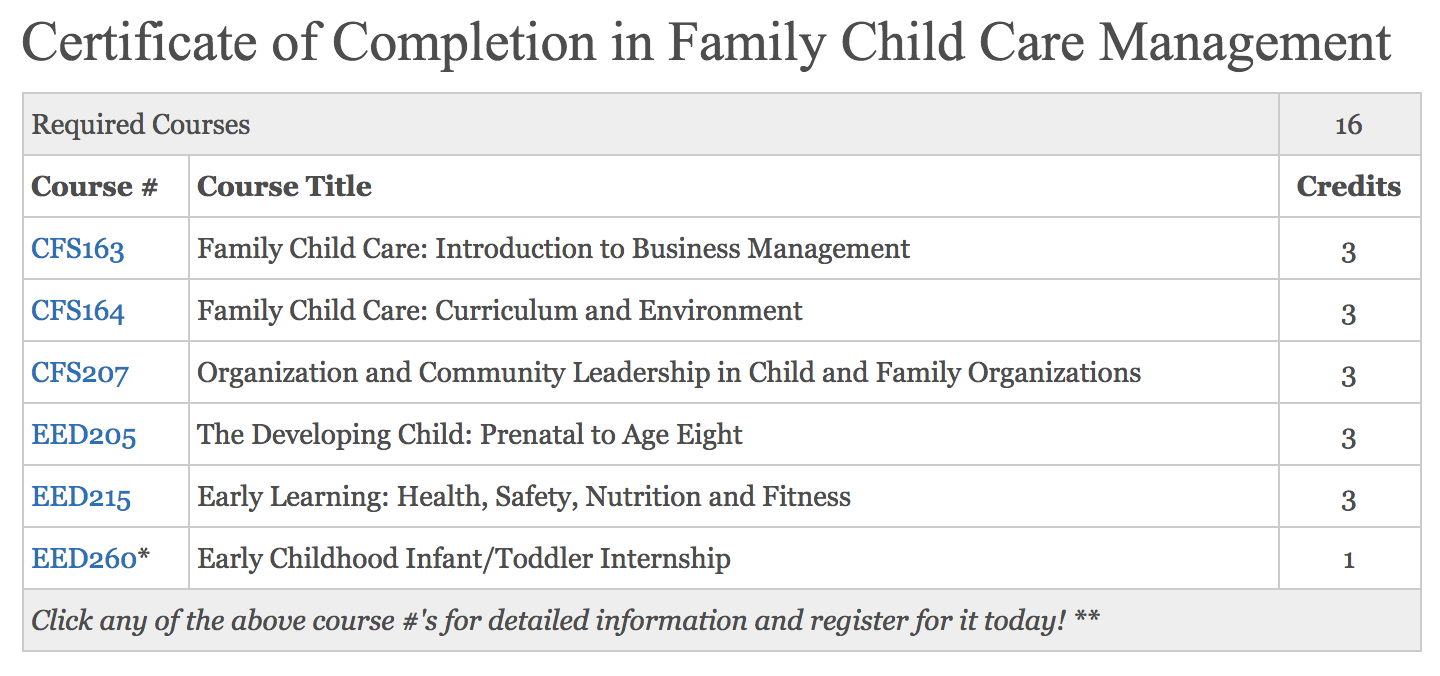
    What is key is that the Completed metric includes those who obtained an associate’s degree or official certificate. Unlike degrees, certificates of completion have no standards across schools, and their usage is very uneven. As an example of Rio’s usage:

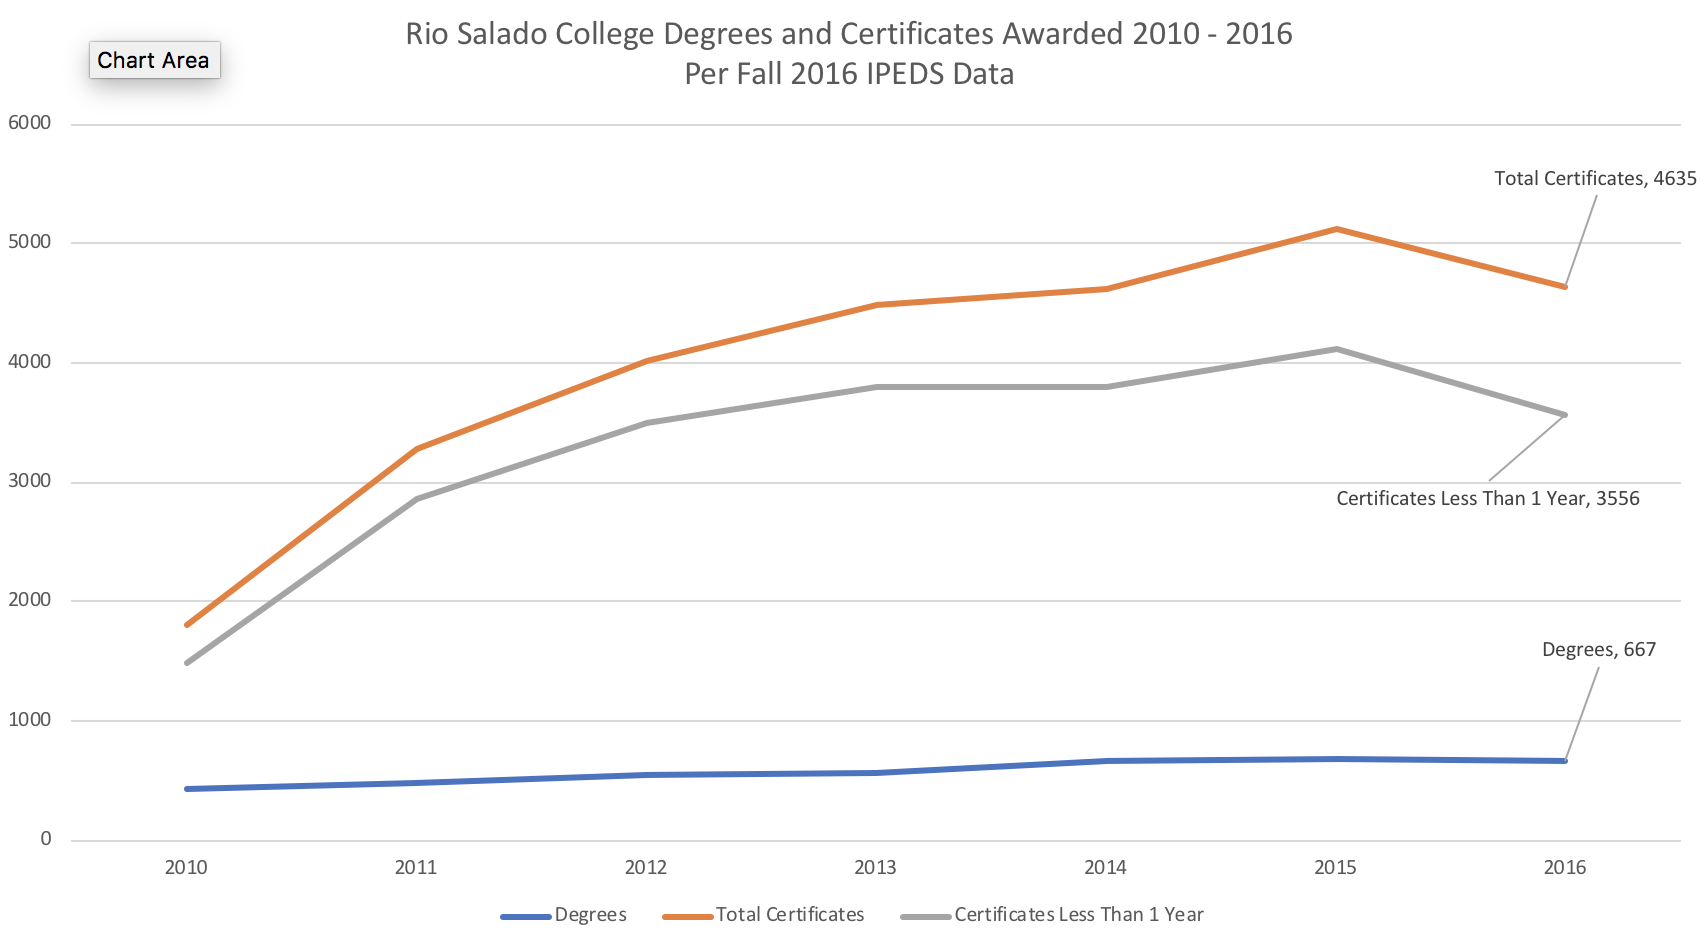
    Notably, since 2010 Rio has defined and awarded more and more of these <1 year certificates, based on IPEDS data.

    We can see is that the large majority of completions, which Rio labels under graduation rate, comes from the nonstandard certificates rather than degrees.

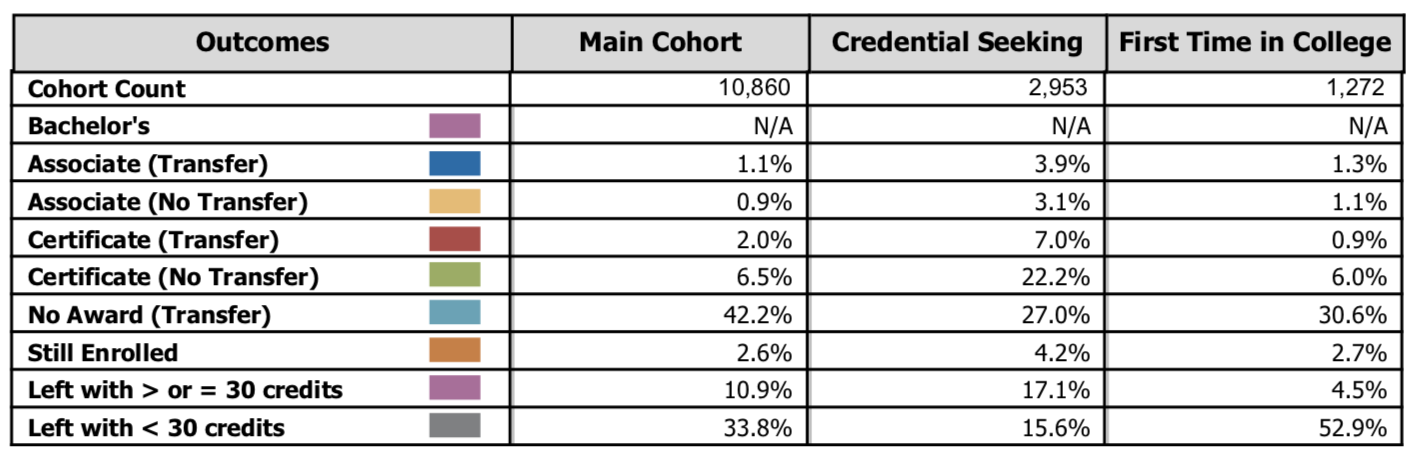
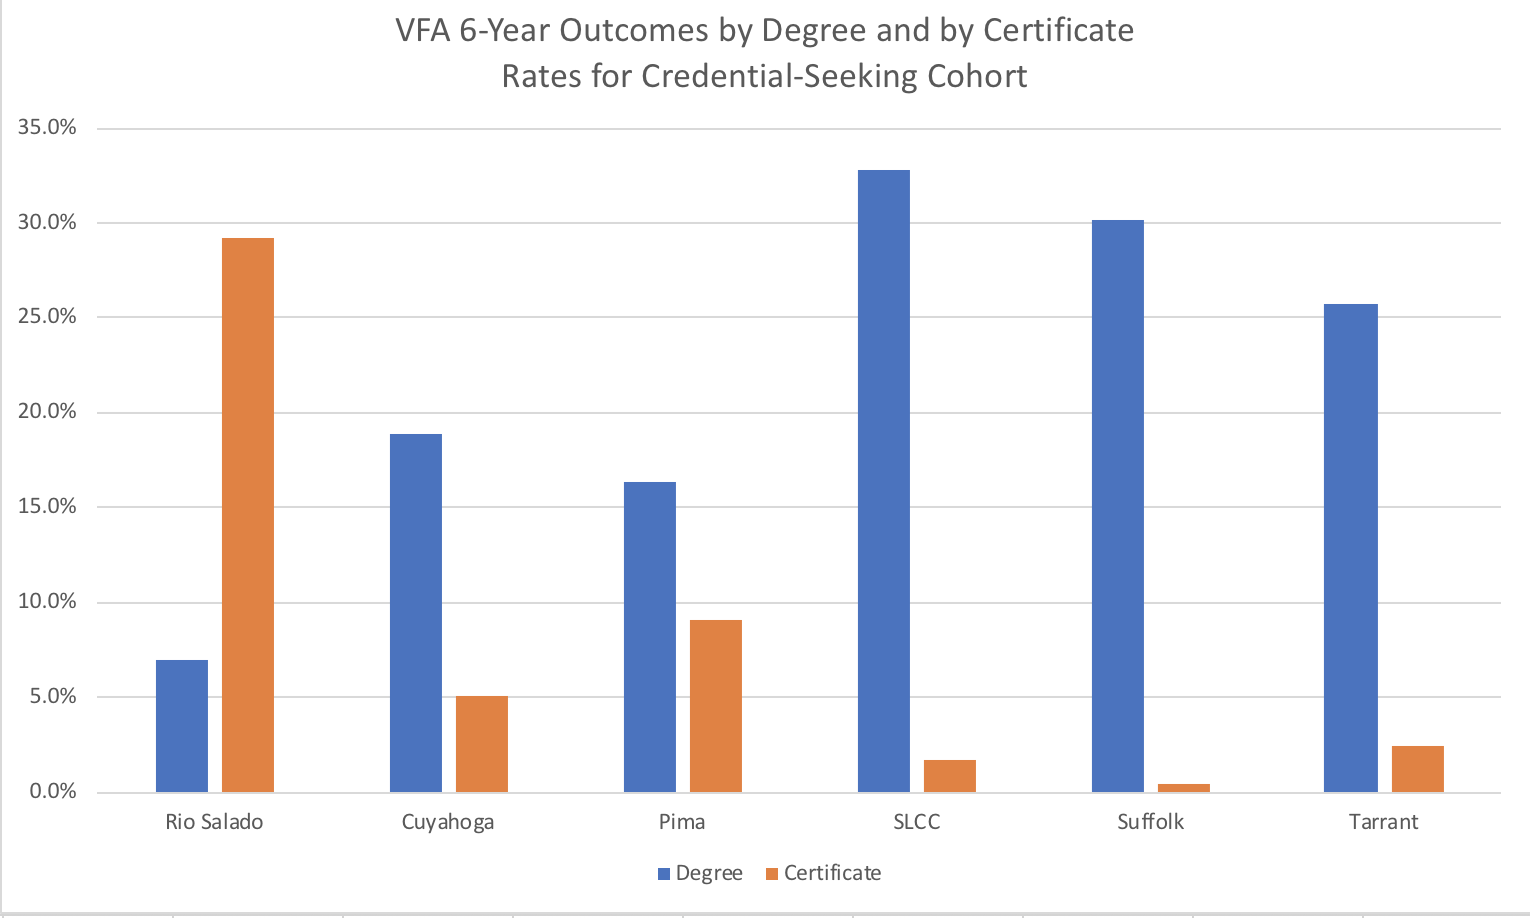
    One of the strengths of VFA is that under the Six-Year Outcomes measures, you can separate out the various types of award. Below is the data for Rio – pay attention to the Credential-Seeking Cohort, as it removes the majority of non-degree / non-certificate seeking students at Rio only looking to transfer a small number of credits. ((For degree or certificate-seeking cohorts, I prefer the Rio definition based on student self-reporting, but the VFA definitions get at the same idea.)) Also note that VFA outcomes are mutually-exclusive and hierarchical in the order shown. If a student gets a certificate and a degree, they are listed under the degree outcome.

    For the Credential-Seeking Cohort, 22% of Rio students get a certificate and do not transfer to a four-year school, 7% get a certificate and transfer, 3% get an associate’s degree and do not transfer, and 4% get an associate’s degree and transfer. A large majority of Rio Salado completions are for certificates, which is consistent with the IPEDS data.

    How does Rio compare to other large community colleges? While we have not analyzed all 200+ colleges in VFA, spot checking with some peer schools indicates that Rio is well below others in awarding degrees but well above others in awarding certificates.

    The resulting data provide the basis of my comment in IHE:

    “This is not a bad situation, per se, as long as students are gaining value in the workplace for these official certificates,” he said via email. “But certificates are not useful in terms of comparing apples to apples, especially when one school uses them liberally, as does Rio, and most other schools do not.”

    Hill also noted that Rio Salado’s VFA completion rate for associate degree programs is a “troublesome” 7 percent.

    While I appreciate the valuable sharing of information from Rio Salado in this process, I’ll stick with my original conclusion:

    At best, this is a school with mixed results that should not simply be labeled a success without caveats or explanations.

    Rio has shown that they can cut costs and still be a successful transfer school, but not that they can be a successful degree school. This matters a great deal in terms of how transferrable the lessons are. It’s fine to focus on transfers when you’re right next door to ASU. But what if you’re Adirondack Community College? There are places where degree completion matter more or less than at Rio. And what about those students going to Rio who *are* seeking degrees? Does this model promote some educational outcomes at the expense of others? And if so, shouldn’t students know about that before enrolling?

  • Rio Salado College As Exemplar: A critical external view

    In yesterday’s post I described how a review of two courses at Rio Salado College indicated reasons to question the use of this school in the ASU / BCG case study report on Digital Learning ((Disclosure: Our e-Literate TV series was funded in part by the Bill & Melinda Gates Foundation who also funded the ASU / BCG study.)). The report, titled “Making Digital Learning Work: Success Strategies From Six Leading Universities and Community Colleges”, has the following description [emphasis added]:

    How can the use of digital technologies in postsecondary education impact students’ access to education, student outcomes, and the return on investment for students and institutions? What are the biggest challenges for an institution seeking to implement high-quality digital learning opportunities? What promising practices enable an institution to achieve impact at a larger scale? [snip]

    The answers, at least in part, lie in case studies of six colleges and universities: Arizona State University, the University of Central Florida, Georgia State University, Houston Community College, Kentucky Community and Technical College System, and Rio Salado Community College. The first three institutions in this list are public research universities, representing different geographic populations and access missions. The other three institutions include two community colleges and a state-wide community college system.

    These six institutions have a strong track record of using digital learning to serve large, socioeconomically diverse student populations, and each has been a pioneer in innovating to expand access to postsecondary education, improve student outcomes, and provide higher education at an affordable cost.

    Let’s look at the track record of Rio Salado College in terms of aggregate academic student outcomes to see how appropriate it is to include them as an exemplar in such a case study-based report. For much of my analysis, I looked at the 862 public 2-year colleges fully reporting data in the Fall 2016 IPEDS data set.

    Reduced Expenditures

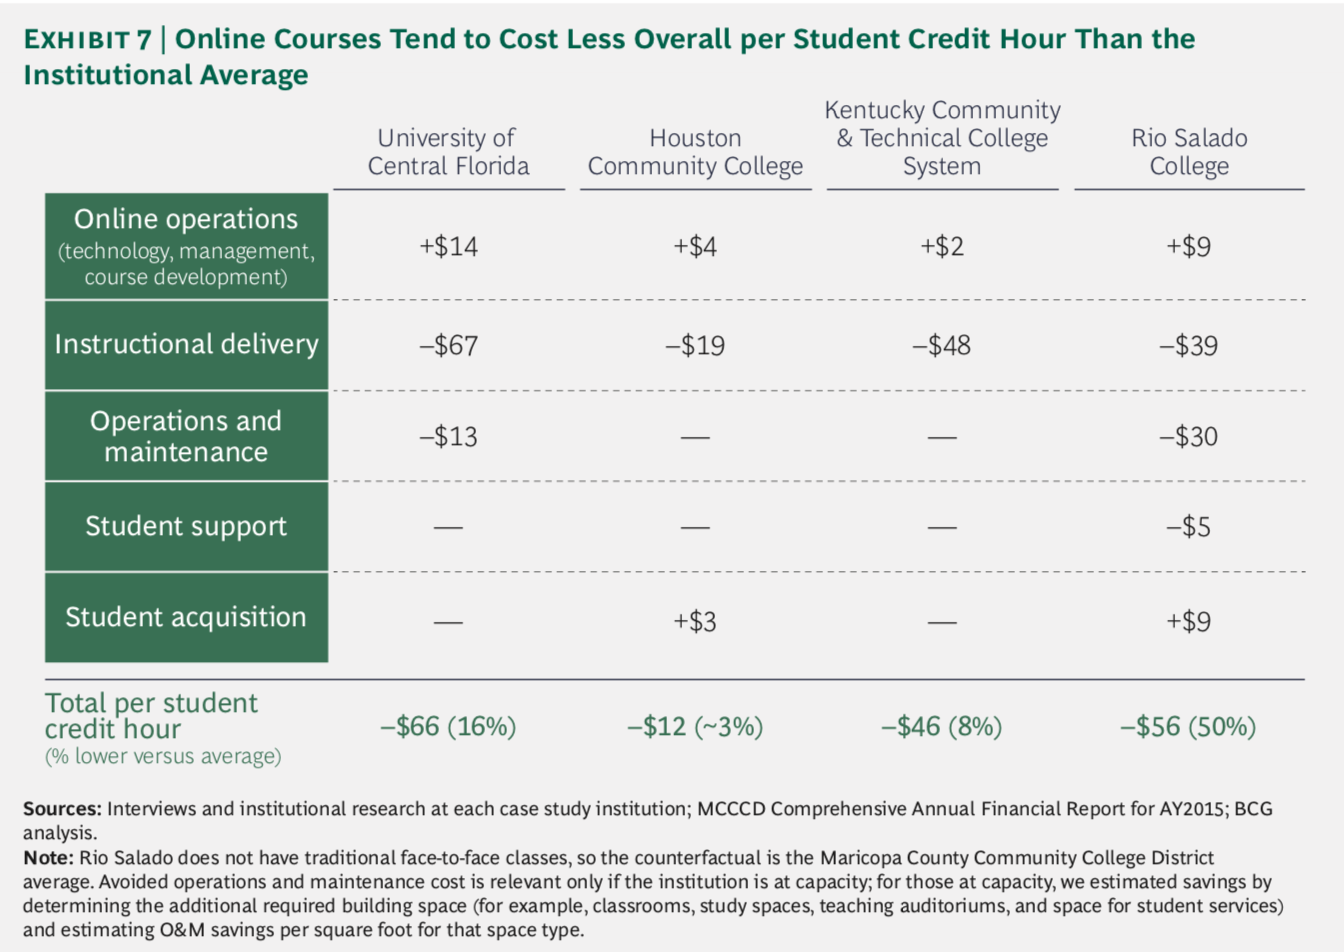
    The primary claim made in the ASU / BCG report is that Rio Salado is has reduced costs.

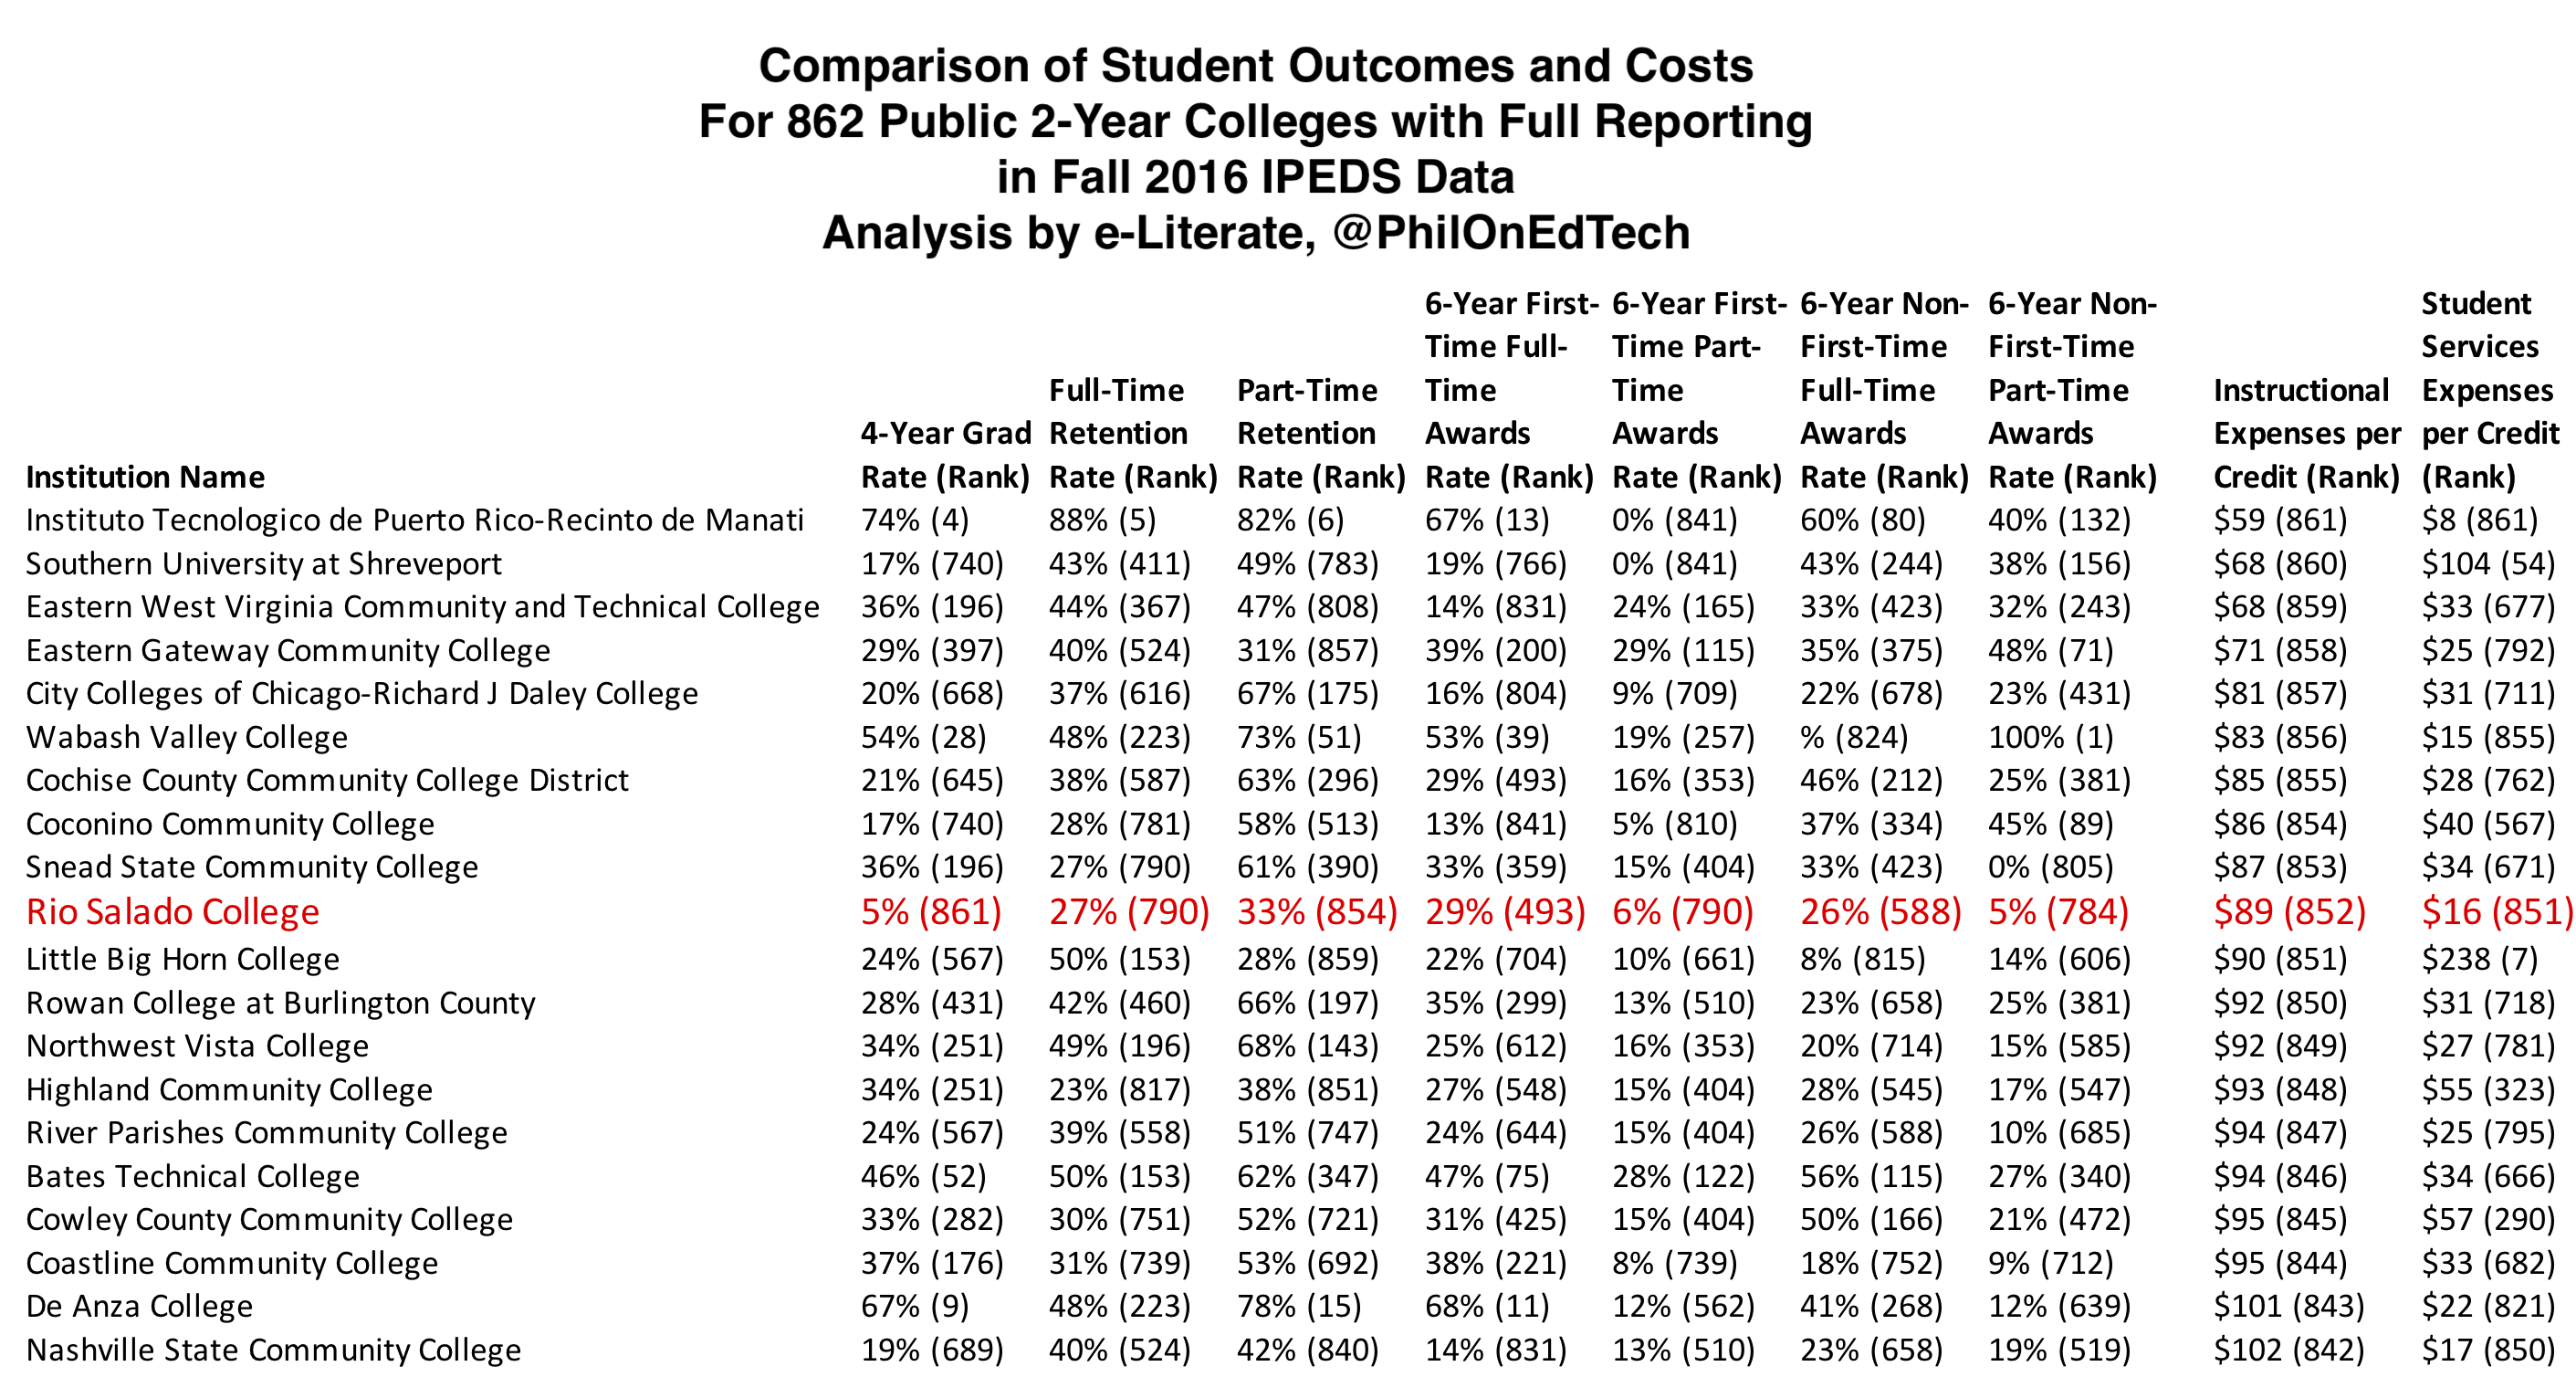
    This claim does hold up to scrutiny, as Rio’s $89 of instructional delivery costs per student credit hour and $16 of student services costs are 10th and 9th lowest in the country for the 862 colleges I reviewed.

    The primary outcomes claims made in the case study quickly brush off the standard metrics for Rio.

    Rio Salado’s success is not defined solely by improvements in graduation and retention rates. In particular, the college has a high transfer-out rate (32% compared to an average of 19% for other MCCCD colleges [ed. – the other schools in the Maricopa County Community College District]), and the students who transfer to Arizona universities from Rio Salado have a 74% four-year graduation rate—3 percentage points higher than the average for other MCCCD transfer students. At Rio Salado itself, students’ course-level success rates have slowly been improving over time, to about 64% in 2016.

    Graduation and Retention Rates

    It is all well and good to point out the importance of transfer students, but we should not ignore graduation and retention rates. And we should explore whether the data supports the phrase “improvements in graduation and retention rates”.

    The report describes Rio’s investment in a suite of advising tools.

    Obtaining these advisory tools required an initial investment of $1 million, but the tools pay for themselves by increasing Rio Salado’s term-to-term retention by 7%, increasing ROI through improved student progress and the additional tuition dollars that the institution receives from retained students.

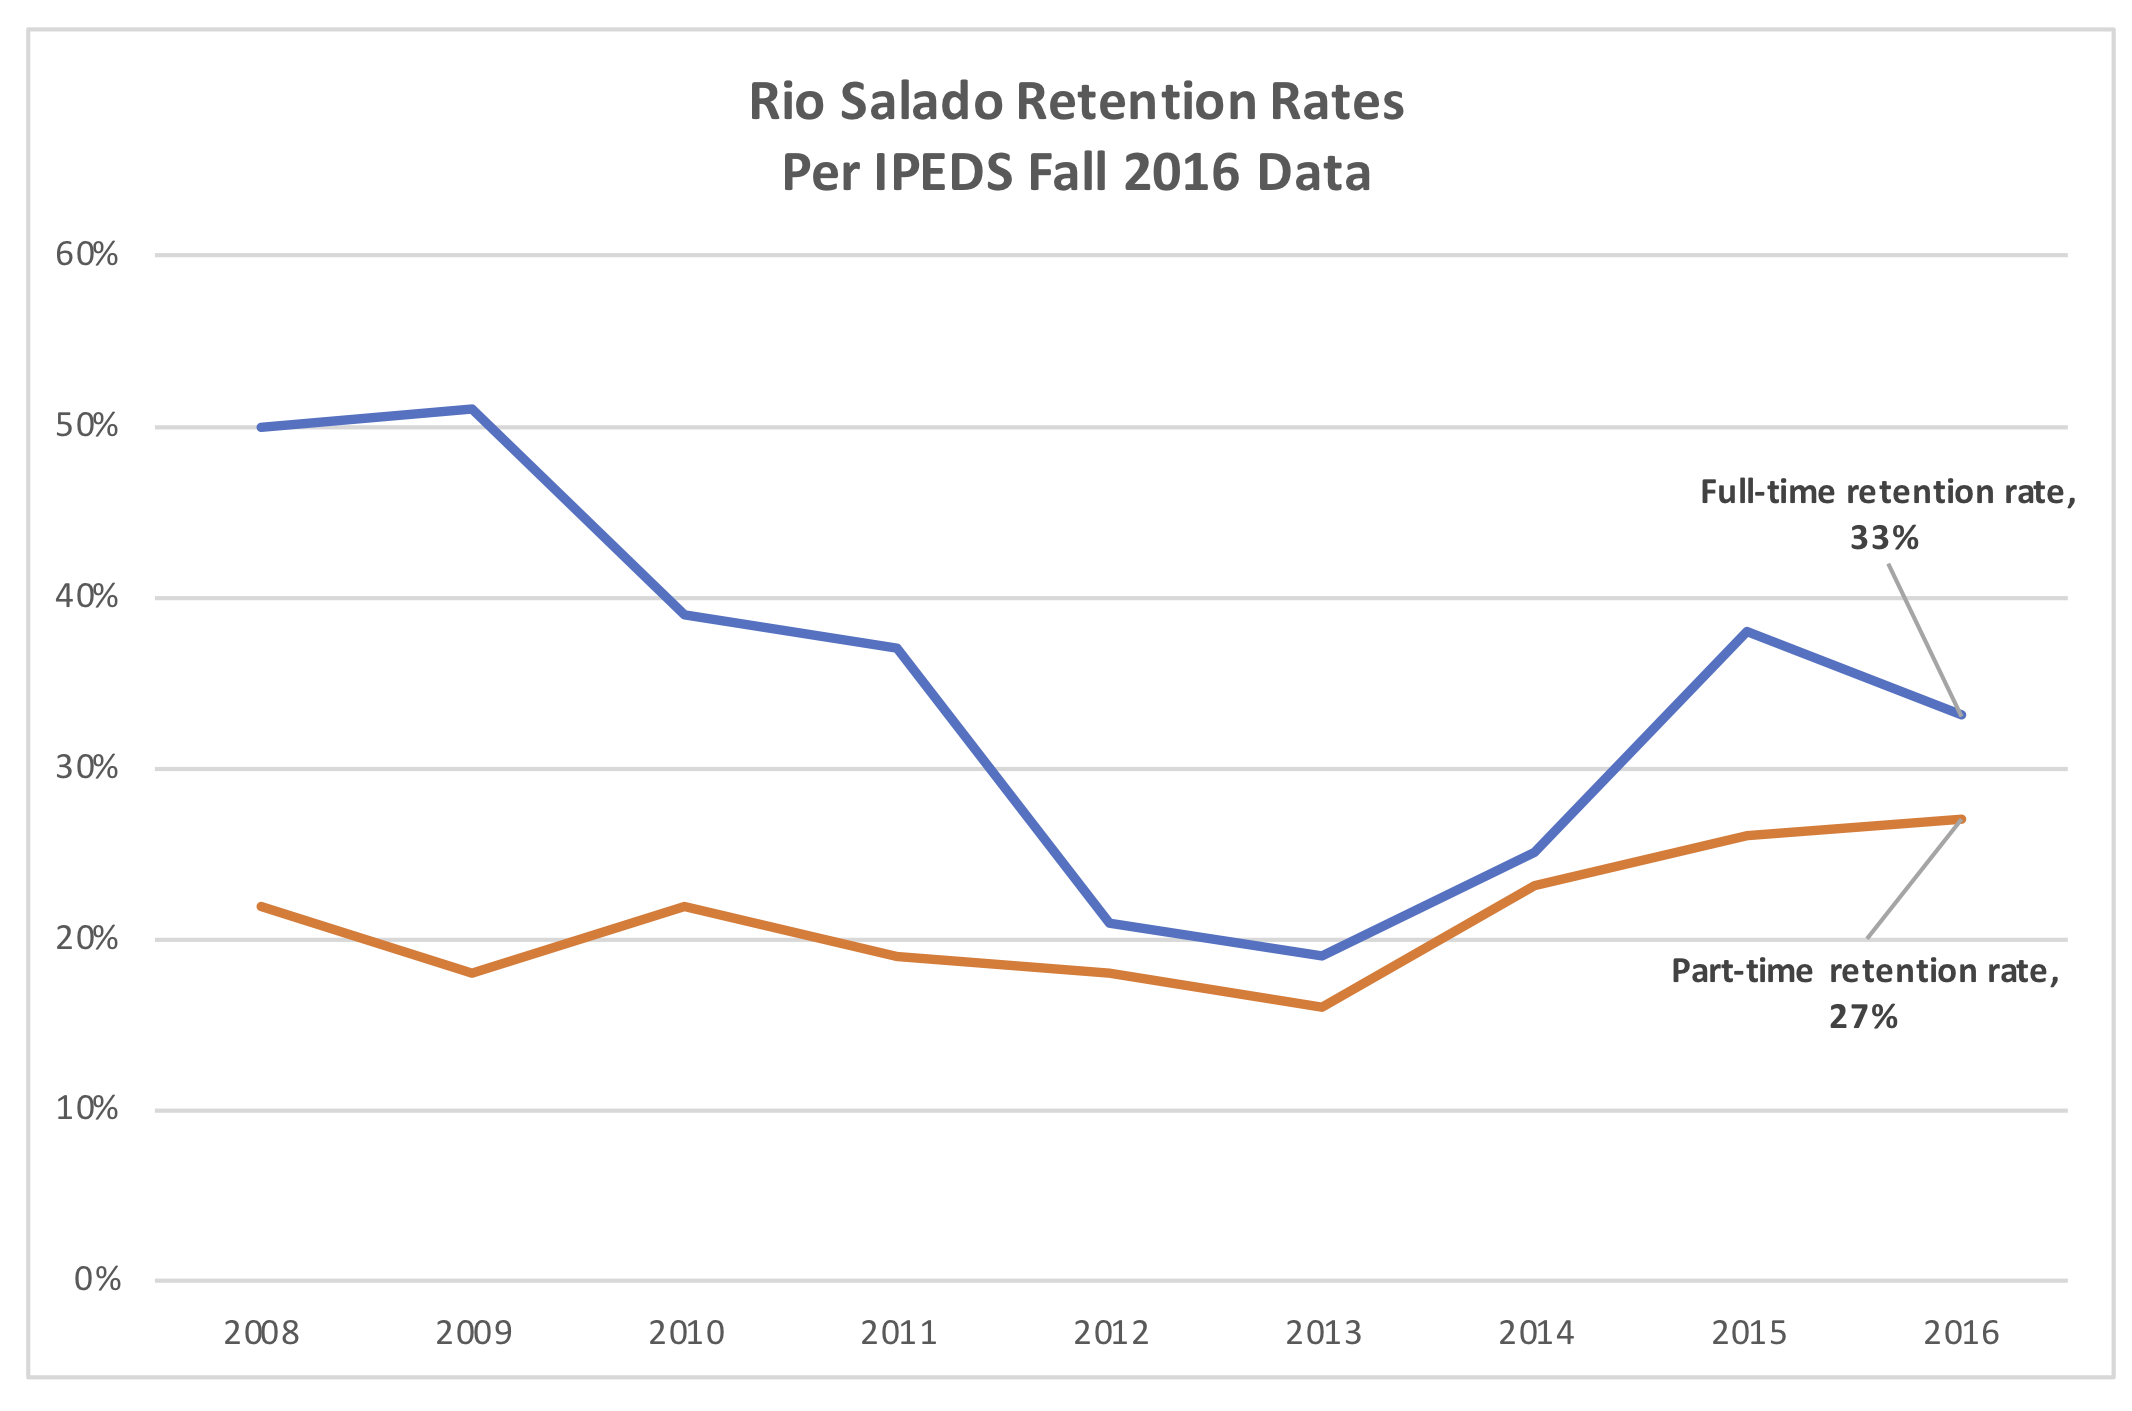
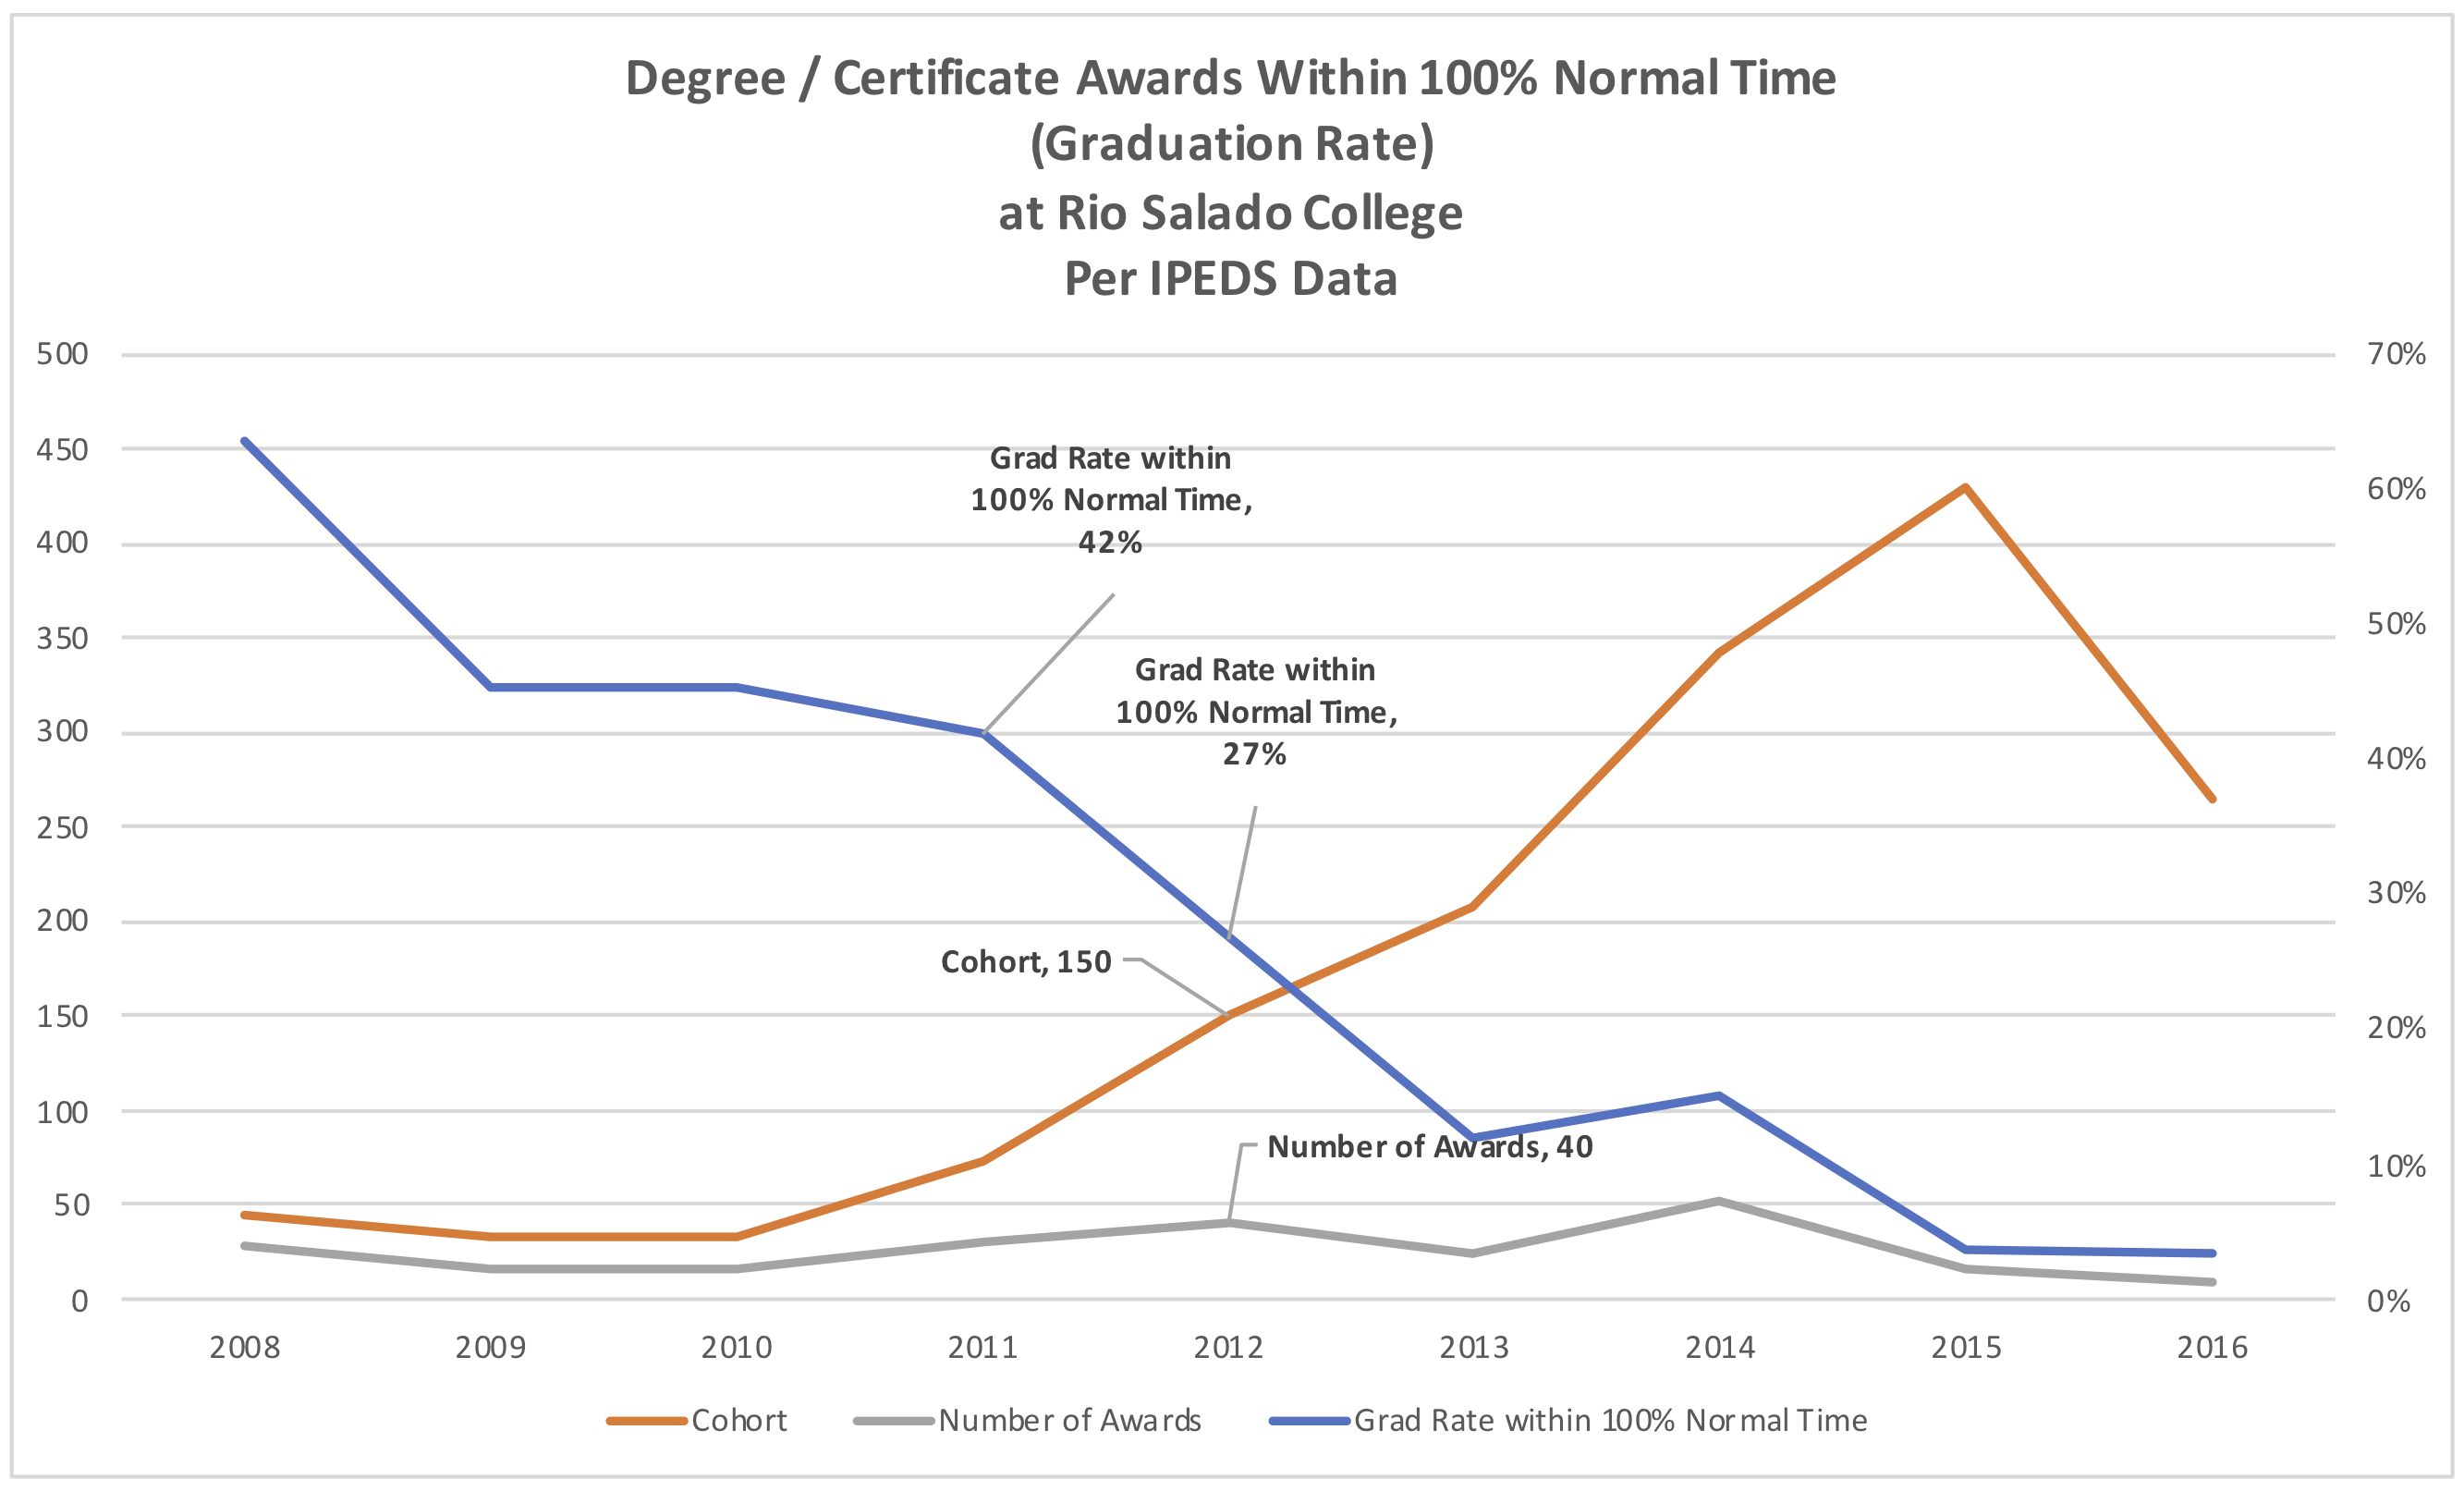
    Looking at IPEDS data, we can see Year 1 to Year 2 retention rates (not quite the same as term-to-term), and it shows improvement since 2013. Unfortunately, Rio’s retention rates for full-time and part-time students are both in the bottom 10% of all community colleges at 33% and 27%, respectively. And the full-time rate is lower than it was prior to 2011.

    Rio Salado Year 2 Retention Rates

    While the ASU / BCG report does not mention graduation rates directly, there have been several claims made about Rio’s numbers in other publications.

    The problem is that Rio Salado’s 4-year graduation rate for first-time full-time students as reported in IPEDS is 5% – the second lowest of any public 2-year college in the nation. How can we resolve this discrepancy?

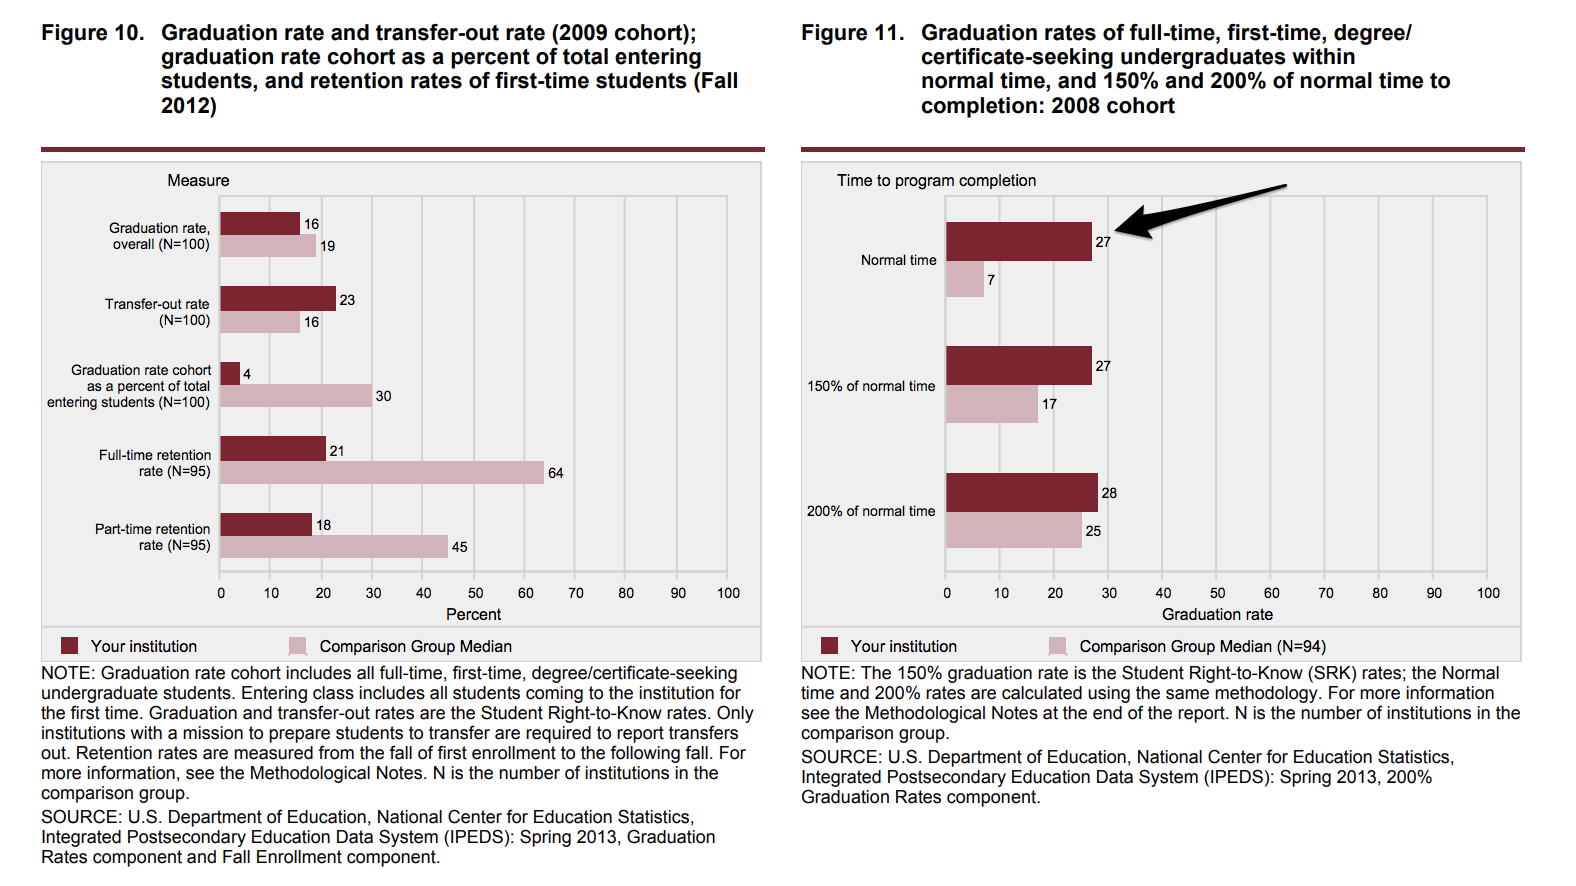
    The key to understanding the claims in these four articles is to follow the two links, which both point to a customized IPEDS Feedback Report from 2013 for Rio against their selection of 100 peer institutions.

    Figures 10 and 11 from IPEDS report

    This measure captures any award – degree or certificate – for a small cohort of entering full-time students at Rio from 2009. If you trace that data through IPEDS, you see that this measure is for a 150-student cohort (in 2012) out of the 45,000+ students at Rio.

    Using this specific metric, you can find the 42% graduation rate in 2011, and the “four times greater” rate of 27% in 2012, both as the rate plummets from 64% in 2008 to 3% in 2016.

    Using broader, up-to-date metrics for graduation and retention rates as well as the new IPEDS outcomes measures (which allows comparison outside of just full-time first-time cohorts), we see that Rio Salado College has some of the lowest student outcomes measures in the country.

    For all but two measures (6-year First-Time Full-Time Awards and 6-year Non-First-Time Full-Time Awards), the performance is in the bottom 10% of all colleges in the study. For those two awards measures, the performance is in the bottom half of the country and represents just 11% of the student body.

    Transfer Rates

    What we are left with are reports about high transfer rates and subsequent success rates 3% higher than other transfers out of the same district. The IPEDS data set now includes transfer rates in its new Outcomes Measures section, and it is true that Rio Salado College does transfer out a significant portion of students. For all cohorts defined below, Rio is in top 20% of public 2-year institutions.

    • First-Time Full-Time Students: 39% transfer rate, Rank 170 out of 862
    • First-Time Part-Time Students: 47% transfer rate, Rank 112 out of 862
    • Non-First-Time Full-Time Students: 46% transfer rate, Rank 196 out of 862
    • Non-First-Time Part-Time Students: 59% transfer rate, Rank 121 out of 862

    Note that this data indicates that students transferred to another institution and are still enrolled there. This data does not indicate what portion of the transfers were planned versus students deciding to move on for other reasons. Nevertheless, for a community college, especially one with very close ties to ASU (I have been told that a large percentage of Rio students are ASU students trying to fill out their schedule based on saving money and more convenient schedules), this is a favorable metric.

    I cannot provide independent confirmation on the subsequent success rates, so we’ll accept that claim at face value.

    Case Study Questions

    I should note that Rio Salado College does provide accurate information on the metrics mentioned in this post, both through IPEDS reporting and through their Research & Planning section of the web site. The picture that emerges from the aggregate outcomes data is of a large school that:

    • transfers out greater than average percentage of students;
    • is just below average for awarding certificates for full-time students;
    • is among the poorest performing in the country for retaining students;
    • is among the poorest performing in the country for awarding degrees; and
    • is among the poorest performing in the country for awarding certificates for part-time students.

    At best, this is a school with mixed results that should not simply be labeled a success without caveats or explanations.

    One question we should ask is whether it is appropriate to hold up a school with some of the lowest student outcomes measures in the country as an exemplar. Yes, Rio Salado has found a way to spend as little as possible on instruction and student support services, and yes, a lot of students transfer out, but that is not enough. We need greater evidence of student success if we are to use them as a case study for others to emulate. And we also need a more robust genre of a case study that looks across, at a minimum, a relatively standard set of publicly-available information, and deeper dives where appropriate, to understand educational practices and their impacts on students. These case studies should present information in context – the good and the bad – since education is complex and challenging, and a clear focus on evidence will benefit all parties in the end.

  • Fall 2016 Top 20 Largest Online Enrollments In US – With Trends Since 2012

    Fall 2016 Top 20 Largest Online Enrollments In US – With Trends Since 2012

    The National Center for Educational Statistics (NCES) and its Integrated Postsecondary Education Data System (IPEDS) provide the most official data on colleges and universities in the United States. This is the fifth year of data, and we have an opportunity to view trends over time.

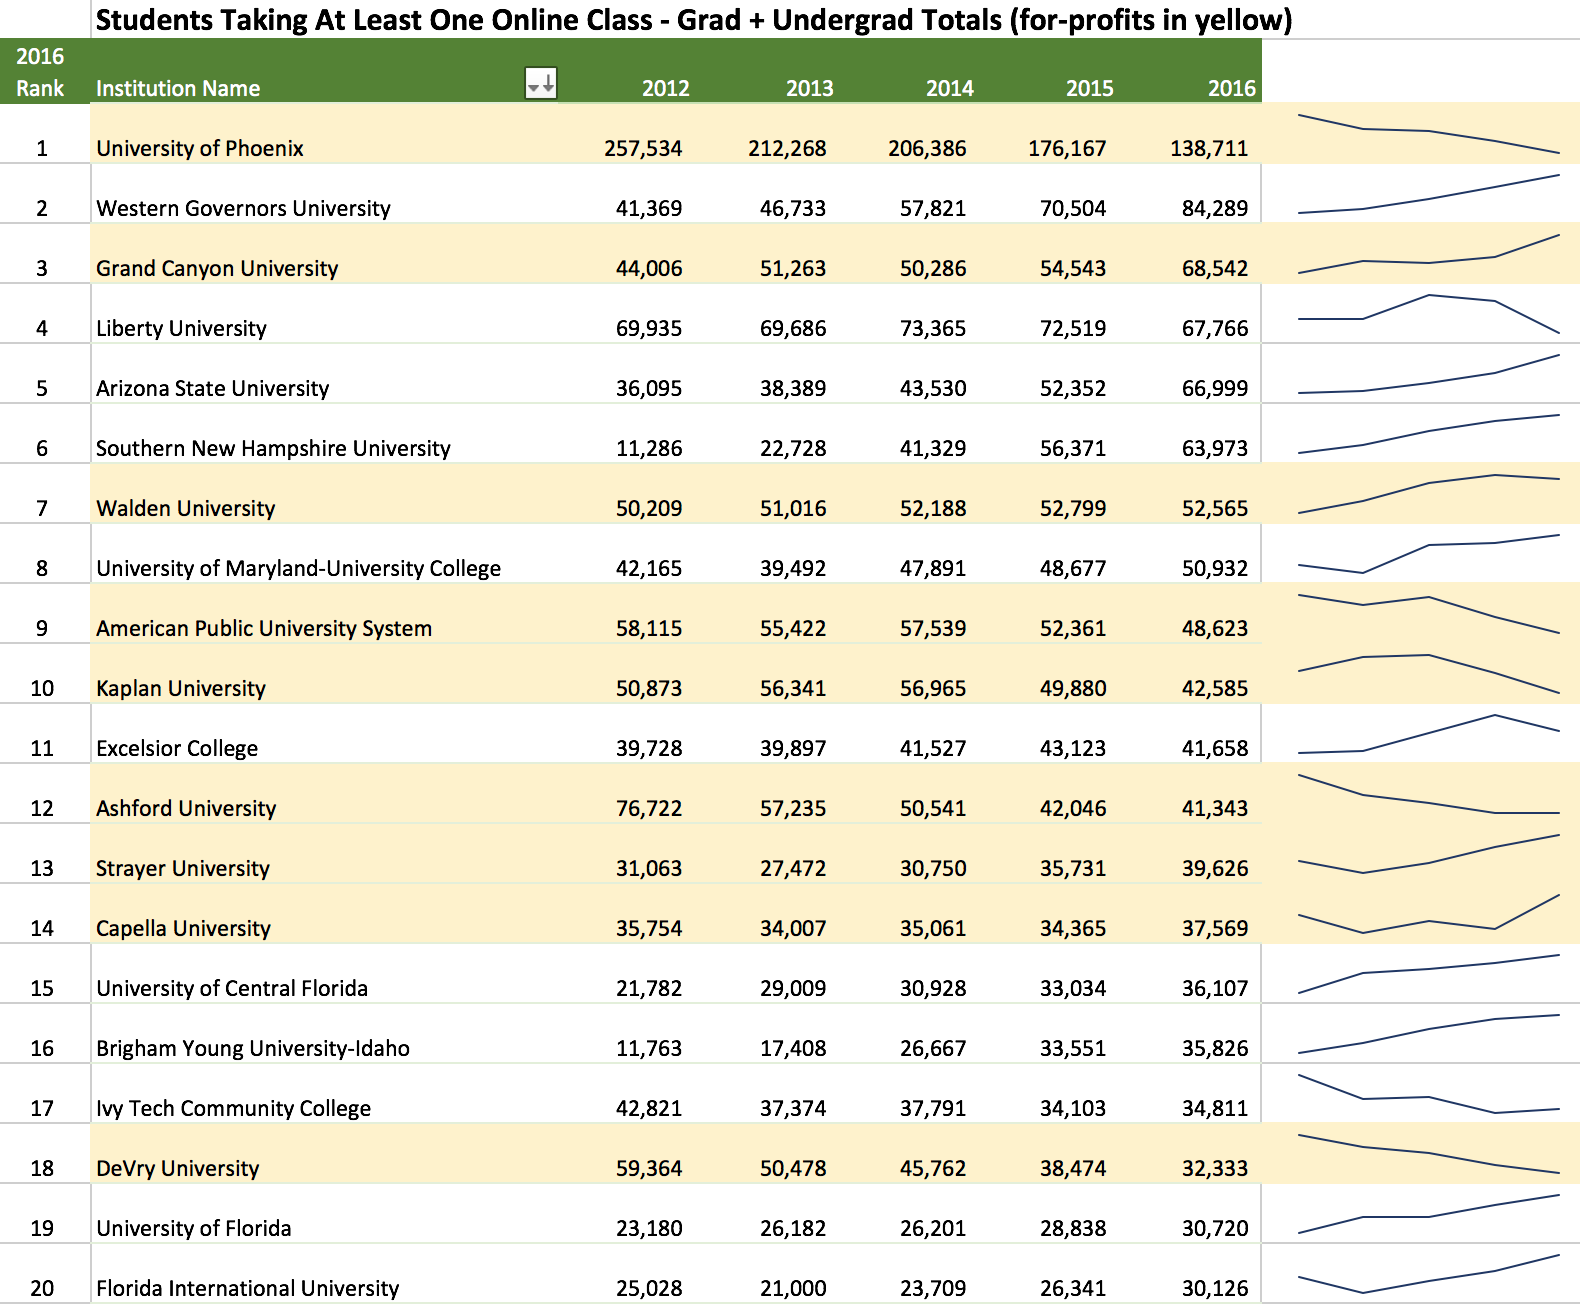
    Let’s look at the top 20 online programs for Fall 2016 (in terms of total number of students taking at least one online course for grad and undergrad levels combined) in the US. Some notes on the data source:

    • I have combined the categories ‘students exclusively taking distance education courses’ and ‘students taking some but not all distance education courses’ to obtain the ‘at least one online course’ category;
    • IPEDS tracks data based on the accredited body, which can differ for systems – I manually combined most for-profit systems into one institution entity as well as Arizona State University;
    • I have highlighted for-profit institutions in yellow and added sparklines to help visualize trends;
    • See this post for Fall 2016 profile by sector and state.

    Top 20 Online Enrollment in US

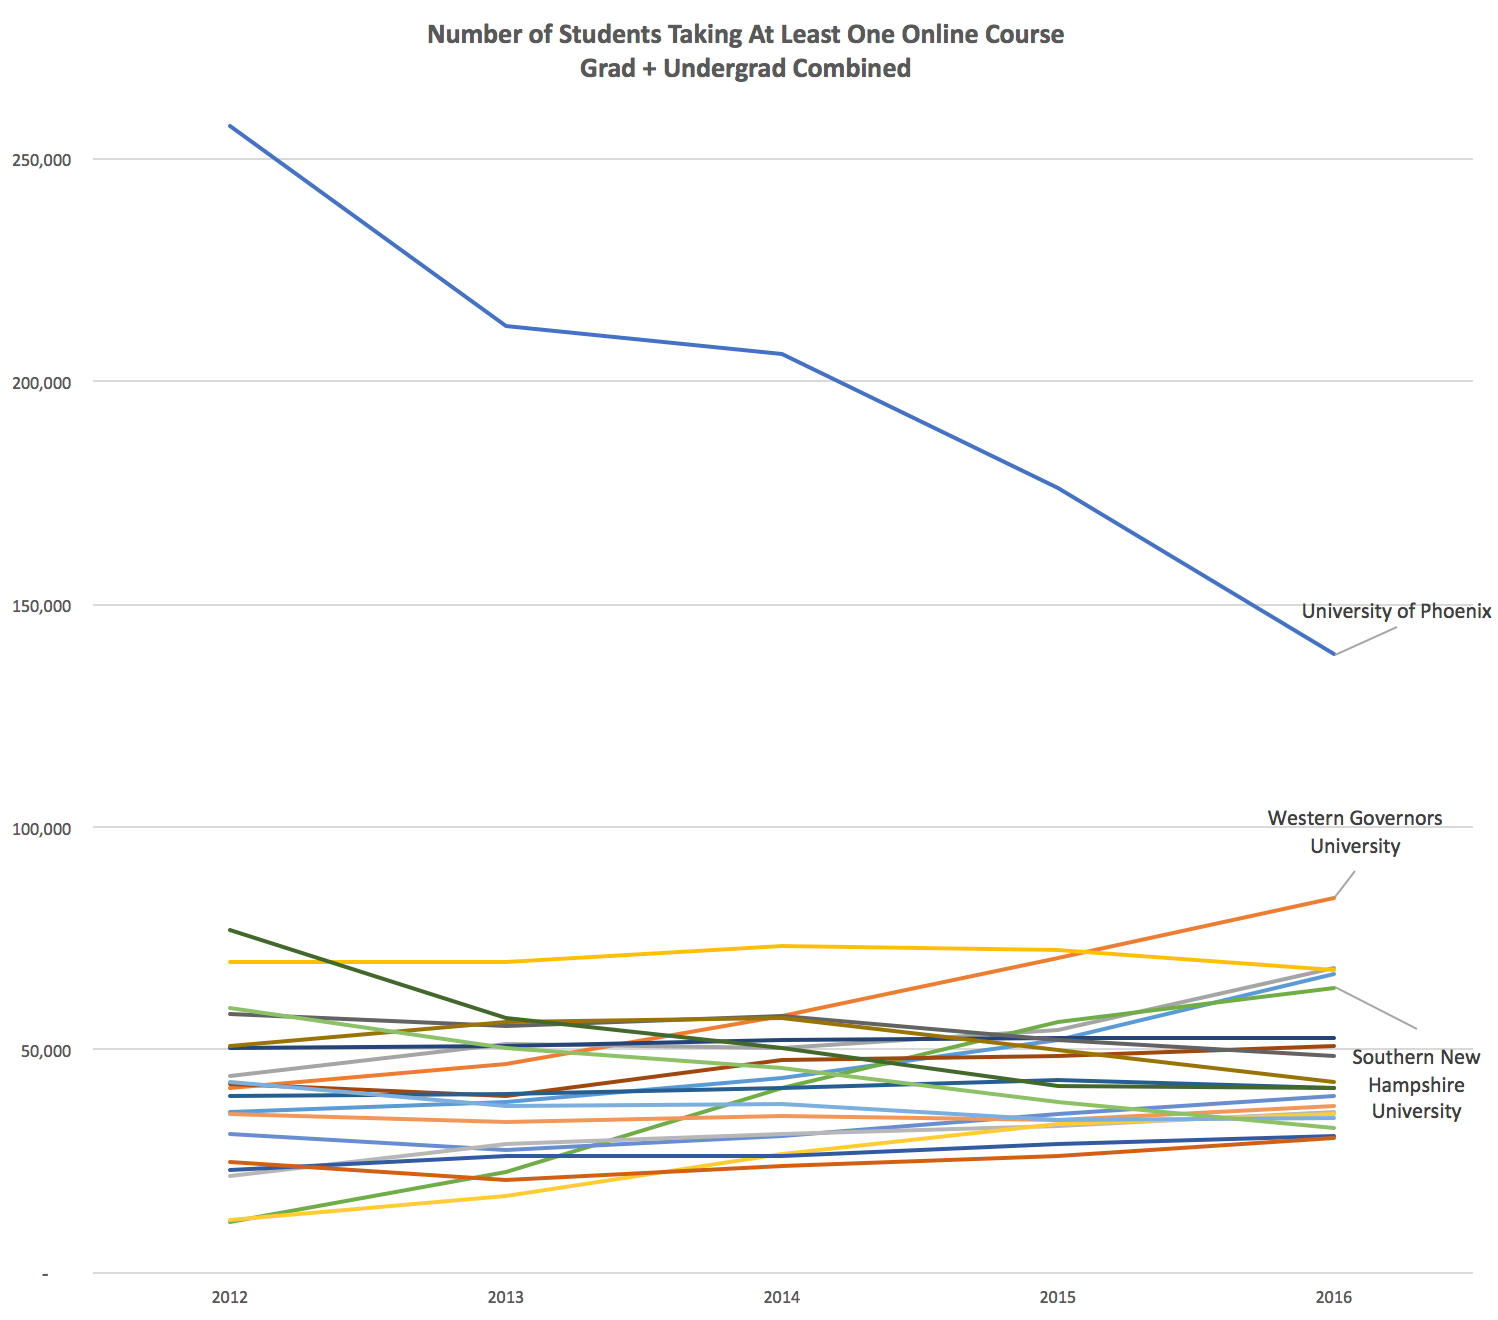
    One additional trend to capture is the dramatic change in the (previous) dominance of the University of Phoenix for overall and online enrollment. For perspective I have also labeled Western Governors University and Southern New Hampshire University.

    Top 20 Online Enrollment 2012 thru 2016