e-Literate

Present is Prologue

Tag: IPEDS

  • Fall 2016 IPEDS Data: New Profile of US Higher Ed Online Education

    Fall 2016 IPEDS Data: New Profile of US Higher Ed Online Education

    The National Center for Educational Statistics (NCES) and its Integrated Postsecondary Education Data System (IPEDS) provide the most official data on colleges and universities in the United States. I have been analyzing and sharing the data since the inaugural Fall 2012 dataset.

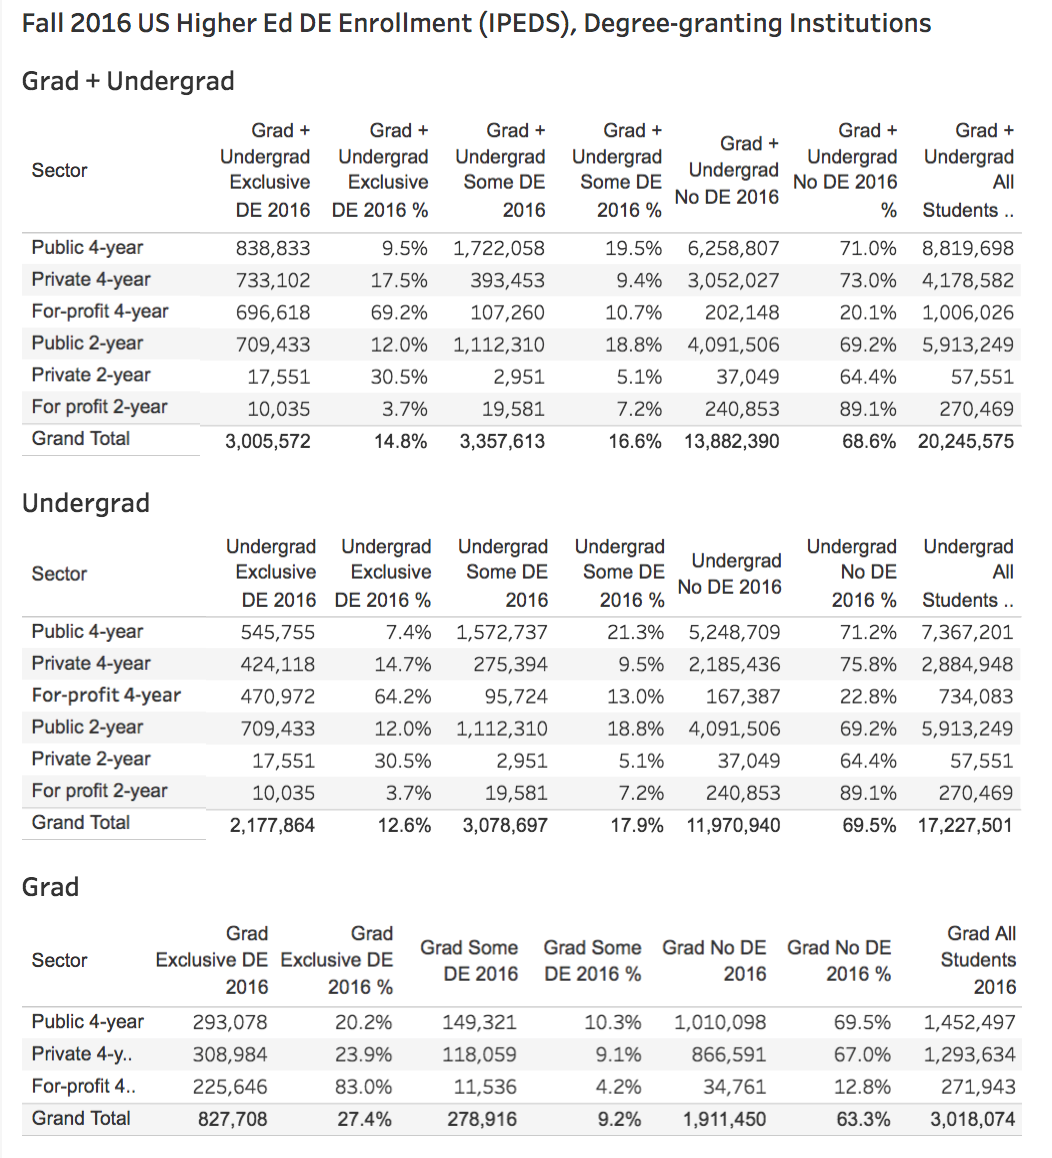
    Below is a profile of online education in the US for degree-granting colleges and university, broken out by sector and for each state.

    Please note the following:

    • For the most part distance education and online education terms are interchangeable, but they are not equivalent as DE can include courses delivered by a medium other than the Internet (e.g. correspondence course).
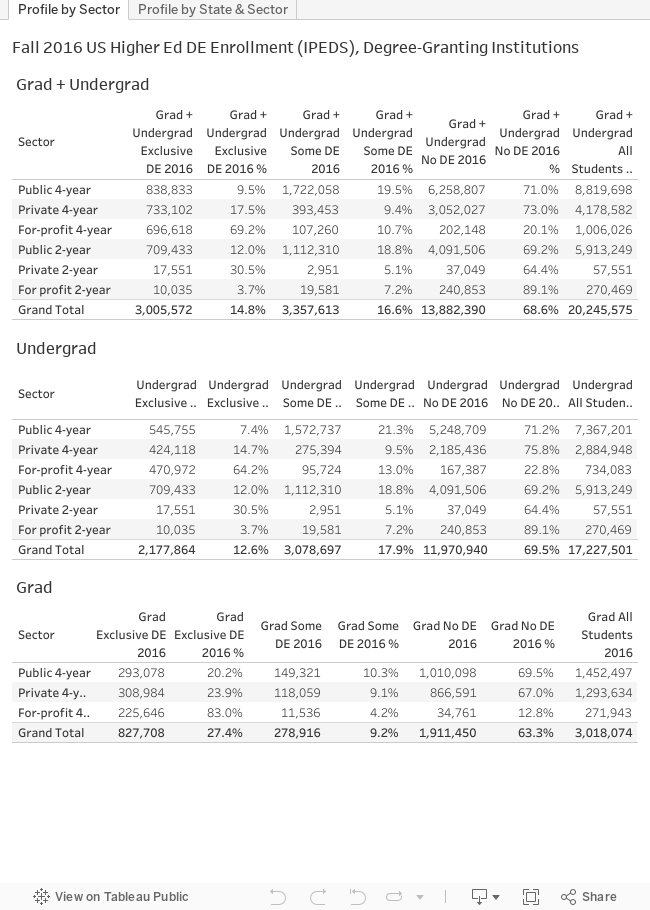
    • I have provided some flat images as well as an interactive graphic at the bottom of the post. The interactive graphic has much better image resolution than the flat images.
    • There are two tabs below in the interactive graphic – the first shows totals for the US by sector and by level (grad, undergrad); the third shows a map view allowing filtering by sector.

    Table of DE enrollments

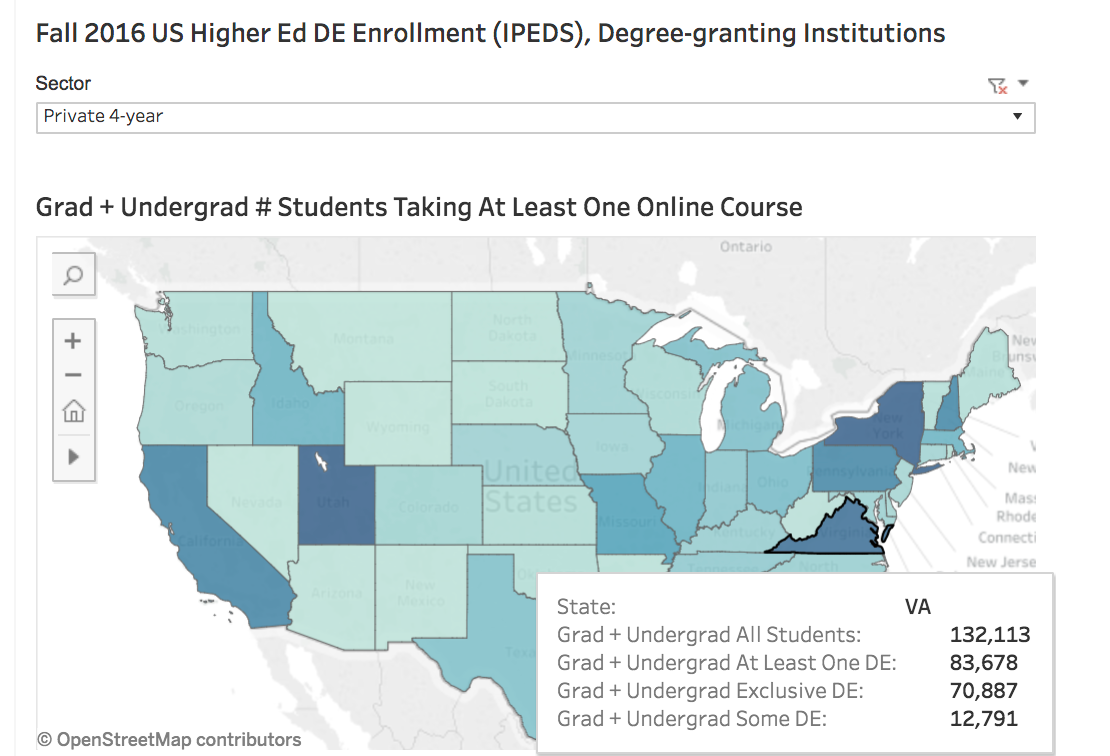
    There is also a map view of state data colored by number of, and percentage of, students taking at least one online class for each sector. If you hover over any state you can get the basic data. As an example, here is a view highlighting Virginia private 4-year institutions.

    State map view of DE enrollments

    Interactive Graphic

    For those of you who have made it this far, below is the interactive graphic, which can also be found here. Enjoy the data.

  • Fall 2016 IPEDS First Look: Continued growth in distance education in US

    Fall 2016 IPEDS First Look: Continued growth in distance education in US

    The National Center for Educational Statistics (NCES) just released its Integrated Postsecondary Education Data System (IPEDS) report and data on postsecondary enrollment in the US for the Fall 2016 term. This federal data has been tracking distance education (DE) since Fall 2012, and with the new release we get our first look at trends through last year. Accompanying the data is a report by NCES with summary data tables. For the following tables and chart, I took the same approach as the report, by simply filtering for US-only institutions participating in Title IV federal financial aid programs.

    Please note that this is a broader definition, with more schools included, that our previous analysis at e-Literate and the Digital Learning Compass report. Those posts and analysis further filter for 2-year and 4-year degree-granting institutions.

    When viewing data from this first look at 6,677 institutions and administrative units, please note the following:

    • For the most part distance education and online education terms are interchangeable, but they are not equivalent as DE can include courses delivered by a medium other than the Internet (e.g. correspondence course).
    • Exclusively DE means students who take all their courses online.
    • Some DE means students who take some but not all of their courses online.
    • At Least One DE is a combination of the above two categories, showing students who take at least one of their courses online.
    • No DE means students not taking any online courses.
    • The data totals used in the report are slightly off (0.07%) from what is in the data set that is the basis for my tables and chart below. I have not figured out this discrepancy yet, but it is immaterial for the big picture.

    For this first post, I am showing totals – institutions in all sectors, and a combination of student enrollment from graduate and undergraduate (4-year, 2-year, and less than 2-year) programs. I’ll break down by sector and level of study and even state in future posts.

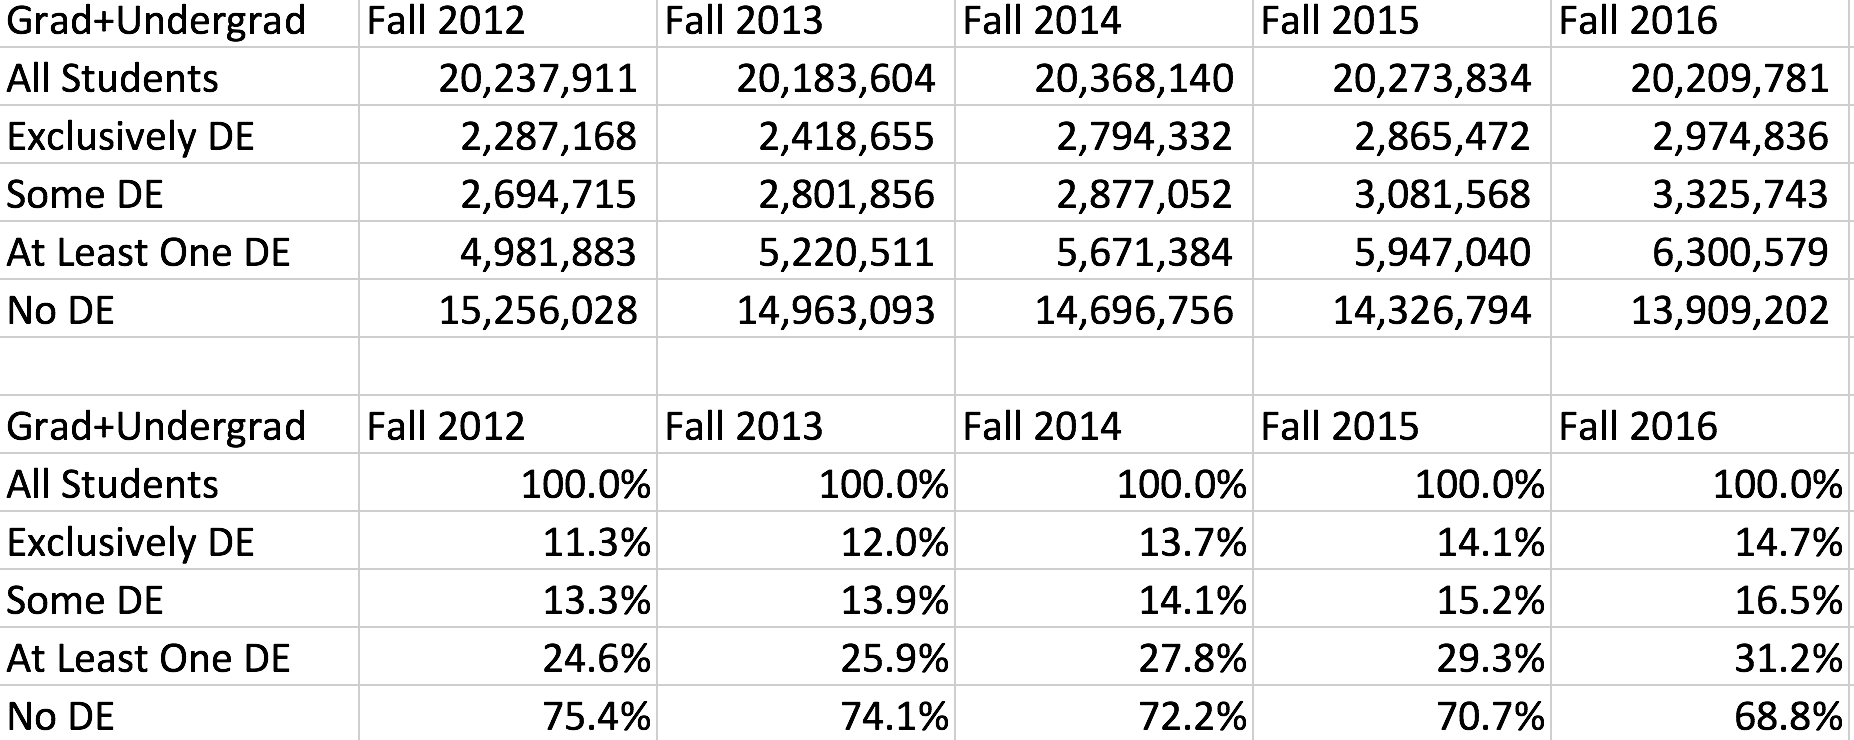
    With all those caveats in mind, here are data from Fall 2012 through 2016.
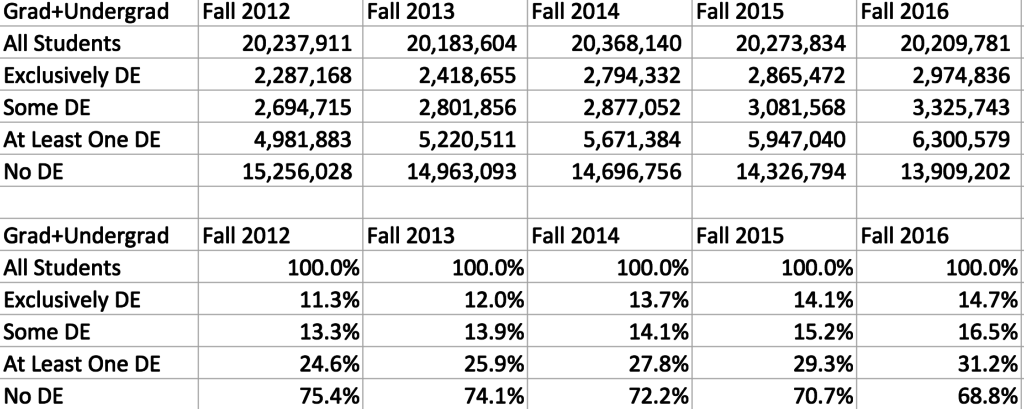
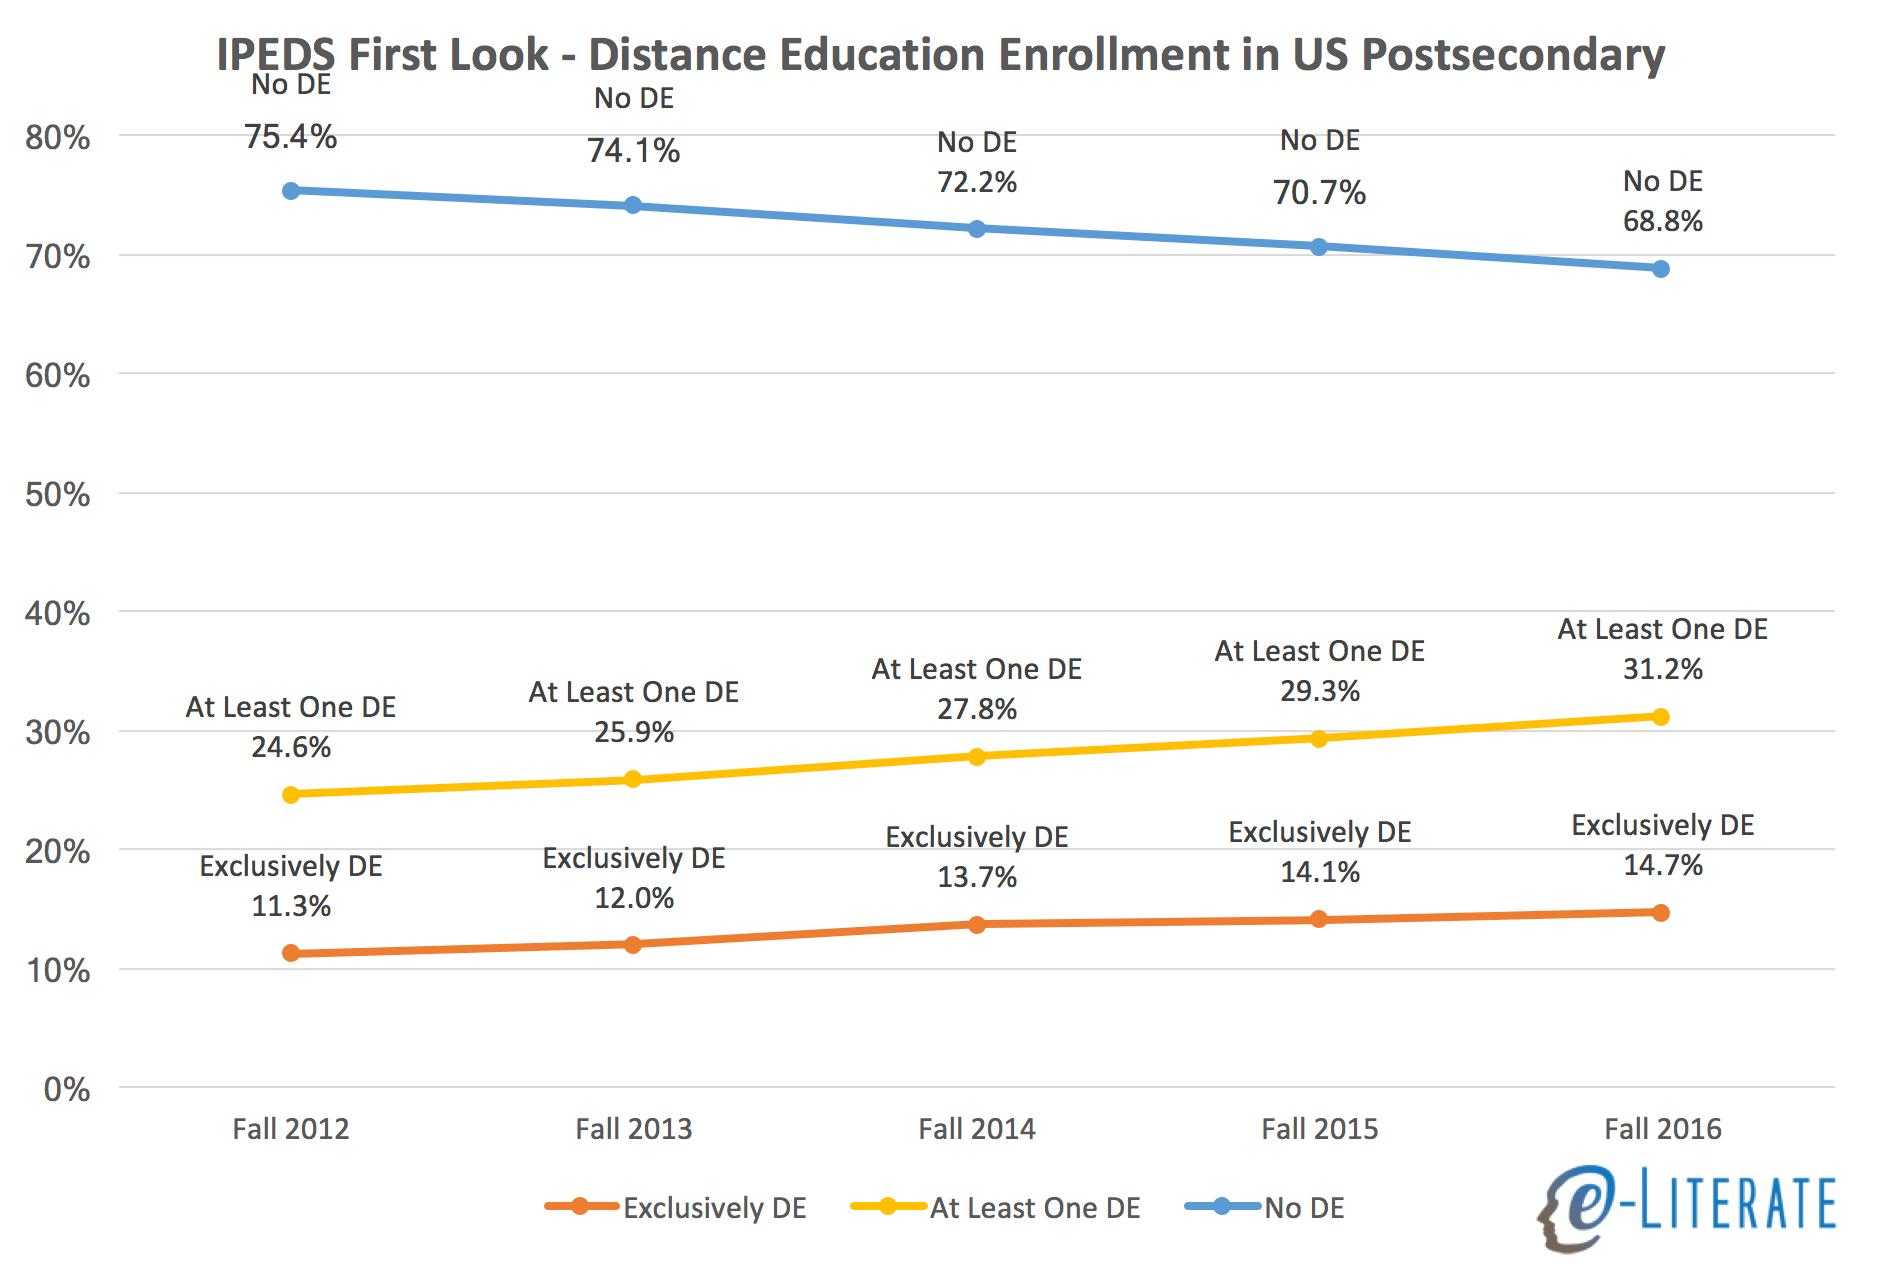
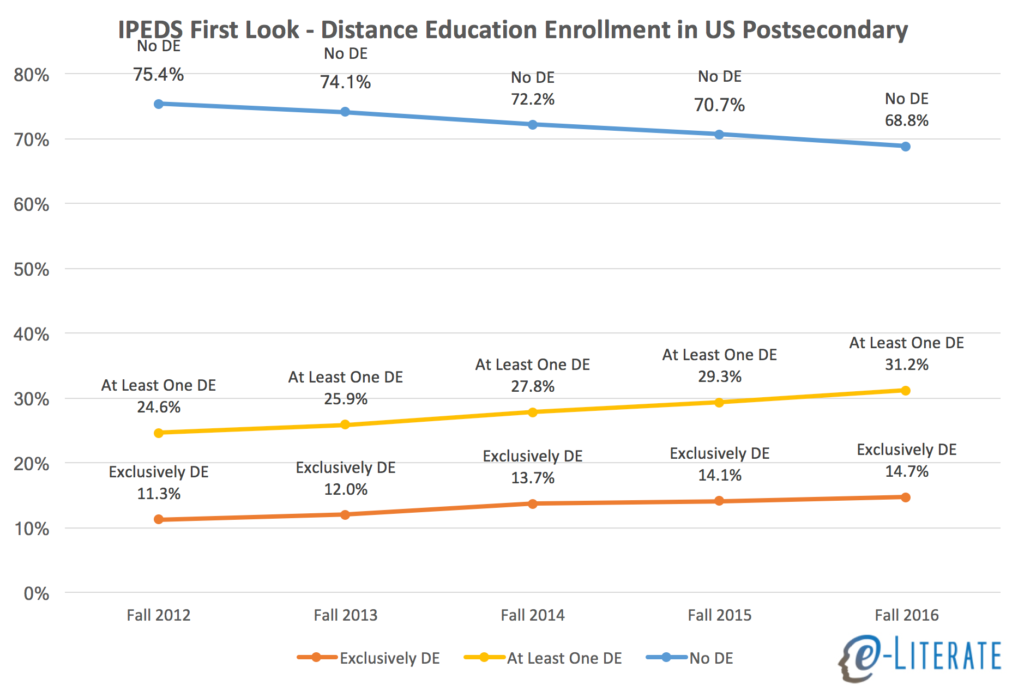
    Some observations of this data for Fall 2016:

    • There appears to be an small but noticeable acceleration in the growth of DE, going from 1.5% increase in percentage of students taking at least one online course from Fall 2014 to 2015, and a 1.9% increase from Fall 2015 to 2016. Although not shown in these tables, the acceleration appears in both undergraduate and graduate programs.
    • In the four-year period from Fall 2012 to Fall 2016, the share of students taking at least one online course increased by 27% (from 24.6% to 31.2%).
    • Note that this broad view of students (US, Title IV as only filters) does not capture the decrease in total enrollment shown in other IPEDS reports or National Student Clearinghouse reports.
    We’ll look deeper into the data and apply more consistent filtering to allow comparisons to our previous analysis. And we’ll break down by level of study, sector, and home state of institutions.

  • Do For-profit Institutions Converting to Non-profit Affect Distance Education Enrollment Numbers?

    Do For-profit Institutions Converting to Non-profit Affect Distance Education Enrollment Numbers?

    In a comment to my post on the new Digital Learning Compass report covering distance education enrollment trends for US higher education, Richard Garrett, Chief Research Officer at Eduventures and Director at The Observatory on Borderless Higher Education, asked an interesting question.

    I’d welcome your view on a related issue I’ve been wrestling with, namely how to treat for-profit institutions with significant numbers of online students that are now nonprofit. A number made such a conversion in the fall 2012-15 period, and more are to come (e.g. the EDMC and Kaplan announcements). In your study, did you use institutional control for the year concerned or continue to treat former for-profits as such? If the former, then I think it is worth pointing out that some of the private nonprofit growth, and for-profit decline, is due to control conversion.

    With all of the news around for-profit changes, include Corinthian Colleges, ITT, Kaplan University, DeVry rebranding, I thought it would be worth addressing this question in a new post instead of just in the comments as I suspect others may have the same question.

    tl;dr – There has been no material effect of these institutional control changes for the periods covered in the DL Compass report (Fall 2012 through Fall 2015). (more…)

  • Digital Learning Compass: New report on distance education higher ed enrollments

    Digital Learning Compass: New report on distance education higher ed enrollments

    The next generation of the long-running Online Learning Survey is here, and it is now called Digital Learning Compass. Originally known as the Sloan Survey of Online Learning, then known as the Online Learning Survey, this study led by Jeff Seaman and Elaine Allen from the Babson Survey Research Group (BSRG) has been the definitive source for understanding the state of online learning for higher education in the United States since 2003.

    Three years ago the Department of Education’s Integrated Postsecondary Data System (IPEDS) started releasing census-based data on online enrollments, starting with the Fall 2012 term. The most recent data set is from Fall 2015, and today’s release of the Digital Learning Compass: Distance Education Enrollment Report covers this new data. Download the full report for free here. (more…)

  • Digital Learning Compass: New WCET webcast on distance education enrollment trends

    Digital Learning Compass: New WCET webcast on distance education enrollment trends

    This Wednesday, April 19th, at 11am PDT / 2pm EDT I will be participating in a WCET webcast based on the latest National Center for Educational Statistics (NCES) and its Integrated Postsecondary Education Data System (IPEDS) data for the Fall 2015 term on distance education (DE) enrollment.

    final-logo

    Register today for “Distance Ed Enrollment Trends: New Data, New Trends, New Partnershipon April 19 at Noon MDT. The webcast will run for 60 minutes and take place via GoToWebinar.

    April 19
    8:00 AM HAST /10:00 AM AKDT/ 11:00 AM PDT and MST/ Noon MDT / 1:00 PM CDT/ 2:00 PM EDT

    (more…)

  • Recommended Reading: IHE coverage of NBER paper and critiques

    Recommended Reading: IHE coverage of NBER paper and critiques

    For those following my two recent posts about the National Bureau of Economic Research (NBER) working paper claiming to analyze “The Returns to Online Postsecondary Education”, there are two articles I recommend for broader coverage – both from Inside Higher Ed. The first article is “Online Ed’s Return on Investment”, where Carl Straumsheim summarized the report itself as well as early critiques from me, Russ Poulin from WCET, and Jeff Seaman from Babson Survey Research Group.

    “Even a quick check with one of the databases they did use … would show they are off on their counts and should have made them rethink their assumptions,” Poulin said in an email.

    Jeff Seaman, co-director of the Babson Survey Research Group, called the methodology “seriously flawed.” The Babson Group previously produced annual reports on the size of the online education market but began to focus more on in-depth surveys after the federal government began collecting and reporting online enrollment data.

    The second article, titled “Impressions of the Hoxby Study of Online Learning”, came out today where Doug Lederman asked for impressions from a dozen higher ed observers. Most observers were critical of the data issues as we have noted at e-Literate, but there were a few with positive reactions. I think that Deb Adair (from Quality Matters) has an excellent response, concluding with the following [emphasis added]: (more…)

  • One More Thing on NBER Report: Where did pre-2011 data come from?

    One More Thing on NBER Report: Where did pre-2011 data come from?

    Earlier today I critiqued the new National Bureau of Economic Research (NBER) report on the “The Returns to Online Postsecondary Education”, calling it “a hot mess that that conflates online students, enrollments, programs, institutions and uses a bizarre and misleading data set for its analysis”. That post looked mostly at the interpretation of Integrated Postsecondary Education Data System (IPEDS) data to define which institutions were exclusively online or substantially online based on the author’s definition. But this report has a bigger flaw that I initially missed – it shows historical data on online enrollments from the late 1990s and claims to analyze in detail online enrollment data from 2009 – 2014, yet IPEDS did not collect distance education data until 2011.

    (more…)