e-Literate

Present is Prologue

Tag: learning analytics

  • Desire2Learn Analytics Follow-up

    A few weeks back, when blogging about Desire2Learn’s new Student Success System retention early warning analytics product, I wrote,

    From what I can tell based on initial conversations with D2L about the product details, this now appears to be the system to beat. (I reserve the right to change my opinion based on implementation experiences from clients, which are particularly important for this product.)…

    I’m going to try to talk to some D2L clients who are actually using this product next week when Phil and I are at D2L FUSION.

    And then the other day, describing my overall impressions of the FUSION conference, I wrote,

    Historically, my take on D2L has been as follows: On the good side, they have coherent product vision and their own take on the LMS space—I have a lot of respect for Ken Chapman as a product guy—and good relationships with their customers….On the bad side, D2L has not always been particularly good at executing technically difficult projects, and they have not always had a good sense of how well they are performing in that regard—what they have achieved, how long it will take them to deliver functionality, how serious the problems are, and so on….

    [T]he point is that D2L seems to be making hires that have the potential to shore up their historic weaknesses. In the next 12-24 months, we will see whether these new hires are empowered to make a real difference in D2L’s performance.

    It turns out that analytics is a perfect example the overall problems I described in the latter post: good product vision, serious technical implementation problems that have been understated and probably underestimated, and relatively new technical managers that seem to have some hope of getting the issues straightened out.

    (more…)

  • Desire2Learn’s Analytics Product Looks Very Good

    I’ve been super-busy with a consulting gig over the last few weeks and have fallen off the wagon with my blogging. This is one of the many reasons that I am grateful to have Phil as my prolific yet profound co-publisher and that we have attracted a group of terrific featured bloggers.

    Anyway, I thought I would get back to business with a long-overdue post about D2L’s learning analytics product, called “Insights.” There are several pieces to the product, but I’m going to focus on the component that they call the Student Success System. I have blogged from time to time on Purdue’s Course Signals project, (now commercialized in an offering from Elucian), as having set the bar for student retention analytics. More recently, I wrote about Blackboard’s Retention Center, which is clearly following in Purdue’s footsteps. My impression of Retention Center is that it is a reasonable Version 1 product that captures some but not all of the value of Course Signals.

    D2L’s Student Success System also follows in Purdue’s footsteps. But rather than simply playing catch-up, I would call it an incremental but meaningful improvement over Course Signals in most aspects. From what I can tell based on initial conversations with D2L about the product details, this now appears to be the system to beat. (I reserve the right to change my opinion based on implementation experiences from clients, which are particularly important for this product.)

    (more…)

  • Knewton (Quietly) Pivots

    Knewton CEO Jose Ferriera has an interesting and revealing blog post up about “the coming adaptive world.” In part, it is a response to a report on adaptive learning by Education Growth Advisors. Jose writes, “Despite our constant protestations to the contrary, observers often confuse Knewton with the many adaptive learning app makers who are now popping up. Or they confuse app makers with platforms. Or they think we’re all competitors.” It’s a bit of a red herring, since the report does distinguish between platform and publisher business models. That said, the meaning of the distinction between these two categories isn’t drawn terribly clearly, and it’s fair for Knewton to try to clarify its market positioning. But in doing so, Jose reveals what appears to be a shift in their thinking about the market for a platform like theirs which tells us something important about the ed tech market in general. (more…)

  • If you like learning, could I recommend analytics?

    There’s something that drives me a little crazy when I hear about how someone has learned from Netflix, Amazon, Google, etc., and that they’re going to be the Netflix, Amazon, Movie Box or Google of education.  Actually there are a few things.

    There is a natural tendency to want to leverage the work of others.  In the burgeoning space of learning analytics many look to those who have large data sets and algorithms to extract some kind of meaning from those massive stores of information.  We should always be looking to leverage when we can!  This time, though, our takeaways are limited.

    (more…)

  • Blackboard’s New Early Warning Analytics Product

    A couple of weeks ago in my post about the different types of learning analytics, I described retention early warning systems thusly:

    Most people don’t think about early warning systems as being in the same category as adaptive analytics, but if you consider that “adaptive” really just means “adjusting to your personal needs,” then a system like Purdue’s Course Signals is, in fact, adaptive. It sees when a student is in danger of failing or dropping out and sends increasingly urgent and specific suggestions to that student. It does that without “knowing” anything about the content that the student is learning. Rather, it’s looking at things like recency of course login (Are you showing up for class?), discussion board posts (Are you participating in class?), on-time assignment delivery (Are you turning in your work?), and grade book scores (Is your work passing?), as well as longitudinal information that might indicate whether a student is at-risk coming into the class. What Purdue has found is that such a system can teach students metacognitive awareness of their progress and productive help-seeking behavior. It won’t help them learn the content better, but it will help them develop better learning skills.

    Well, last week, Ray Henderson announced Blackboard’s new Retention Center and described it as follows:

    The Retention Center gives critical insight on learning and activity gaps to instructors, within the LMS, that helps them quickly diagnose students that are falling behind. Pre-configured and automatic so they don’t have to hunt for it. No set-up: it automatically calls out students that are at risk while instructors still have time and space to do something about it. With the feature instructors can see:

    • Who’s logging in: this is a simple but powerful predictor of student success. Instructors see how long it’s been since students have logged in to the course and how many have been away for five days or more. And not by fishing through student profiles or reports but in an automatic view complete with red flags where they’re needed.
    • Whether they’re engaged: which students have had low levels of course activity, at 20 percent or below the average in the last week.
    • Whose grades are suffering: which students are currently trending at 25 percent or more below the course average so they can target extra help to where it’s most needed – even when it isn’t asked for.
    • Who has missed deadlines: instructors might know this anecdotally or on a case-by-case basis, but now they can get a real-time view of all students that have missed one or more deadline.

    Eerily similar, no? A number of years back, when I pressed Course Signals inventor John Campbell on which factors in the LMS are most highly predictive of student success across different courses, he named exactly these four. The only surprise here is that this isn’t a common analytics feature of every LMS and courseware platform on the market yet. Purdue proved that their value in helping at-risk students is high. I’m glad Blackboard is stepping up.

    The one piece that’s missing is a simple standard where an SIS or other longitudinal data system could pass an at-risk “credit score” to the early warning system to modify its sensitivity. If a student on the honor roll drops off the radar for a week, it’s less of a cause for concern that a student on academic probation (for example). I tried to push this idea for a standard at the IMS a few years back but got nowhere with it at the time. I hope that Blackboard will push for something like it now that they have a system to take the data.

  • A Taxonomy of Adaptive Analytics Strategies

    I almost never quote a blog post in its entirety, but this one from Dan Meyer is so good that I just can’t bear to cut a single word:

    Stephanie Simon, reporting for Reuters on inBloom and SXSWedu:

    Does Johnny have trouble converting decimals to fractions? The database will have recorded that – and may have recorded as well that he finds textbooks boring, adores animation and plays baseball after school. Personalized learning software can use that data to serve up a tailor-made math lesson, perhaps an animated game that uses baseball statistics to teach decimals.

    Three observations:

    One, it shouldn’t cost $100 million to figure out that Johnny thinks textbooks are boring.

    Two, nowhere in this scenario do we find out why Johnny struggles to convert decimals to fractions. A qualified teacher could resolve that issue in a few minutes with a conversation, a few exercises, and a follow-up assessment. The computer, meanwhile, has a red x where the row labeled “Johnny” intersects the column labeled “Converting Decimals to Fractions.” It struggles to capture conceptual nuance.

    Three, “adores” protests a little too much. “Adores” represents the hopes and dreams of the educational technology industry. The purveyors of math educational technology understand that Johnny hates their lecture videos, selected response questions, and behaviorist video games. They hope they can sprinkle some metadata across those experiences — ie. Johnny likes baseball; Johnny adores animation — and transform them.

    But our efforts at personalization in math education have led all of our students to the same buffet line. Every station features the same horrible gruel but at its final station you can select your preferred seasoning for that gruel. Paprika, cumin, whatever, it’s yours. It may be the same gruel for Johnny afterwards, but Johnnyadores paprika.

    Dan captures most of what I was trying to get at with my rant on the big data hype, but much more clearly and succinctly. Points two and three are the most salient here. First of all, the sort of surface-level analysis we can get from applying machine learning techniques to the current data we have from digital education system is insufficient to do some of the most important diagnostic work that real human teachers do. Think about the math classes is which you had to show your work on your homework. Why was that important? Because the teacher needs to see not only what you got wrong but why you got it wrong. Teachers generally don’t just say, “You got three out of five problems involving converting decimals to fractions wrong. Go study some more.” They sit down and work through the problems with the student to find the source of the errors. It’s really hard to get computers to do this well, even with highly procedural domains like math. (Forget about, say, literary analysis.) So in the vast majority of cases, we don’t even try to design systems where students show their work. And without the step-by-step data, no fancy algorithm is going to teach Johnny.

    Second, if the problem is that your content isn’t what the student needs, no fancy algorithm is going to fix that either. Videos are a prime example. I know of one textbook publisher whose teacher customers report that students won’t watch the publishers’ videos, but they can and do find videos on the same topic on YouTube and share them with each other. Think about that. Video-based pedagogical support is valuable enough to the students that they will expend energy searching for videos and sharing them. But they reject the expensive, carefully crafted videos from the publisher that are served up to them on a silver platter. It’s not that the publisher-supplied videos are necessarily “bad” in the sense that they have poor production qualities or are unclear or factually inaccurate. But the students have a particular use in mind for the videos. Maybe they’re struggling with a particular homework problem and just need a quick walk-through of a technique so that they can see the step that they are missing, for example. If the video doesn’t fit their needs—both utilitarian and aesthetic—then it won’t get used. Serving it up adaptively isn’t going to help that problem.

    That said, it’s worth taking a little time to break down the different types of adaptive learning analytics into a couple of categories and see just what we should and should not reasonably hope to gain from them.

    (more…)

  • Open Secret: Pittsburgh’s Ed Tech Revolution

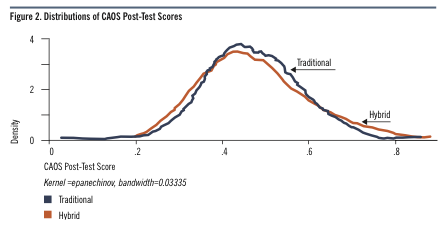
    Generally when we talk about goals for educational technology, we talk about one of two things: improving access or improving effectiveness. Rarely do we get an opportunity to talk credibly about an innovation that can move both of those needles at the same time. And yet, I saw just such innovation in Pittsburgh this week at the LearnLab Corporate Partners Meeting. LearnLab, jointly run by Carnegie Mellon University and the University of Pittsburgh, is not widely known in ed tech circles. However, it’s close cousin OLI is. For example, an independent study by ITHAKA S+R made a splash when it showed OLI could cut instructional time in half and still achieve the same level of effectiveness. Two groups of students across six different public universities took the same introductory statistics class. The first group took a traditional version of the class, with an average of 3 hours per week spent in the classroom. The second group took a hybrid version, where they spent one hour a week in the classroom and some time studying independently with the OLI cognitive tutoring software. So that second group spent one-third of the time in the classroom, which amounts to a very significant cost savings and an opportunity to teach more students for less money. Students themselves spent more time on homework in the second group than the first, but even so, they spent 25% less total time on the class than the ones in the traditional class. And yet, both groups achieved essentially the same competence at the end of the class:

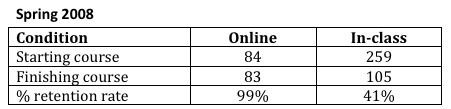
    To sum up, OLI was able to teach more students at lower cost and with less time on task from the students yet with the same effectiveness of a traditional class. Another, smaller study with similar traditional vs. cognitive-tutor-hybrid for an introduction to logic course found that while students in the hybrid condition saw a small (though not statistically significant) gap in learning effectiveness relative to their peers, they achieved more than double the completion rate:

    OLI is pretty well known in the broader ed tech community. They show up at conferences. The ITHAKA study got lots of play. I find it odd that we have not had a broader conversation about how they have achieved their results. Because the techniques developed by OLI, their colleagues at LearnLab, and their collaborators in other institutions have serious implications for OER, MOOCs, the textbook industry, and really, the future of education.

    (more…)