D2L the company and Brightspace the company’s LMS are undergoing something of a revival in the past year. It’s not as if they have dropped in terms of market share – in fact the have a history of strong client retention, losing few customers – but the early 2010’s did not lead to rapid customer growth as they had expected after raising two rounds of a combined $165 million in 2012 and 2014. If you read that second post you’ll find that I stated that their growth claims “defied logic” at the time. Recently, however, D2L is on a roll, racking up significant client wins in higher education, and the company shows real signs of change and its ability to truly listen to and empathize with customers.
As I sat down to write my analysis of the D2L Fusion users conference and what it meant to the Brightspace LMS, I noticed that several of the same themes I described last year applied to this year’s observations – just updated in terms of effect on customers and whether the changes seem to be sticking. To explain my current thoughts it is useful to start with commentary from last year.
Update on Listening and Product Changes
From last year’s post:
As I have described to several executives at D2L, there is an interesting gap between the progress we have seen with the company’s product improvements and the reaction we hear from many of their customers. With the tighter integration with LeaP and the improved usability, particularly in content authoring, I would have expected to hear more customers react to the changes. But when talking directly to many of the institutions using the Brightspace LMS, staff describe D2L as if the company and product line had not changed in several years. What is not clear is whether this gap is due the company missing the mark (and my judgement of improvements not aligning with what colleges and universities want) or whether there is just a lag where it will take time for most customers to believe in and take advantage the new product designs and features.
2016 has been an eventful year for D2L. [Chief Operating Officer] COO Cheryl Ainoa, a longtime veteran of Yahoo! and most recently Intuit, joined the company in April. Although this move was not advertised through press releases or even blog posts, I believe this is a significant change to how the company operates. [snip]
And this gets back to the gap noted in the first paragraph. When I talk to people at schools migrating from D2L or considering whether to migrate, I do not hear much about the recent product changes or the new management described above. For several of these schools, the issue isn’t even whether they like or dislike the recent product and management changes, it’s as if these changes are a non issue in their decision-making. No conclusions yet, just noting the gap.
What I noticed since last year are two updates to the above analysis.
Listening – Besides adding a new COO, D2L has made several other executive-level hires in the product in the past two years, and to me it seems like we are seeing a new way of thinking largely caused by this new group. The interviews with executives were much more consistent than in past years, and there is a new focus on actively listening to customers. It’s not that D2L didn’t have conversations before; it’s more that they didn’t know how to truly listen and empathize.Part of this change according to D2L exec interviews was that in the past it was easier to talk to CIOs, but now they are learning how to talk to faculty and end users. All interviewees seemed to be singing from the same hymnbook. For the most part.
Narrow but Excellent – The product focus is less on big-news features and more on small-news everyday items. In the past D2L has seemed too interested in being able to do some chest-thumping “We’ve got CBE. We’ve got Predictive Analytics. We’ve got Adaptive Learning.” while missing something on what current and even prospective customers need in their daily lives. The new focus is more on taking the drudgery out of end-user activities with a mantra of “narrow but excellent”. They are trying to fall in love with problem solving more than in features, even if these problems can be non-sexy.
One example from the Fusion users conference was making it easier to shuffle questions within a quiz. Sounds trivial, but Canius College staff have a description that captures the essence of the change. Yes, you could have done this before, but it was a chore. Now it’s much easier to the point that more people will want to use it.
Later this month, D2L will introduce a nice feature for Canisius faculty who use their online quiz/exam tool. D2L’s quiz engine has powerful features for randomizing question order in a quiz or exam, and can even deliver a subset of questions at random from larger question banks. This is nice, but until now it was a bit of a chore if you only wanted to randomize delivery of, say, five to ten questions, since you needed to install those questions in the question library, and then import them into a random section within the quiz. Along the way, there were a lot of clicks and the process wasn’t always so intuitive. With the update coming late July, D2L has installed a checkbox feature within the quiz editor: “Shuffle order of questions at the quiz level.” Simply add your questions directly in the quiz, click that box, and the quiz will deliver those questions in a random order to each student.
The Brightspace product demonstrations during the conference keynote got significant spontaneous reactions from crowd (along with hallway discussions) likely reflecting this improved ability to listen
to customers. And the improvement to quiz question shuffling led to one of the biggest reactions.
Here are the major product announcements / new functionality as of this summer:
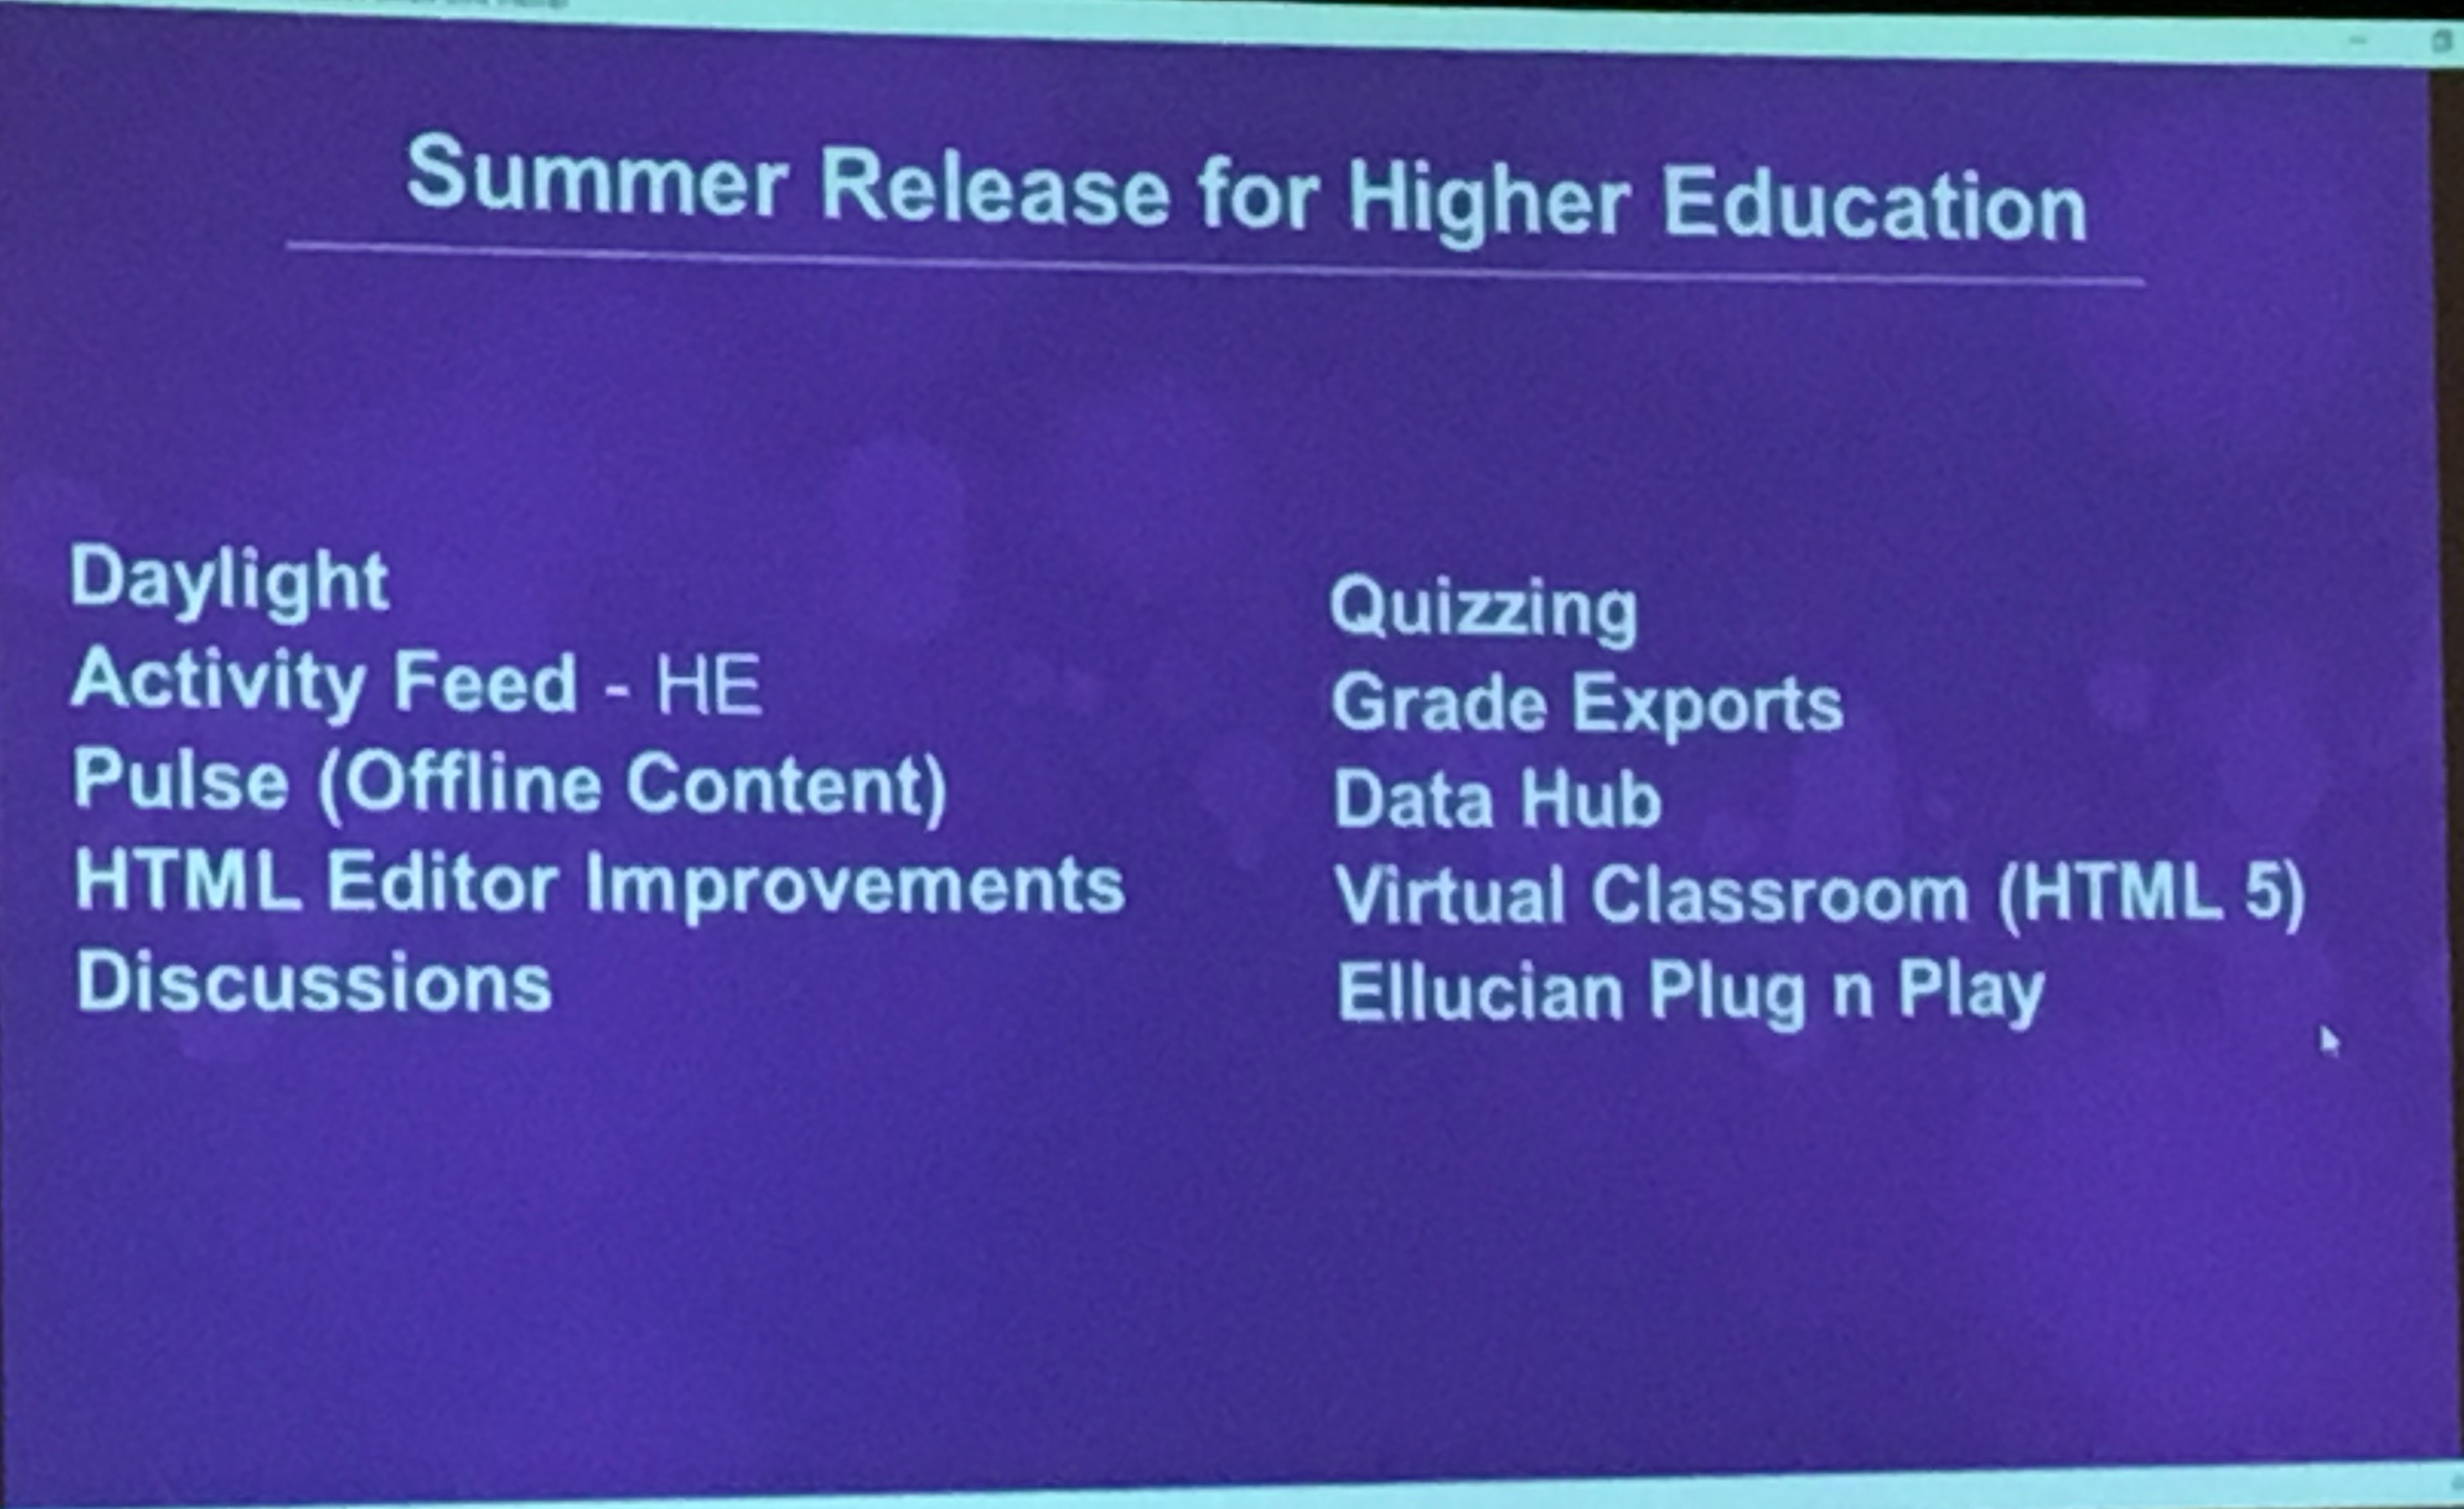
Another product change worth noting is the new Data Hub. This is a re-architecture of how data can be exported to allow bulk access to data, either manual or through application program interfaces (APIs). The announcement is significant as we have noted in the past that D2L has had challenges getting data reliably and quickly to customers. Data export is not an easy problem to solve due to the complex technical challenges involved in analytics, and D2L had its share of customer challenges several years ago. However, we heard from at least one customer with early access to the Data Hub that their situation is improving. Sounds trivial, but this could be significant. We will have to keep a close watch on this development.
Update on Market Share
In last year’s post I noted:
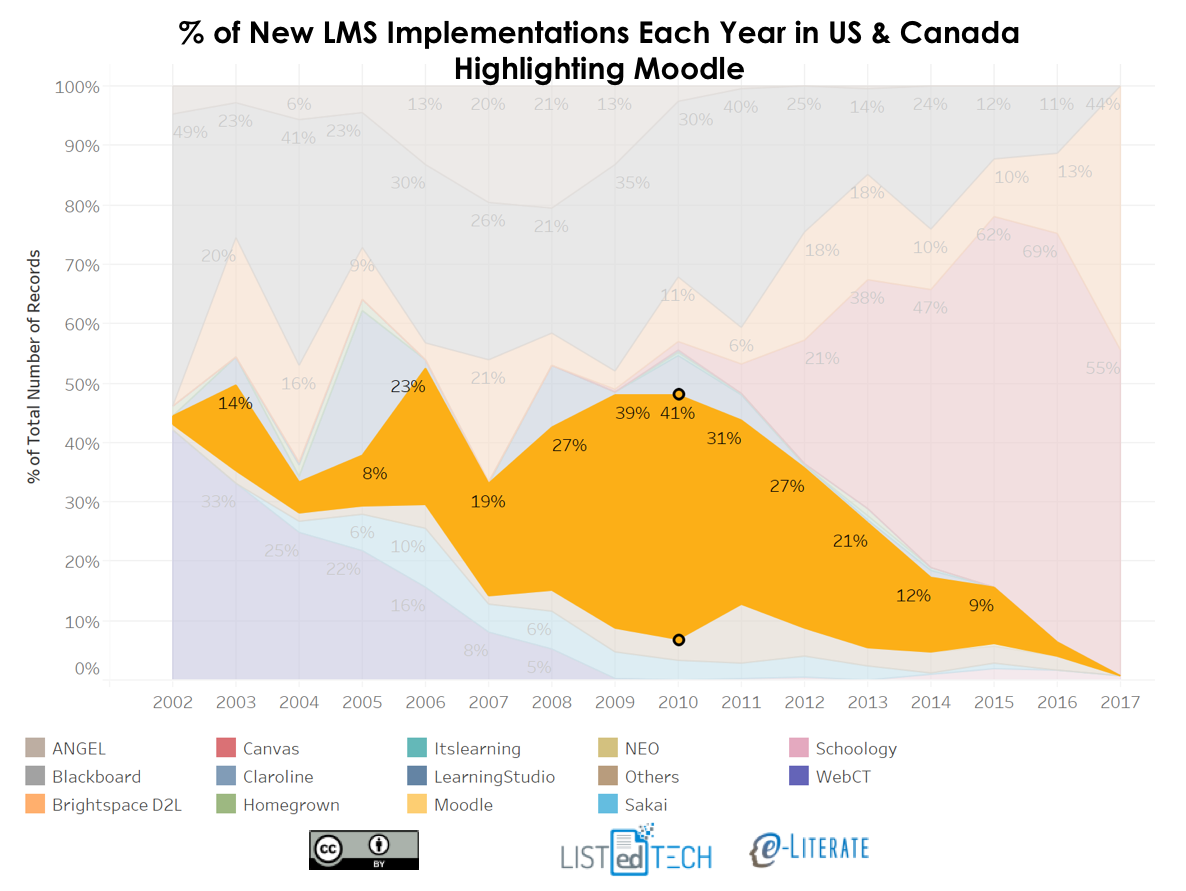
On the sales front, D2L has experienced somewhat slow but steady growth in new US / Canadian higher education clients as seen below, but they have not had the big-name wins of the caliber of UMUC, Tennessee Board of Regents, University System of Georgia, as they had 2013 and earlier.
They had won Kaplan University as of last year, but since then they’ve also won with EDMC, Saint Leo University, University of Cardiff, University of Ottawa, Bournemouth University, and most recently Southern New Hampshire University (SNHU), among others. In other words, over the past 12 months D2L has won several big-name accounts in higher education. ((Disclosure: I advised UMUC during their strategy and evaluation process in 2011-2012. Bournemouth, SNHU, and D2L are subscribers to our LMS market analysis service.))
The net effect has been a dramatic uptick in the percentage of new implementations (schools switching from another LMS to a new one) for D2L. The following chart looks at new implementations in North America (US and Canada) and Europe highlighting the top four academic LMS solutions (Blackboard, Moodle, Canvas, D2L) in half-year increments, with a remarkable spike in D2L’s activities in the past 12 months.
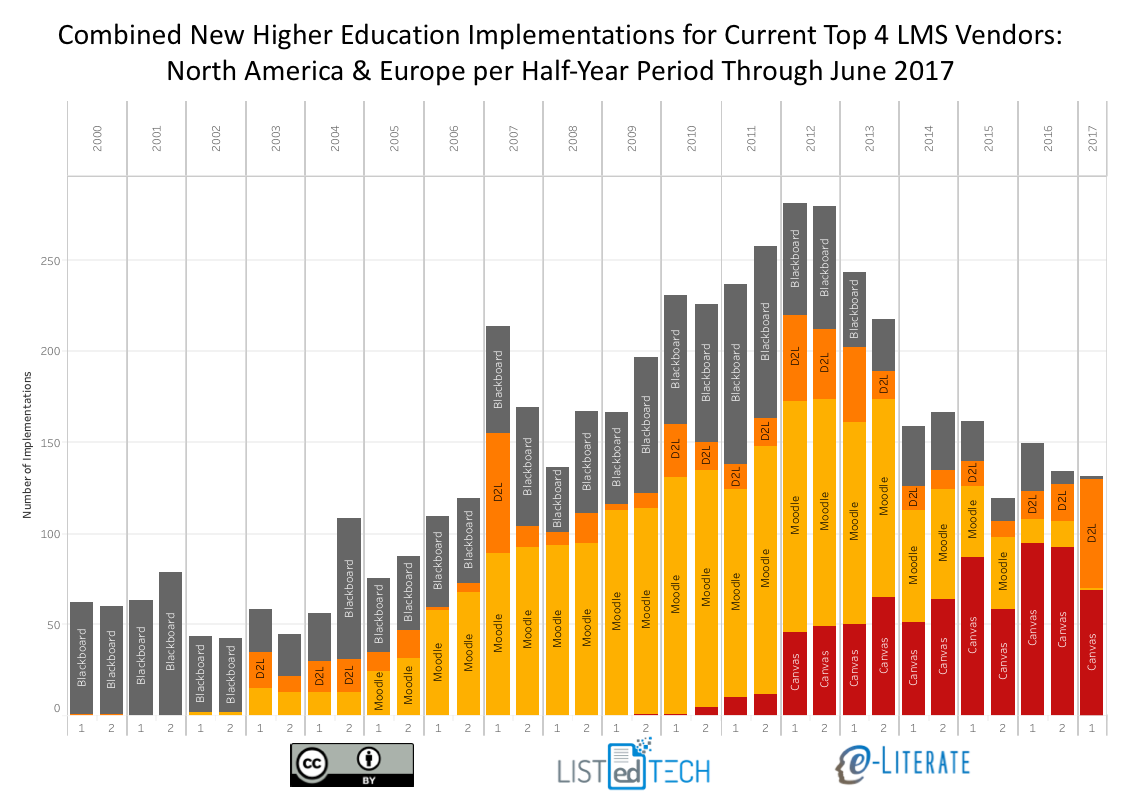
This data aligns with our anecdotal conversations where, more often than not, there seems to be a pattern of new implementations going to Canvas or D2L – an emerging two-horse race for new implementations.
Part of the reason for the recent acceleration and for the unknown future is the fact that quite a few of D2L’s wins for Brightspace have been large systems (single decision affecting multiple campuses, e.g. Kaplan University) or large enrollment single institutions (e.g. SNHU). And many of these are for schools with large, centrally-managed online operations. The large systems have benefitted from the Pearson LearningStudio (aka eCollege) end-of-life forcing many for-profit systems to change LMS, with that activity mostly running its course by the end of this calendar year. Big wins, but quite dependent on a small number of deals.
The recent win at SNHU is very important to understand, however. It is not driven by end-of-life (SNHU moving off of Blackboard Learn in a voluntary migration), and this comes from a long-time Blackboard customer. Quite often people equate SNHU with its College for America (CfA), one of the leading competency-based education (CBE) programs in the country. But SNHU is much bigger than CfA, and it is the fastest-growing university in North America overall. According to an article last year in EDUCAUSE Review, SNHU’s online enrollment has grown at 253% per year over the past several years.
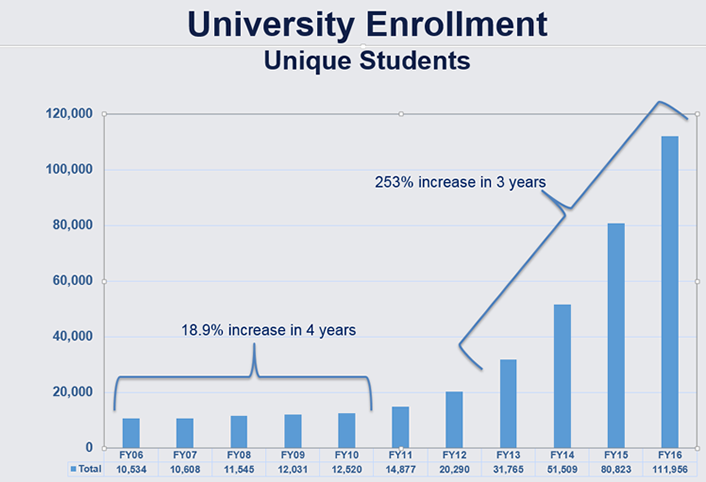
It certainly seems probable that this increase in market wins is related to the change in how D2L listens to customers and the resultant change in emphasis from big-news capabilities towards smaller-news but customer-pleasing improvements to everyday functionality. It is important that Brightspace has such a deep feature set, but have the company understand customer everyday needs is more important.
What we do know is that D2L has increased its number of higher education wins over the past 12 months. What we don’t know is whether and how strongly this trend will continue.
Update on Conference Attendance
This was the first on-site Fusion visit we’ve had in a couple of years, leading to the title and commentary in last year’s post “Changes at D2L: A second-hand view from users conference”:
The reason I titled this post as a second-hand view is that D2L is the only major LMS provider (and I include Moodle and Sakai here) that discouraged our participation in their users conference (and we did not attend), citing concerns over direct conversations with attendees without getting their permission first. Other providers are happy to allow and even encourage this type of interaction. In the nature of full disclosure, we think it is important for the reader to understand this difference in access.
Michael and I value the ability to not just hear official presentations and get in-depth demos, but to also go, roam, and talk to customers.
True to their word, D2L management have changed their approach on how analysts can be involved in their conference. This year we were invited to attend (along with others), and more importantly, we were allowed to freely talk to the users and prospective users at the conference. I even had several people from D2L pass me in the hallway and ask if I was getting the access to customers that I needed. I did.
This change aligns with the aforementioned improvements and focus on how D2L as a company listens to customers. Less control and more desire to learn (sorry, couldn’t help myself). A welcome change.
Open Questions
While most of what we’ve seen in the market and at the conference has been an improvement over the past few years, it is important to understand the tall order of the changes being made.
Learning to listen, especially to end users, really represents a cultural change, and these changes are not easy. They take a lot of management time and energy to implement, and they take patience. Will these changes take hold and further permeate the organization? Certainly we’re seeing results over the past 12 months, but companies have plenty of pressures to fall back into old habits.
In terms of market positioning, the competition is not standing still. We’re also seeing improvements coming from Blackboard’s change in executive team, and we’re seeing Instructure to continue their strong improvements to Canvas and their support. New entrants like Schoology and older solutions like Moodle are also improving, albeit more slowly than the big commercial vendors. Further complicating the matter, a lot of D2L’s new business came from a handful of large decisions. Will D2L’s market momentum of new implementations continue, particularly in North America and Europe? I expect we’ll learn a lot when we look at the data at the end of this calendar year.