e-Literate

Present is Prologue

Tag: Moodle

  • North American Higher Ed LMS Market Share by Enrollments: A consolidating market

    North American Higher Ed LMS Market Share by Enrollments: A consolidating market

    We have published market share data measured by total institutional enrollment instead of institutional count in several posts at e-Literate over the years, within the twice-annual reports of our LMS Market Analysis service, and for several of our premium subscribers of the same service. In July of this year we reported that Canvas had overtaken Blackboard as the market leader in US higher education in terms of institutional adoptions as well as scaled by enrollment. These last two posts got a fair amount of media and vendor attention.

    What we have realized, however, is that we have not made this information on market share by enrollment easy to access in one place. LMS company revenue tends to be based on the total enrollment of adopting institutions, thus this enrollment-based measure provides a more direct connection to company finances. Given the increased importance of LMS provider business models and revenue to the future trends of the market, we are sharing the information more broadly.

    In this view below we share North American (US and Canada combined) total enrollment for LMSs that are primary – that is, available for the entire institution. Total enrollment in this case means the institutional student count, but it does not imply that all students at that institution actually have courses using the LMS (see comment below from John Fritz). It is important to note that during an LMS transition there is often a period of time (6 – 18 months) where two systems overlap, with both available to the school. Therefore the total market share enrollments will be somewhat higher than actual total enrollments, as a subset of LMS-transitioning institutions will be counted twice.

    You can download a spreadsheet version here.

    LMS Market Share by Enrollment NA HE

    Some notes on the data worth considering:

    • Canvas has not just surpassed Blackboard Learn in this updated view, 35% to 33% – it has also expanded its lead as the most-adopted LMS in North American higher ed markets (while Moodle has clear lead worldwide in total installed base).
    • D2L Brightspace has been in third place for NA HE markets since 2016 when viewing by enrollments.
    • Moodle is fourth and has been dropping in recent years.
    • The top view of total enrollments adds in the effect of changing enrollments – both at a national level and an institutional level.
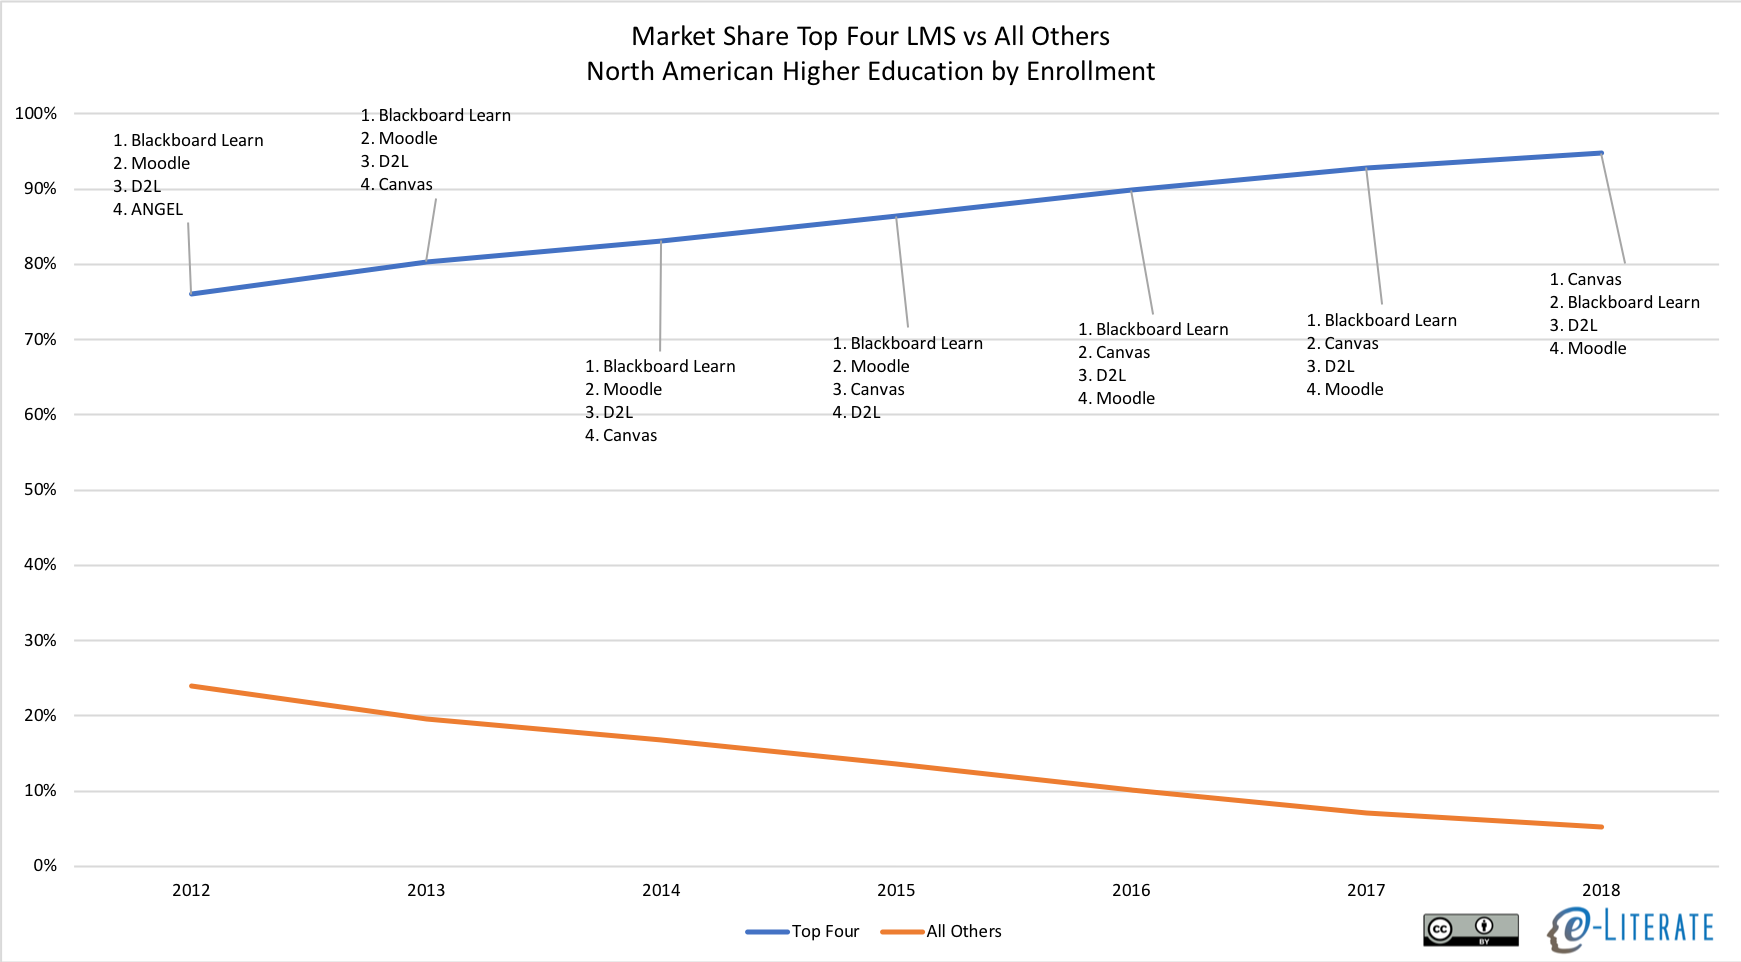
    • In the past five years, the LMS Market for North American higher ed has become increasingly dominated by “the Big Four” (Instructure Canvas, Blackboard Learn, D2L Brightspace, Moodle) for institution-wide adoptions; the aggregate market share of year’s top four systems moving from 80% to 95% in past five years.

    This last point deserves more analysis. There are other systems gaining new institutional clients (think Schoology here, or think CBE-specific platforms like Motivis), but they are mostly picking up either small schools or being adopted for specific programs and not for the entire institution.

    Consolidation of NA HE LMS Market

    Expect more coverage as we enter ed tech fall conference season.

    Update 8/3: Added sentence in third paragraph to clarify usage of total enrollment terminology.

  • Response to MoodleNews: Some considerations for critical reading of market sizing claims

    Response to MoodleNews: Some considerations for critical reading of market sizing claims

    There is an interesting post at MoodleNews titled “Open Source LMS Alive And Well: Moodle Breaks World Higher Ed Records, Tops North America, Grows Everywhere” looking at some of our recent LMS market data, focusing primarily on what the data reveal about open source systems such as Moodle, Sakai, Claroline, and Chamilo.

    Open Source LMS Alive And Well Moodle Breaks World Higher Ed Records, Tops North America, Grows Everywhere

    We welcome the usage of our data posted at e-Literate for these purposes, ((That’s why the blog is available for use under a Creative Commons Attribution license.)) but there are some misunderstandings evident in the MoodleNews post that we see too often in critical readings of market sizing reports. Unfortunately the misreadings can cloud otherwise valuable analytical reporting.

    The latest e-Literate report on “active LMS” shows Moodle as the incontrovertible LMS leader in global Higher Ed for primary and secondary systems, including North America.

    Incontrovertible seems quite strong, and we at e-Literate try to be very careful in our language and we rarely use words like incontrovertible or unequivocal. ((For the record, in the 14 year history of e-Literate, the former has been used one time and the latter five times.)) The reason is that for most people reading the data is a translation exercise. There is a need to understand the level of confidence the reader should have and what the limits of the claims are.

    It is useful that MoodleNews called out the global nature of data and measure of primary and secondary systems.

    Assuming it uses data provided by self-reporting service LISTedTECH from the last month, it shows dominance in every region, unsurmountable everywhere but the US, and healthy growth rates. The report mentions the “LMS long tail” as well as “the Big Four” (Moodle, Blackboard, Instructure Canvas and D2L Brightspace) but by their own accounting a more accurate distinction would be “the big one.”

    The data set used from our partners LISTedTECH is not a self-reporting service. Read this post for more information on the multiple channels of data collection used.

    But unsurmountable comes out of the blue. The whole point of doing reports like we do is that we don’t know for certain what the future trends will be, and we gather the data to reduce uncertainty. A while back, many would have said that Blackboard has an insurmountable dominance in North America, but we have seen major changes that would have made those claims invalid.

    I can see the argument for describing Moodle as “the big one” as an alternate description to “the Big Four”.

    LISTedTECH sample (apparently totaling 12,879 active LMS) lists 1,419 active Moodle sites in Higher Ed for North America, self-acknowledged as their most complete dataset. It appears that the advantages in Canada compensate for Instructure Canvas’ growth in the US. In July, it had listed 1,000 sites only for Higher Ed in the US.

    The first sentence is a good example of characterizing the data in a useful way, as it gives the reader a sense of the data set while also clarifying usage in a specific global region.

    Unfortunately the article then jumps into some confusing claims based on misreading the data descriptions. The June 2017 post captured percentage of primary systems at degree-granting institutions for each of four global regions with North America = US and Canada combined, the July 2018 post captured primary LMS in … US colleges and universities, and the August 2018 post captured total counts of both primary and secondary system usage in six global regions. We chose this latter method for the August post due to the frequency of long tail and open source LMS systems being used as secondary systems (i.e. some other LMS is the campus standard, or primary system). There is little basis for concluding that Moodle’s advantages in Canada compensate for Instructure Canvas’ growth in the US.

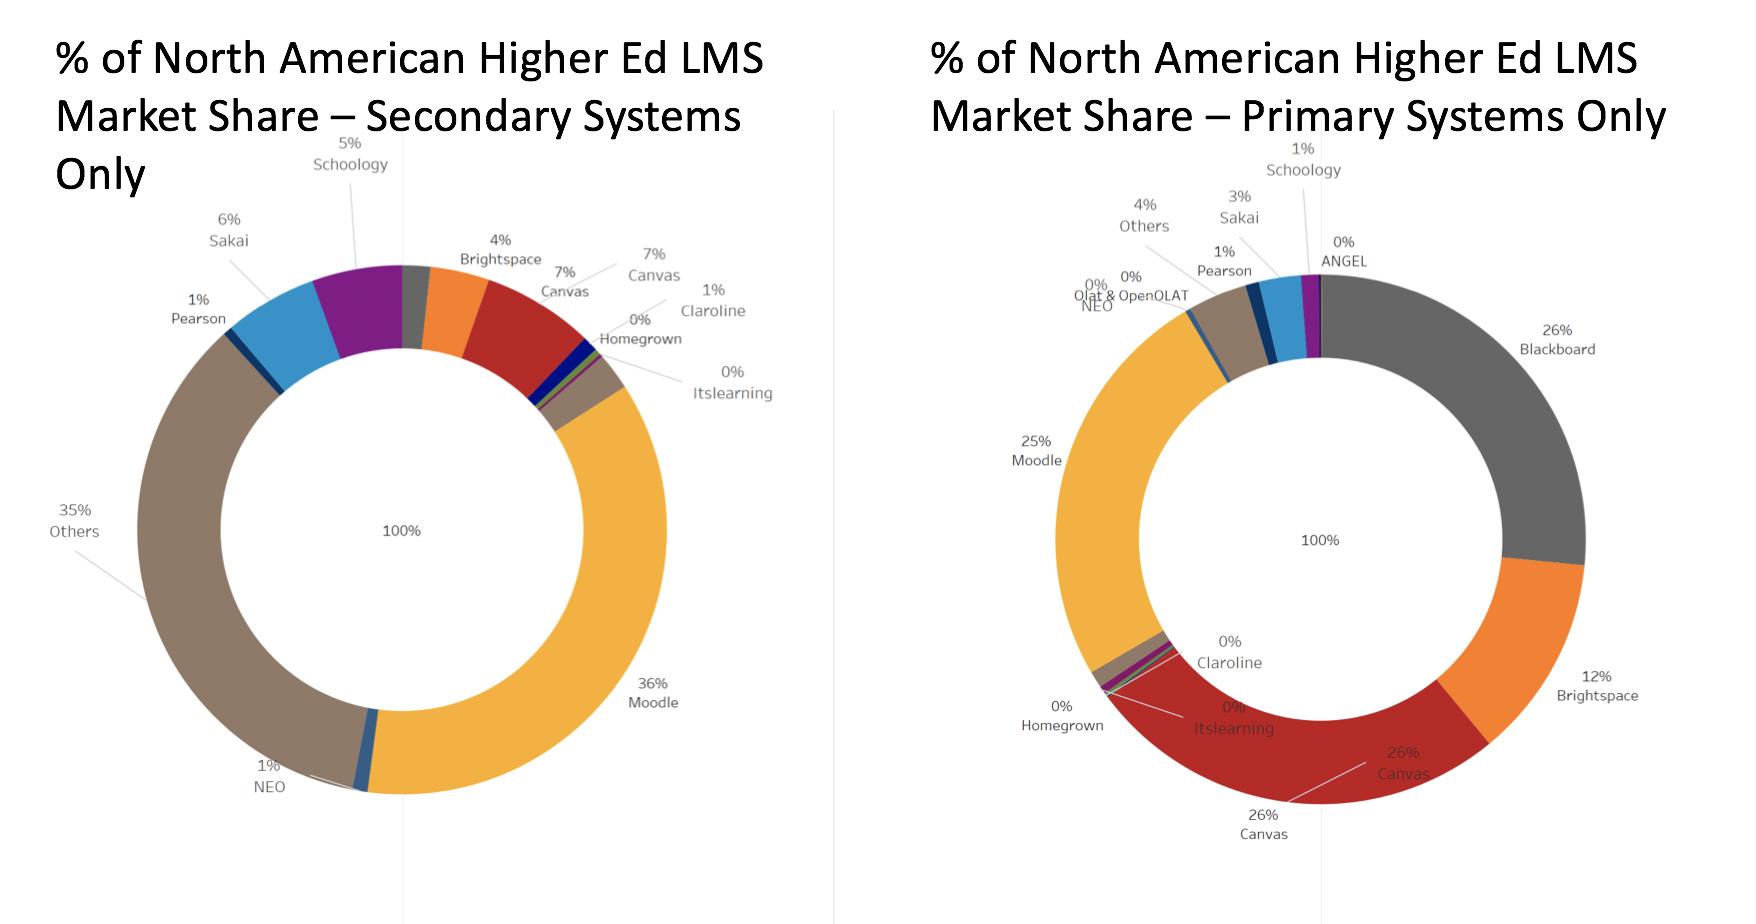
    The larger point here is that there are lots of ways to slice and dice data that end up with similar-lookinggraphs that represent different things – it’s important to read the legends and surrounding text carefully. To give a sense on the issue of primary vs. secondary systems  for North America, consider the difference shown below. ((Graphic shown as clarification, not present in articles referenced by MoodleNews.))

    With MoodleNews’ natural focus on Moodle, it would be accurate to note that Moodle is used quite frequently as a secondary system.

    For comparison, official stats at moodle.net set the total figure at 11,490 as of writing. 9,776 for the US, the biggest Moodle nation; 1,714 for Canada. Moodle does not offer discriminated site data for Higher Ed only.

    This is a helpful comparison and description with a different data set.

    Unfortunately, I need to be careful with further quotations. MoodleNews does not use a creative commons license and clearly limits usage based on the site’s terms of use. So the remainder of this post will have to be limited to short descriptions.

    There is a useful section looking at Moodle’s shares in six different global regions. The main caution I would add comes from our November 2017 post describing the data.

    Market share information provided in percentages and trends are more reliable than absolute counts outside of North America. When we do provide absolute numbers, we advise caution for readers or subscribers to not over-interpret the absolute numbers, at least without us providing additional details to keep the data in context.

    But in this case, MoodleNews also included the percentages for each region, which is helpful.

    The next four paragraphs all focus on market trends (year over year comparisons) that cannot be supported by the data (see above).

    At the end of the MoodleNews post, there is some valuable commentary about other (non-Moodle) open source LMS system and the origins and deployments across various regions.

    Given these clarifications, I would also add the the MoodleNews title has some serious flaws.

    All-in-all, it’s good to see valuable discussions spawned from our CC-BY licensed posts. But readers should be cautios when trying to understand market sizing data and make comparisons and trends analysis carefully.

    Update 8/26: Please see comment from Martin Dougiamas clarifying that MoodleNews “is not associated or affiliated with the Moodle organisation in any way”.

  • D2L Fusion 2018: Product improvements and potential signs of addressing challenges

    D2L Fusion 2018: Product improvements and potential signs of addressing challenges

    This year’s D2L Fusion conference in Houston carved out a space somewhere between the carnival atmosphere of InstructureCon in Keystone and the subdued feel of BbWorld in Orlando (note: we plan another post on each of these conferences to share more details of our observations). This  was the perfect note to hit for where D2L is in its evolution as an educational technology company. A number of things seem to be falling in place for D2L ((Disclosure: Blackboard, Instructure, D2L, and Schoology are subscribers to our LMS Market Analysis service. Blackboard, Instructure, D2L, and Pearson are sponsoring participants in our Empirical Educator Project.)) with its LMS product, but we will have to see if the recently expanded management team will be able to address the ongoing challenges that D2L faces with customer experience and expectations.

    Like Blackboard and Instructure, D2L is in the middle of a transition partially driven by financial considerations. In D2L’s case, the issue is that the two rounds of $165 million aggregate funding in 2012 / 13 lead to expectations of larger market gains. In August of 2017 we shared that “D2L is on a roll, racking up significant client wins in higher education, and the company shows real signs of change in its ability to truly listen to and empathize with customers.” Two months ago we described D2L’s concerted effort to move customers to the cloud and some promising improvements surfacing in the new Daylight user experience. Despite these improvements, however, D2L has lost some marquee customers such as the University of Wisconsin system to offset some of the wins, and the company has remained steady or made slight gains in North America, European and Latin American LMS market share.

    At D2L Fusion, our goal was to get a better read on how actual customers and prospects are reacting to the cloud deployment move and streamlined user experience that we have observed. A second goal we had was to get a better sense of whether D2L will be able to improve its customer service and delivery on promises made to customers.

    Reactions to Cloud and User Experience

    From customers we spoke to at D2L Fusion, the value of the move to the cloud as well as user experience improvements have provided breakthroughs. On the cloud front, D2L now has upwards of 98% of their customer base either hosted through Amazon Web Services (AWS) or in the company’s data centers.  According to a company spokesperson, 55% of what they describe as cloud implementations are hosted by AWS, the remainder by D2L in their leased data centers. All new implementations moving forward will be hosted by AWS and by fall 2019 D2L estimates that nearly all implementations will be on the AWS infrastructure. This will be a significant achievement for a legacy on-premises software provider to make this transition. From our June post:

    D2L has long worked on managed hosting options, but in late 2013 the company introduced Continuous Delivery where software releases are pushed to customers incrementally, such that customers would jointly run the latest versions of Brightspace, their LMS. This move is important, as one primary benefit of cloud deployment is to remove the explosion of software configurations and versions that make it expensive and difficult to diagnose and fix bugs and to release new features.

    Three years later in 2016 D2L announced their move to AWS for cloud deployment.

    At Fusion 2018 we saw a continuation of this strategy, and we heard largely positive reception from customers and prospects, and we are not hearing the grumblings from customers as was evident in late 2016 / early 2017. We should also note that this move to the cloud is more aggressive than that being made by Blackboard and Learn SaaS, but more on that in a future post.

    As for the new user experience and recent changes in product design, it’s useful to first establish context for what’s been happening internally at D2L. About three years ago D2L brought in a new chief operating officer, Cheryl Ainoa, and a new VP of Product, David Koehn. One of their goals was to turn the product development process on its head and, drum roll, put the users first. This means engaging with users, listening to users, understanding their problems and viewing them as partners in the effort to deliver better software. It also means solving the small things that annoy users on a daily basis and shifting away from feature releases as the key metric of progress. For companies that have been engaged in agile methodology and iterative development, this likely sounds basic. For D2L, it was a fundamental cultural shift in how development is done. At this year’s Fusion, we are seeing concrete signs that change has taken root both with the company and with customers.

    Daylight Experience is the name for D2L’s redesign of its streamlined user interface. When it was first announced in early 2017, we were somewhat skeptical as the initial changes were evident in different fonts and cleaner look-and-feel but not significant improvements in the workflow for faculty and students.

    As time goes on and we see more advanced demos, our view is changing. The Daylight Experience does have some real improvements not just in look-and-feel but in fewer and more intuitive clicks to get the same job done. A major focus on the Emerald Release this summer (in time for D2L Fusion users conference) is more fully encouraging usage of the activity stream for higher ed clients (this feature was initially targeted at K-12 market but has been adapted for colleges and universities).

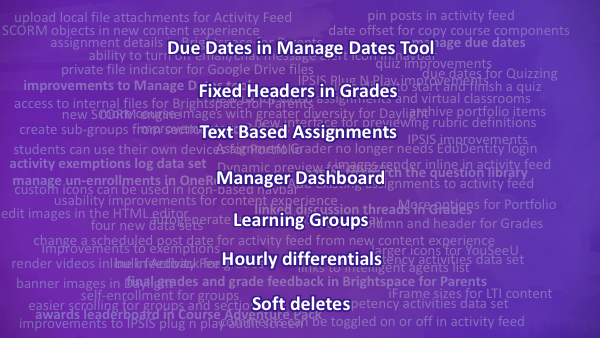
    The product showcase slide that arguably got the most enthusiastic response from the crowd was the one that focused on the small changes that users had been clamoring after for years – things like “Due Dates in Manage Dates Tool”, “Fixed Headers in Grades”, “Learning Groups”.

    New features from D2L Fusion conference

    These are not sexy, headline-making announcements, but they matter to users. D2L has long been viewed as a platform for people and institutions that like to have a lot of control over how to configure and run an LMS; however, the breadth and complexity of options often came at the expense of an intuitive user experience. While D2L has had a solid product for a sub-set of the market for years, they have had difficulty being viewed as ‘intuitive’ or ‘easy to use’, at least since the advent of Canvas and the resultant change in user expectations. The streamlined design afforded by the Daylight Experience, and the progressive disclosure of more advanced features, could change this situation if they’re able to get it in front of potential customers for a serious look.

    Customer Experience and Expectations

    On the second question regarding customer service and delivery on promises there are several reasons to be upbeat, but also reason for concern. Several new customers we spoke with, from Europe, Latin America and North America, all spoke about “partnership” as being a key reason for their choosing D2L over the competition. During lengthy procurement processes, these institutions got the sense that D2L was eager to engage and work with them to achieve their goals with broad service offerings as well as an eagerness to shape product development to suit these new clients.

    That said, D2L has a mixed record on follow through. A number of sources we have spoken with over the past 6-12 months have discussed a pattern of the company over-promising and under-delivering when it comes to implement promised changes. For example, these sources have told us they went into the relationship with this same expectation of a partnership, of having a voice in product direction, only to find out they are having trouble getting D2L staff to respond in a timely manner. It is not clear yet on how prevalent these concerns are, but we do believe they will need to be addressed in order for D2L to make material changes in overall market share.

    D2L has made two key hires in recent months, seemingly in recognition of potential market opportunities as well as persistent internal challenges. One targets growth, the other customer satisfaction. Puneet Arora, a former sales executive with several SaaS companies, has been brought in as chief revenue officer, and April Oman, a veteran customer success executive with a number of enterprise software companies, has been added as as Senior VP of Customer Experience. Arora is new to the education space but seems to be asking a lot of the right questions, and his task is to grow the user base in a meaningful way. Expect to see some changes in how D2L positions itself and who they try to sell to, shifting the balance away from administrators and towards faculty and student end users. Oman’s role is a new one and speaks to the need to develop a stronger relationships and partnerships with customers. This will be critical as D2L tries to establish themselves as much more than a software solution and as they attempt to improve customer experience.

    Better Position but Needing Results

    The center of gravity of D2L’s executive team is more diffuse than it used to be. Much of the longer-tenured leadership of D2L is based out of the Kitchener, Ontario home office: John Baker, CEO; Nick Oddson, CTO; Melissa Howatson, CFO; Jeremy Auger, SVP Strategy; and Ken Chapman, VP of Market Research. Ainoa, Koehn, Arora, and Oman (the new hires), however, are all in the Bay Area in California, and Tracy Strauss, SVP Marketing, is out of Los Angeles. There seems to be a deliberate approach to finding new ways of thinking from a broader field of expertise.

    D2L appears to have largely revamped its approach to product development that is more responsive to customer needs, and is putting resources into building partnerships. Yet they have not made the market gains envisioned after winning the Blackboard patent wars and then raising two large rounds of financing. We still see a two-horse race for new implementations (LMS product switches) in higher education, largely shared between Canvas and D2L, but the second horse that is looking better than it used to still needs to make further adjustments and run faster.

  • Moodle and Blackboard Cut Ties

    Sometimes breaking news overturns your blogging schedule. We have had e-Literate staff at four LMS conferences in the past few weeks and have a raft of news and analysis to publish. However, there’s some big news today out of Moodle that needs at least a timely mention while we write our other posts and chase down the details for more analysis of this event.

    Moodle just announced that Blackboard “will transition out of Moodle’s Certified Moodle Partner program in the coming months.”

    This is consequential for both Moodle and Blackboard. On the Moodle side, we have written about Moodle’s financial dependence on Blackboard as a partner and how that creates some risk for the community. Since those posts, Moodle has received $6 million in outside investment. According to Moodle Pty’s press release, that investment, combined with a decline in Blackboard’s financial contributions to Moodle made it feasible for Moodle to break off from the partnership.

    Note that all the information we have right now is Moodle’s press release; we will circle back to this story once we’ve had a chance to talk to folks from both Moodle and Blackboard and have caught up enough on our blogging schedule that we can give this story the attention that it deserves.

    But here’s my snap reaction: For Moodle, there is good news and risk. The good news is that it clears up the uncertainty that we have been reporting on. Moodle will now have a chance to demonstrate that they can be sustainable without depending on Blackboard. The risk, of course, is that they will now have to demonstrate that they can be sustainable without depending on Blackboard. We’ll try to get some more color on this from Martin Dougiamas.

    On the Blackboard side, it’s bad news in the short term, but the impact is hard to quantify. Because of the open source license under which Moodle is released, Blackboard can continue to use the code in their Moodlerooms business. However, Moodle Pty. owns the Moodle trademark. So unless Blackboard negotiated something with them, they will have to change the name of their product and division. In the medium term, there are open questions about their ability/willingness to continue contributing code to mainline Moodle, customer reactions to the split and, on the potential upside, Blackboard’s ability to make development decisions independently of Moodle Pty. There is some potential upside for them in that last piece, as well as not having to pay the partnership fee to Moodle. We will be reaching out to Blackboard (if they don’t reach out to us first) to hear more from them about how they see the future of their Moodlerooms business.

    So there’s still a lot here that we don’t understand yet. But this is significant news in the LMS world.

  • D2L Bets on The Cloud and Advances in User Experience

    D2L Bets on The Cloud and Advances in User Experience

    One of the arguments that we have made as part of our LMS Market Analysis service is that if you look beyond market share numbers, there has been a tectonic shift in the academic LMS market that started around 2012, moving from being Blackboard-centric to Canvas-centric. Meaning that the current market trends are largely driven by Canvas adoptions and market reactions to Canvas adoptions. This change has elevated the need for viable LMS solutions to have both a cloud-based deployment strategy as well as a more modern, intuitive user experience than what was acceptable just five years ago.

    Blackboard’s move to Learn SaaS (deployment) and Learn Ultra (new user experience) is a prime example of this market dynamic, and it has tended to get the lion’s share of analysis, including here at e-Literate. We have described that D2L has joined Canvas in “an emerging two-horse race for new implementations”, but we could do a better job of describing why we believe they are gaining in the market. ((Disclosure: D2L, Blackboard, and Instructure are subscribers in our LMS Market Analysis service and sponsoring participants in our Empirical Educator Project.))

    Short story – D2L has made fairly substantial bets on cloud deployment and a streamlined user experience, and the product design changes present the best explanation for the market gains.

    Head in the Cloud

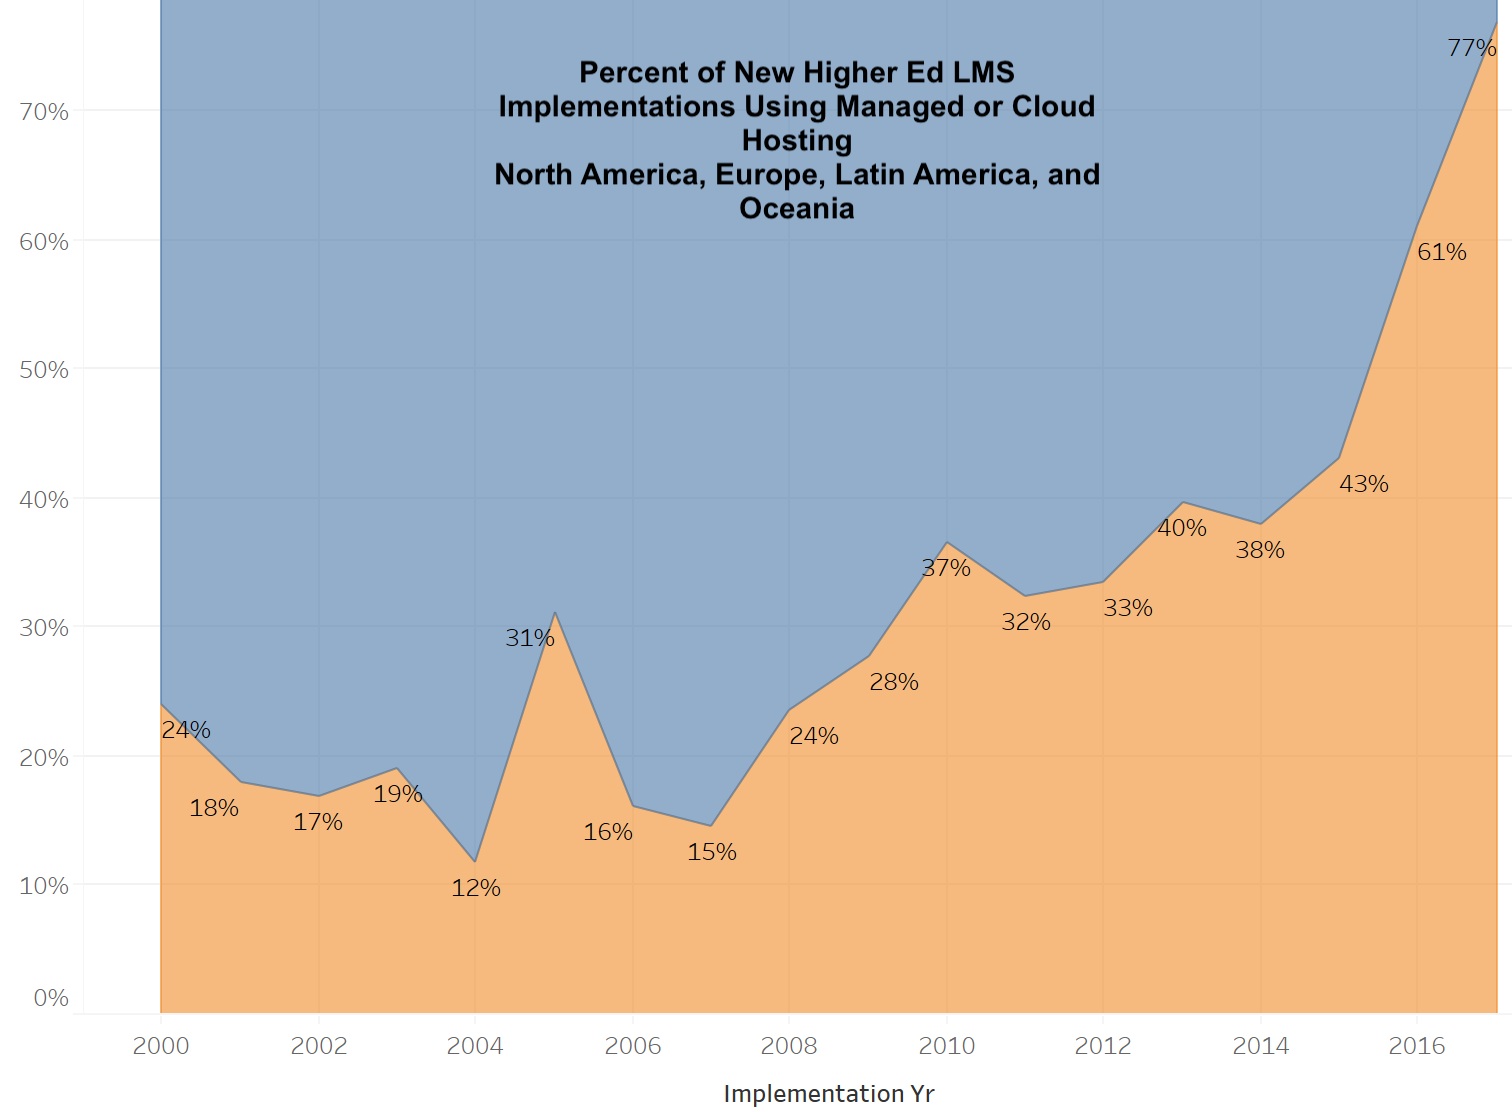
    The data looking at new LMS implementations (changing from one system to another) in higher ed across the four global regions we cover in our market analysis shows a remarkable movement away from self hosting, or on-premises hosting, towards a combination of managed hosting by the LMS vendor or cloud hosting designed by the vendor but running on AWS, in particular. From 15% external hosting to 77% in just one decade. Within the external models, there is another major shift away from managed hosting and towards cloud hosting.

    Growth of LMS external hosting

    D2L has long worked on managed hosting options, but in late 2013 the company introduced Continuous Delivery where software releases are pushed to customers incrementally, such that customers would jointly run the latest versions of Brightspace, their LMS. This move is important, as one primary benefit of cloud deployment is to remove the explosion of software configurations and versions that make it expensive and difficult to diagnose and fix bugs and to release new features.

    Three years later in 2016 D2L announced their move to AWS for cloud deployment.

    AWS Data Centers for D2L

    While we heard grumblings from multiple clients during the transition – especially thru early 2017 – D2L clearly made some hard choices and and is aggressively moving to the cloud, not just as an option, but as their primary delivery model. According to David Koehn, VP of Product Management at D2L:

    • All new Brightspace implementations are on AWS cloud;
    • Virtually all current Brightspace implementations use Continuous Delivery; and
    • Approximately 50% of current customers are already on the AWS version of cloud deployment; and
    • By the end of 2018, a large majority of customers will be on cloud deployment.

    Contrast this move to the cloud with Blackboard’s where they plan to continue offering self hosting, managed hosting, and their own AWS-based cloud hosting options at the customer’s choice, while they believe SaaS and Ultra will lead on new sales. The primary constraint being that to go to Learn Ultra experience, you must first be on Learn SaaS, the cloud hosting option. But the key point is that Blackboard has tended to view the cloud as one deployment option among others, and the numbers show it. According to a company blog post this week from CEO Bill Ballhaus:

    As of today, more than 50 clients are running Ultra, with dozens more planning to start using the Ultra experience and courses in the second half of the year. Also, 361 clients around the globe have moved to SaaS deployment for Learn.

    Our data show more than 2,000 higher ed customers on Learn, but if you add in K-12 and corporate customers, this roughly equates to just over 10% on or moving to Learn SaaS and 2% on Learn Ultra. These are generous numbers, but more on that in a separate post.

    The point is that D2L is making a much more aggressive and focused bet on the cloud than is Blackboard, for better or worse. Canvas, of course, is designed natively for the cloud, and essentially 100% of their customers are on the AWS cloud.

    Run to Daylight

    David Koehn also pointed out that the real driver for the AWS cloud move by D2L is to enable a redesign of the user experience and to provide improved scalability and reliability. In other words, the cloud deployment is a means to the Daylight end.

    Daylight is the name for D2L’s redesign of the user experience and its streamlined user interface. When it was first announced just over a year ago, I was somewhat skeptical as the initial changes were evident in different fonts and cleaner look-and-feel, but not significant improvements in the workflow for faculty and students.

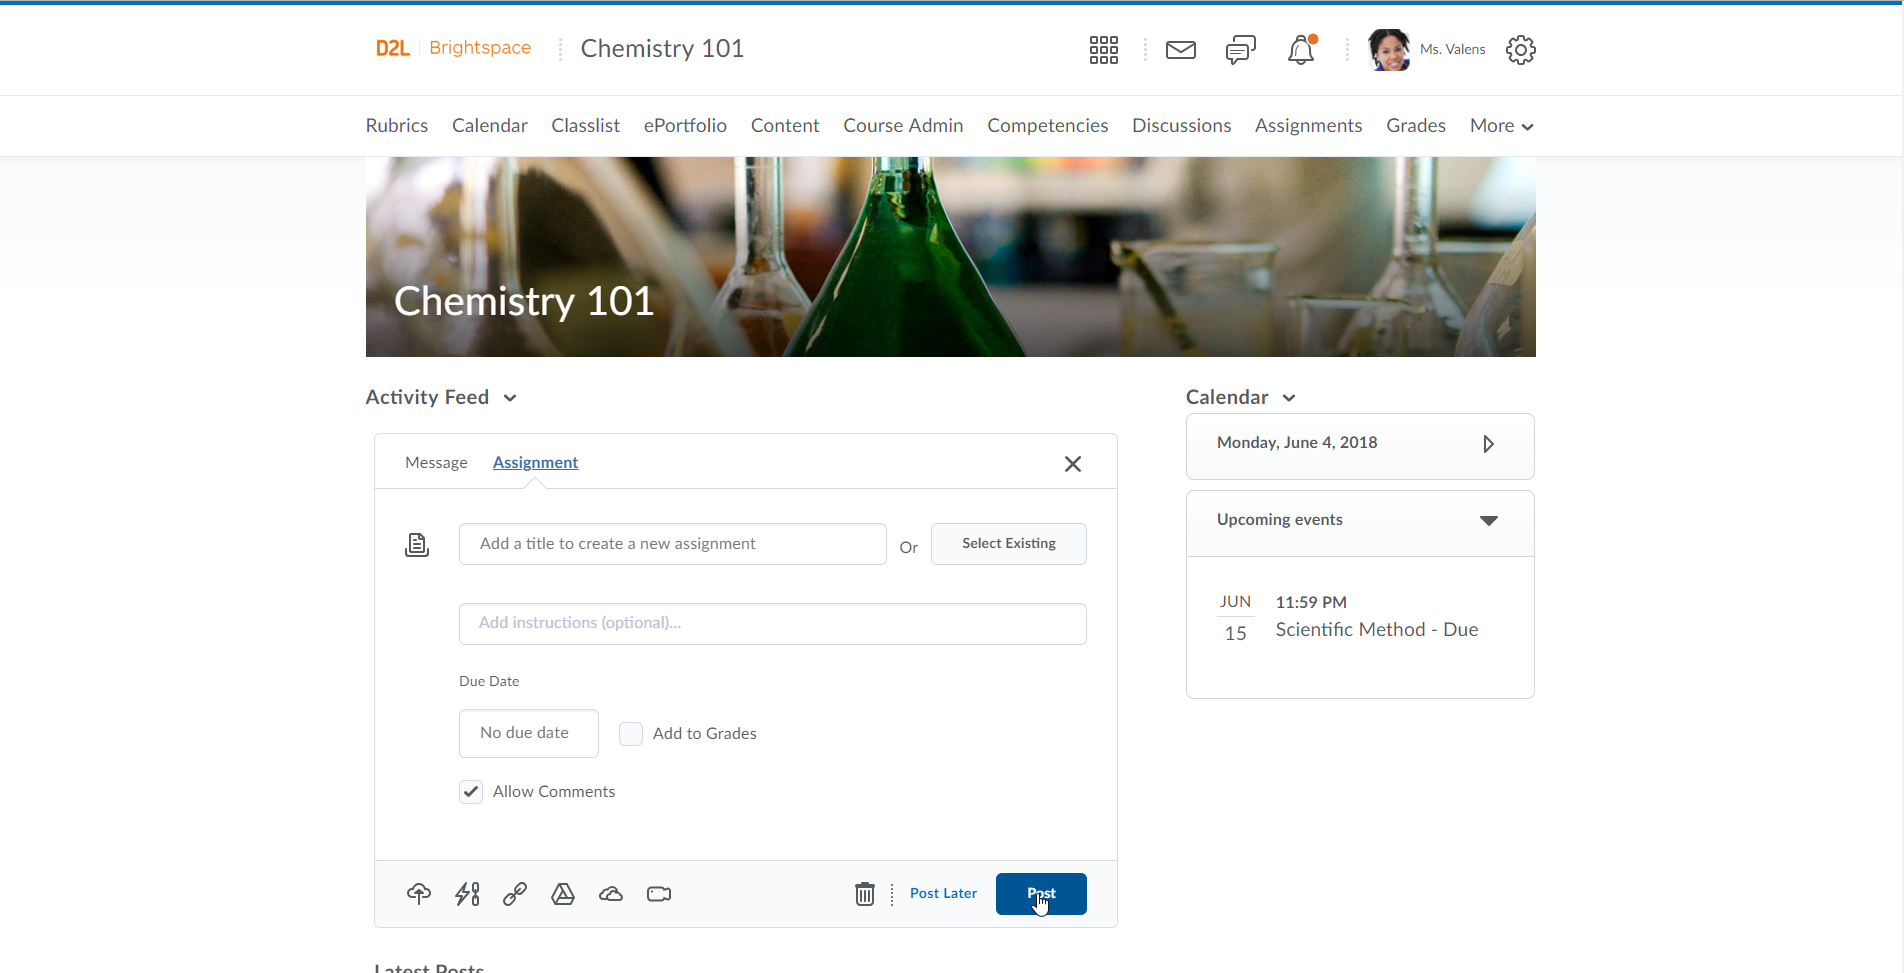
    As time goes on and I see more advanced demos, my view is changing. The Daylight Experience does have some real improvements not just in look-and-feel but in fewer and more intuitive clicks to get the same job done. A major focus on the release this summer (in time for D2L Fusion users conference) is more fully encouraging usage of the activity stream for higher ed clients (this feature was initially targeted at K-12 market but has been adapted for colleges and universities).

    Brightspace add assignment

    D2L has long played the Mutually Assured Destruction game of features, targeted at cumbersome procurement processes. D2L (along with Blackboard and Moodle) has a deep set of features which contrasts with Canvas and its streamlined set of features that rely on third-party integrations to solve some of the more specialized use cases. For D2L, it is important to maintain these features as a competitive differentiator with Canvas, and the design approach guiding them is Progressive Disclosure. This design technique relies on progressing from simple to complex, showing the user the information and options they need when they need it or request it and not before.

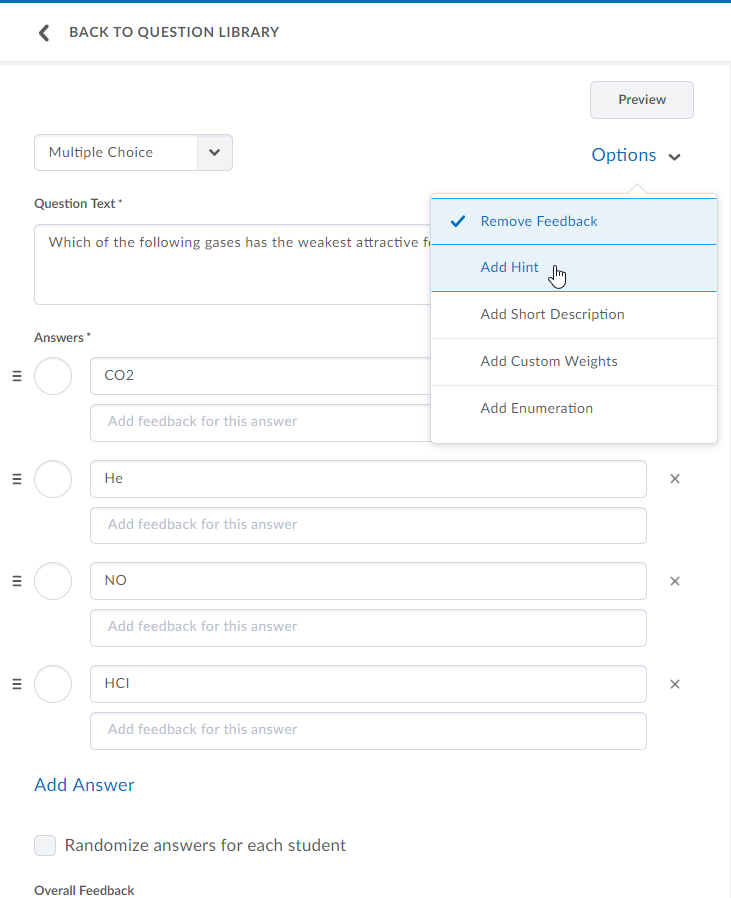
    Consider adding a multiple choice quiz, where the desire is to make this process very simple, but to then have a page or area that exposes more and more options as requested by user or in context of the quiz setup.

    Brightspace details on quiz

    As D2L further implements this design approach within the Daylight Experience, we are seeing a more modern and intuitive user experience for Brightspace customers, yet one that is showing real promise to also tap into deeper feature sets. And these changes are being used in production.

    Again by way of contrast, Blackboard’s user experience redesign for Learn Ultra has had a bumpy ride, with multi-year delays of getting any customers to use in production. They took more of a big bang approach to releasing Learn Ultra, and when customers pushed back saying that Ultra wasn’t ready, this led to additional delays and eventually a change in the design team. D2L’s Daylight has proven to be a more iterative release of their new user experience.

    What to Watch

    This year it is becoming difficult to separate LMS products from company finances. Instructure is trying to balance Canvas and Bridge growth to satisfy public markets along with a new executive team. Blackboard is dealing with corporate debt challenges while needing to fully release Learn Ultra. As mentioned in this post, D2L is moving strongly to the cloud with a new user experience while managing expenses. Schoology is trying to grow higher ed market under the radar. Moodle HQ took investment for the first time. There are a lot of open questions on the future of the academic LMS market, and we expect much to be revealed at the big summer (and fall) events.

    As for D2L Fusion, we plan to get a better read on how customers and prospects are reacting to the cloud deployment move and streamlined user experience. We are seeing real changes in the Brightspace design and deployment model, but do paying and prospective customers value these changes? Furthermore, will D2L be able to improve its customer service and delivery on promises made for new customers as well as it has improved its product design?

    As for Blackboard, Learn Ultra now has D2L’s Brightspace as a major user experience to compete with as well as Canvas. There is a lot more changing in the LMS market than what is obvious on the surface.

    Update: Clarified D2L numbers to be specifically for AWS cloud deployment. Also changed several instances of “cloud hosting” to be “cloud deployment” to make terminology more accurate.

  • Preliminary Data on K-12 LMS Market

    Preliminary Data on K-12 LMS Market

    Over the past several months, we have worked with our partners at LISTedTECH as they ramp up their efforts to collect data on LMS usage in the K-12 market in the United States. This is a massive effort as the market includes more than 130,000 individual public and private schools, and more than 13,600 school districts, according to recent NCES documentation. We are aware of several private data sources with estimates on the K-12 LMS market, but there are no public sources.

    Part of the challenge is that the K-12 market is messier than higher education’s and its roughly 7,200 institutions. One reason is that the general IT infrastructure in K-12 is less mature than in higher ed, and for smaller schools there are a lot of ad hoc implementations running on a local server not even in a data center. Another reason is the availability of free options such as Google Classroom, or freemium options such as that offered by Schoology and Canvas for individual faculty.

    As we build up the data and improve our methods, we believe we are starting to see some interesting trends in the data worth sharing.

    Our initial sample looks at 6,875 public schools from across the country in the NCES-designated primary, middle, high and other (special ed, vocational or alternative) categories. These results were analyzed over several data collection methods along with manual evaluation of that data. That said, we expect to see movement in the numbers as we collect and verify additional data, including LMS usage at private schools.

    As in our analysis of the higher ed market, we are focusing on school-wide implementations of LMS platforms. At many K-12 schools, in the absence of a school-wide implementation, individual teachers opt to use an LMS for their particular classroom, often for free. We do not consider this case a school-wide adoption and therefore do not include those use cases in our data. This methodology does not fully analyze total usage of a platform like Schoology that has a freemium model, including a free option for individual teachers and an enterprise solution which is a school-wide adoption based on a fee per student model. A platform like Google Classroom likewise has usage by individual teachers as well as school-wide implementations.

    Before we share the preliminary data, some caveats are in order to hopefully avoid anyone misrepresenting this information:

    • This is preliminary data that will likely change as we learn more. While we believe there are some broad trends already emerging, there will be refinements as we increase our coverage over time. We expect the changes to be in small adjustments to specific numbers but not in big changes to market shape.
    • This view is based on number of schools that have implemented an LMS, which is a different metric than district-wide implementations (where many or most of the purchasing decisions occur) or implementations scaled by student enrollments. We will add these views in the future.
    • This view is based on installed base (which represents total estimated deployments), which is different than new implementations in a given time period (which would measure market momentum). Again, we will add these views over time, just as we have done for the higher ed LMS market.
    • Due in particular to the free options available in K-12, there will be schools that have more than one LMS available at the institutional level. Google Classroom in particular is often available as an option at a school even when there is another LMS.
    • As is our practice at e-Literate, we’ll describe the caveats and present the data as is. As we learn more, if the relative percentages change significantly, we will share updates.
    • For more information on our data methods, see this post.

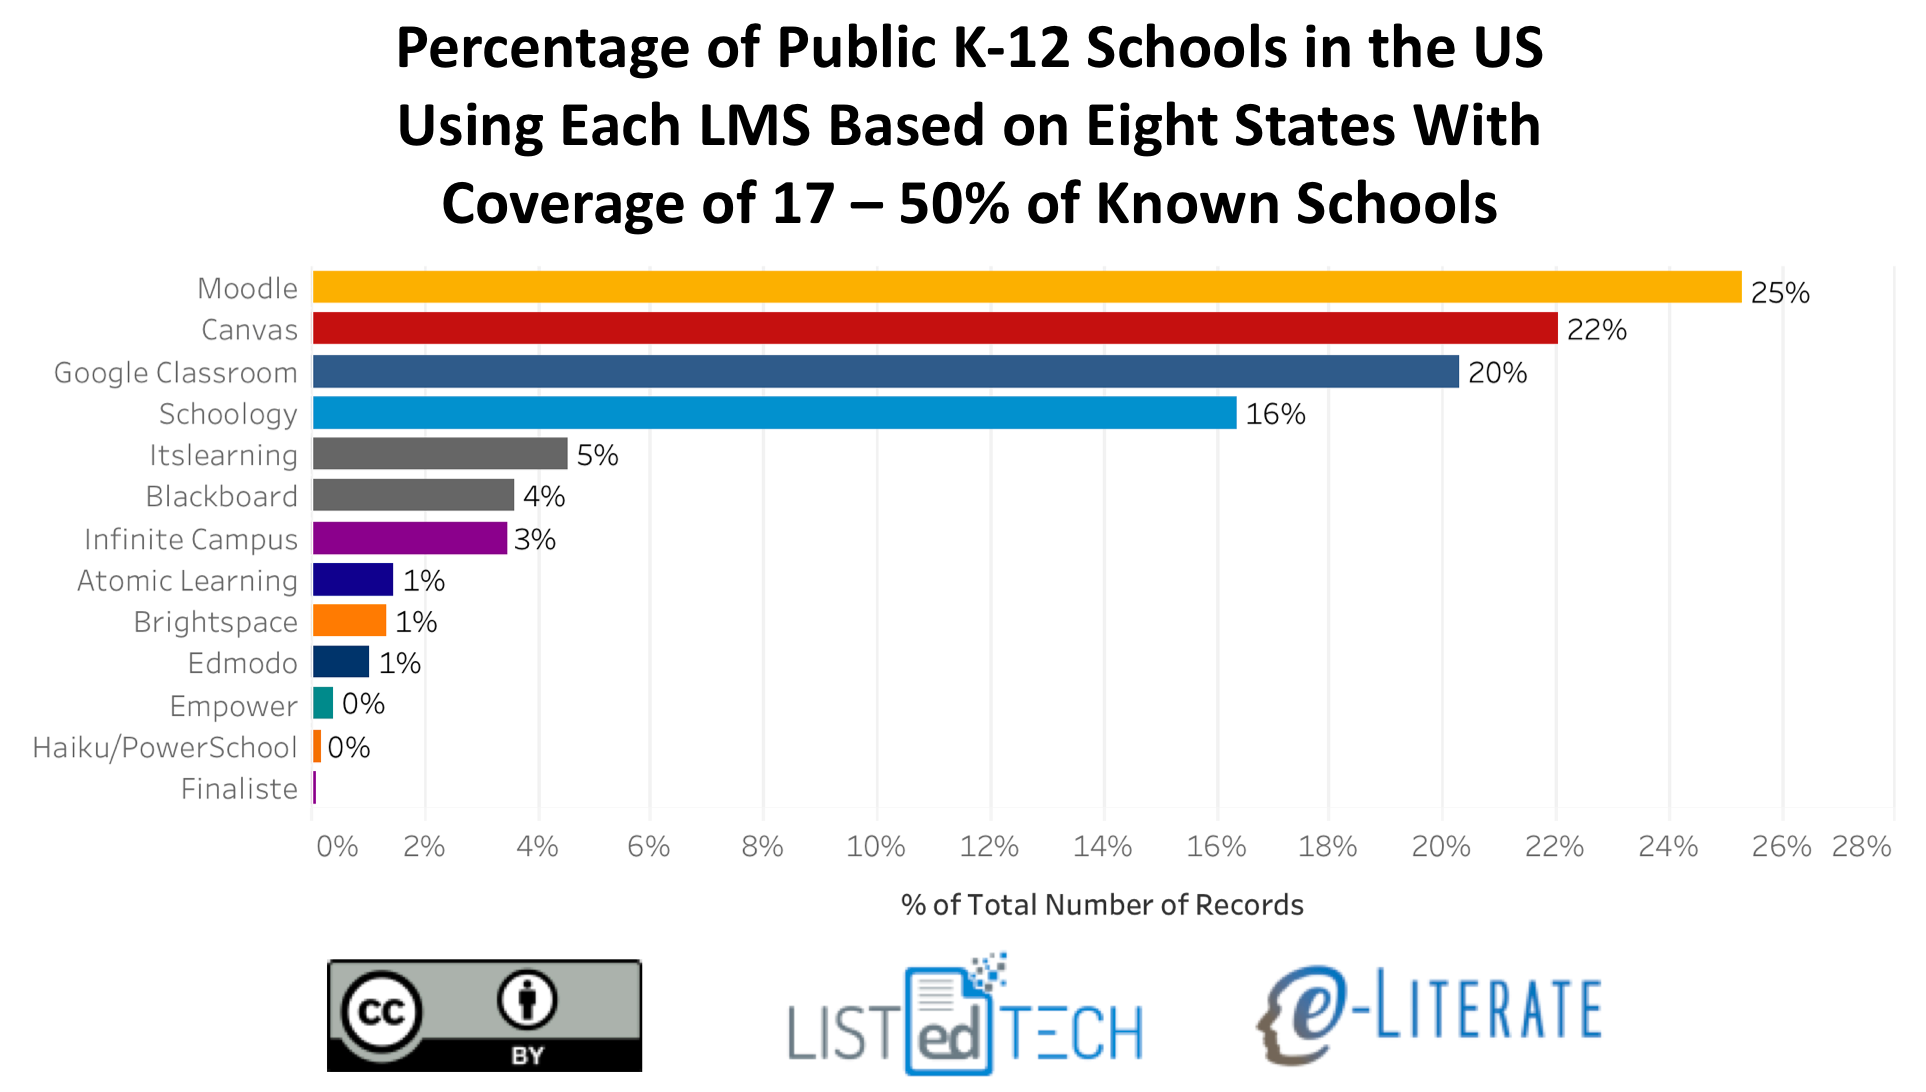
    The first graph presents a view of K-12 school-wide LMS implementations in the United States for the 8 states (and DC) where we have at least 17% coverage of known schools (Alaska, Delaware, District of Columbia, Florida, Massachusetts, Minnesota, Texas, Wisconsin).

    LMS Market Share for K-12 in US, 8 States

    To get a sense of how representative this initial market share is, we made the same calculations across all 6,875 schools from 50 states and DC that in our data thus far. The data for each LMS matched within ~2% for each LMS (e.g. Canvas went from 22% to 24%, Moodle went from 25% to 24%) between the two views.

    As in the higher education market, there appears to be four top contenders in K-12 – Moodle, Canvas, Google Classroom, and Schoology – with all others having 5% or less of market share. Moodle and Canvas are both present in the Big Four for both higher education and K-12, but in K-12 Google Classroom and Schoology are the other big players. We believe that this is the first data set showing just how widely Google Classroom has been adopted. ((Disclosure: Instructure, Schoology, Blackboard, and D2L are subscribers to our LMS Market Analysis service; Instructure and Blackboard also are sponsors for an upcoming event we are organizing.))

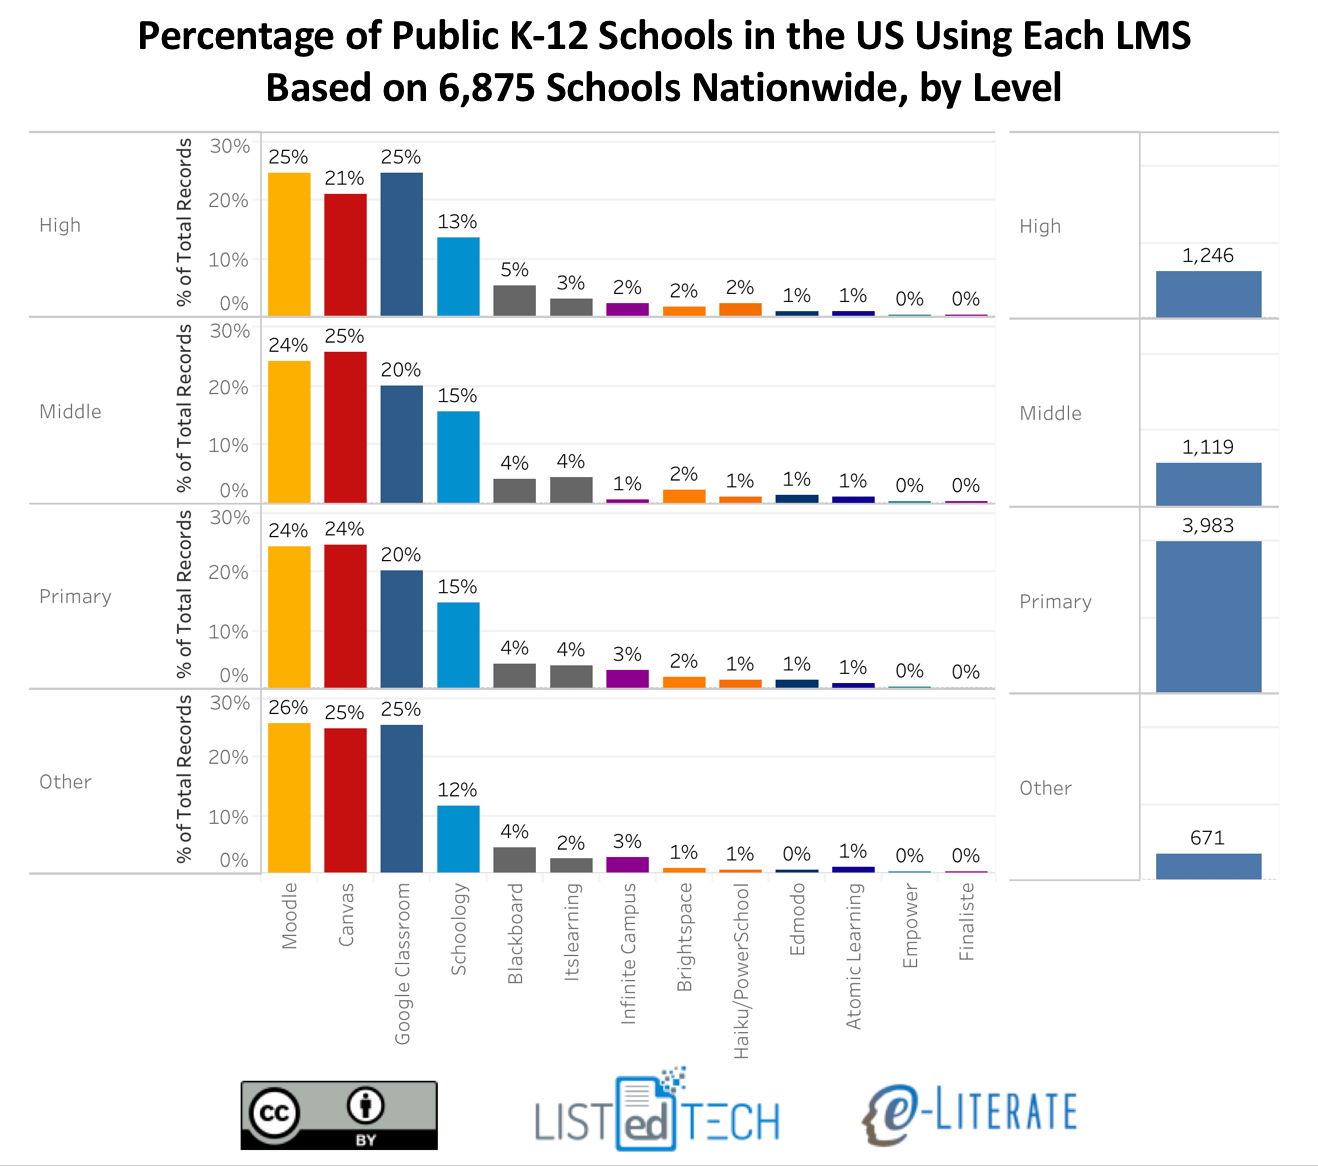
    The general distribution is somewhat consistent across school levels – primary, middle, high school, and others – with some interesting smaller variations. The following view also gives a sense of our relative data coverage by level. In this case we are using all our data across the 6,875 schools. Note that totals are higher than this number due to multiple systems being available at some schools.

    LMS Market Share for US K-12, By Level

    We hope this new data provides a broader view of the academic LMS market. We’d love to hear your feedback and questions.

  • Fear and Loathing in the Moodle Community

    Fear and Loathing in the Moodle Community

    Moodle News responded to our recent coverage regarding the platform’s declining market share by pushing back hard with an article that simultaneously insinuates bias on our part and attempts to use our numbers to draw the opposite conclusions from the ones that we have put forward. This presented us with something of a dilemma. As professional analysts, we try very hard to be undefensive when we are critiqued. If people think we are biased, they are entitled to their opinions. If people question our data or analysis, we try to respond only if we think their critique of us has merit. If we don’t think it does, we generally let our original work speak for itself unless we have a specific reason to do otherwise. So, from this perspective, our default editorial position is to let Moodle News have their say and leave it alone. I will add that our overall impression of Moodle News has been that it is generally a fair and thoughtful outlet. We have no particular desire to pick a fight with them.

    On the other hand, we are not just analysts. One of the more common compliments we get from people who trust our work is that they believe it is animated by a concern for improving education. I take these comments to mean more than just that we “care” in some abstract sense. Rather, they seem to be saying that our choices of what stories we cover and how we cover them are animated by our desire for our analysis to be a tool for educators to help improve education. From that perspective, it’s hard for me personally to let the Moodle News story go unanswered. I care about what happens to Moodle, not so much because I care about Moodle in and of itself but because I care about the good that the platform and the community do for education across the globe.

    Sometimes when we poke at a group because of a problem, it’s partly because we want to call their attention to it in the hopes that they fix it. If we poke harder, it may be because we’re not convinced that they’re paying attention to the dangers that we see. (See, for example, Phil’s recent Unizin coverage.)

    Beyond the Moodle News piece and the occasional (but energetic) challenges we get from Moodle advocates when we present our numbers at conferences, the case for poking here is bolstered by Martin Dougiamas’ periodic public questioning of our analysis, including his comment on that aforementioned last post. The bulk of that comment was as follows:

    I get that you are a fan of certain companies and that is fine, but I don’t understand the highly negative and uninformed spin from you lately. Look at the title of this article! These feel like intentional attacks, to be honest, and I have to wonder why.

    The fact is your entire article here is based on the false supposition that our business model is a) static and b) based entirely on higher ed. However, we already have a number of new and exciting initiatives that you clearly don’t know about (MoodleCloud, MoodleNet, LearnMoodle, MoodleServices as well as new things not announced yet) that are supporting our current and future growth.

    Sustainability of Open Source and all Open initiatives is something we care about deeply and is part of everything we do.

    Again, readers have to come to their own conclusions regarding the quality of and motivations for our posts. From our perspective, we tend to write negative headlines when we see negative news. We tend to get more negative in our tone when we think the people we are trying to reach are not hearing us (or are not honest, though that is not an accusation that I am making here).

    As somebody who has been very directly involved with and committed to open source projects myself, I have learned that the very passion which drives participation can also cause advocates to dismiss any bad news as “fake news.” This can be fatal to a project. Moodle has massive market share, a fresh infusion of cash, and plenty of talent. There is time to address any challenges that the project faces. But only if those challenges are faced.

    I have decided to take one more run at this topic because I would like to see the Moodle community succeed, and in order to do that, I believe it will have to grapple with challenges that I don’t see evidence that it is fully grappling with yet.

    The Passion Play of Open Source in Crisis

    While the role I have chosen for myself in the ed tech ecosystem has required me to be ecumenical in recent years, I had previously been an active participant in two different open source LMS projects. The first was a system called dotLRN, which came into existence around 2000 and seems to have died around 2010. (The web site is still up, but nobody appears to be home.) From a functional perspective, dotLRN was fantastic. In retrospect, it was a decade ahead of its competition in a number of ways. But its technology stack was quirky. It was written in a programming language called TCL—which stands for “tool command language” but is referred to by its proponents as “tickle”—and ran on top of an early open source application server called AOLServer. I was told by people I trusted that these were perfectly valid technical choices that had distinct advantages over contemporary alternatives. As a newbie to software development and a non-engineer, I had no reason to doubt those assessments.

    But while I didn’t know much about technology, I did know how to listen. Over time, it became clear to me that attracting new developers and winning the confidence of university IT departments would be hard. Nobody seemed to think that learning a programming language called “tickle” and an application server called “AOLServer” seemed like a path to a career on the cutting edge. I grew more confident in that assessment as it became clear that adoption growth of the platform had hit a wall and it wasn’t even getting considered as an option in most cases. I raised this concern with the community, but many of the engineers continued to insist that the superiority of their choices would win in the end. And they could point to all the strengths of their platform relative to the competition as evidence for their case.

    The problem came to a head one day for me when I made a discovery about one of those strengths. There was a situation—I’ve long since forgotten the details—where the dotLRN developers decided to turn one of the capabilities of the platform into a web service. I asked, “How hard was that to do?” The answer? “Trivial. It’s just configuration. We can turn pretty much any API call into a web service with the flip of a switch.”

    I was stunned. This seemed like the way out! Let the dotLRN core continue to be developed by a limited number of specialized engineers, similarly to how web servers like Apache were being written in C by a small number of hard-core specialized developers. Develop a new front end using a more popular language, which at that time would have likely been PHP, Python, or Java. Use web services to communicate between the two. This was before REST and JSON had really hit the scene, so they would have been XML-based web services. But the point was, nobody would have to learn TCL. It would change everything, I thought.

    The dotLRN developer community was less enthusiastic. They believed their development approach was technically superior. Why should they pander to the least common denominator by promoting an awful, inelegant language like PHP? Besides, they had a huge installation in Brazil. Things were looking up, they said.

    It turns out that many open source communities, when faced with declining adoption that is forcing consideration of unpalatable choices, become some version of David Hasslehoff. “I may be the butt of jokes in the US, but I’m huge in Germany!” That is a bad place to be. Before you know it, the only things people remember you for are your deeply unfortunate “drunken stupor” YouTube video and your cameo in the SpongeBob movie.

    Could a switch to web services have saved dotLRN? I don’t know. It would have been tough no matter what. But the point is that open source communities are often driven by the passion of the participants. While it was exactly that commitment to the mission that attracted me to dotLRN at a time when the proprietary alternatives made me very queasy, it was that very same emotion that blinded some of the most passionate and committed community members to problems that turned out to be existential.

    When I left the dotLRN community, it was in the process of tearing itself apart. There was a lot of internal debate about whether anything needed to be done for the health of the project and, if so, what. One particularly bright and charismatic young leader in the community became offended that there was resistance to the direction that he (and his company) wanted to take dotLRN. So he left. (I hear he has since gone on to do great work under the auspices of the Mozilla community.) There was a sense among the remaining members that their suffering was externally inflicted. How could the world fail to appreciate the wonderful things that they had built and shared for everyone’s benefit? They were the victims, sacrificed by the unappreciative mob as thanks for their self-sacrificing effort. And now….

    I have seen similar challenges, albeit to a much lesser degree, in the Sakai community. By and large, that community has a more realistic grasp of where their challenges are and what their niche is. They also appear to be fairly stable at the moment.

    But passion can blind the Sakai community members from time to time too. (“We’re big in Spain!”) I can remember a time not too many years ago when people in that community—smart people who I respect and whose livelihoods depended on the health of the platform—who thought everything was just fine. One in particular told me that all Sakai needed was a refresh of the grade book and the test engine. Otherwise, everything was just great. (I’m not sure whether this was before or after Sakai finally fixed a fundamental problem where the platform broke the browser back button, but if it was after, it wasn’t long after.)

    That guy is now the CTO for a company that is not Sakai-focused.

    More recently, the last time I was at an Apereo conference, I attended a session whose abstract said the presenters would talk about how they welcome RFP processes and have kept Sakai competitive at their schools. I was curious. What followed was a litany of the presenters raising every imaginable obstacle to choosing Sakai over competitors, including many reasonable ones, and off-handledly dismissed them one by one. Perhaps inevitably, they came around to Phil’s squid diagram. They clearly didn’t know either that I was connected to the graph or that I had previously served on the Sakai Foundation Board of Directors. I didn’t say anything; I hadn’t gone to the session to ambush the poor guys. But others in the room knew who I was. All eyes turned to me, and several people pointed to me. The guy presenting in the moment rehearsed his arguments.

    ”That graph is based on old data, right?”

    No, you just have an old version. The latest version is up on the blog, and it doesn’t look any better.

    ”But this is just a small sample.”

    About 90% of US and Canadian institutions.

    You get the idea.

    No organization can remain healthy and effective if it doesn’t balance its passion with a healthy dose of skepticism and self-reflection.

    Which brings us to the Moodle News piece.

    Getting the Numbers Right

    There appear to be three sources of misunderstanding in the article in question. The first is not understanding our point about the intersecting trends of the collapse of new implementations (meaning very few new schools choosing to adopt Moodle in a particular year) with an increase in decommissions (meaning more schools replacing Moodle with another LMS). In North American higher education, we are already seeing a decline in total Moodle institutions of 45 – 50 (depending on when you measure). This is roughly equal to the 1% rounding number that we mentioned in the post (i.e., 1% of 4,500+ institutions in North America dataset).

    The Moodle News author is correct in noting that for the horse race view, Blackboard and Moodle are closer than ever when measured by percentage of institutions using as primary system. However, this is mainly because Blackboard’s market share has collapsed much faster than Moodle’s. Arguing that this shows Moodle is strong is a little bit like arguing that MySpace is strong because it has surpassed Napster’s market share (though I will grant that a slow decline is better than a fast one).

    The second problem is in not understanding the difference between new implementations and installed base. The chart I referenced in my last Moodle post measures the percentage of new implementations in each year moving towards Moodle – this is where (at the time of article) 0% of 2017 new implementations went to Moodle, 55% went to Canvas, and 44% to D2L. (To be fair, we’ve detected a few new implementations since that last piece; we will include them in our next periodic update of the graphs.)

    The author then asks:

    All of which leaves us to wonder: How can an LMS have no growth while its close competitors show increases of 55% and 44% (for D2L, now with a 15% market share), and end the year with its market share unchanged?

    Market share is based on installed base—the percentage of institutions having a particular LMS as its primary system as measured in a point of time. To get this number, we add new implementations, subtract decommissions, account for the changing denominator in the total number of institutions (there are a lot of consolidation and closings happening in the US), and round to the nearest whole percentage.

    So the answer to the author’s question is that Moodle has lost 45 – 50 net institutions in North American higher education. In other words, roughly equal to the 1% rounding number.

    The third problem is not understanding the difference between primary institutional adoptions, which is the measure that we use in our analysis, and the measure of the number of registered sites in Moodle.org’s stats. We don’t, for example, count the sites that may be self-run by an individual professor or department and that may be registered with Moodle.org. The latter may be important to the community from a mission perspective, but those adoptions do not impact the financial resources available for development of the platform. You can’t combine the two numbers.

    Speaking of which, the situation looks even worse for Moodle the closer we get to counting things that directly translate into revenues. The numbers that we track in many of our charts and graphs are the numbers of institutions that adopt different platforms. But the numbers that really matter for the financial health with most of these platforms is the number of students, because institutions pay their vendors, including the Moodle Partners that bankroll Moodle HQ, by the enrollment. For example, Southern New Hampshire University (which is moving to D2L) and Glendale Career College (which is on Moodle) each count as one institutional customer. But SNHU has over 100,000 students, while GCC has 300.

    When measuring by numbers of students, Moodle is fourth in the US and Canada, behind Blackboard Learn, Canvas, and Brightspace—and these numbers do not include future losses from the University of Minnesota and other schools that have chosen to migrate off of Moodle in the near future. Note the numbers in the right-most column of this chart:
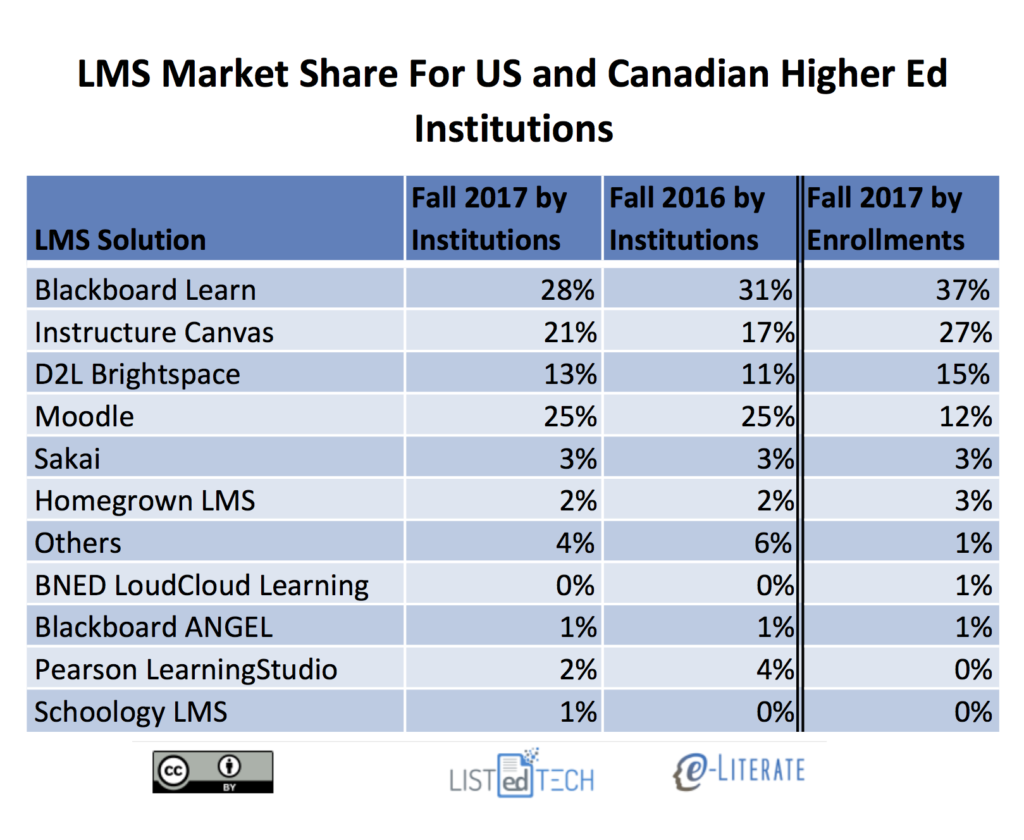
    If, as our data show, the Moodle market share in US and Canada is much smaller when measured by numbers of students versus institutions, even as the number of Moodle institutions is shrinking, that is a bad picture for Moodle HQ’s financial health. If you care about Moodle, then you should be worried about these numbers.

    A Healthy Skepticism of Skepticism

    Is it possible that we at e-Literate are biased against Moodle? Of course it is. While we try our best to be objective, we are humans, and humans can be biased. The Moodle News author spends a fair bit of energy insinuating that we have a preference for other platforms. I’m not going to address that question, partly because I’m not the best judge of my own biases and partly because it’s not the question that Moodle advocates should be asking. Rather, the main question they should be worried about and should be investigating with as much absence of bias as they can muster, is the following:

    Is e-Literate’s analysis true?

    Could we be wrong? Of course we could. I very much doubt that we are off by much in the US and Canada, where we our data are the strongest. The margin of error increases as we get to parts of the world where our coverage is less complete (or, in some cases, non-existent). Those areas should be clear—and, in fact, are referenced in the Moodle News article—because we quantify the data fidelity in our regional analyses. If Moodle is huge in Germany, or China, or Myanmar, we might not be picking that up in our data.

    There is one person who may well have better data than we have, and Moodle advocates have reason to believe that he is not biased against Moodle. His name is Martin Dougiamas. He argued in the comment quoted at the top of the post that we don’t really understand or have visibility into the business model of Moodle Pty. If that is true, then we would like to be enlightened. And the Moodle community should want that too, for peace of mind.

    Moodle Pty could provide the community with two kinds of information that would help its advocates understand how much they should be worried (or not). First, Moodle Partners likely give Moodle Pty counts of customers by institution and numbers of students. (I don’t know this for certain, but I’m not sure how Moodle Pty could verify that they are being properly paid by the partner without this information.) The company could publish this information, aggregated by country so that individual customers and partners have some degree of anonymity while still giving the community a sense of the inputs that fund Moodle development. A second disclosure that Moodle Pty could offer is direct revenue numbers that are transparent enough for community members and other interested parties to independently verify the company’s financial health. While Moodle Pty is not legally obligated to provide any of these numbers, there are disclosure models in both non-profit foundations and for-profit companies that the company could choose to follow. At the moment, the status of Moodle Pty as a private corporation shields it from transparency requirements of either non-profit foundations or publicly traded corporations. But that doesn’t mean that the company, as the main engine of sustainability for a huge open source project that, despite current growth challenges, remains by far the world’s most widely adopted academic LMS, couldn’t or shouldn’t choose to be transparent about numbers that are critical to the project’s sustainability.

    If Moodle News really wants to check our numbers, then they should be asking Moodle Pty for adoption numbers of Moodle Partner-supported installations by institution, headcount, and/or revenues. And their biggest concern, as Moodle advocates, should not be whether some US analysts are talking smack about their favorite platform. It should be about how healthy and sustainable that platform truly is.