e-Literate

Present is Prologue

Tag: Moodle

  • Why Moodle Supporters Should be Concerned

    Why Moodle Supporters Should be Concerned

    In Phil’s last post, in which he explained our data gathering methods for our LMS analysis work, he started with a quote from Moodle leader Martin Dougiamas that suggested our numbers were primarily US-based. Because it captured a common misconception about our data (and was based on a fair question), it was a good launching point for the post. But there was more to Martin’s comments on the subject, and we’ve heard various objections from some Moodle advocates about why our numbers are either inaccurate or irrelevant. ((The Moodle community is no more monolithic than any other; we have of course heard a wide range of opinions from Moodle advocates about the state of the union.))

    I’d like to review those arguments here. While Moodle is still by far the most widely adopted LMS in higher education globally and is no danger of disappearing any time soon, I believe that our data should give the Moodle community cause for considerable concern about their long-term future and should trigger some soul searching about how the community can ensure it continues to have the development resources necessary to continue to be relevant in the long term.

    The Data

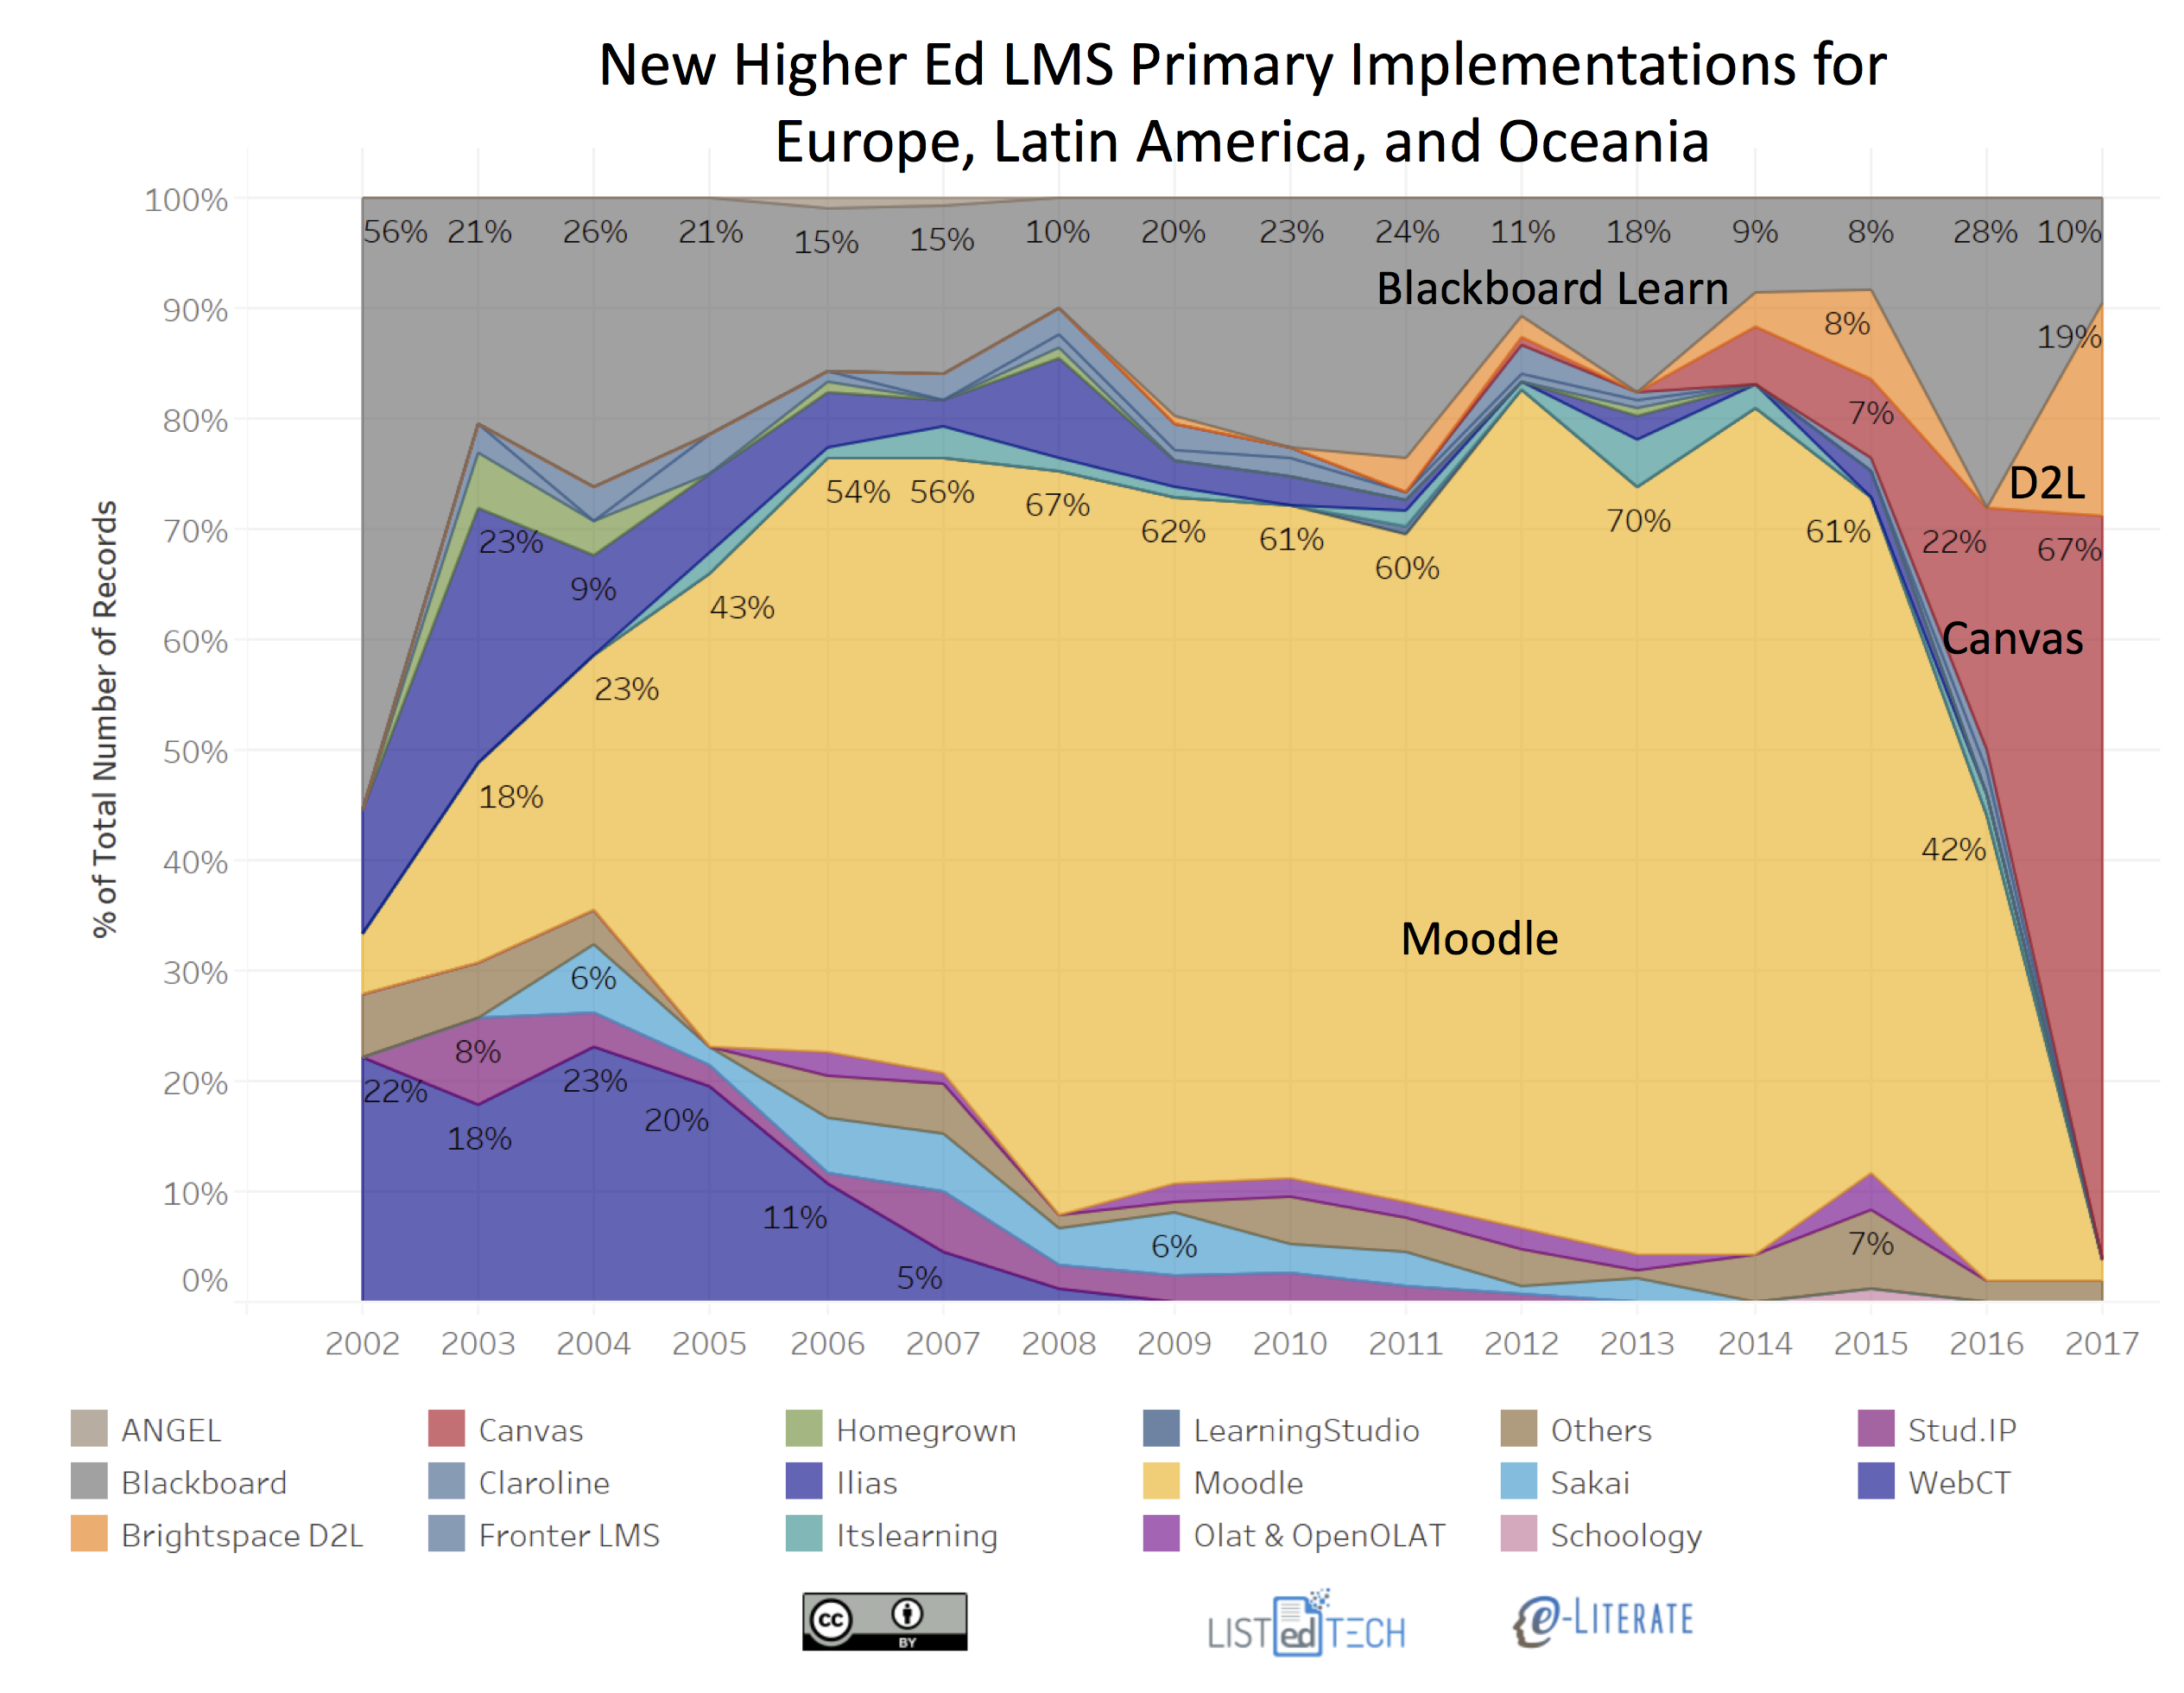
    Let’s start by reminding ourselves of the data in question. It really boils down to this one chart:
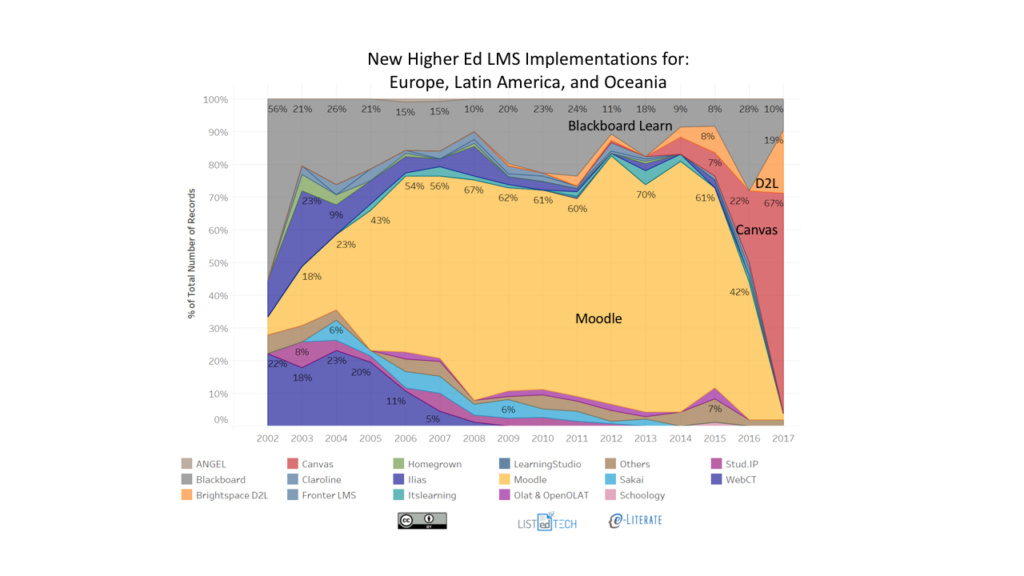
    Notice the scope of the chart: It does not include the US and Canada. This is data for Europe, Latin America, and Oceania. So this chart is not biased in any way by US-centric trends.

    There are two important caveats here. First, as Phil states in his post, our coverage of these areas of the world are not as complete as they are in the US and Canada, so trends we see in our data for these parts of the world should be considered directional and somewhat provisional rather than pinpoint accurate. That said, we only publish data for regions where we have enough coverage to be confident that our sample is representative. We don’t yet cover China or Africa for this reason. We believe the chart above is directionally correct, but there is a margin of error because we have a sample rather than a close-to-100% complete data set.

    The second caveat is that the chart shows new adoptions. When we look at installed base, Moodle still looks formidable:

    So the issue we’re talking about is not that Moodle is disappearing but rather that it is losing ground during new adoption cycles.

    The three most common arguments we hear from Moodle advocates are the following:

    1. The e-Literate numbers aren’t global or aren’t accurate.
    2. e-Literate is using the wrong adoption measure.
    3. e-Literate’s numbers are irrelevant, because an open source project doesn’t need to worry about growth in the same way that a profit-motivated company does.

    Phil’s earlier post addressed the first objection by describing the data we have, how we get it and validate it, and how we try to be transparent about its limitations.

    I’d like to address the other two objections in this post.

    The Wrong Measure?

    We measure higher education institutional adoptions. That means there are Moodle adoptions that we don’t measure or don’t report. We don’t have counts K12 or corporate adoption at all; Moodle has significant uptake in both of these areas. While we have data on secondary higher education adoptions (e.g., adoption by a school of education at a university that uses a different LMS for the rest of the institution), we don’t report these numbers. Nor do we report adoption by individual faculty. All of these are meaningful numbers and we do not dismiss them.

    But institutional higher education adoption is a particularly meaningful measure for Moodle’s long-term health. While Moodle is open source, Martin Dougiamas’ company Moodle Pty—more widely known within the Moodle community as Moodle HQ—does most of the development of the core Moodle code and maintains tight control over which code submitted by third parties gets accepted into the code base. This is what is sometimes known as the “benevolent dictator” model of open source, which was popularized by Linus Torvalds, the creator and development leader of the Linux kernel.

    Under the current way of doing things, both the direction of Moodle development and velocity at which occurs are largely controlled by Moodle Pty. However much input the company may take from the community, the ultimate decisions and, perhaps more importantly for this post, the work of implementing those decisions, fall under the purview of Moodle Pty, a for-profit company that must generate revenue to pay the employees who actually write that code. Moodle Pty’s revenues mostly come from Moodle Partners, which are companies that are licensed to use the Moodle trademark by Moodle Pty in return for a percentage of their Moodle-related gross revenues.

    If Moodle Partners lose paying customers, then Moodle Pty loses revenue. If Moodle Pty loses enough revenue, then at some point it would have to start laying off developers. If Moodle Pty starts laying off developers, then the pace of Moodle development will slow. If the pace of Moodle development slows, then the loss of Moodle-adopting schools may accelerate, creating a vicious cycle.

    While we don’t know the percentage of Moodle’s revenues that come from higher education (as opposed to K12 and corporate), we know it’s significant. The anecdotes I have heard from various sources suggest that it may well be the substantial majority of the total financial resources that fund the development of Moodle’s core platform. So, while other kinds of adoption may be great and may bring in new participants to the Moodle community, Moodle advocates should be concerned with higher education institutional adoption if they are concerned with having development resources for the Moodle platform in the long term.

    Irrelevant?

    Another argument we hear sometimes is that the Moodle community doesn’t need to care about these numbers because, as an open source project, it will fulfill its purpose if meets the needs of its adopters and doesn’t need growth for its own sake the way that a for-profit project does. Martin himself made this argument in the comments referenced above:

    Martin ended his comment on this topic by saying what makes our project different is that we are not driven by numbers. We are driven by the needs of our users and that he would be happy if there were only 100 universities using Moodle if we are following that approach.

    From an abstract philosophical perspective, this is undeniably true (or was at the time the comment was made, at any rate). An open source project does not need to satisfy investors or meet revenue targets. It just needs to attract enough developer resources to keep the code base viable and up-to-date. But there are a few serious problems with this argument in Moodle’s specific case.

    First, Moodle’s growth model was spectacularly successful in its first decade in part because it was a Robin Hood model. In richer countries, adopters could afford to pay hosting or management companies to run their mission-critical instances. A portion of this money would flow back to Moodle Pty and get invested in the salaries of developers who would improve Moodle and continue to release it under an open source license. In poorer countries, they could adopt Moodle themselves without paying a hosting or support vendor. Moodle has always been unusually easy to install and run on even modest hardware relative to its competition, so poorer schools could still manage to adopt it with the resources that they had. But if Moodle is losing ground in the richer countries (or, more accurately, the countries that can invest and are investing more dollars in educational technology), then it is also losing its development revenue base.

    (I would add that the message, “Hey, it’s no big deal to us if we lose some adopters” is not a great one for members of the community who feel like their needs are not being met.)

    But the problem is potentially worse for Moodle, because we’re beginning to see a pattern take hold in international markets as they reach a certain level of maturity, and it’s not good a good one for Moodle. In the US and Canada, the big hurdle to LMS migration was the move from self-hosted to cloud. Once institutions became comfortable with cloud hosting, the market changed rapidly, with Canvas in particular taking a strong lead and Moodle (among others) losing ground.

    We are seeing early evidence that the same pattern may be beginning to take hold in Europe now. While the data we have are not definitive yet, they are suggestive and are supported by the qualitative research we are doing. And this pattern could easily take hold elsewhere as well. For example, my colleague O’Neal Spicer and I recently had the good fortune to visit Brazil, where Moodle is still very much dominant. But consider this: Seventy-five percent of Brazil’s college students go to for-profit universities, and those businesses are enormous and growing. For example, Kroton, the country’s largest university, has about 2 million students. Given that these organizations are companies with investors and profit motives, there is no particular reason to believe that they are ideologically inclined toward open source. The fact that both Instructure and D2L have offices in São Paolo suggest that they believe they have an opportunity to win over the Brazilian market now that it has gotten big enough to be profitable for them. In other words, Moodle’s Robin Hood model is under threat because whenever a market becomes rich enough to generate significant revenue for Moodle Pty, it also becomes rich enough for universities to consider switching to cloud hosting by one of Moodle’s commercial competitors.

    Adding to this pressure is the fact that Moodle Pty just took $6 million in investment money. This is not a grant; it is an investment. However well-aligned and patient those investors may be, they still will eventually need to see a return on their $6 million. When investors do not see the return they expected, they eventually begin to put pressure on the company management to take steps that improve the finances. I don’t know enough about the terms of this particular investment relationship to know what kind of leverage Leclercq has to push for changes in Moodle Pty if they are not happy with its performance, but the fact of the matter is that Moodle Pty now has financial performance targets to meet.

    Put all this together, and it strongly suggests that members of the Moodle community should be concerned about the adoption trends we are seeing, for both mission and strategic reasons.

    Moodle’s Role

    I want to return to the example of Brazil for a moment to show why this matters not just to Moodle advocates but to anyone who cares about education. According to the 2016 Analytic Report of Distance Learning in Brazil published by Brazil’s premiere distance learning association, the Associação Brasileira de Educação a Distãncia (ABED), about three-quarters of a million Brazilians took online or blended courses in 2016. According to our analysis, Moodle has over 80% of Brazil’s higher education institutional LMS market share. It’s entirely possible that we would not have seen that kind of growth in access to education if Moodle had not existed. Yes, one or more other open source LMSs might have been adopted, but the existence of that Robin Hood sustainability engine built by Martin Dougiamas ensured that significant developer resources went to developing a high-quality globally adoptable LMS that could be deployed by even poor institutions. It has been an engine of educational growth.

    If the data patterns we are observing hold, then that engine may be under long-term threat. While Moodle has far too broad an installed base to disappear any time soon and just received an infusion of investor money, the fact is that its sustainability model is now in question. That’s bad for everyone. It’s bad for Moodle advocates, it’s bad for people who care about improving educational access for the developing world and economically challenged people in general, and it’s bad for those educational technology companies that have depended on international maturation of markets that open up new commercial opportunities for them.

    For everyone’s sake, I hope that the Moodle community—and particularly its leadership—owns up to this potential challenge to its sustainability model and confronts it head-on.

     

  • A Note on Data Used for LMS Market Analysis

    A Note on Data Used for LMS Market Analysis

    Recently Martin Dougiamas of Moodle has questioned our data analysis for the LMS market. In some useful notes posted at Moodle.com on two recent Future Trends Forums hosted by Bryan Alexander:

    Bryan finished the Future Trend Forum by asking for Martin’s thoughts on the recent article by Phil Hill titled: “Whither Moodle?” [edited] which speculated that Moodle’s growth is slowing down and hitting a plateau.

    Martin commented that is not the case from what he is seeing and that a lot of the information contained in the article is US-based where there a lot of more LMS vendors and venture capitalists building learning platforms.

    While this description from Martin is inaccurate, the issues raised are representative of some of the questions we occasionally get about our data for our LMS market analysis service. I think it would be useful to share a deeper description in public of how our partners at LISTedTECH collect and organize the underlying data.

    What We Measure

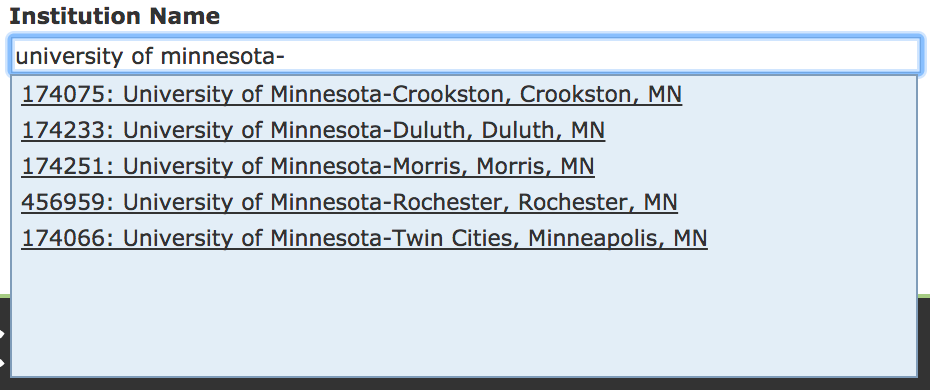
    The market data are organized in a dataset that captures system usage on a per higher education institution basis. For most schools, a campus is equivalent to an institution. But there are also cases where there multiple campuses per university (e.g. University of Minnesota system with five campuses, or DeVry University with dozens of campuses) and the LMS decision is made at the system level. In these situations, one decision will lead to multiple institutions listed in the data. In the US, the definition of an institution is guided by unique identifiers in the Department of Education’s IPEDS data, and each region or even country has its own way of defining institution.

    The dataset goes beyond “school X uses system Y”, as it also includes dates of implementation and decommission, usage as primary or secondary system (there may be more than one system in use at a school), and hyperlinks to the public information documenting a system selection or usage. The definition of institutions includes information about its sector (public two-year, private non-profit four-year, etc) as well as student enrollments.

    How We Measure

    Looking deeper at LMS selection, there are multiple layers of data gathering at different intervals. Some of the sources:

    • Extensive search engine notification such as Google Alerts on product keywords in multiple languages;
    • URL and domain scrapers looking for system information at official school websites; and
    • Targeted human-directed searches.

    Each new data point is verified by someone using the associated hyperlinks tied to selection or usage data.

    Our North American data is essentially saturated, in that we know the vast majority of degree-granting institutions based on US Department of Education data or Canadian provincial governmental data. We have well above 90% of all schools in the dataset.

    For the global regions outside of North America, we are building up the dataset and do not have saturated coverage yet. For example, in Europe we estimate that we have 60 – 75% of institutions. We have less than that in Latin America and more than that in Oceania.

    Where feasible, we include on-the-ground subjective coverage by visiting the global regions, testing theses, finding out unique context, and finding local sources who can provide QA to our data.

    Besides our home base of North America, we have made multiple trips to Europe and Latin America thus far, and we are currently arguing about who gets to visit Australia and New Zealand.

    We plan to expand coverage to additional regions as we develop at least 30% coverage of institutions and have time to do additional research to back up our analysis.

    Degrees of Uncertainty

    Because higher education data is lumpy and based on extended implementation times, we offer the following caveats:

    • Market share information provided in percentages and trends are more reliable than absolute counts outside of North America. When we do provide absolute numbers, we advise caution for readers or subscribers to not over-interpret the absolute numbers, at least without us providing additional details to keep the data in context.
    • We typically separate North American data from Rest of World data (Europe, Latin America, Oceania) to avoid problem of North America numbers dominating aggregates and obscuring important regional differences.
    • When we have system usage information but do not have accurate implementation dates (per month or quarter), we assign these system records to June. Therefore the summer data for new systems will appear artificially high. We currently have implementation dates for approximately 75% of the listed LMS records.
    • Put another way, annual data is more reliable (i.e. without additional data collection noise) than half-year or quarterly data. The more-granular data is provided to certain subscribers, but we take great care in attempting to describe sources of “lumpiness” in the data that should be understood for any analysis.

    Overall, we have LMS data for 4,523 institutions in the US and Canada and 8,824 institutions worldwide.

    Back to the Future (Trends)

    To see these issues with an example, consider the updated chart of new implementations that led to the Future Trends Forum discussion described above.

    What is relevant to the dataset for this chart:

    • The data is based not on North American data – it is based on data from Europe, Latin America, and Oceania (Australia, New Zealand, and surrounding island countries).
    • The data comes from public sources per institution as described above and does not come from vendors;
    • The data is for primary systems – the official campus LMS; and
    • The caveats listed above should apply. Note that we identified a new trend early in 2017 (collapse of Moodle new implementations) that we can update with data through 10 months of the year – the data today is more solid than it was in early summer.

    I hope this description will answer some of the questions people have asked about our data.

  • State of Higher Ed LMS Market for US and Canada: Fall 2017 Edition

    State of Higher Ed LMS Market for US and Canada: Fall 2017 Edition

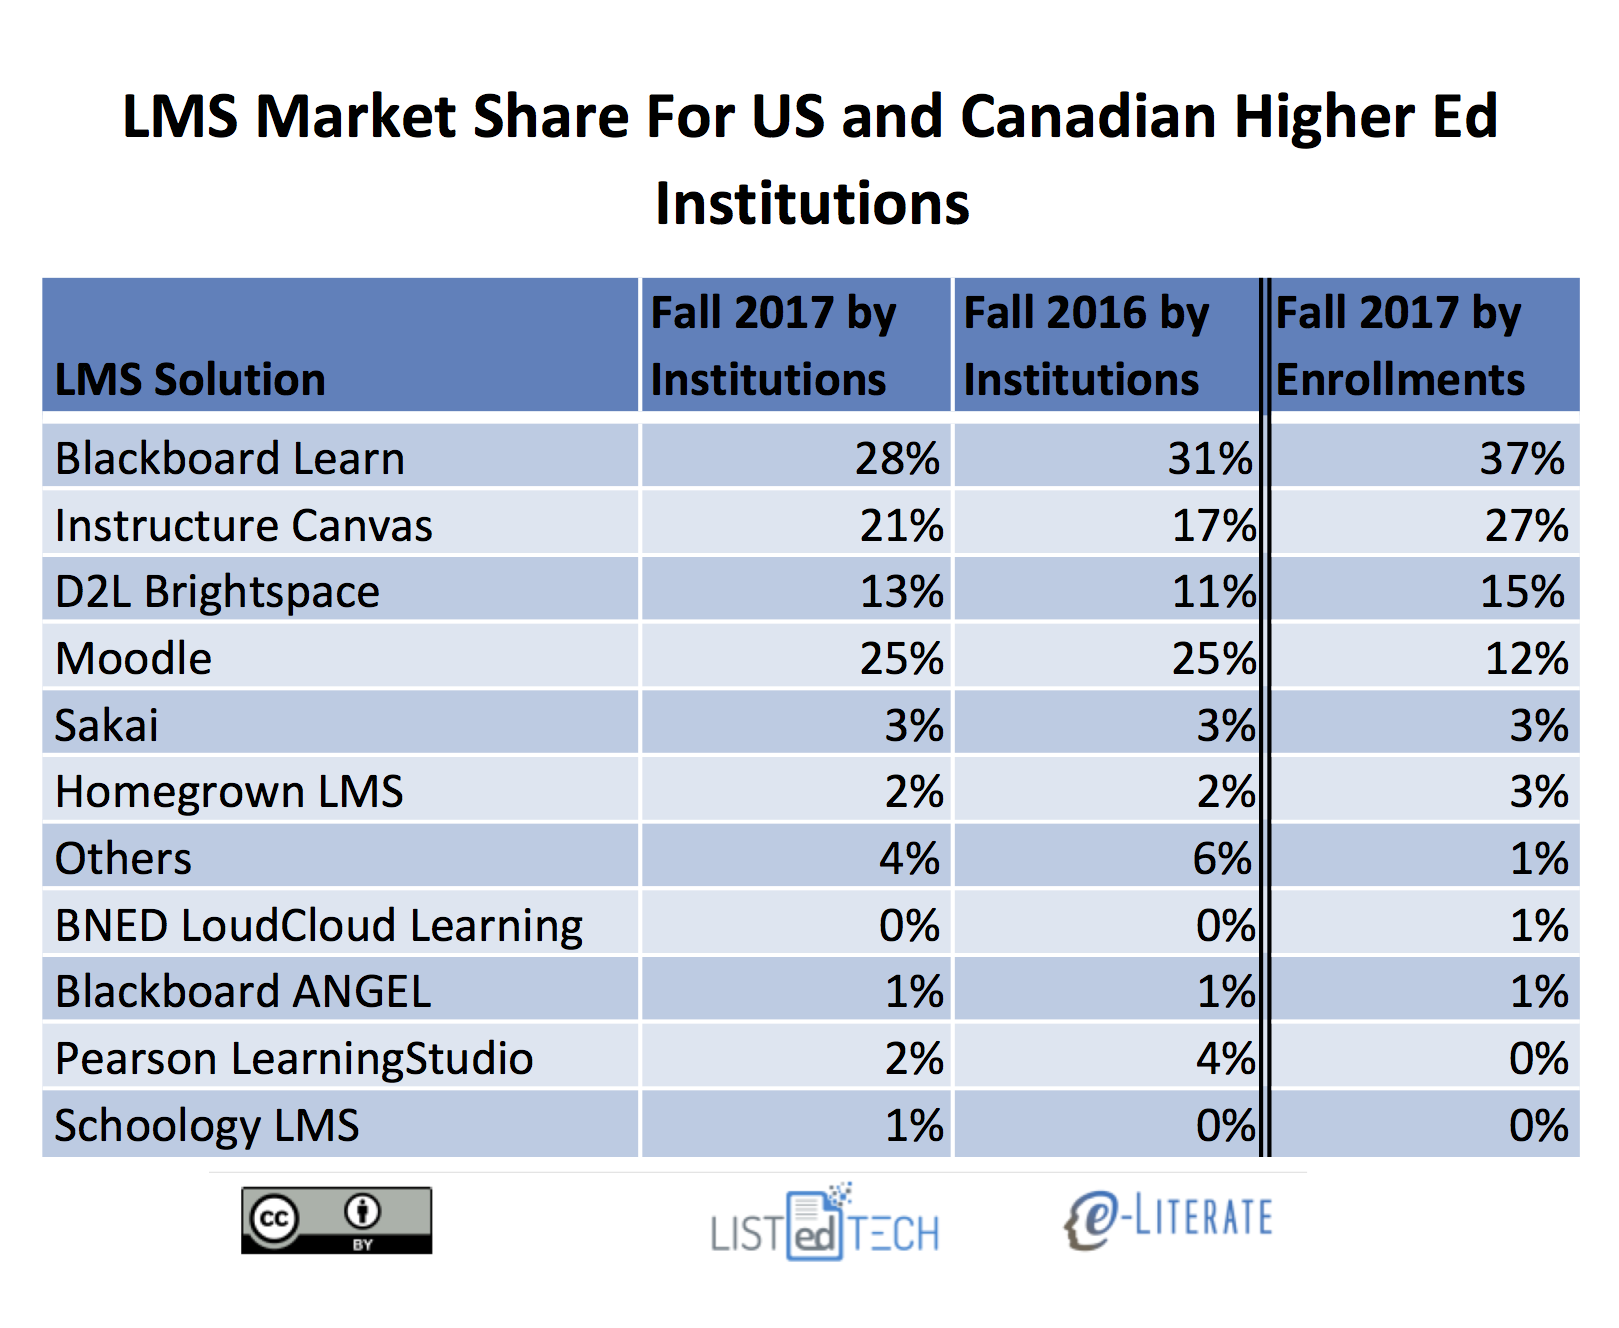
    Now that we’re past the 2017 WCET conference and headed to the EDUCAUSE conference, let’s look at updates on the institutional LMS market for North America (US and Canada). Last year we started our LMS market analysis service, where we are working with LISTedTECH to provide market data and visualizations, and our fall report for subscribers will be released in about a month. Data for 2017 presented below goes through October 1 of this year.

    We present the data “by institutions”, with market share as a percentage of the total number of institutions using each LMS as a primary system, and “by enrollments”, where we scale the institutions by their total enrollment. The latter better captures the business of the LMS market, since most licensing deals are based the number of students. We have also included data from Fall 2016 by institutions for comparison purposes.

    Some notes on the market share as defined by percentage of institutions:

    • In terms of new selections the market continues to be a two-horse race recently with Canvas by Instructure and Brightspace by D2L as the only two solutions with material gains in market share. Canvas grew from 17% to 21% , and Brightspace from 11% to 13%, of the market.
    • Outside of the big four – Blackboard Learn, Canvas, D2L Brightspace, and Moodle – no other system has more than 3% of the market measured either by percentage of institutions or percentage of enrollments. Furthermore, the category of “Others”, capturing systems not listed above and having less than 1% market share, actually dropped from 4% to 2% of the market. This indicates that continued market consolidation.
    • Schoology and BNED LoudCloud grew slightly, but not nearly to the degree of the Canvas and Brightspace.
    • Blackboard Learn fell the farthest, from 31% to 28% of of the market. The second biggest drop was Pearson LearningStudio, from 4% to 2%, based on its end-of-life notice for December 2017.
    • Moodle and Sakai both lost market share of just under 1%, not enough to show up in the rounded numbers in the table but enough to show up in our underlying data.
    • The difference in Moodle’s market share by institutions at 25% and by enrollments at 12% really shows how concentrated their usage is for smaller schools.
    • When viewing market share as defined by percentage of enrollments, Blackboard and Canvas are the most-used systems, at 37% and 27% of the market, followed by D2L at 15% and Moodle at 12%.

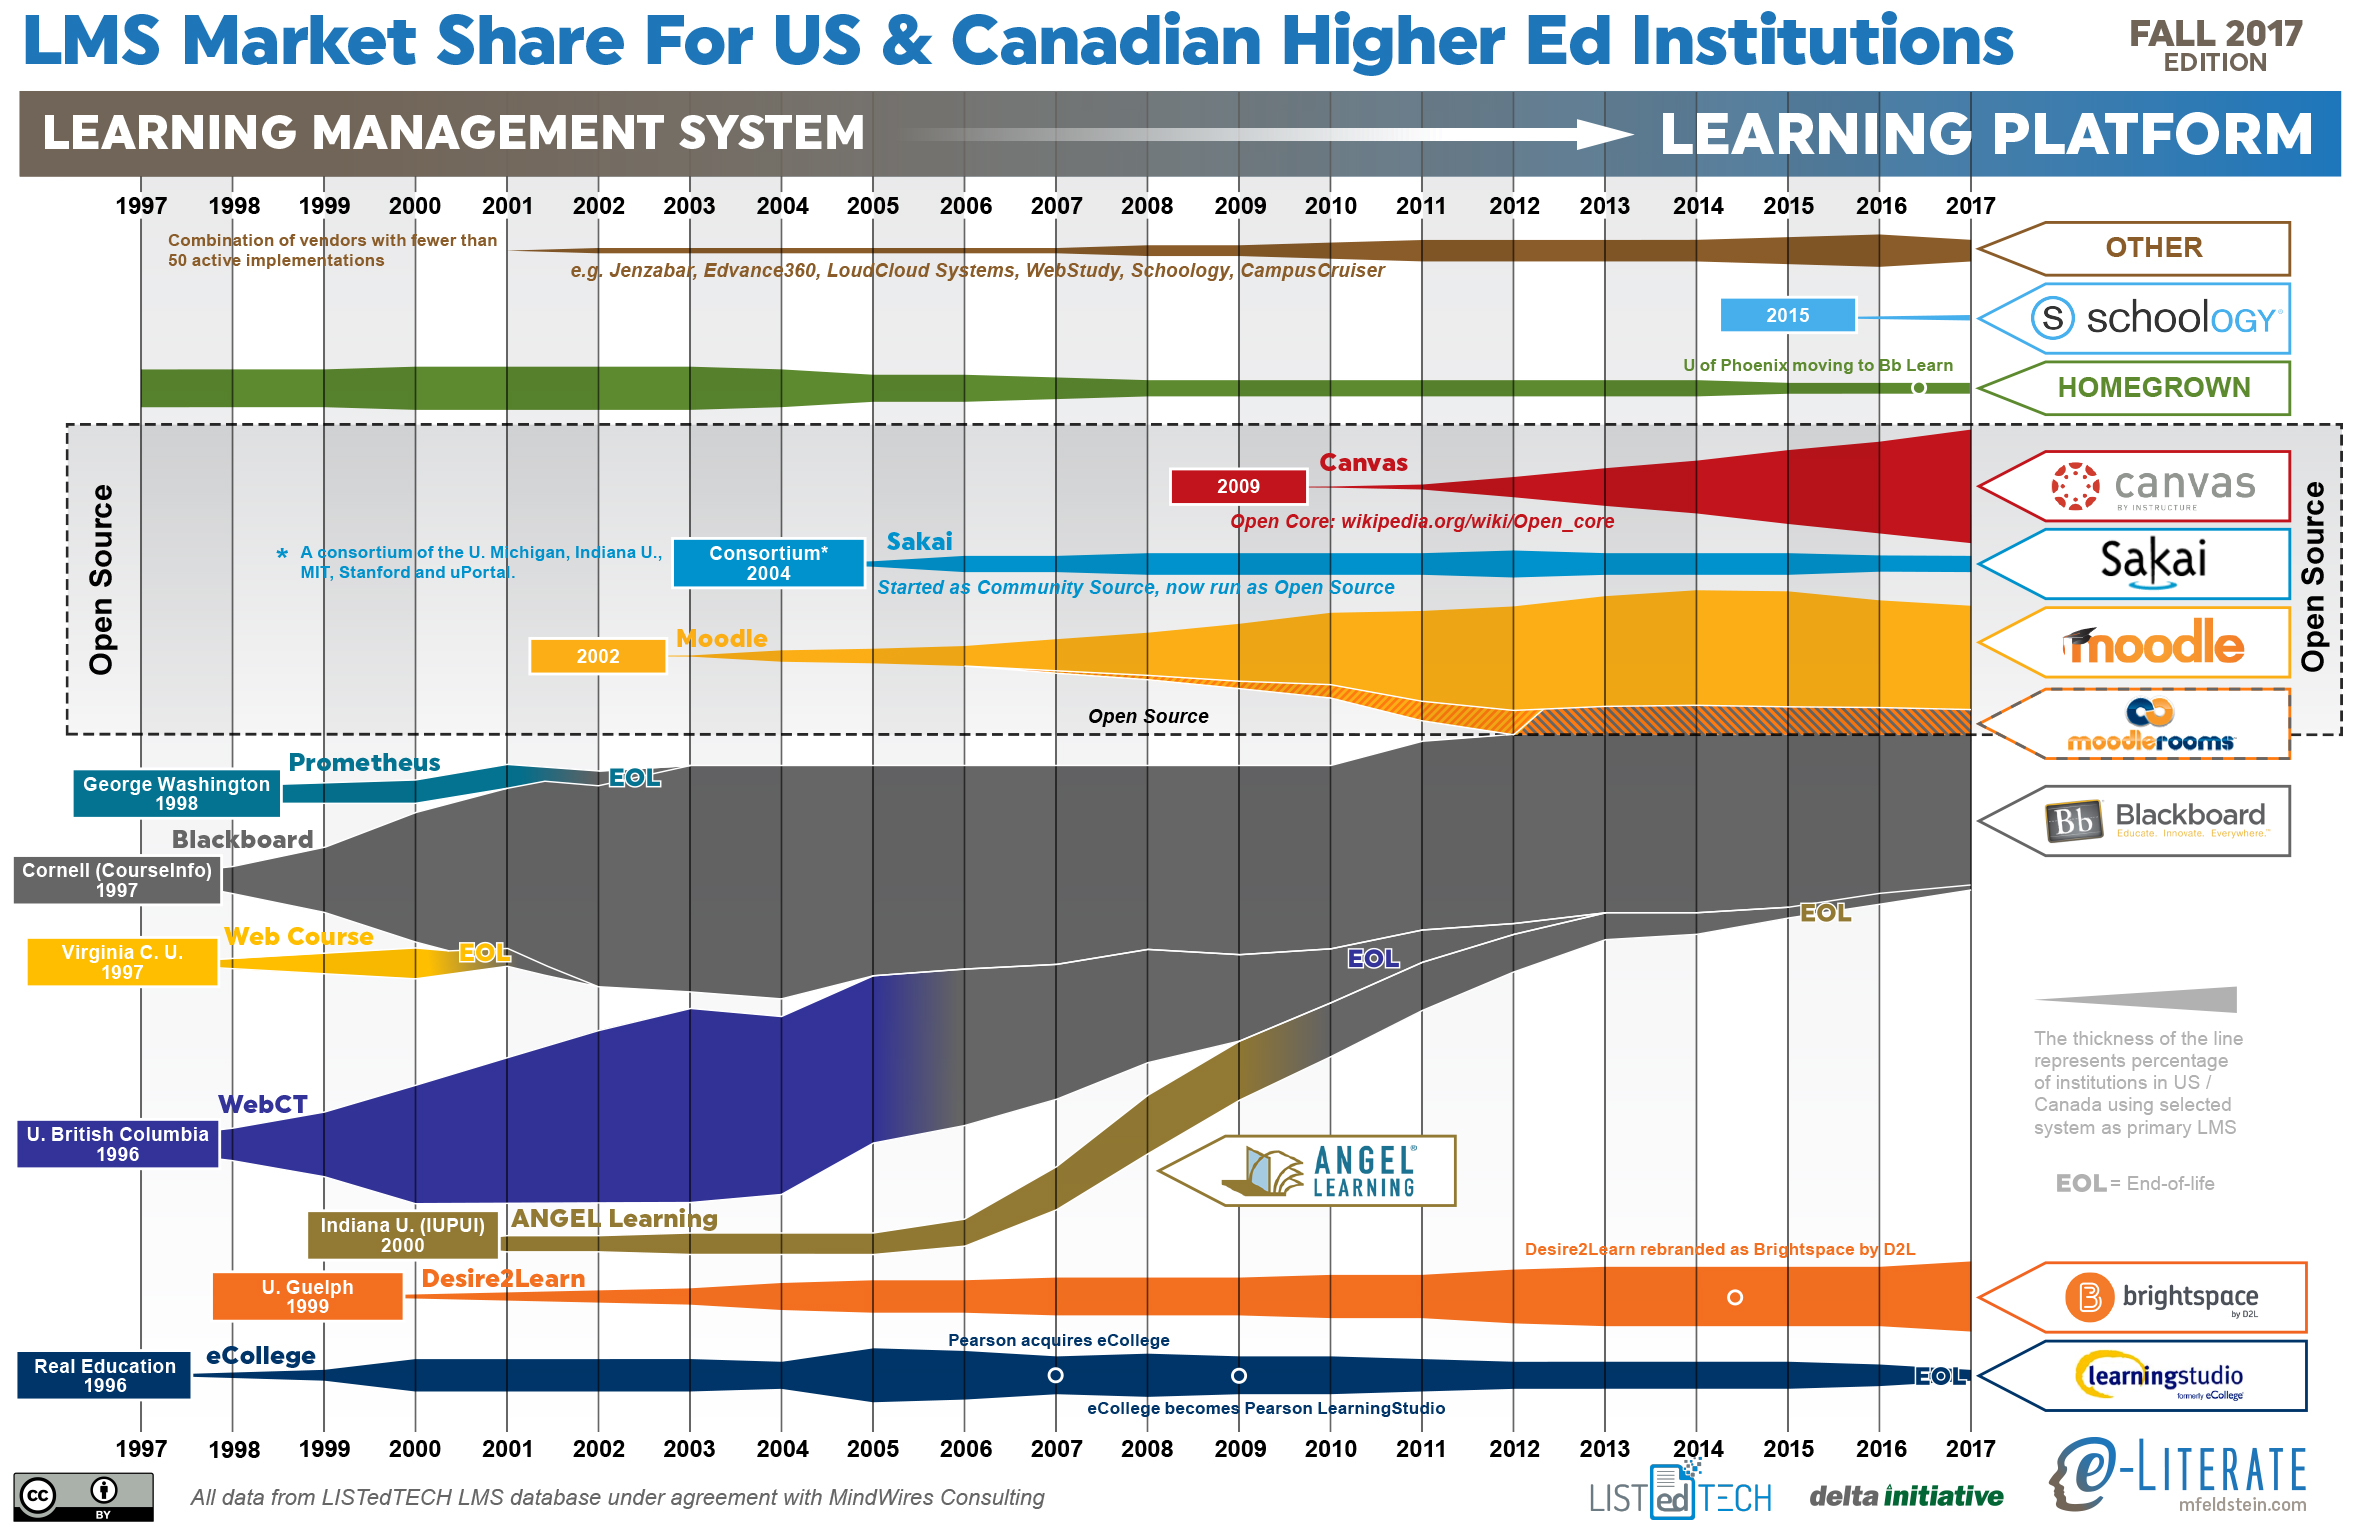
    Stepping back from the immediate data, let’s look at an updated LMS market share graphic, commonly known as the squid graphic, for US and Canadian higher education. The original idea remains – to give a picture of the LMS market in one page, highlighting the story of the market over time. The key to the graphic is that the width of each band represents the percentage of institutions using a particular LMS as its primary system.

    Some additional notes:

    • Blackboard and Moodle have been the market leaders as number one and two in share as they have been for the past decade. However, Canvas is quickly approaching Moodle’s market share.

    We’ll share any updates we discover at the conference this week.

  • Google Classroom: Isolated adoptions for higher education institutions

    At last month’s Future Trends Forum hosted by Bryan Alexander, I received several questions around the intersection of K-12 and higher education markets for learning platforms. A condensed version of my answer is that the mainline LMS vendors are seeing increased overlap (Canvas, D2L Brightspace, Blackboard, Moodle, and Schoology in particular), but that there was little overlap when it comes to the teacher-oriented Big Classrooms (Google and Facebook).

    Three years ago when the buzz over Google Classroom was at its peak, I wrote several posts looking at the platform, ultimately concluding in the post titled “Why Google Classroom won’t affect institutional LMS market … yet”:

    None of this argues that Google Classroom is an inferior tool – it is just not designed to replace the full-featured LMS. Remember that Google is a technology-vision company that is comfortable putting out new tools before they understand how the tools will be used. Google is also comfortable playing the long game, getting more and more instructors and faculty using, giving feedback, and pushing forward the new toolset. This process will take some time to play out – at least 2 or 3 years in my opinion before a full institutional LMS may be available. If Google like the direction Classroom usage is going.

    Subsequently, Google has addressed some of the gaps in the product, including a programming interface that could allow deeper integration with student record systems used at higher ed institutions.

    We’re now 3 years down the road from the initial analysis – has Google Classroom started to be adopted as a full institutional LMS?

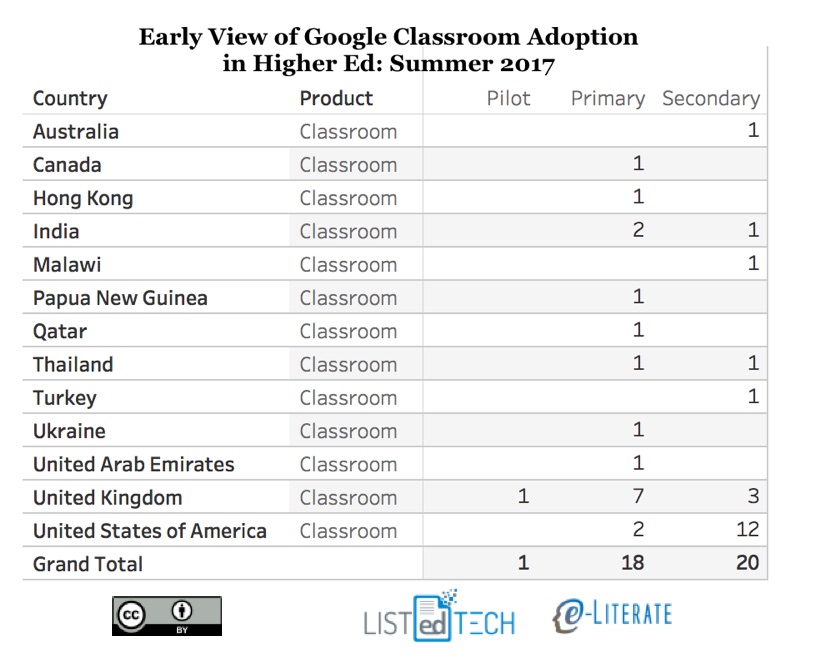
    Our partners at LISTedTECH have performed an initial analysis on this question. We do not yet have full data coverage in the same fashion as our LMS market analysis, but this early view should give some insight into higher ed adoption of the platform.

    For this initial view, we are looking at institutional adoption. Where a school supports Google Classroom as their primary or secondary system. There are plenty of other cases where individual faculty choose to use the platform in an unsupported manner.

    Notes from initial view:

    • A lot of the interest seems to come from developing countries where the education budgets are quite low. Malawi, Papau New Guinea, etc.
    • For the United Kingdom, the number is artificially high as 5 of the institutions are all part of Warwickshire College Group (a collection of Further Education colleges). Nevertheless, the UK has the higher number (so far) of institutional adoptions.
    • The usage of Google Classroom as a secondary system makes sense – an alternative platform that doesn’t have all the features and integrations typically needed for primary system usage – but there are cases now of primary usage.
    • In the US, the most notable adoption is the California University of Management and Sciences, a Student and Exchange Visitor Program (SEVP)–certified institution in Anaheim. They support both Moodle and Google Classroom for primary LMS usage.
    • While we don’t have comprehensive coverage yet, it appears that there are some isolated cases of Google Classroom institutional adoption in higher education. The platform is still not a true LMS competitor, but we’ll keep watching.
  • Academic LMS Market Share By Enrollments, Part Deux

    Academic LMS Market Share By Enrollments, Part Deux

    Based on our recent publication of market share data and graphics, we have had multiple requests to share similar data by enrollment. In Friday’s post I shared a non-traditional view of the LMS market based on the percentage of institutions within small, medium, and large enrollment bands for North America (US and Canada) and Europe. This view gave some interesting insights, particularly with large positive correlation (Canvas) and negative correlation (Moodle)  between enrollment bands and market share in North America. Meanwhile, there were other LMS solutions (D2L and Sakai in particular) that have fairly consistent distribution in market share.

    For this second view, instead of showing percentage of institutions within each enrollment band, the data is aggregated for all North American institutions and scaled by each institution’s official enrollment data (e.g. the US data is from IPEDS). The net result shows the percentage of enrollments across the region that have different LMS solutions as their primary system at their school. As always, the underlying data for these market share studies is provided by our partner LISTedTECH.

    Some Notes:

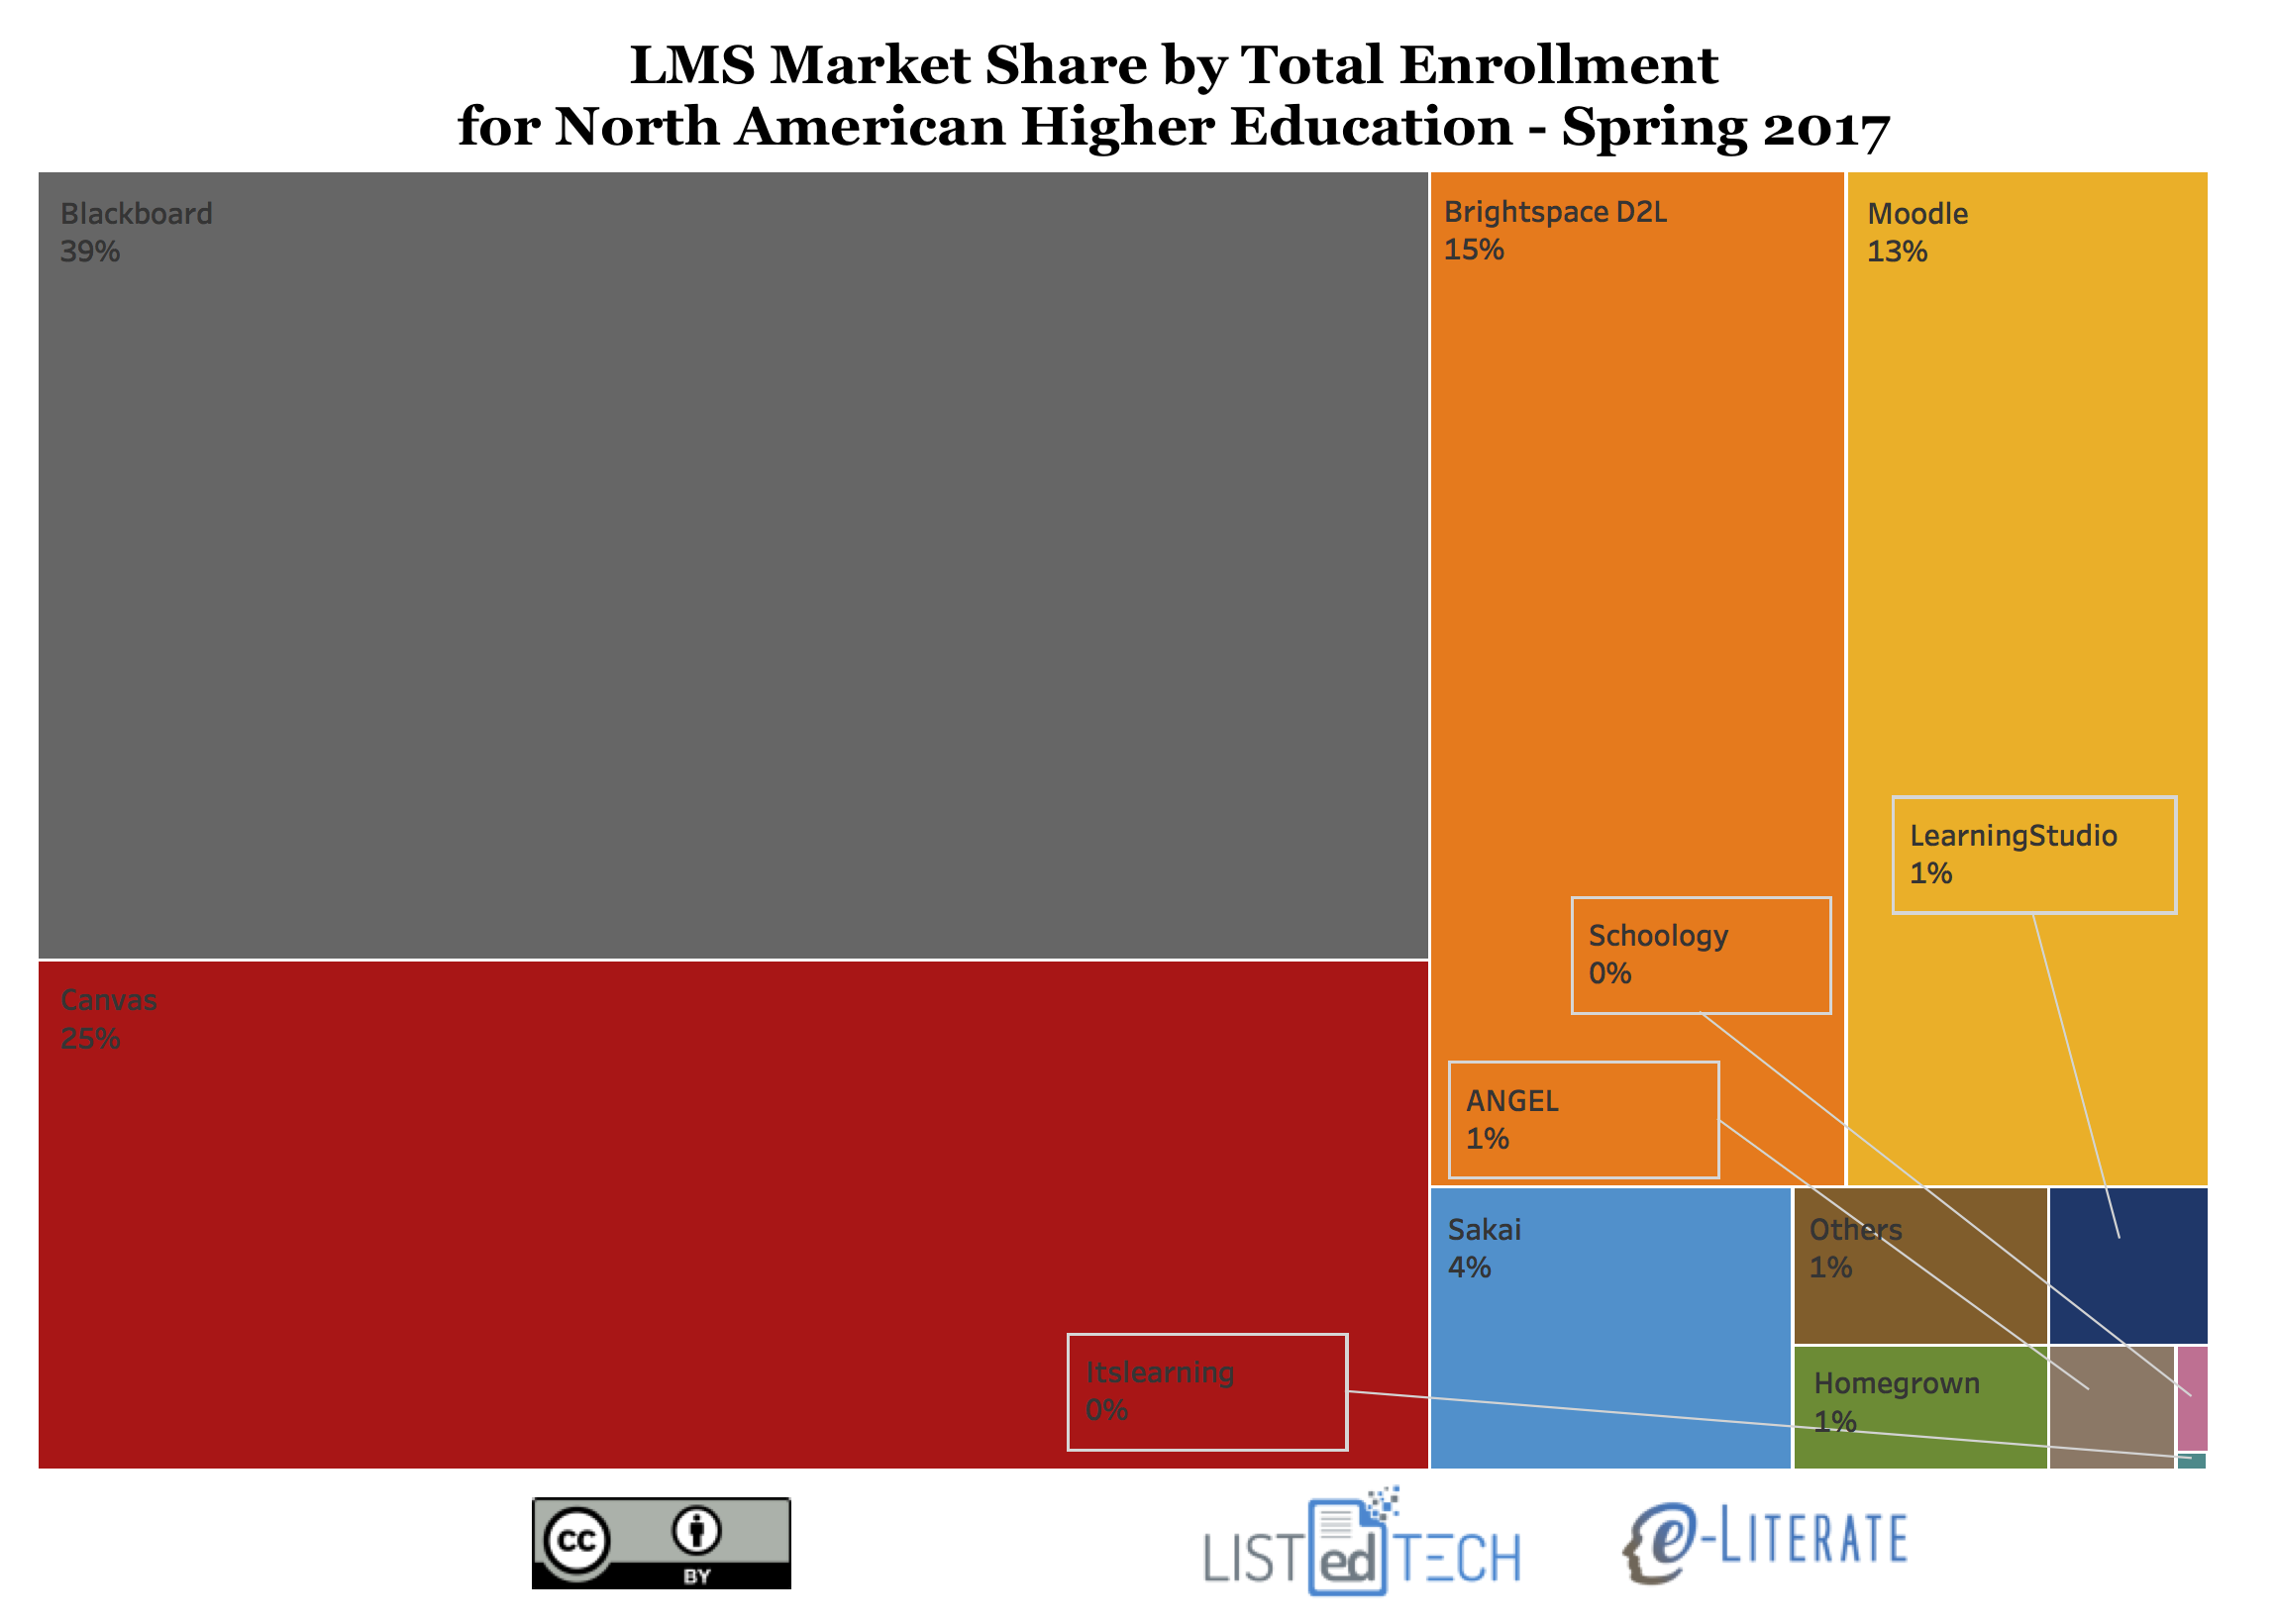
    • For North American Higher Education, Blackboard Learn at 39% is still in first place, Canvas is second at 25%, D2L Brightspace is third at 15%, Moodle is fourth at 13%, and Sakai is fifth at 4%.
    • It has been widely reported when just looking at percentages of institutions that Moodle has long been the second most-used system in North America, but in this view both Canvas and D2L Brightspace have a larger market share.

    It is useful to look at different views using institutional and enrollment metrics to get a deeper understanding of the academic LMS market dynamics.

  • Academic LMS Market Share By Enrollments, Part I

    Since the earliest days of Campus Computing and EDUCAUSE measurement of LMS market data up through recent analysis by Edutechnica and LISTedTECH (the latter our partners for the LMS market analysis service and data behind our LMS graphics), the most common measurement used has been “number of institutions adopting system X as their primary LMS”. But that is only one view, and like any view it has limitations. Sweet Briar College with 900 students is treated with the same metric as Ohio State University with 55,000. I’m sorry, The Ohio State University.

    Based on our recent publication of market share data and graphics, we have had multiple requests to share similar data by enrollment. Both Edutechnica and LISTedTECH have provided such views here and there in the past, but given our recent analysis expansion along with LISTedTECH to cover non-North American regions, we thought it would be worth sharing LMS market data based on enrollments.

    What we cannot do is look at how many students actually use the LMS. But for North America (US and Canada in this case) and Europe, we have sufficient coverage of official enrollment figures that we can scale each institution by its enrollment data. This is how most LMS companies determine their prices for each school, so it is a much better measurement to correlate with market revenues. Not a perfect measure, but a better one.

    In addition, this view gives additional insights into the market and likely future direction of the LMS providers.

    Hey Phil, will you just get to the damn graphics? Let us judge the importance.

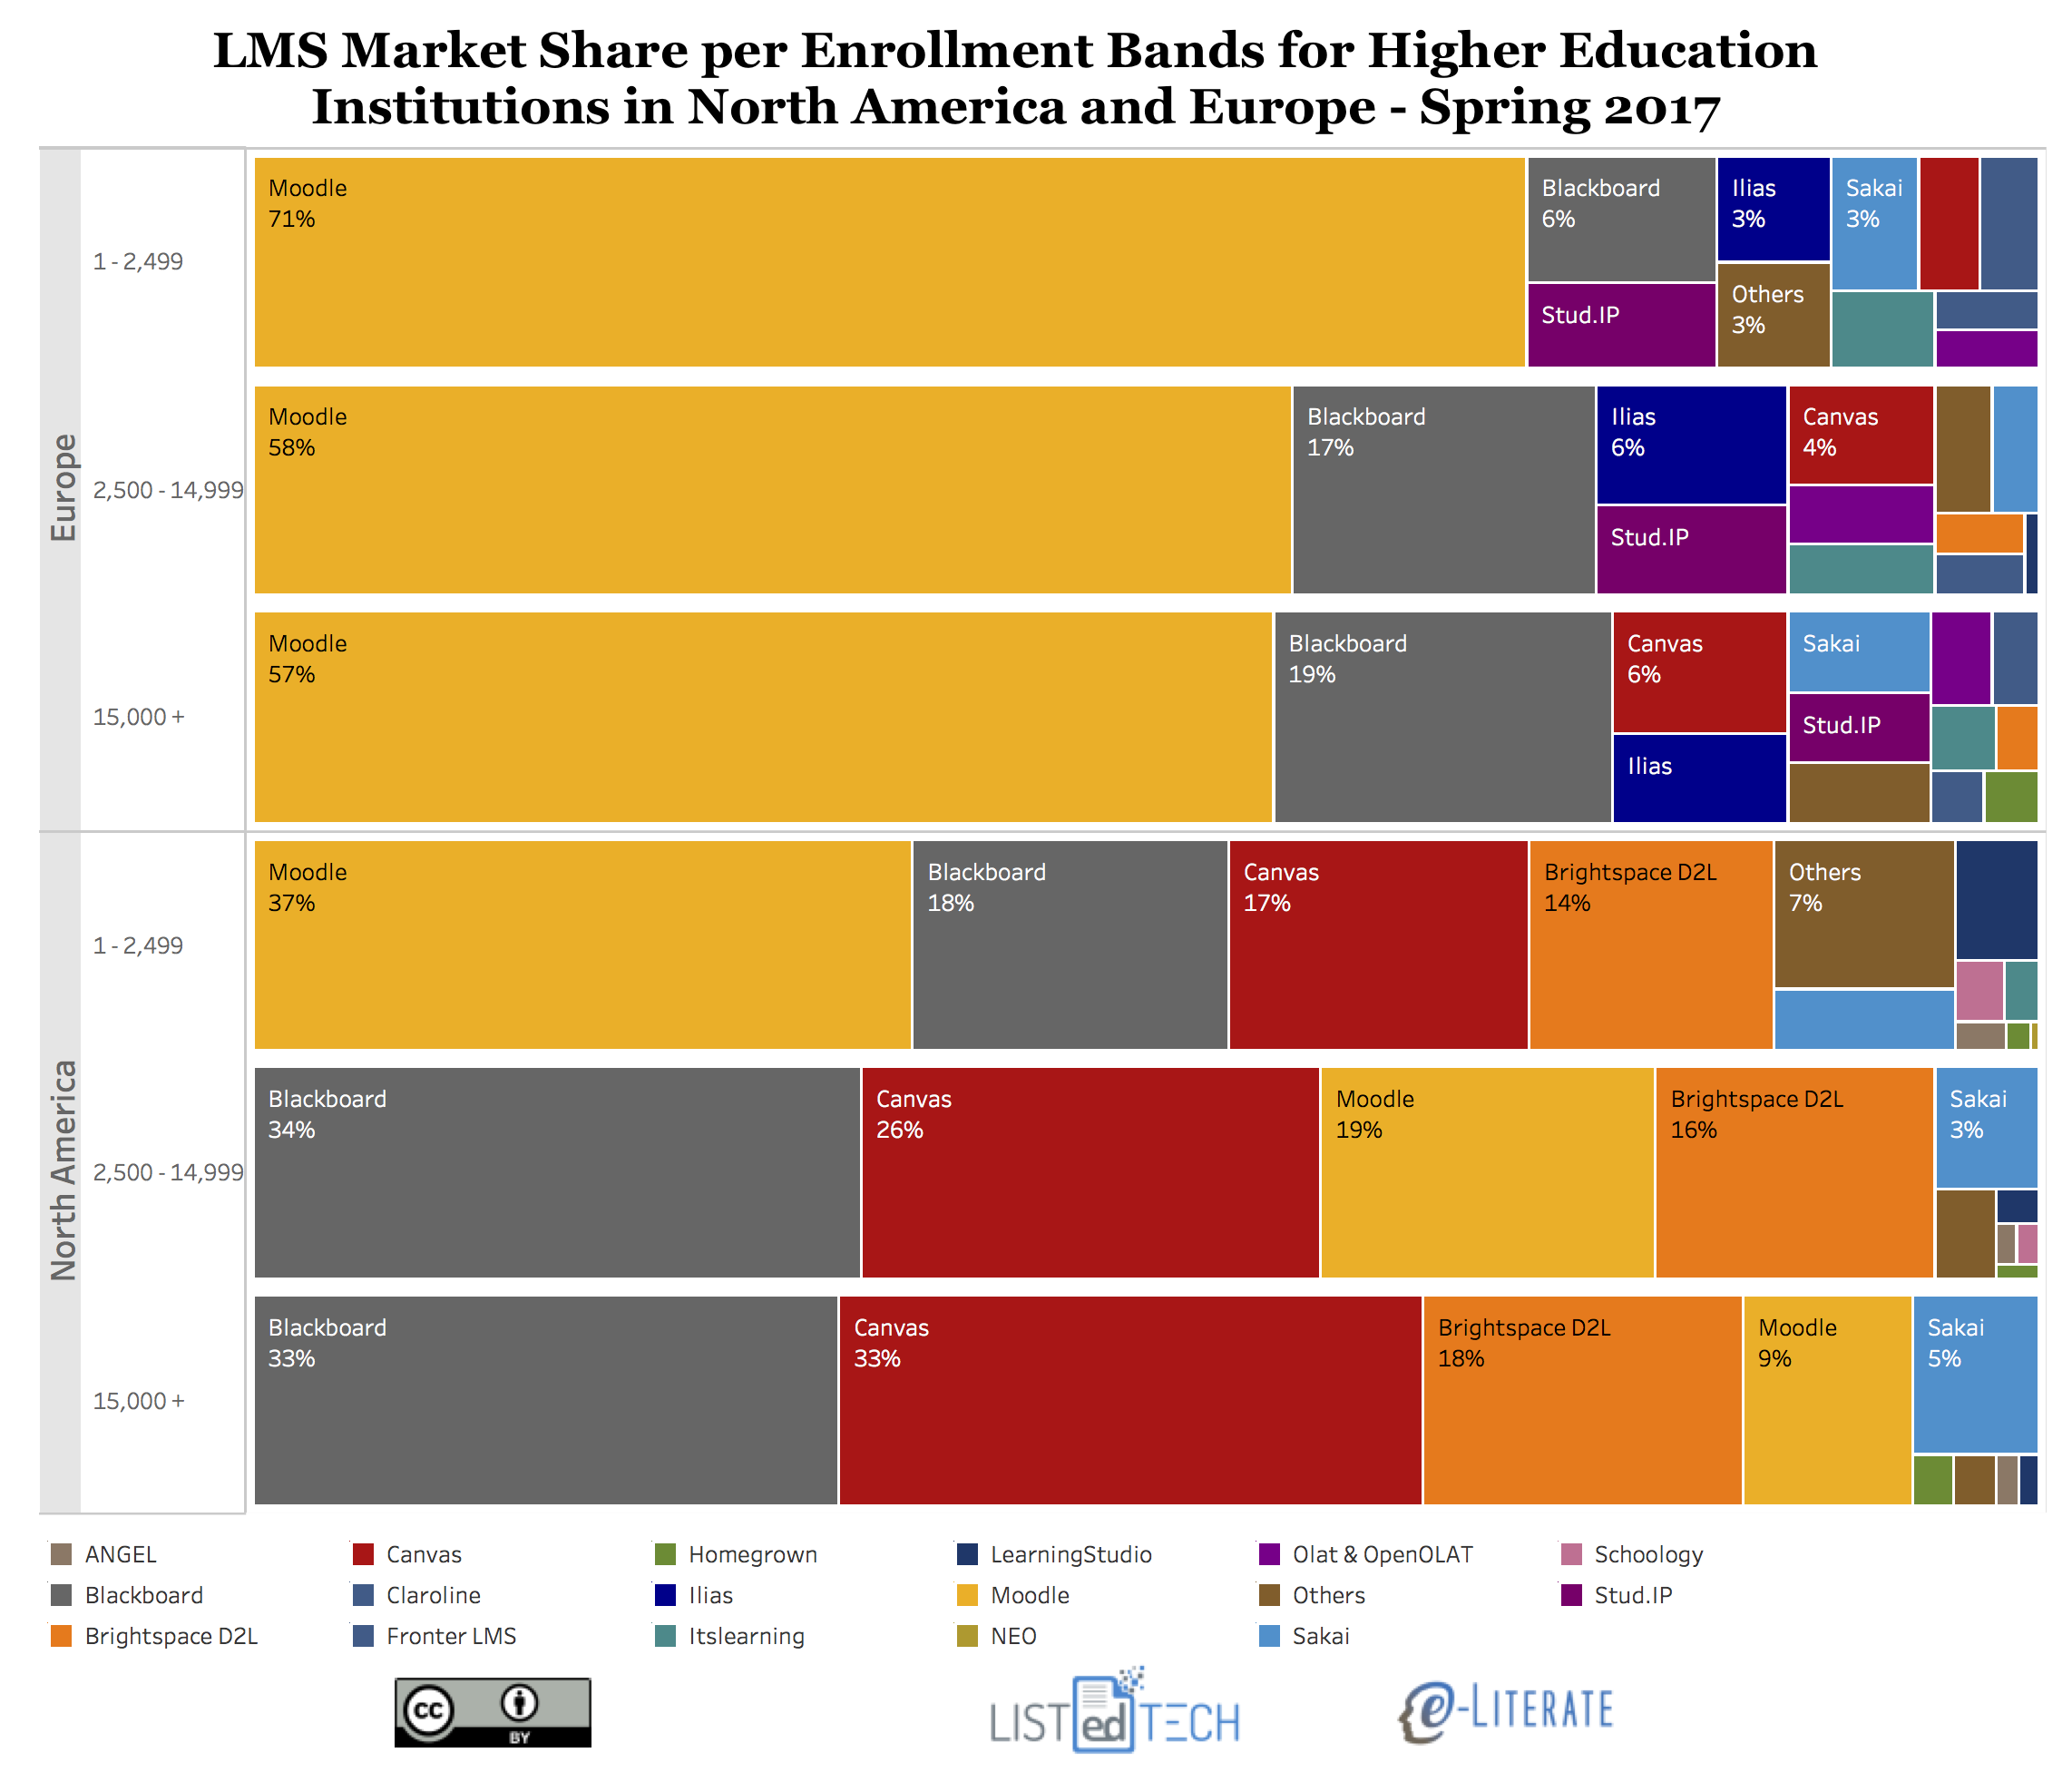
    OK, OK – for our first view, we group all institutions into separate bands of total enrollment and show market share for each band for each region (North America and Europe). Percentage of institutions adopting each LMS within each enrollment band of Small (1 – 2,499), Medium (2,500 – 14,999) and Large (15,000+) enrollments. Update: Clarified language.

    Some Notes:

    • The LMS with the greatest enrollment variation is Moodle, particularly in North America. For small schools below 2,500 students, Moodle is #1 at 37%, but for medium schools it’s #3 at 19% and for large it’s #4 at 9%. A huge difference. In Europe, Moodle market share also inversely correlates with enrollment but to a far smaller degree (71%, 58%, 57%) and it is still #1 in all bands.
    • Blackboard Learn and Canvas vary in North America the opposite direction – larger enrollment sizes equals larger market share – but not quite as dramatically as Moodle’s inverse relationship. Blackboard is #1 with roughly 33% market share for both large and medium institutions but is #2 with 18% for small institutions. Canvas goes from 33% for large to 26% for medium to 17% for small institutions. And note that Canvas and Blackboard Learn are virtually tied for first place for large institutions in North America.
    • D2L Brightspace has the most even distribution, with 18% of large, 16% of medium, and 14% of small institutions. That’s interesting.
    • In Europe, the overall distributions are more consistent with less variation between enrollment bands. While Moodle has smaller market share for larger enrollment bands, the general shape of the market does not change that much – just scaled a bit and with minor variations.
    • In what might be a surprise given its roots in larger research universities, Sakai (like D2L) has a fairly even distribution and similar market share across small, medium and large institutional bands.

    Coming soon – combining data not in enrollment bands but as scaled by each institution’s enrollment numbers.

    Update: See second post here.

  • Follow-Up From Future Trends Forum Discussion On Learning Platforms

    Follow-Up From Future Trends Forum Discussion On Learning Platforms

    Last Thursday I participated in a Future Trends Forum, hosted on the Shindig platform, with host Bryan Alexander on the topic of “What’s next with the LMS?”. I have to admit this was one of the best virtual discussions I’ve had, and more than half of the session was driven by audience questions. You can check out the Twitter discussion, Storified , or listen to an audio recording of the whole session, thanks to Roxanne Riskin. Update: See YouTube video of event posted at end.

    As Bryan described in his blog post:

    Yet maybe the conversation won’t stop there, at 3:05 pm EDT on June 29th. Because when we broke we had more than thirty (!) unanswered questions remaining from the Forum community. I’d like to share those now, so that Phil can respond, but also so that anyone can dive in, whether or not you participated yesterday.

    I don’t have enough time to address all the of the questions, but I would like to tackle a few. We’re also talking about having a part 2 and bringing in Michael in late August. In the meantime . . .

    • Competitiveness – Is the lack of competitiveness due to a lack of innovation or because IT decision makers are looking for consistency/ease of support?

    This question refers to the point I made in this blog post that in four global regions we have two companies dominating the installed base (Moodle, Blackboard), one dominating new implementations (Canvas) with one gaining recent momentum (D2L Brightspace). That’s four solutions dominating across the globe for higher education, hence the “lack of competitiveness” in the question.

    While I think the market needs more innovation, I don’t think that’s the primary cause of this emerging four-way oligopoly. One issue more important than pure innovation is that ed tech is a difficult market in terms of scaling a business, and it is difficult to remain profitable. Canvas is growing fastest, and Instructure (parent company) plans to be cash-flow positive in 2018. As in, Instructure is not profitable yet. Just two years ago Moody’s changed their outlook on Blackboard to negative due to very high debt to EBITDA ratios and “stagnating revenues”.  We have little public information on D2L, but I have pointed out company layoffs occurring after the large investment rounds. Moodle is open source and not directly a system with profits. This comes at a time when the expectations for competitive LMS offerings is rising in terms of cloud hosting and interoperability and intuitive user experience. This is not an easy business.

    • What are your thoughts about competency-based education (CBE)? In particular, with Elliucian leaving the space, do you see a market for a CBE-targeted LMS? And, which products do you see as leaders? or potential leaders?
    • CBE – You’ve brought up CBE a few times. Do you feel there is slower than expected growth for colleges/univ for CBE. Hence, the sun setting of Ellucian’s platform. Or, perhaps, are they force fitting the current LMS to be their CBE LMS?

    See this post describing the very slow growth of CBE platforms. If you think the institutional LMS market is difficult, try the CBE platform market. We do not have the same level of market data for CBE as we do for LMS, but anecdotally I believe that Sagence Learning (formerly FlatWorld) has won the greatest number of CBEN platform selections in the past year or two.

    • Have you seen any trends in terms of schools with more than one LMS – are places consolidating or fracturing? (always surprised by number of institutions that have more than one)

    There is a general, low-level trend in higher education to have fewer cases of secondary LMS usage. Mostly consolidating while aiming to increase the number of third-party apps working alongside the primary system.

    • hosted vs. not hosted – For those LMSs that aren’t open source, do you have any thoughts on how institutions are managing systems – are they choosing to host themselves or are they choosing to use vendor hosting (or other options)?

    In all four global regions we have covered (North America, Europe, Latin America, Oceania), there is a move towards managed and cloud hosting and away from self-hosting. In North America, more than 90% of new LMS selections are going straight to managed or cloud hosting. Europe trends the same direction but is roughly 50 / 50 for new implementations. And I should point out that these trends exist for open source solutions – maybe not to the same level, but in the same direction.

    • K-12 – following up on Schoology and google classroom, what force is K-12 going to be in the future of higher ed LMS? can the teaching energy and innovation of K-12 energize higher ed teaching…?

    I have written several posts on Google Classroom, although I need to do an update. The general answer is that neither Google Classroom or Facebook Classroom show significant signs of affecting the higher ed market. There is some interest in both platforms, but mostly from a small number of individual faculty. And neither platform is designed to solve the gradebook or system integration needs of higher ed. Yet.

    We have several posts on Schoology, which has a bigger potential impact on higher ed for a K-12 based system.

    • Finally, we partially discussed a set of question from Fred Beshears, summarized in this new post. The general topic is around CBE platforms and whether LMS systems are moving to support “massive student information profiles” (across courses for large numbers of students) or whether this is being relegated to student record systems. We partially address these questions in the Future Trends Forum, but not entirely. Hopefully we’ll see others jumping into the online discussion. Update: See discussion thread at Bryan’s post for discussion on this topic.
    • (Update: Finally, finally) I answered two questions in the session about the potential of the LMS as an integration hub, bringing in third-party apps rather than being monolithic systems. The answers were admittedly aspirational. George Station made a good point on Twitter that there is another side to the LMS impact on pedagogy:

    I do agree that this has happened, as covered further in replies to that tweet.