e-Literate

Present is Prologue

Tag: Schoology

  • State of Higher Ed LMS Market for US and Canada: 2018 Year-End Edition

    State of Higher Ed LMS Market for US and Canada: 2018 Year-End Edition

    This is the eleventh year I have shared the LMS market share graphic, commonly known as the squid graphic, for US and Canadian higher education. This past year we at e-Literate shifted our LMS Market Analysis reports from Spring / Fall to Mid-Year / End-of-Year to better allow analysis of entire years. With the release of our end-of-2018 report last week to subscribers, it’s time for us to look at updates on the institutional LMS market for North America (US and Canada) higher education. Note that our coverage for the market analysis includes Europe, Latin America, Oceania (Australia, New Zealand, and surrounding island countries) as well as emerging coverage of the Middle East.

    We present the following data “by institutions”, with market share as a percentage of the total number of institutions using each LMS as a primary system, and “by enrollments”, where we scale the institutions by its total enrollment. The latter better captures the business of the LMS market, since most licensing deals are based the number of students.

    But first, let’s look at an updated LMS market share graphic, commonly known as the squid graphic, for US and Canadian higher education. The original idea remains – to give a picture of the LMS market in one page, highlighting the story of the market over time. The key to the graphic is that the width of each band represents the percentage of institutions using a particular LMS as its primary system.
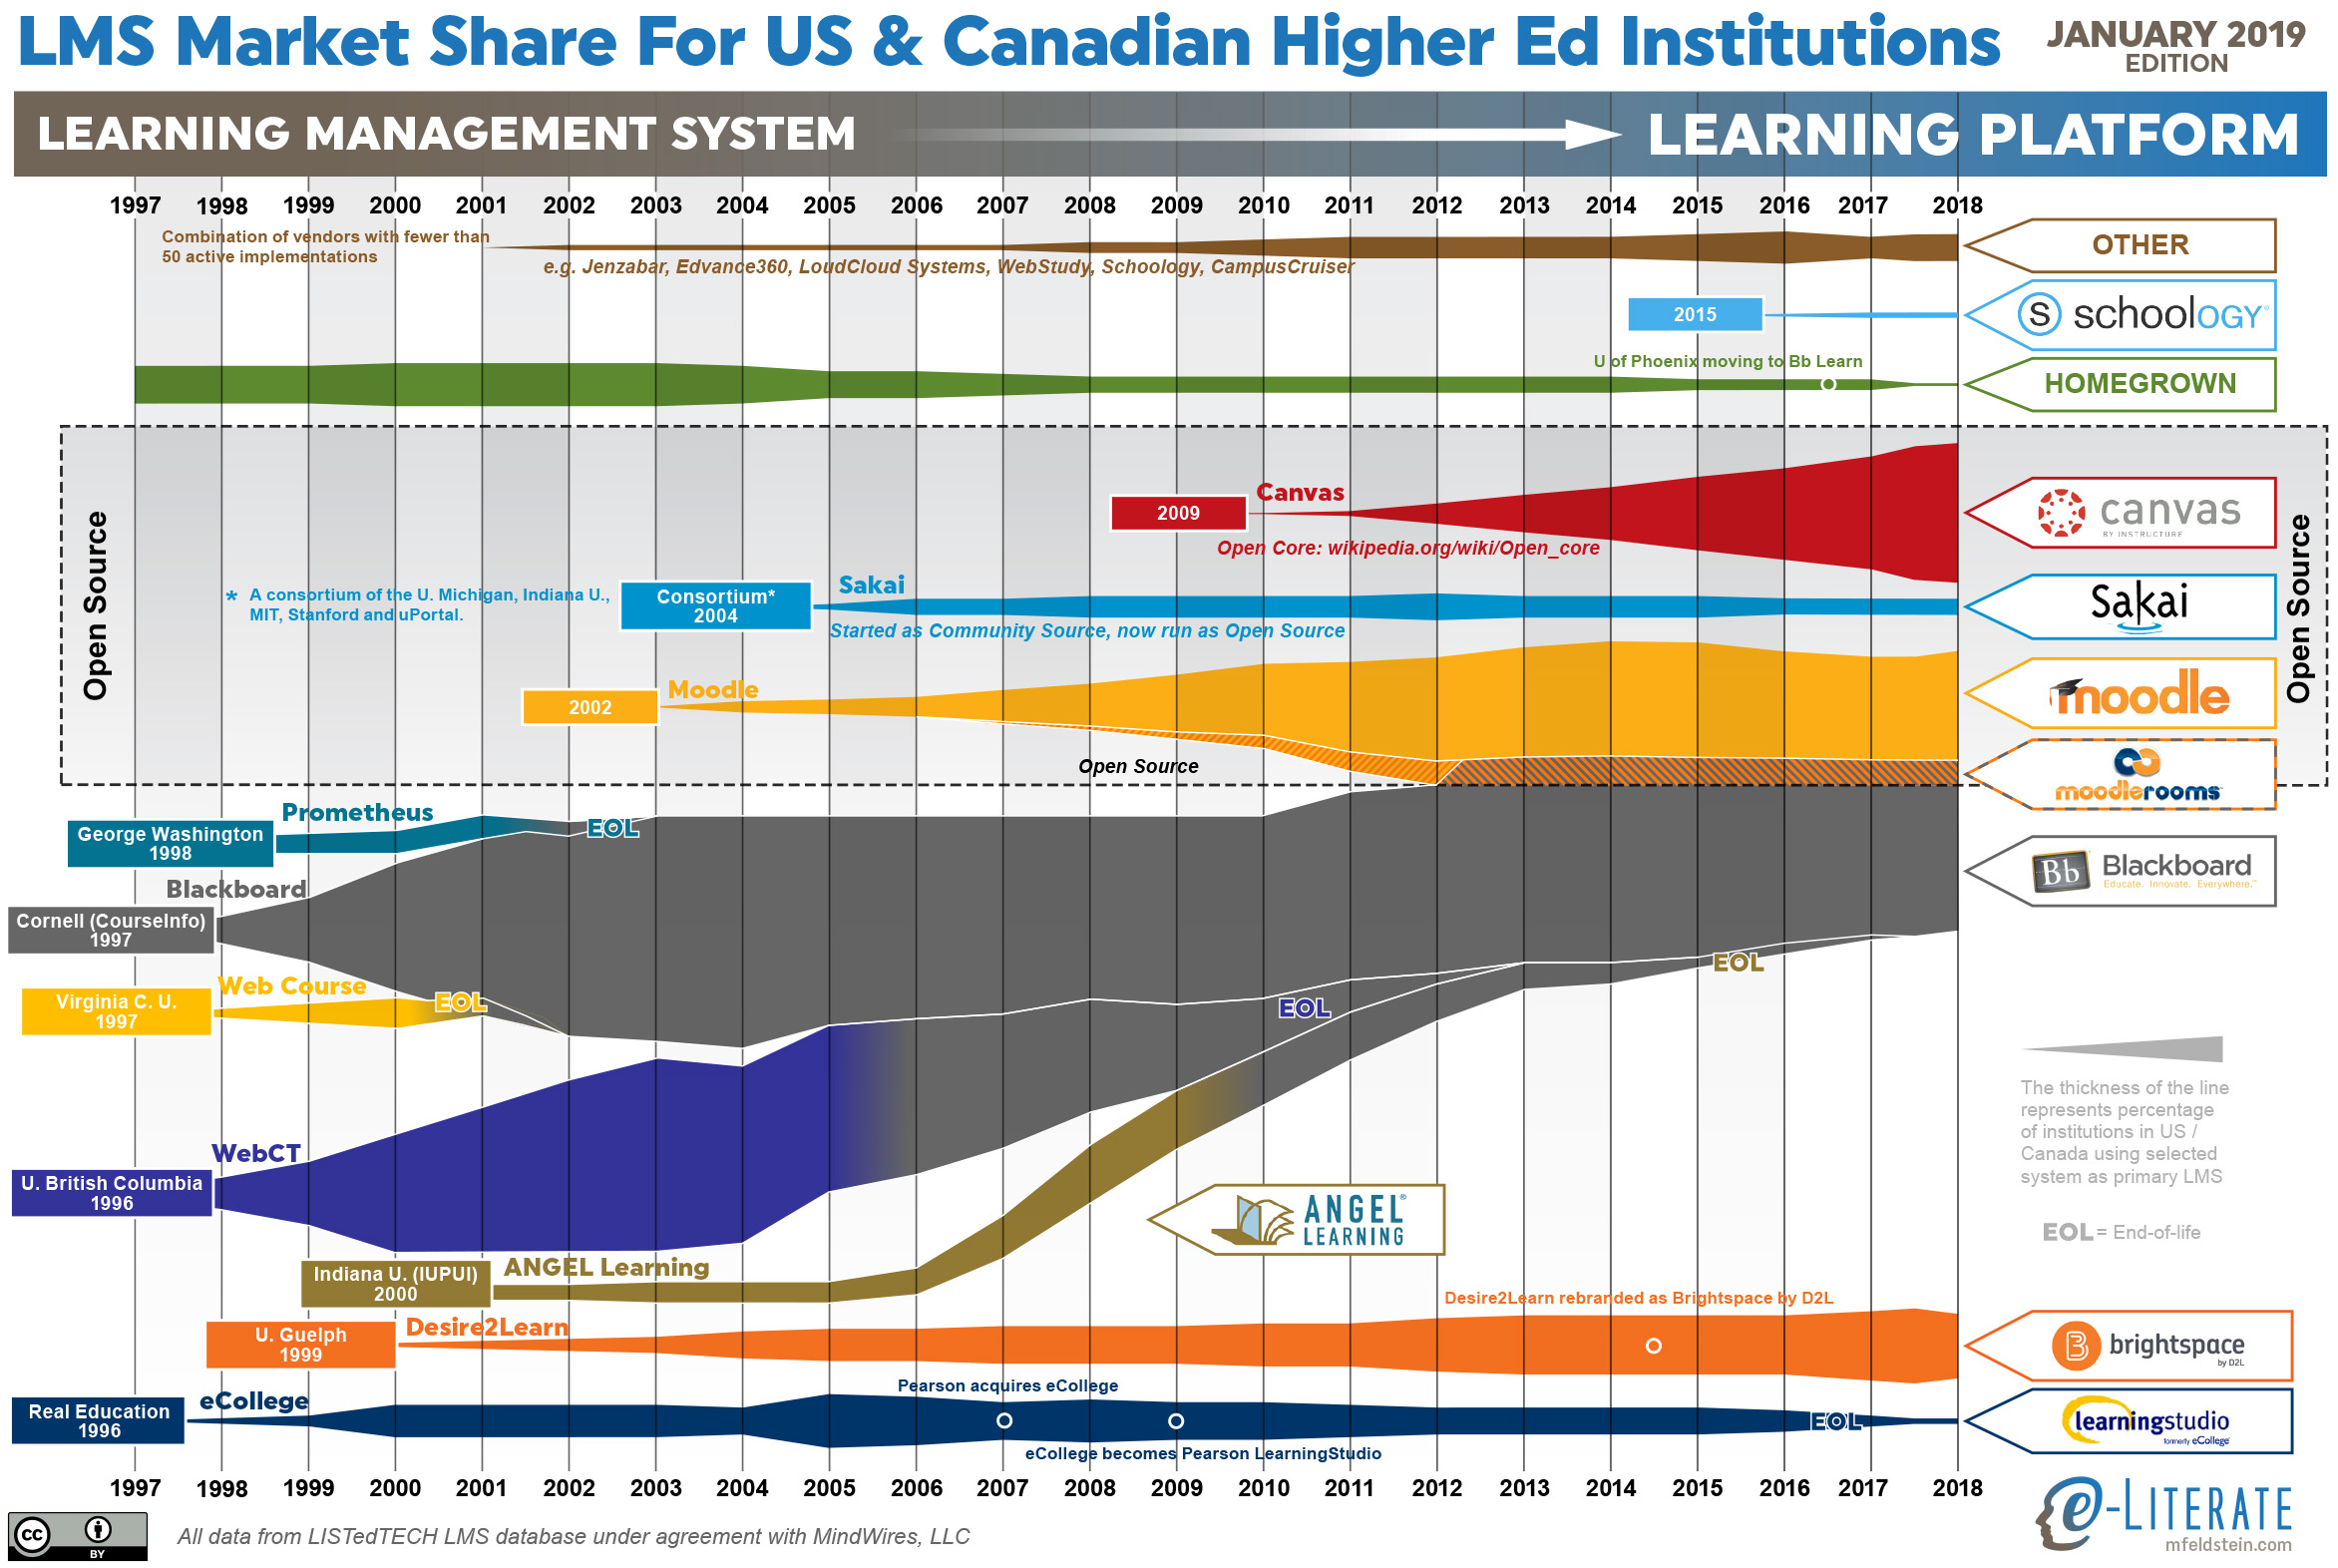
    Higher ed LMS market share for US and Canada, January 2019

    This year there are two inter-related trends that deserve a broader explanation -the LMS market slowed down with less activity overall, and Canvas and Blackboard continue to be neck-and-neck in the top spot of this market.

    We recently described the overall market activity slowdown in that there are fewer LMS formal evaluations taking place since mid 2018, with initial data pointing to a 20 – 25% drop from a year earlier. This slowdown seems to be a type of plateau rather than a continuing trend, and we are watching to see if it is temporary or not.

    Last summer we shared the symbolic passing of the torch where Canvas surpassed Blackboard in US market share, which was the first time Blackboard was not the top system since the market emerged two decades ago. What is interesting is that half a year later, the two systems are still neck-and-neck. In the US Canvas is still slightly ahead, and in North America (adding in Canada), Blackboard remains in the top spot by 0.4% (26.8% to 26.4%). Why is Canvas not continuing to extend its lead? Looking at the underlying data, there seems to be three reasons to consider:

    • The overall market slowdown means that there are fewer deals for Canvas to win lately.
    • Blackboard continues its University of Phoenix implementation, which still includes dozens of campuses despite its enrollment drop.
    • The shutdown in December of the for-profit Education Corporation of America (Virginia College and Brightwood College systems) meant that Canvas lost several dozen campuses.

    The latter two points should fully play out in the next three months, possibly making this a one-time change in trends, but it is important to call this situation out.

    Some other notes:

    • The market continues to consolidate around the Big Four – Blackboard, Canvas, D2L Brightspace, and Moodle.
    • The Homegrown option for LMS usage is going away, at least in a statistical sense. Only a handful of schools even consider this option.
    • D2L shares the challenge of having picked up several large for-profit systems that are closing campuses and therefore hurting market share. In D2L’s case, the biggest one is the former EDMC schools – the Art Institutes, Argosy University, and South University – that were sold out of bankruptcy to a non-profit entity and have closed dozens of campuses over the past year. These losses offset many of D2L’s wins in 2018.
    • Moodle had a few new wins in North America.

    Sticking with North America, we can also show LMS market share scaled by the enrollment of each institution, giving a different measure worth considering.
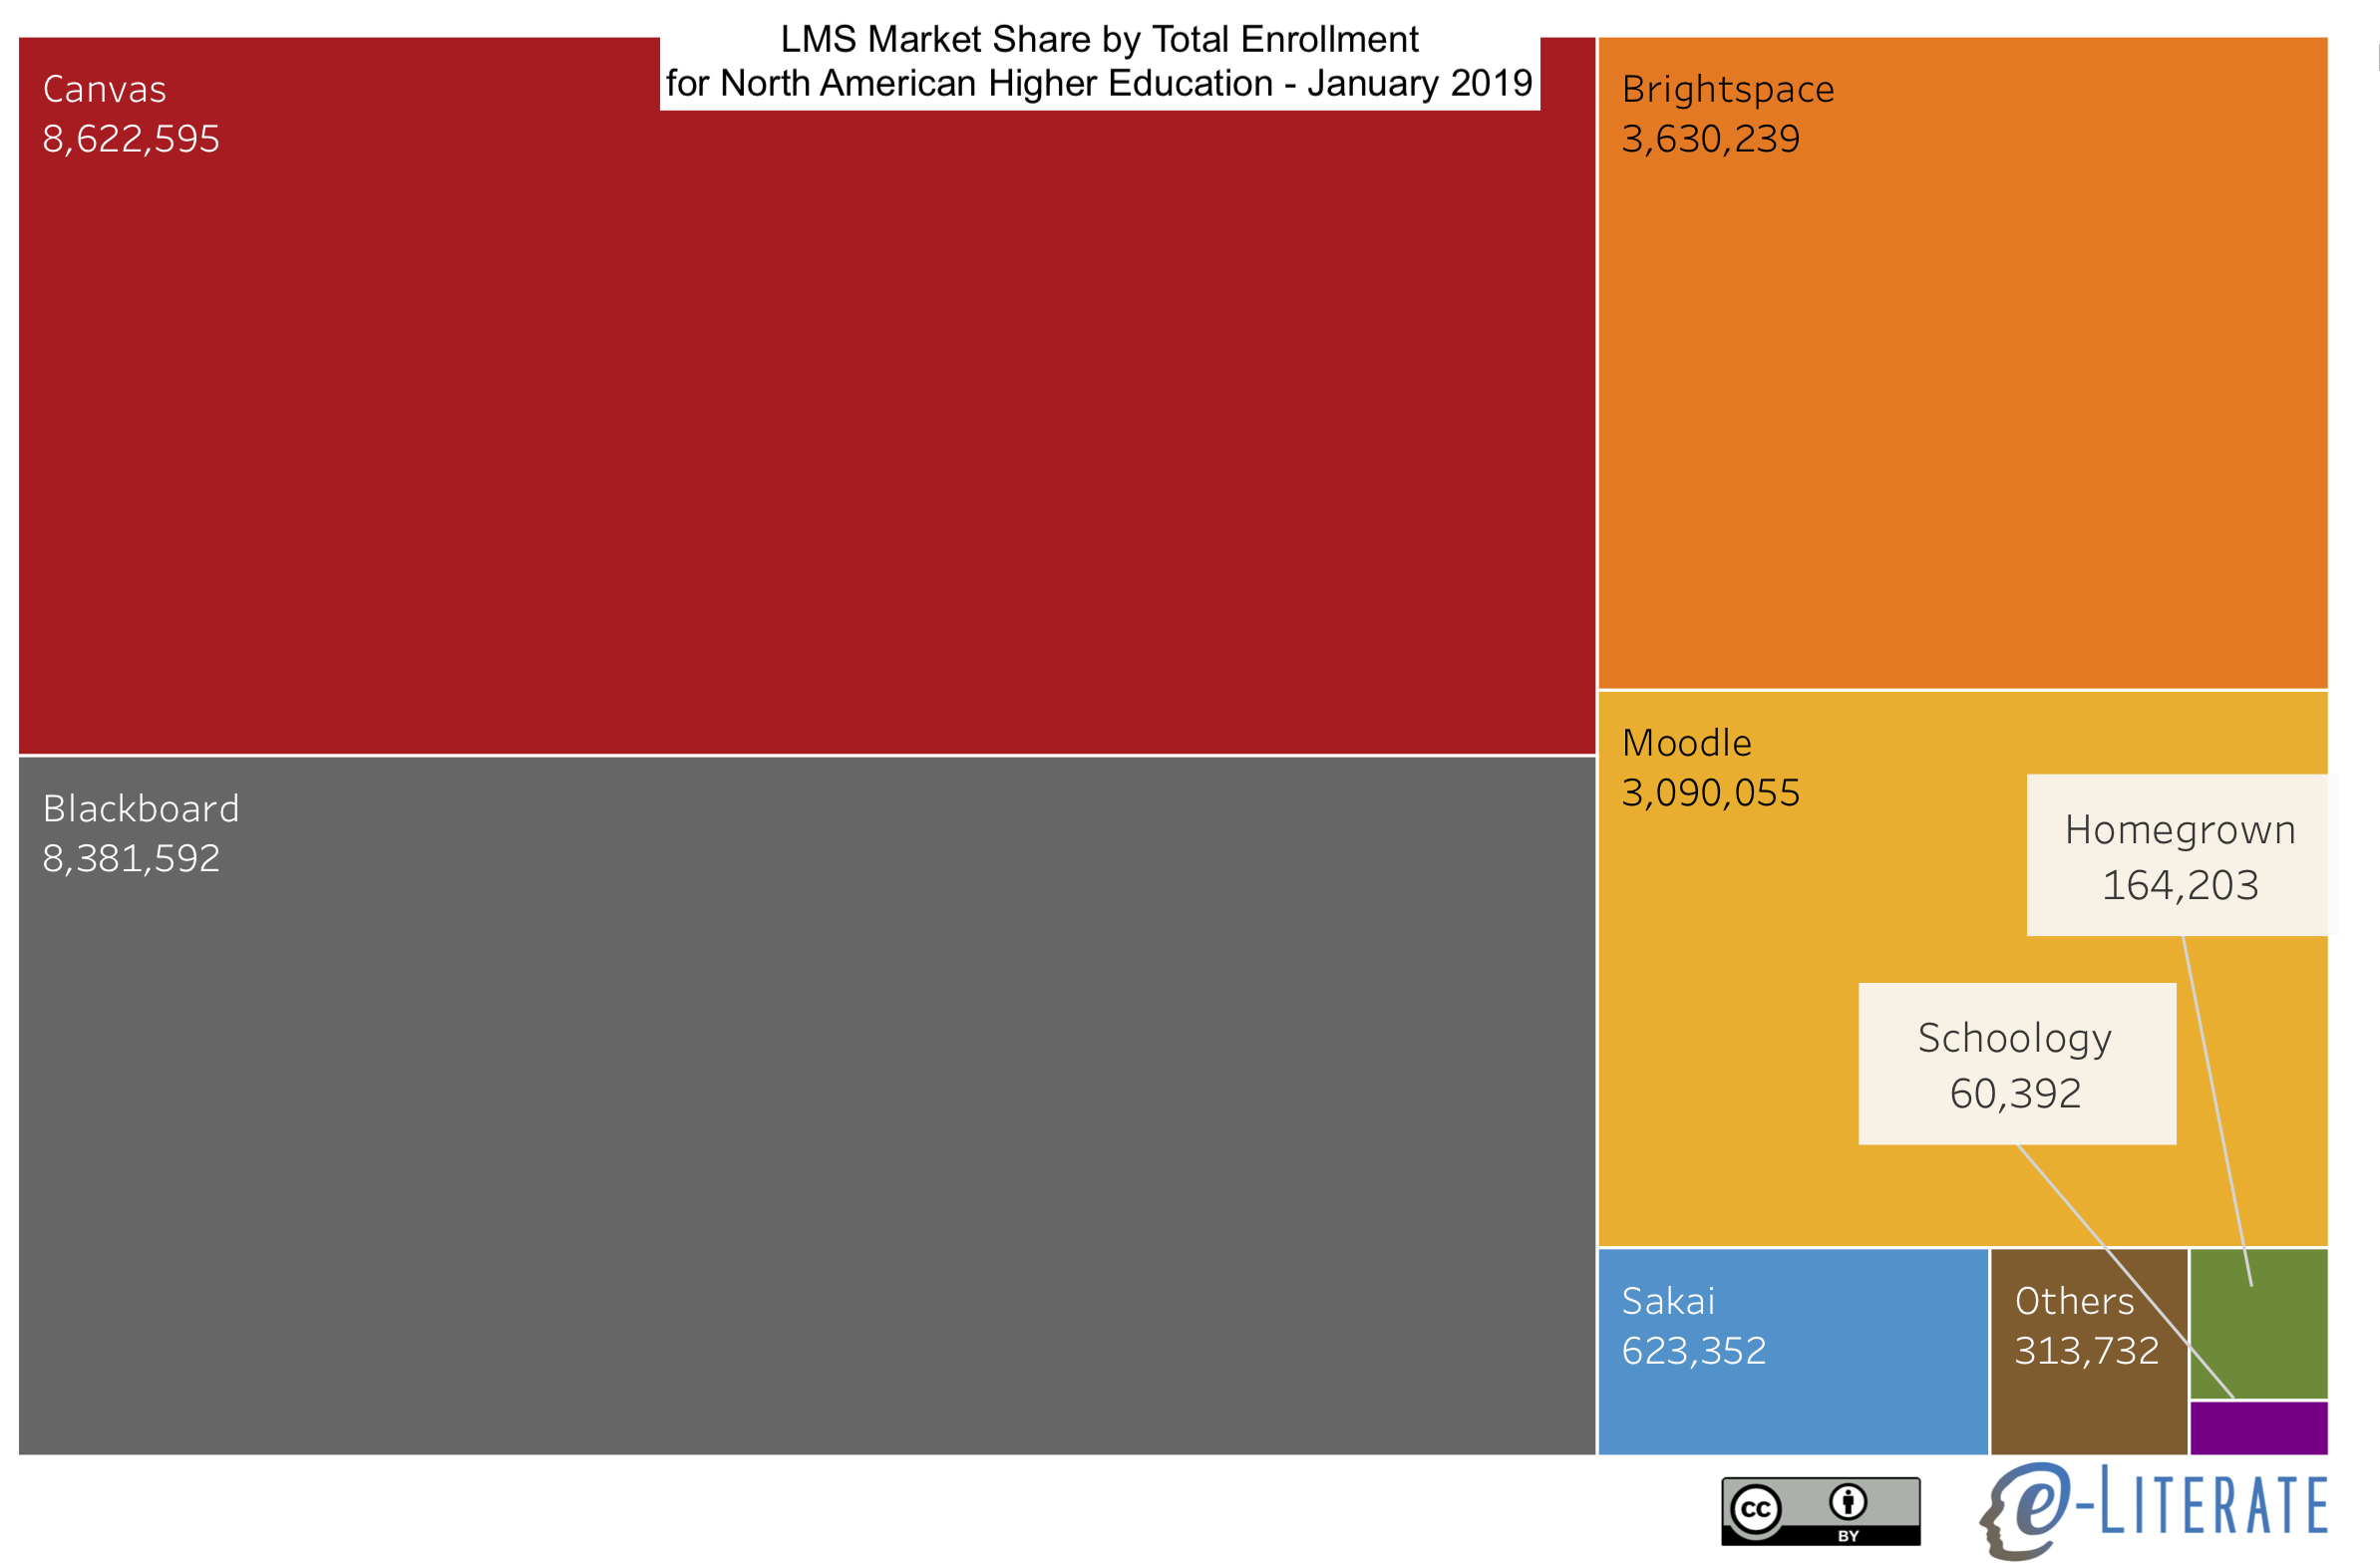
    NA LMS Market Share by Enrollment

    We’ll share more information on other global regions in the coming months.
  • North American Higher Ed LMS Market Share by Enrollments: A consolidating market

    North American Higher Ed LMS Market Share by Enrollments: A consolidating market

    We have published market share data measured by total institutional enrollment instead of institutional count in several posts at e-Literate over the years, within the twice-annual reports of our LMS Market Analysis service, and for several of our premium subscribers of the same service. In July of this year we reported that Canvas had overtaken Blackboard as the market leader in US higher education in terms of institutional adoptions as well as scaled by enrollment. These last two posts got a fair amount of media and vendor attention.

    What we have realized, however, is that we have not made this information on market share by enrollment easy to access in one place. LMS company revenue tends to be based on the total enrollment of adopting institutions, thus this enrollment-based measure provides a more direct connection to company finances. Given the increased importance of LMS provider business models and revenue to the future trends of the market, we are sharing the information more broadly.

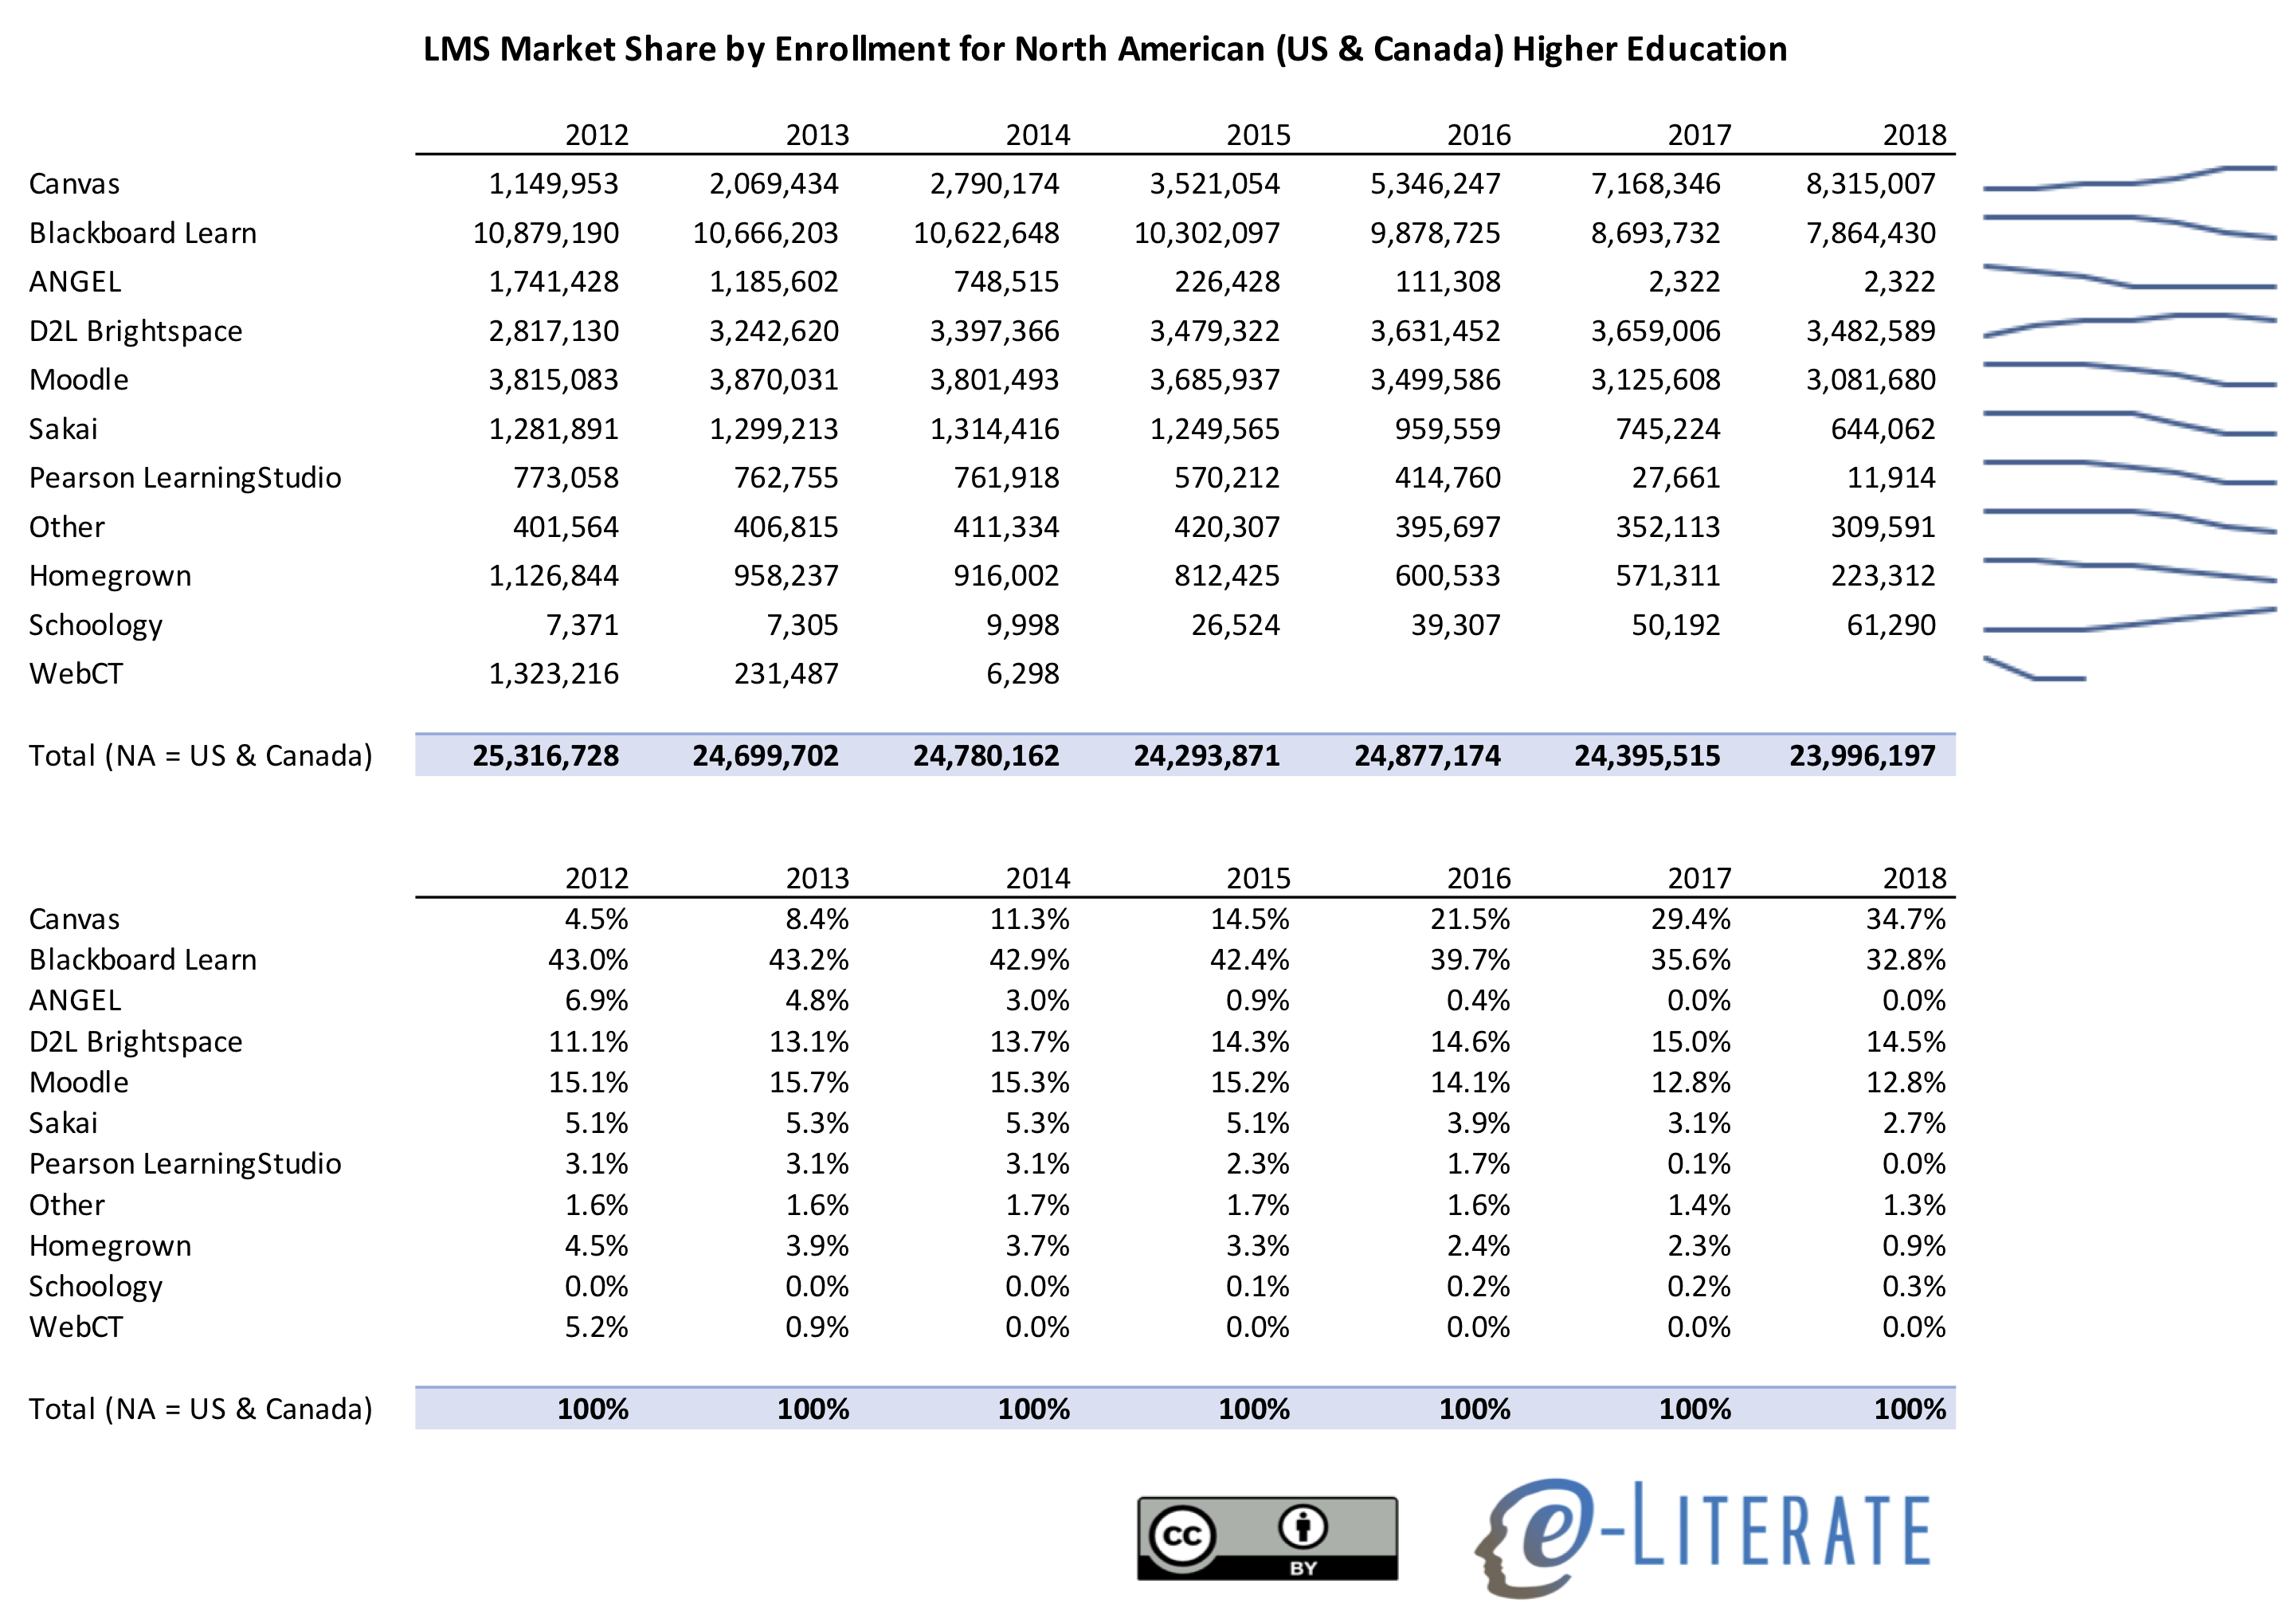
    In this view below we share North American (US and Canada combined) total enrollment for LMSs that are primary – that is, available for the entire institution. Total enrollment in this case means the institutional student count, but it does not imply that all students at that institution actually have courses using the LMS (see comment below from John Fritz). It is important to note that during an LMS transition there is often a period of time (6 – 18 months) where two systems overlap, with both available to the school. Therefore the total market share enrollments will be somewhat higher than actual total enrollments, as a subset of LMS-transitioning institutions will be counted twice.

    You can download a spreadsheet version here.

    LMS Market Share by Enrollment NA HE

    Some notes on the data worth considering:

    • Canvas has not just surpassed Blackboard Learn in this updated view, 35% to 33% – it has also expanded its lead as the most-adopted LMS in North American higher ed markets (while Moodle has clear lead worldwide in total installed base).
    • D2L Brightspace has been in third place for NA HE markets since 2016 when viewing by enrollments.
    • Moodle is fourth and has been dropping in recent years.
    • The top view of total enrollments adds in the effect of changing enrollments – both at a national level and an institutional level.
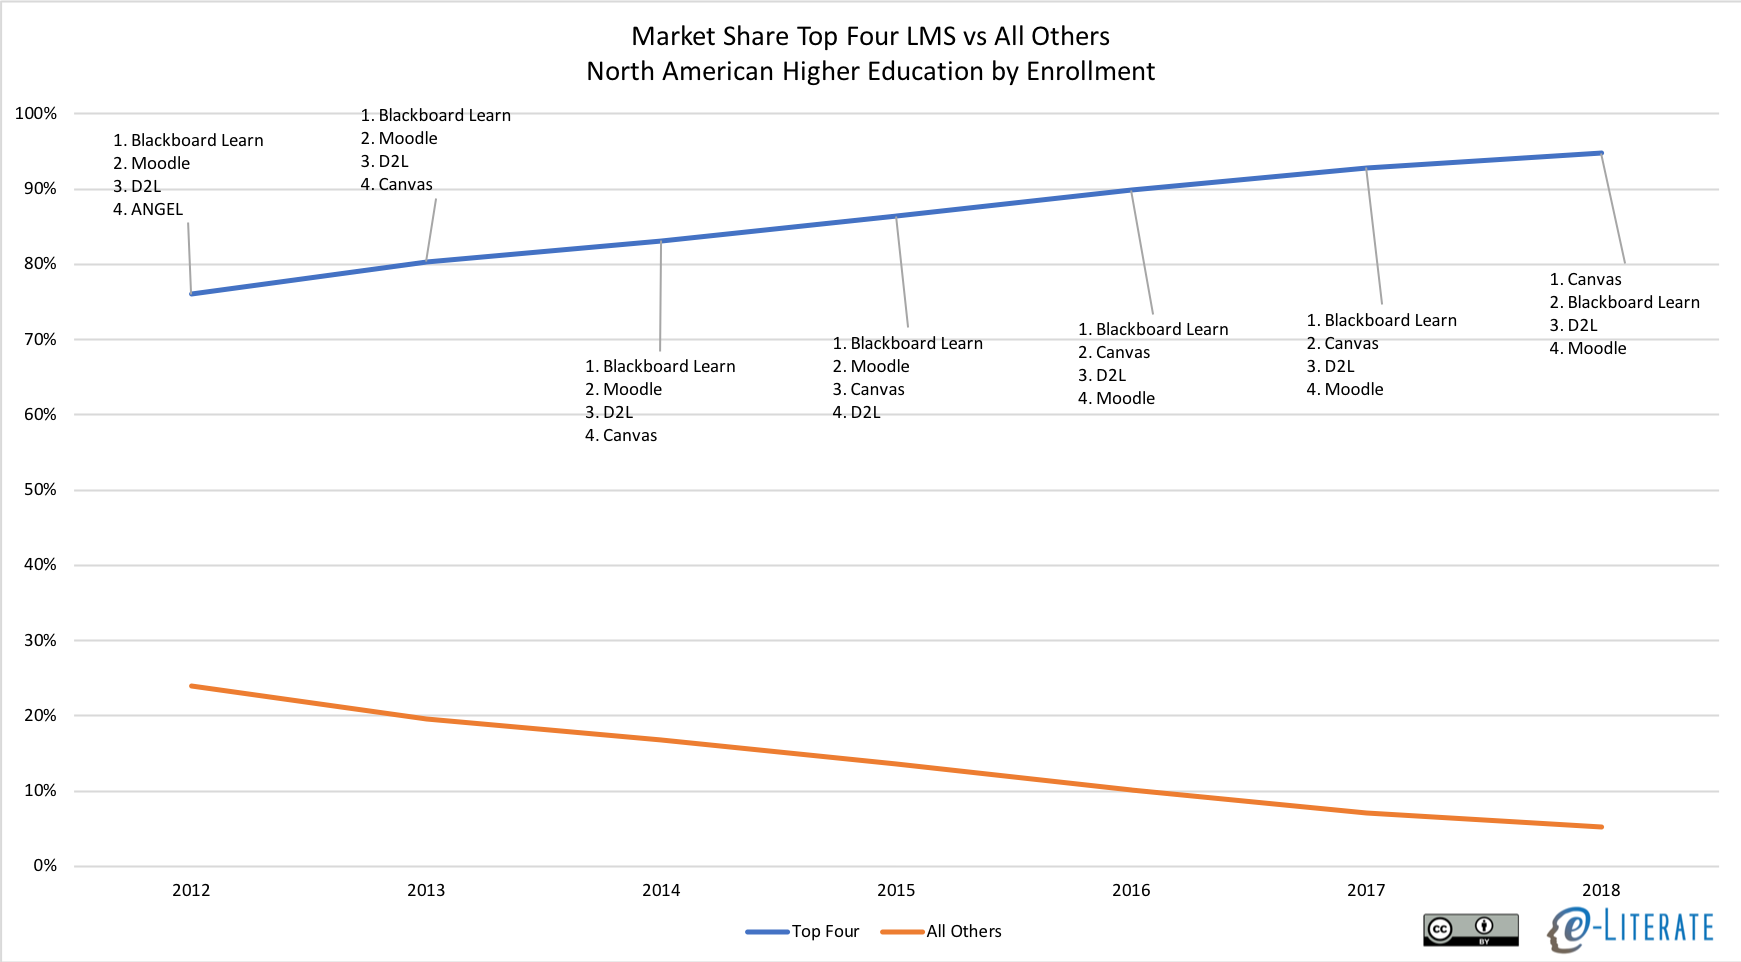
    • In the past five years, the LMS Market for North American higher ed has become increasingly dominated by “the Big Four” (Instructure Canvas, Blackboard Learn, D2L Brightspace, Moodle) for institution-wide adoptions; the aggregate market share of year’s top four systems moving from 80% to 95% in past five years.

    This last point deserves more analysis. There are other systems gaining new institutional clients (think Schoology here, or think CBE-specific platforms like Motivis), but they are mostly picking up either small schools or being adopted for specific programs and not for the entire institution.

    Consolidation of NA HE LMS Market

    Expect more coverage as we enter ed tech fall conference season.

    Update 8/3: Added sentence in third paragraph to clarify usage of total enrollment terminology.

  • Schoology, NEO, Claroline, Chamilo: The beginning of the LMS long tail

    With reporting contributions from Jeanette Wiseman and O’Neal Spicer

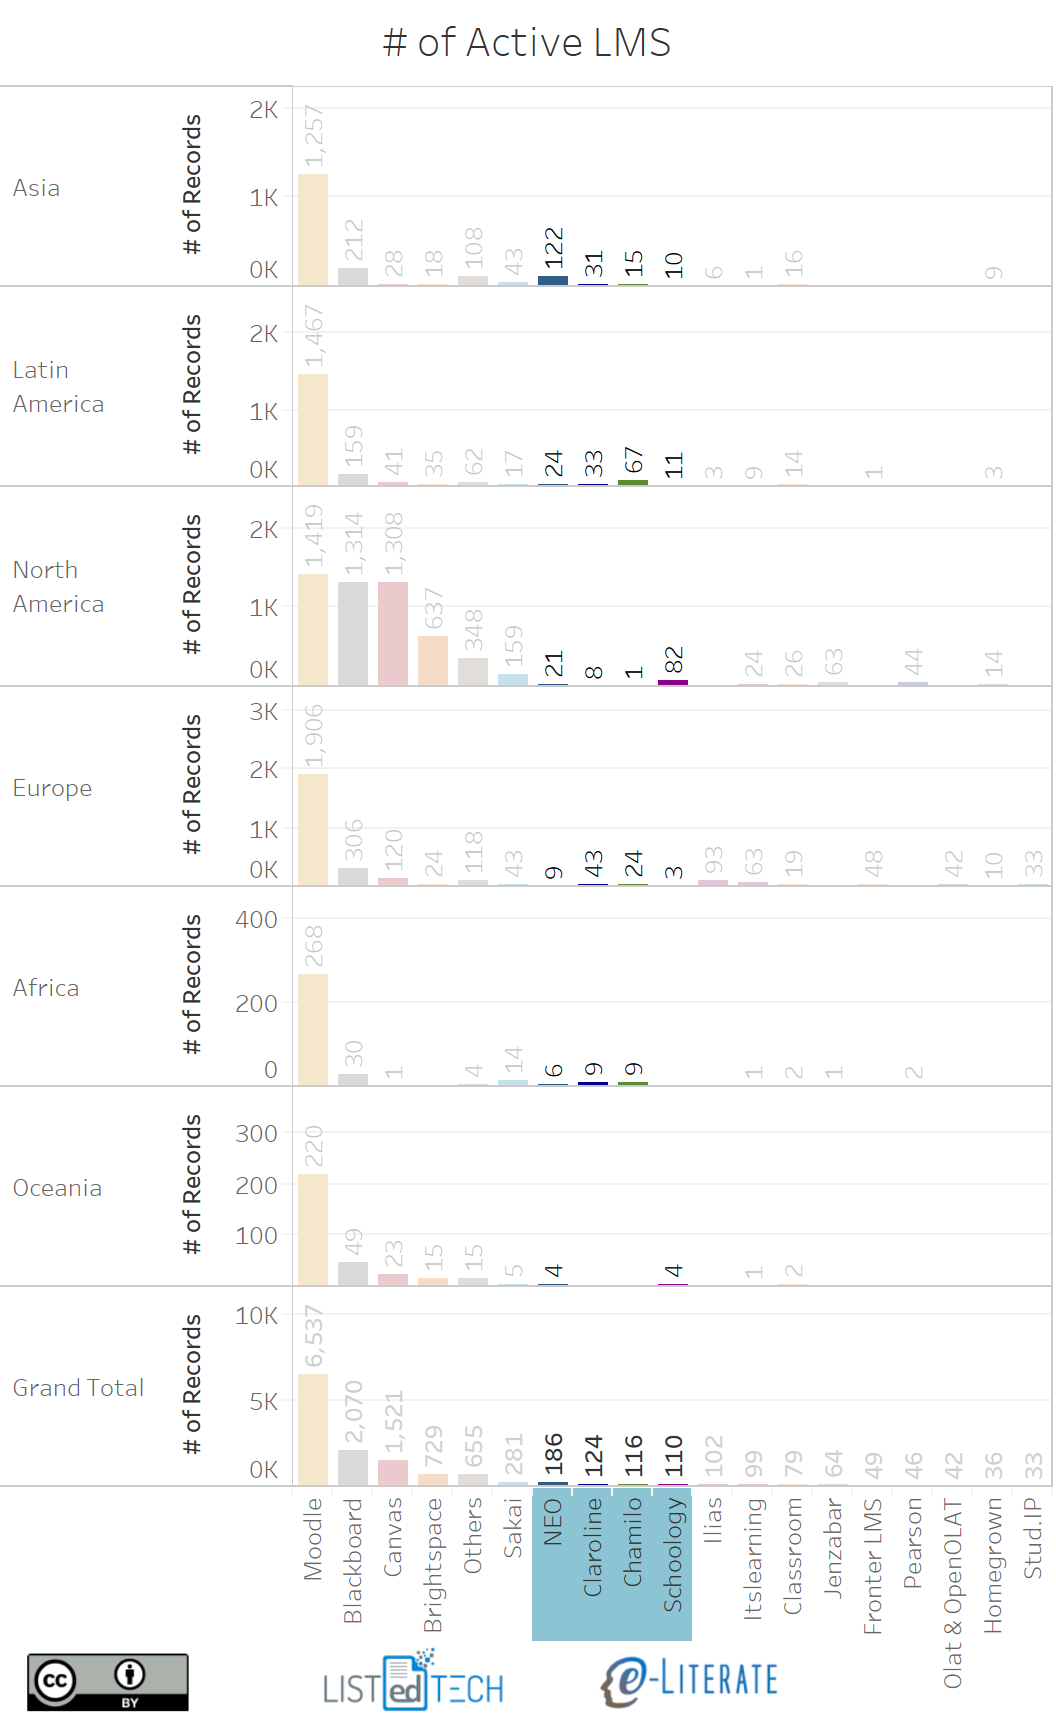
    We have described how the global LMS market is converging in the sense that the Big Four – Moodle, Blackboard, Instructure, and D2L – end up being the primary competitors in more and more global regions, often with similar dynamics. We have also described Sakai and its decline in some detail. But what about the next level down? Let’s consider four LMS solutions that are still quite active but with fewer institutional users than Sakai – Schoology (whom we have described before), NEO, Claroline, and Chamilo. ((Disclosure: Blackboard, Instructure, D2L, and Schoology are subscribers to our LMS Market Analysis service. Blackboard, Instructure, D2L, and Pearson are sponsoring participants in our Empirical Educator Project.)) The following graphic shows both primary and secondary system usage in higher education in six different global regions, and all four systems have more than 100 active implementations.

    LMS higher ed counts by global region


    Schoology NEXT

    • The Schoology NEXT conference occurred at the same time as BbWorld this year. This is a mostly K-12 conference – as that is the primary market for Schoology – with a different attendance demographic than most LMS conferences with the majority of the attendees being actual classroom teachers or instructional designers, not the typical administrators or IT staff that you see at the other user conferences. This audience is more focused on the use of technology to enhance teaching and learning in their classrooms, to assist with assessment, or to fill a requirement of use of technology for professional development. The break-out sessions reflected this academic focus.
    • The only new features or development that were discussed at any length during the keynote presentations involved the vague promise of “Personalized Learning” support. There was little information about what new features would look like, what they would encompass, or if they would entail additional charges like Schoology’s assessment platform. In an interview with CEO Jeremy Friedman and the new President Justin Serrano, they said that the vagueness is by design. The company is still working through their users’ needs and will be completing development on those features once that assessment was complete.
    • When discussing if the company saw Google Classroom’s continued growth in the K-12 market as a threat, Friedman said it is the opposite. They see that in K-12 space Google Classroom fills a need for a classroom, a school or a district that are dipping their toes in the LMS space, and once the school starts actively using the technology they quickly outgrow it. In these cases, Schoology sees Google Classroom as seeding the market for them, and they actively target those Google Classroom schools. In most cases, if responding to an RFP, it will be Canvas they will be up against. Rarely do they see Blackboard or even Moodle in these situations. They feel like, and this was reiterated by their users, that one of the most significant benefits that Schoology users see in the platform is their ease of use. The interface is reminiscent of Facebook; it is familiar to the teachers they quickly can navigate and load announcements and content to their site with very little training or IT support. It may not carry with it the bells and whistles of a Blackboard Learn or even Canvas by Instructure, but for what these K-12 teachers need, it fits the bill. For now.
    • Regarding targeting customers in higher education, the company stayed the course from January 2017 in which they will continue to support their higher education customers and will take easy sales opportunities, but are not planning to aggressively pursue that market. While this strategy only lightly targets higher education, Schoology has over 100 clients at universities and colleges worldwide – mostly small private schools, and often as secondary systems – using their platform. Customers using as a primary system include Wheaton College and Saint Vincent College in the US and the Universidad Metropolitana de Monterrey in Latin America. Schoology is also used as a secondary system at schools including UC San Diego.

    NEO, Claroline, and Chamilo

    The other three systems – NEO, Claroline, and Chamilo – are important in the global market, even if most academic buyers (in the US, at least) likely have not heard of them. All have more than 100 higher education implementations worldwide.

    • NEO is the academic LMS from Cypher Learning: Based on our conversations at the K-12 focused ISTE conference this summer, Cypher Learning has 60 employees and claims 2 million customers worldwide (combining NEO with the Indie and Matrix LMS for corporate markets). In higher ed, their largest implementation is with STI College in the Philippines with a systemwide deal that gives them 77 campus adoptions. The system has been designed native to the cloud and boasts a fairly intuitive user interface that addresses competency-based education and mastery learning.

    • Claroline Connect is an Open Source project run out of France: This system – which has the greatest adoption in Europe, Latin America, and Asia – is a second-generation open source project. In the early 2000s, the University of Lyon and the Université catholique de Louvain created two open source LMSs, and subsequently Claroline Connect combined these projects into the current system based on more modern technology. Get your French ready, or use captions.

    • Chamilo is an Open Source project run out of Spain: This system, used most often in Latin America and Europe, also has origins in the predecessors to Claroline, forking into the Dokeos project and then forking again to Chamilo in 2010. The system is supported by official supporting vendors in the following countries: Belgium, Spain, Italy and Germany. The Belgian company also has offices in Peru. Again, get your French ready.

    While we have only described this second tier of global LMS providers in broad strokes, we hope this post gives a richer view of the broader LMS market and available systems.

  • Preliminary Data on K-12 LMS Market

    Preliminary Data on K-12 LMS Market

    Over the past several months, we have worked with our partners at LISTedTECH as they ramp up their efforts to collect data on LMS usage in the K-12 market in the United States. This is a massive effort as the market includes more than 130,000 individual public and private schools, and more than 13,600 school districts, according to recent NCES documentation. We are aware of several private data sources with estimates on the K-12 LMS market, but there are no public sources.

    Part of the challenge is that the K-12 market is messier than higher education’s and its roughly 7,200 institutions. One reason is that the general IT infrastructure in K-12 is less mature than in higher ed, and for smaller schools there are a lot of ad hoc implementations running on a local server not even in a data center. Another reason is the availability of free options such as Google Classroom, or freemium options such as that offered by Schoology and Canvas for individual faculty.

    As we build up the data and improve our methods, we believe we are starting to see some interesting trends in the data worth sharing.

    Our initial sample looks at 6,875 public schools from across the country in the NCES-designated primary, middle, high and other (special ed, vocational or alternative) categories. These results were analyzed over several data collection methods along with manual evaluation of that data. That said, we expect to see movement in the numbers as we collect and verify additional data, including LMS usage at private schools.

    As in our analysis of the higher ed market, we are focusing on school-wide implementations of LMS platforms. At many K-12 schools, in the absence of a school-wide implementation, individual teachers opt to use an LMS for their particular classroom, often for free. We do not consider this case a school-wide adoption and therefore do not include those use cases in our data. This methodology does not fully analyze total usage of a platform like Schoology that has a freemium model, including a free option for individual teachers and an enterprise solution which is a school-wide adoption based on a fee per student model. A platform like Google Classroom likewise has usage by individual teachers as well as school-wide implementations.

    Before we share the preliminary data, some caveats are in order to hopefully avoid anyone misrepresenting this information:

    • This is preliminary data that will likely change as we learn more. While we believe there are some broad trends already emerging, there will be refinements as we increase our coverage over time. We expect the changes to be in small adjustments to specific numbers but not in big changes to market shape.
    • This view is based on number of schools that have implemented an LMS, which is a different metric than district-wide implementations (where many or most of the purchasing decisions occur) or implementations scaled by student enrollments. We will add these views in the future.
    • This view is based on installed base (which represents total estimated deployments), which is different than new implementations in a given time period (which would measure market momentum). Again, we will add these views over time, just as we have done for the higher ed LMS market.
    • Due in particular to the free options available in K-12, there will be schools that have more than one LMS available at the institutional level. Google Classroom in particular is often available as an option at a school even when there is another LMS.
    • As is our practice at e-Literate, we’ll describe the caveats and present the data as is. As we learn more, if the relative percentages change significantly, we will share updates.
    • For more information on our data methods, see this post.

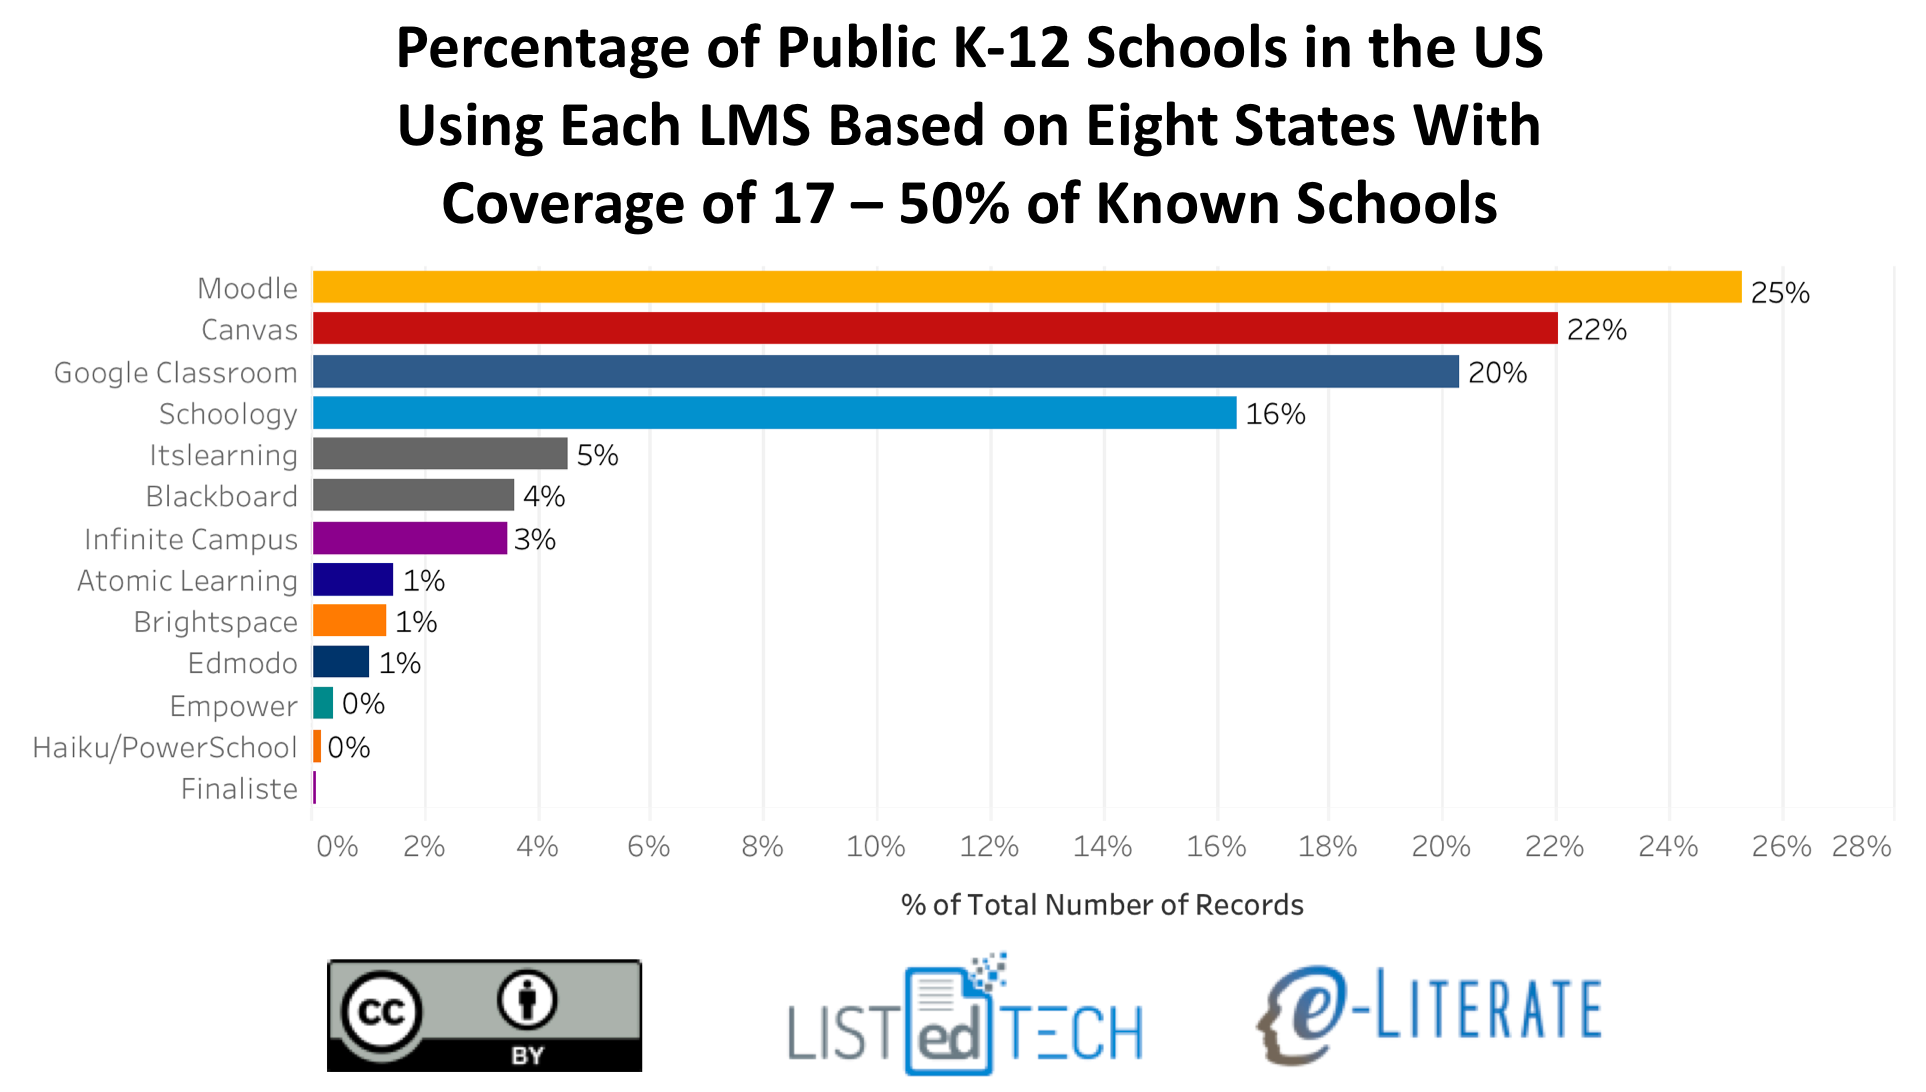
    The first graph presents a view of K-12 school-wide LMS implementations in the United States for the 8 states (and DC) where we have at least 17% coverage of known schools (Alaska, Delaware, District of Columbia, Florida, Massachusetts, Minnesota, Texas, Wisconsin).

    LMS Market Share for K-12 in US, 8 States

    To get a sense of how representative this initial market share is, we made the same calculations across all 6,875 schools from 50 states and DC that in our data thus far. The data for each LMS matched within ~2% for each LMS (e.g. Canvas went from 22% to 24%, Moodle went from 25% to 24%) between the two views.

    As in the higher education market, there appears to be four top contenders in K-12 – Moodle, Canvas, Google Classroom, and Schoology – with all others having 5% or less of market share. Moodle and Canvas are both present in the Big Four for both higher education and K-12, but in K-12 Google Classroom and Schoology are the other big players. We believe that this is the first data set showing just how widely Google Classroom has been adopted. ((Disclosure: Instructure, Schoology, Blackboard, and D2L are subscribers to our LMS Market Analysis service; Instructure and Blackboard also are sponsors for an upcoming event we are organizing.))

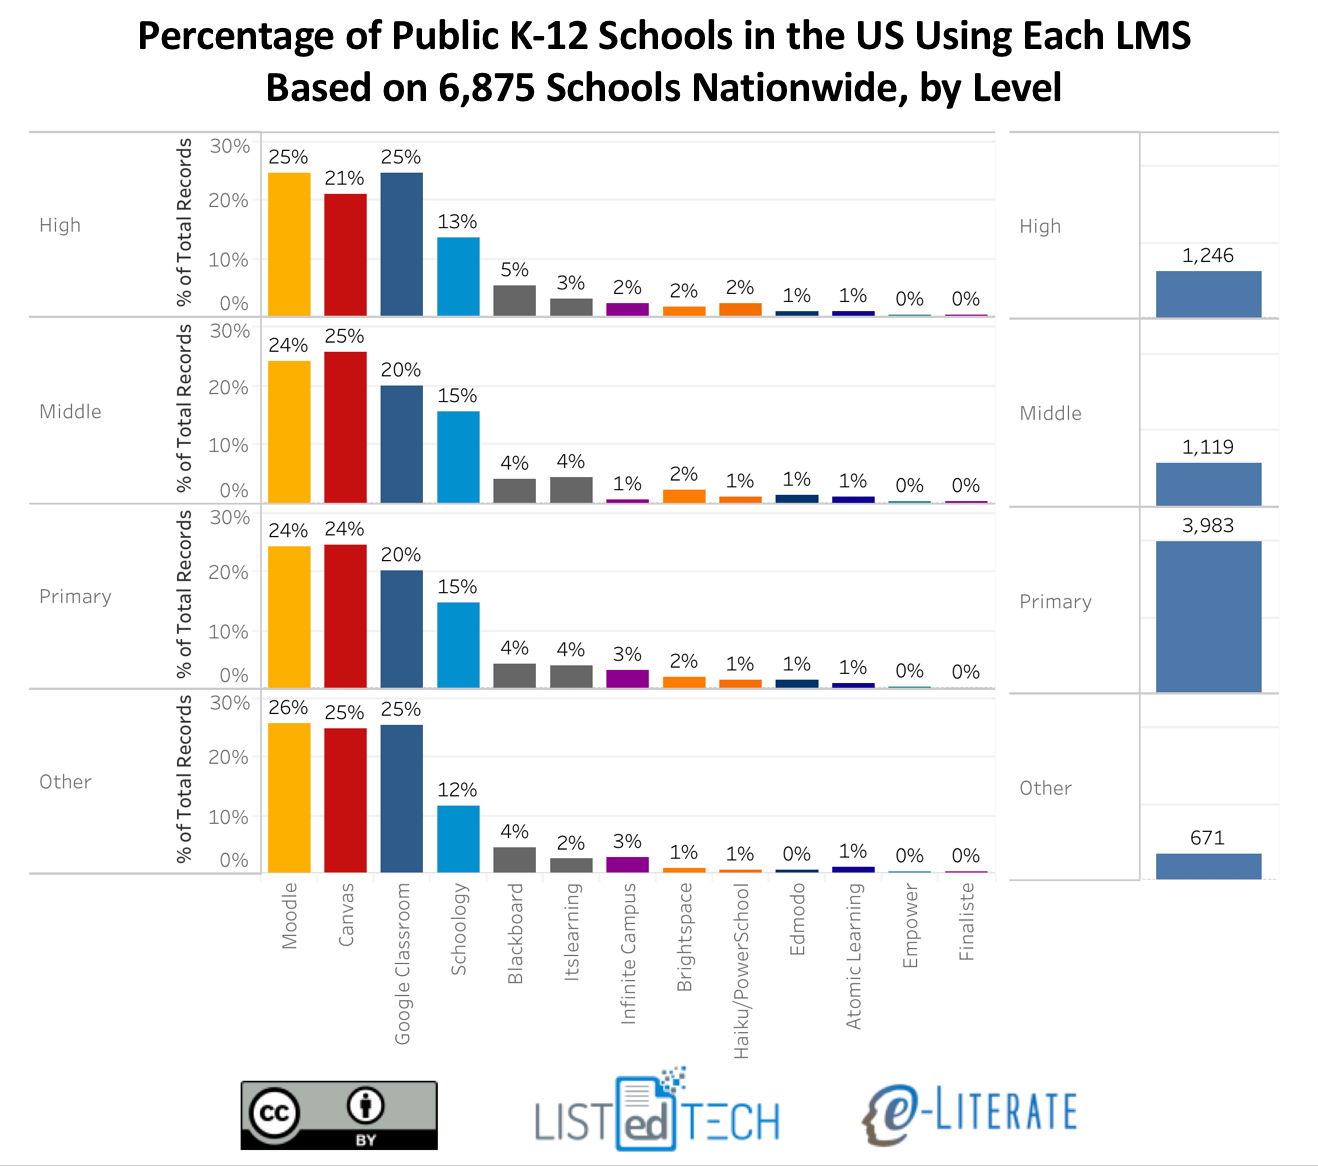
    The general distribution is somewhat consistent across school levels – primary, middle, high school, and others – with some interesting smaller variations. The following view also gives a sense of our relative data coverage by level. In this case we are using all our data across the 6,875 schools. Note that totals are higher than this number due to multiple systems being available at some schools.

    LMS Market Share for US K-12, By Level

    We hope this new data provides a broader view of the academic LMS market. We’d love to hear your feedback and questions.

  • State of Higher Ed LMS Market for US and Canada: Fall 2017 Edition

    State of Higher Ed LMS Market for US and Canada: Fall 2017 Edition

    Now that we’re past the 2017 WCET conference and headed to the EDUCAUSE conference, let’s look at updates on the institutional LMS market for North America (US and Canada). Last year we started our LMS market analysis service, where we are working with LISTedTECH to provide market data and visualizations, and our fall report for subscribers will be released in about a month. Data for 2017 presented below goes through October 1 of this year.

    We present the data “by institutions”, with market share as a percentage of the total number of institutions using each LMS as a primary system, and “by enrollments”, where we scale the institutions by their total enrollment. The latter better captures the business of the LMS market, since most licensing deals are based the number of students. We have also included data from Fall 2016 by institutions for comparison purposes.

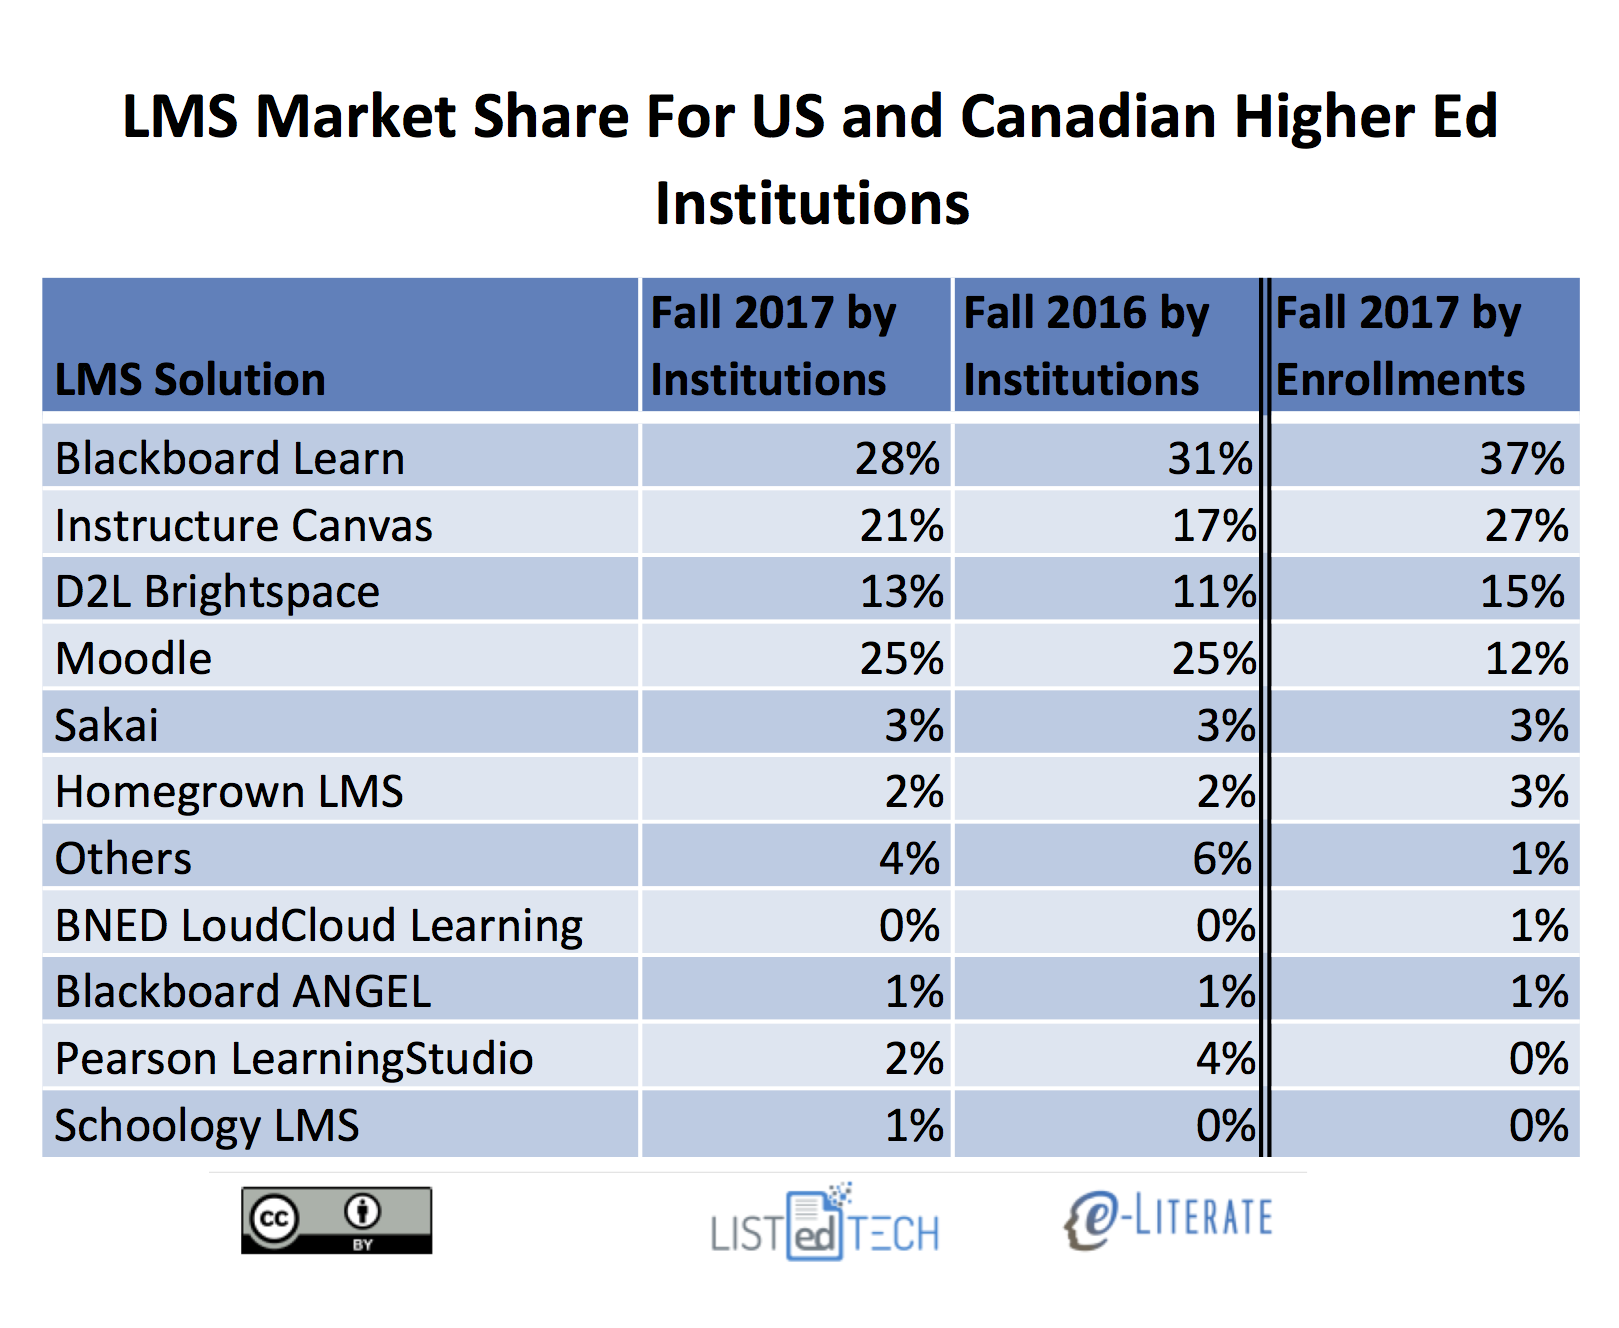
    Some notes on the market share as defined by percentage of institutions:

    • In terms of new selections the market continues to be a two-horse race recently with Canvas by Instructure and Brightspace by D2L as the only two solutions with material gains in market share. Canvas grew from 17% to 21% , and Brightspace from 11% to 13%, of the market.
    • Outside of the big four – Blackboard Learn, Canvas, D2L Brightspace, and Moodle – no other system has more than 3% of the market measured either by percentage of institutions or percentage of enrollments. Furthermore, the category of “Others”, capturing systems not listed above and having less than 1% market share, actually dropped from 4% to 2% of the market. This indicates that continued market consolidation.
    • Schoology and BNED LoudCloud grew slightly, but not nearly to the degree of the Canvas and Brightspace.
    • Blackboard Learn fell the farthest, from 31% to 28% of of the market. The second biggest drop was Pearson LearningStudio, from 4% to 2%, based on its end-of-life notice for December 2017.
    • Moodle and Sakai both lost market share of just under 1%, not enough to show up in the rounded numbers in the table but enough to show up in our underlying data.
    • The difference in Moodle’s market share by institutions at 25% and by enrollments at 12% really shows how concentrated their usage is for smaller schools.
    • When viewing market share as defined by percentage of enrollments, Blackboard and Canvas are the most-used systems, at 37% and 27% of the market, followed by D2L at 15% and Moodle at 12%.

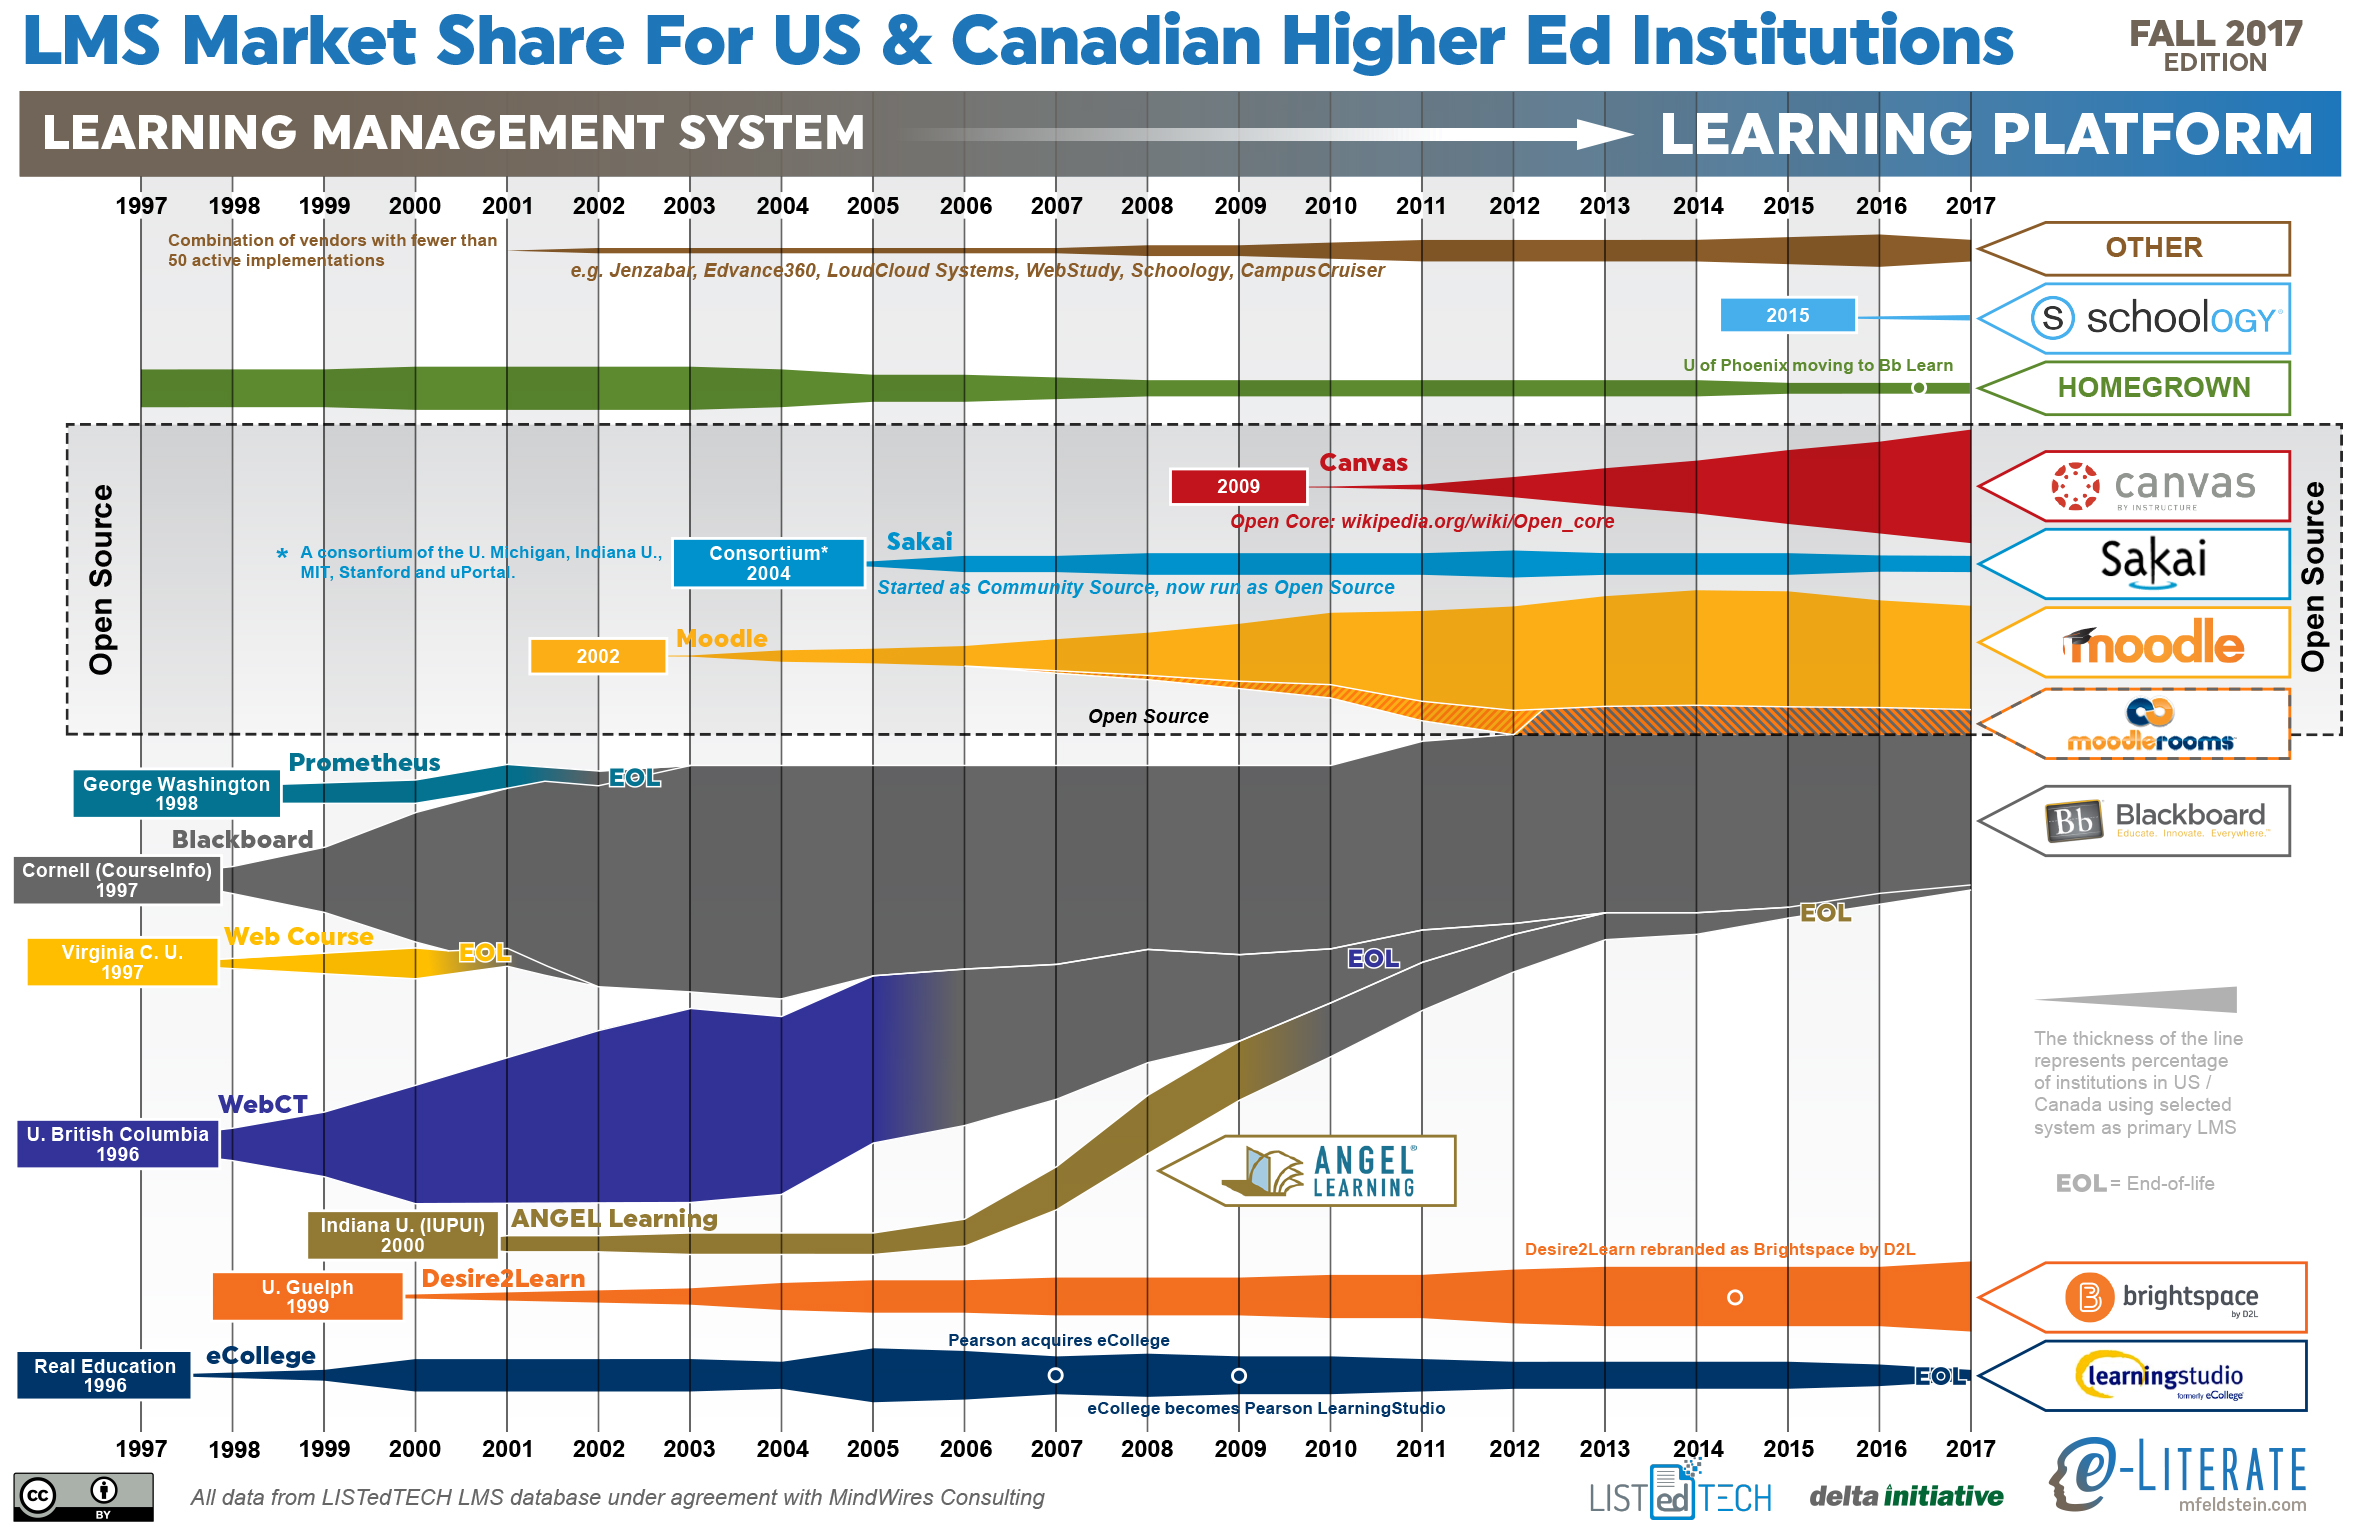
    Stepping back from the immediate data, let’s look at an updated LMS market share graphic, commonly known as the squid graphic, for US and Canadian higher education. The original idea remains – to give a picture of the LMS market in one page, highlighting the story of the market over time. The key to the graphic is that the width of each band represents the percentage of institutions using a particular LMS as its primary system.

    Some additional notes:

    • Blackboard and Moodle have been the market leaders as number one and two in share as they have been for the past decade. However, Canvas is quickly approaching Moodle’s market share.

    We’ll share any updates we discover at the conference this week.

  • Academic LMS Market Share By Enrollments, Part Deux

    Academic LMS Market Share By Enrollments, Part Deux

    Based on our recent publication of market share data and graphics, we have had multiple requests to share similar data by enrollment. In Friday’s post I shared a non-traditional view of the LMS market based on the percentage of institutions within small, medium, and large enrollment bands for North America (US and Canada) and Europe. This view gave some interesting insights, particularly with large positive correlation (Canvas) and negative correlation (Moodle)  between enrollment bands and market share in North America. Meanwhile, there were other LMS solutions (D2L and Sakai in particular) that have fairly consistent distribution in market share.

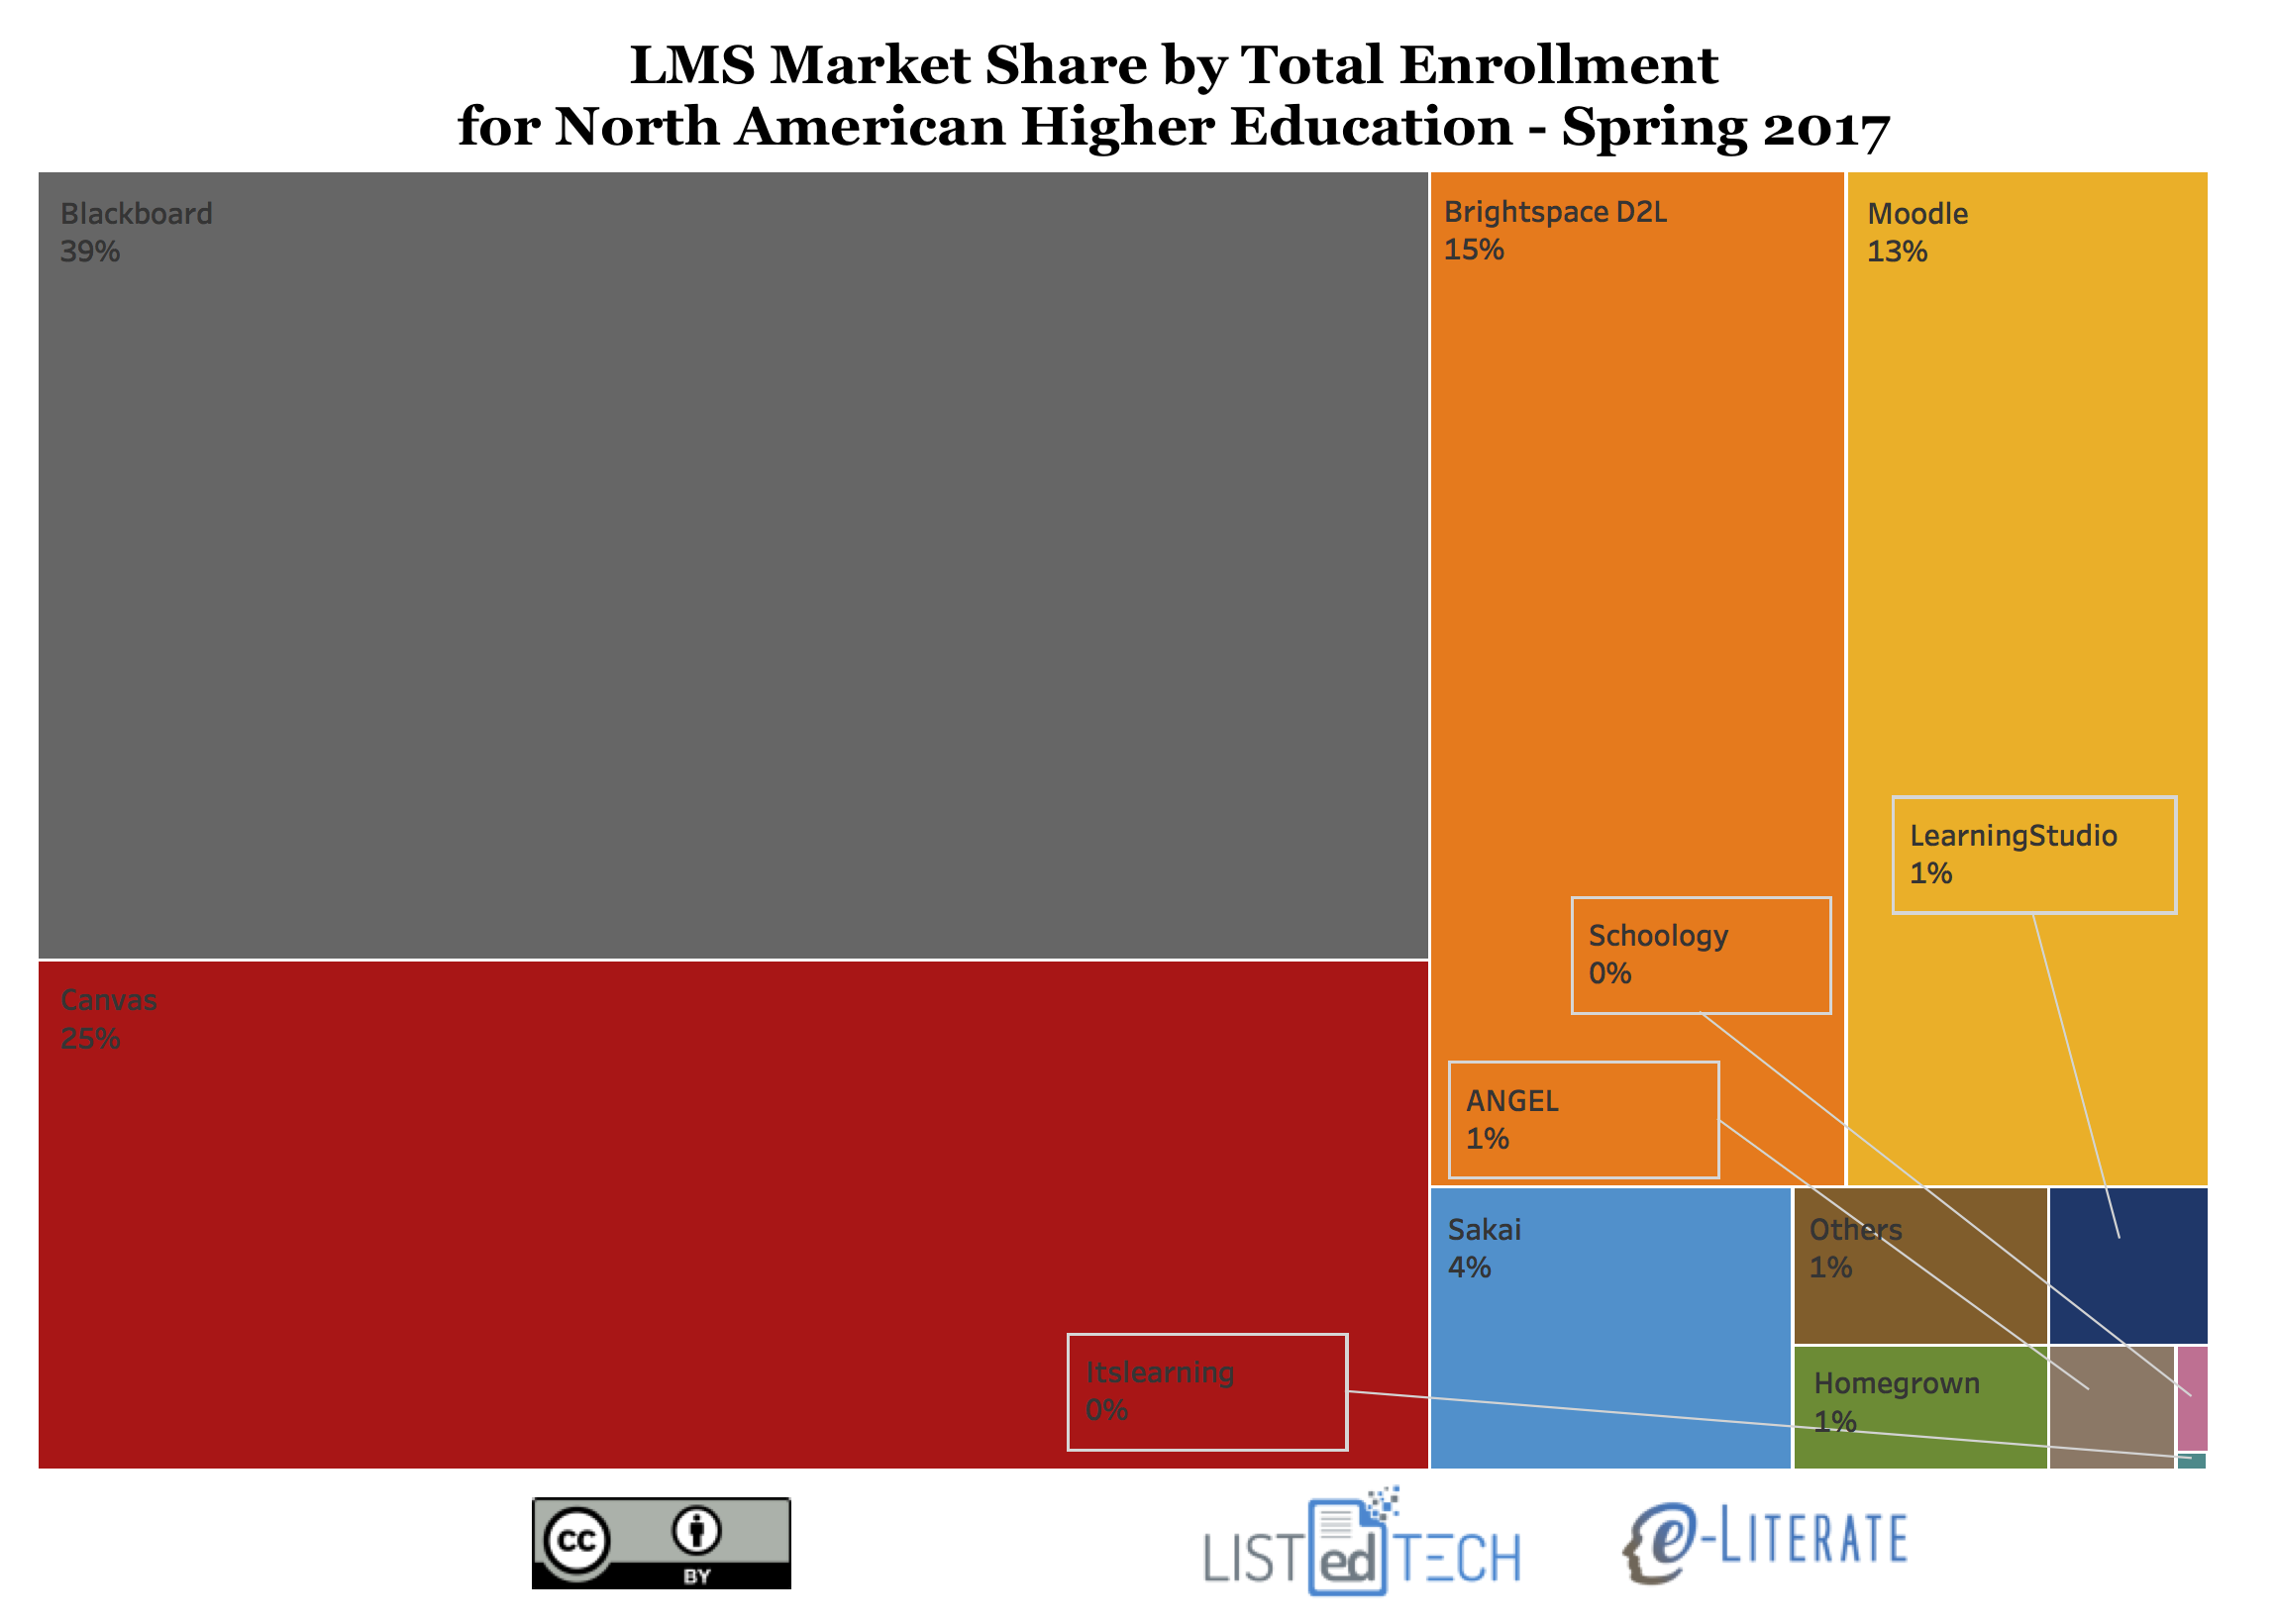
    For this second view, instead of showing percentage of institutions within each enrollment band, the data is aggregated for all North American institutions and scaled by each institution’s official enrollment data (e.g. the US data is from IPEDS). The net result shows the percentage of enrollments across the region that have different LMS solutions as their primary system at their school. As always, the underlying data for these market share studies is provided by our partner LISTedTECH.

    Some Notes:

    • For North American Higher Education, Blackboard Learn at 39% is still in first place, Canvas is second at 25%, D2L Brightspace is third at 15%, Moodle is fourth at 13%, and Sakai is fifth at 4%.
    • It has been widely reported when just looking at percentages of institutions that Moodle has long been the second most-used system in North America, but in this view both Canvas and D2L Brightspace have a larger market share.

    It is useful to look at different views using institutional and enrollment metrics to get a deeper understanding of the academic LMS market dynamics.

  • State of Higher Ed LMS Market for US and Canada: Spring 2017 Edition

    State of Higher Ed LMS Market for US and Canada: Spring 2017 Edition

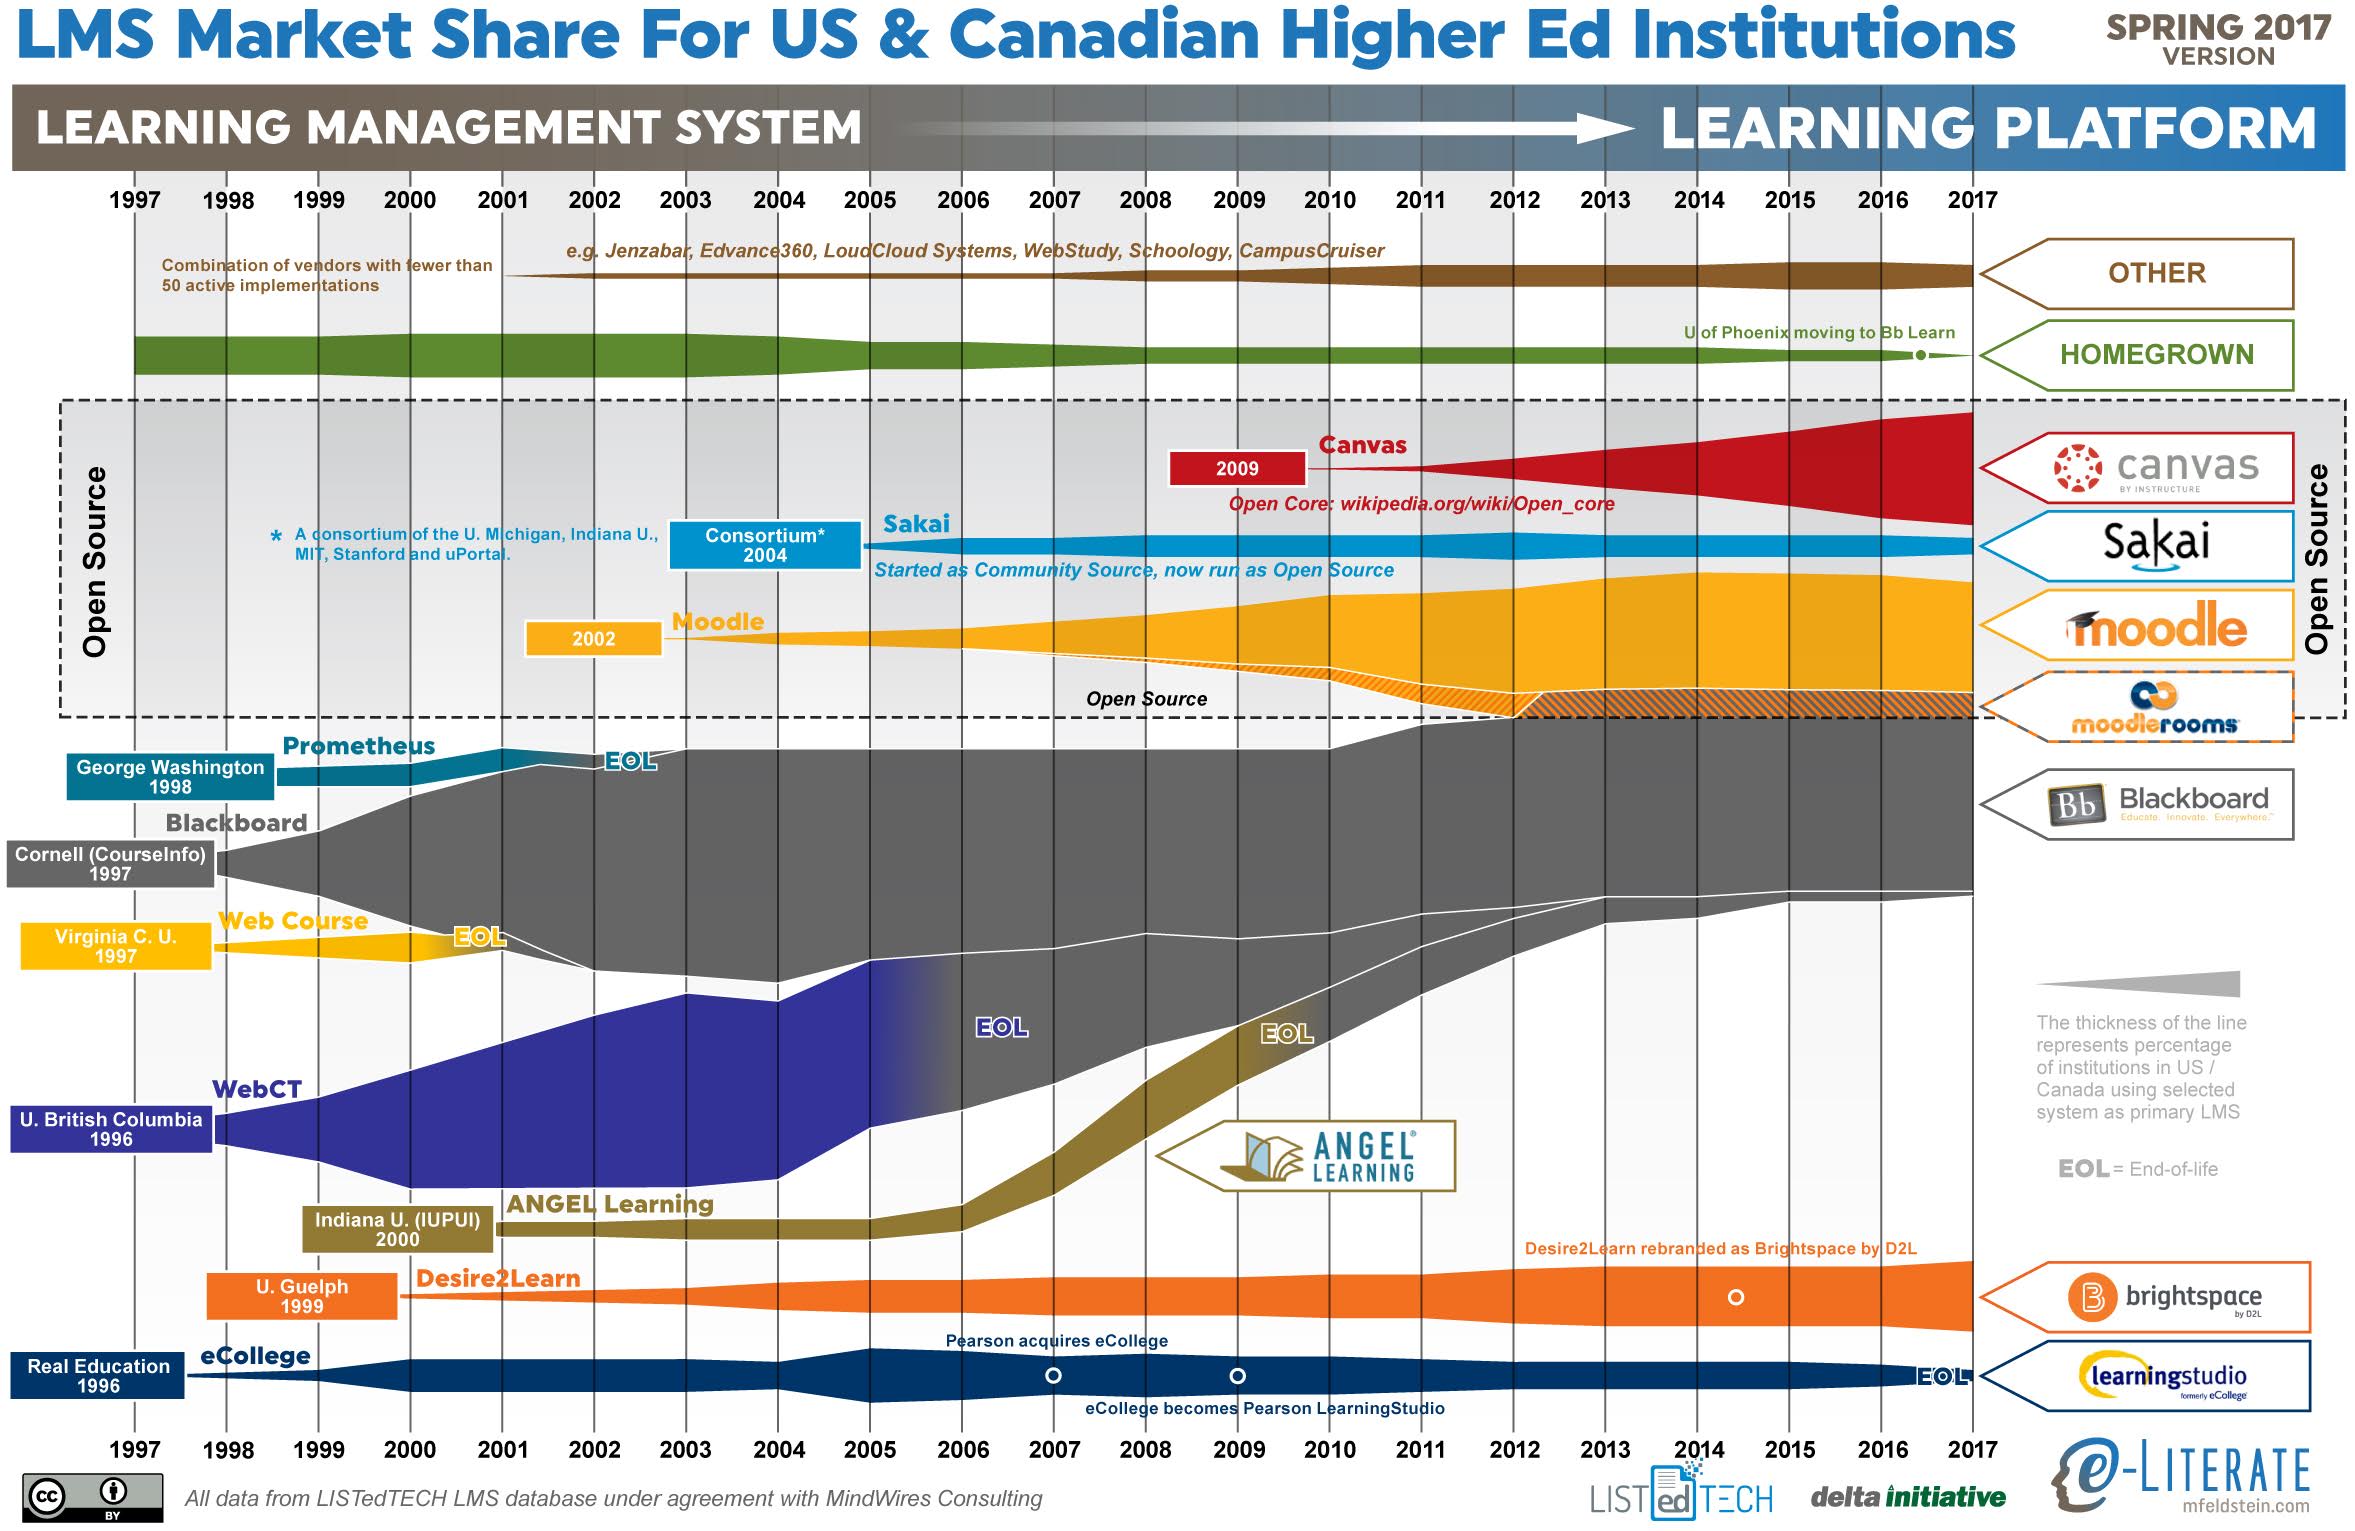
    This is the ninth year I have shared the LMS market share graphic, commonly known as the squid graphic, for US and Canadian higher education. The original idea remains – to give a picture of the LMS market in one page, highlighting the story of the market over time. The key to the graphic is that the width of each band represents the percentage of institutions using a particular LMS as its primary system.

    Last year we made a big shift based on our LMS market analysis service – we are working with LISTedTECH to provide market data and visualizations. This data source provides historical and current measures of institutional adoptions, allowing new insights into how the market has worked and current trends. Our spring report for subscribers will be released this month. Data for 2017 goes through April 1 of this year.

    (more…)