e-Literate

Present is Prologue

Category: Ed Tech

The “Ed Tech” category includes posts about educational technology products themselves, including LMSs and other learning platforms, adaptive learning and other digital curricular materials products, learning analytics, and educational apps of all types. It also includes technical aspects of ed tech products, especially interoperability.

  • Rio Salado College As Exemplar: A critical internal view

    Rio Salado College As Exemplar: A critical internal view

    10 days ago Arizona State University (ASU) and the Boston Consulting Group (BCG) released a report, supported by the Bill & Melinda Gates Foundation (BMGF) ((Disclosure: Our e-Literate TV series was funded in part by the Bill & Melinda Gates Foundation.)), titled “Making Digital Learning Work: Success Strategies From Six Leading Universities and Community Colleges”. The basic idea [emphasis added]:

    How can the use of digital technologies in postsecondary education impact students’ access to education, student outcomes, and the return on investment for students and institutions? What are the biggest challenges for an institution seeking to implement high-quality digital learning opportunities? What promising practices enable an institution to achieve impact at a larger scale? [snip]

    The answers, at least in part, lie in case studies of six colleges and universities: Arizona State University, the University of Central Florida, Georgia State University, Houston Community College, Kentucky Community and Technical College System, and Rio Salado Community College. The first three institutions in this list are public research universities, representing different geographic populations and access missions. The other three institutions include two community colleges and a state-wide community college system.

    These six institutions have a strong track record of using digital learning to serve large, socioeconomically diverse student populations, and each has been a pioneer in innovating to expand access to postsecondary education, improve student outcomes, and provide higher education at an affordable cost.

    The methodology is a case study of each school, and the report then takes a stance on what other institutions should do.

    Now is the time for leaders to champion the potential of digital learning to open the doors of higher education wider and to improve student outcomes, while operating more efficiently and at lower cost. The journey of each college or university will be unique, but the set of promising practices described in this report may serve as a useful guide for all institutions.

    There are multiple methods to evaluating a school; it turns out that some are more meaningful than others, and it is always helpful to start with what students experience in actual courses. The ASU / BCG report provides useful context on course design.

    At Rio Salado, 22 full-time faculty chairs develop courses with the support of a central team that includes subject-matter experts, instructional designers, media support staff, and production staff. About 1,500 adjunct faculty members teach the courses, which they can personalize by adding an introductory message or video for each module.

    It turns out that I have access to two courses – ENG102 (First Year Composition) and EED200 (Foundations of Early Childhood Education) – and this gives an opportunity to better understand the student experience. What these courses indicate, however, is a troubling lack of meaningful interaction between faculty and students.

    Looking at ENG102, the course materials is Rio Salado developed courseware embedded in their custom course management system, RioLearn. The materials appear to be quite extensive, and all materials are available at the start of the term in 14 lessons. To find actual due dates, students have to go to the gradebook, as no specific dates are included in the courseware.
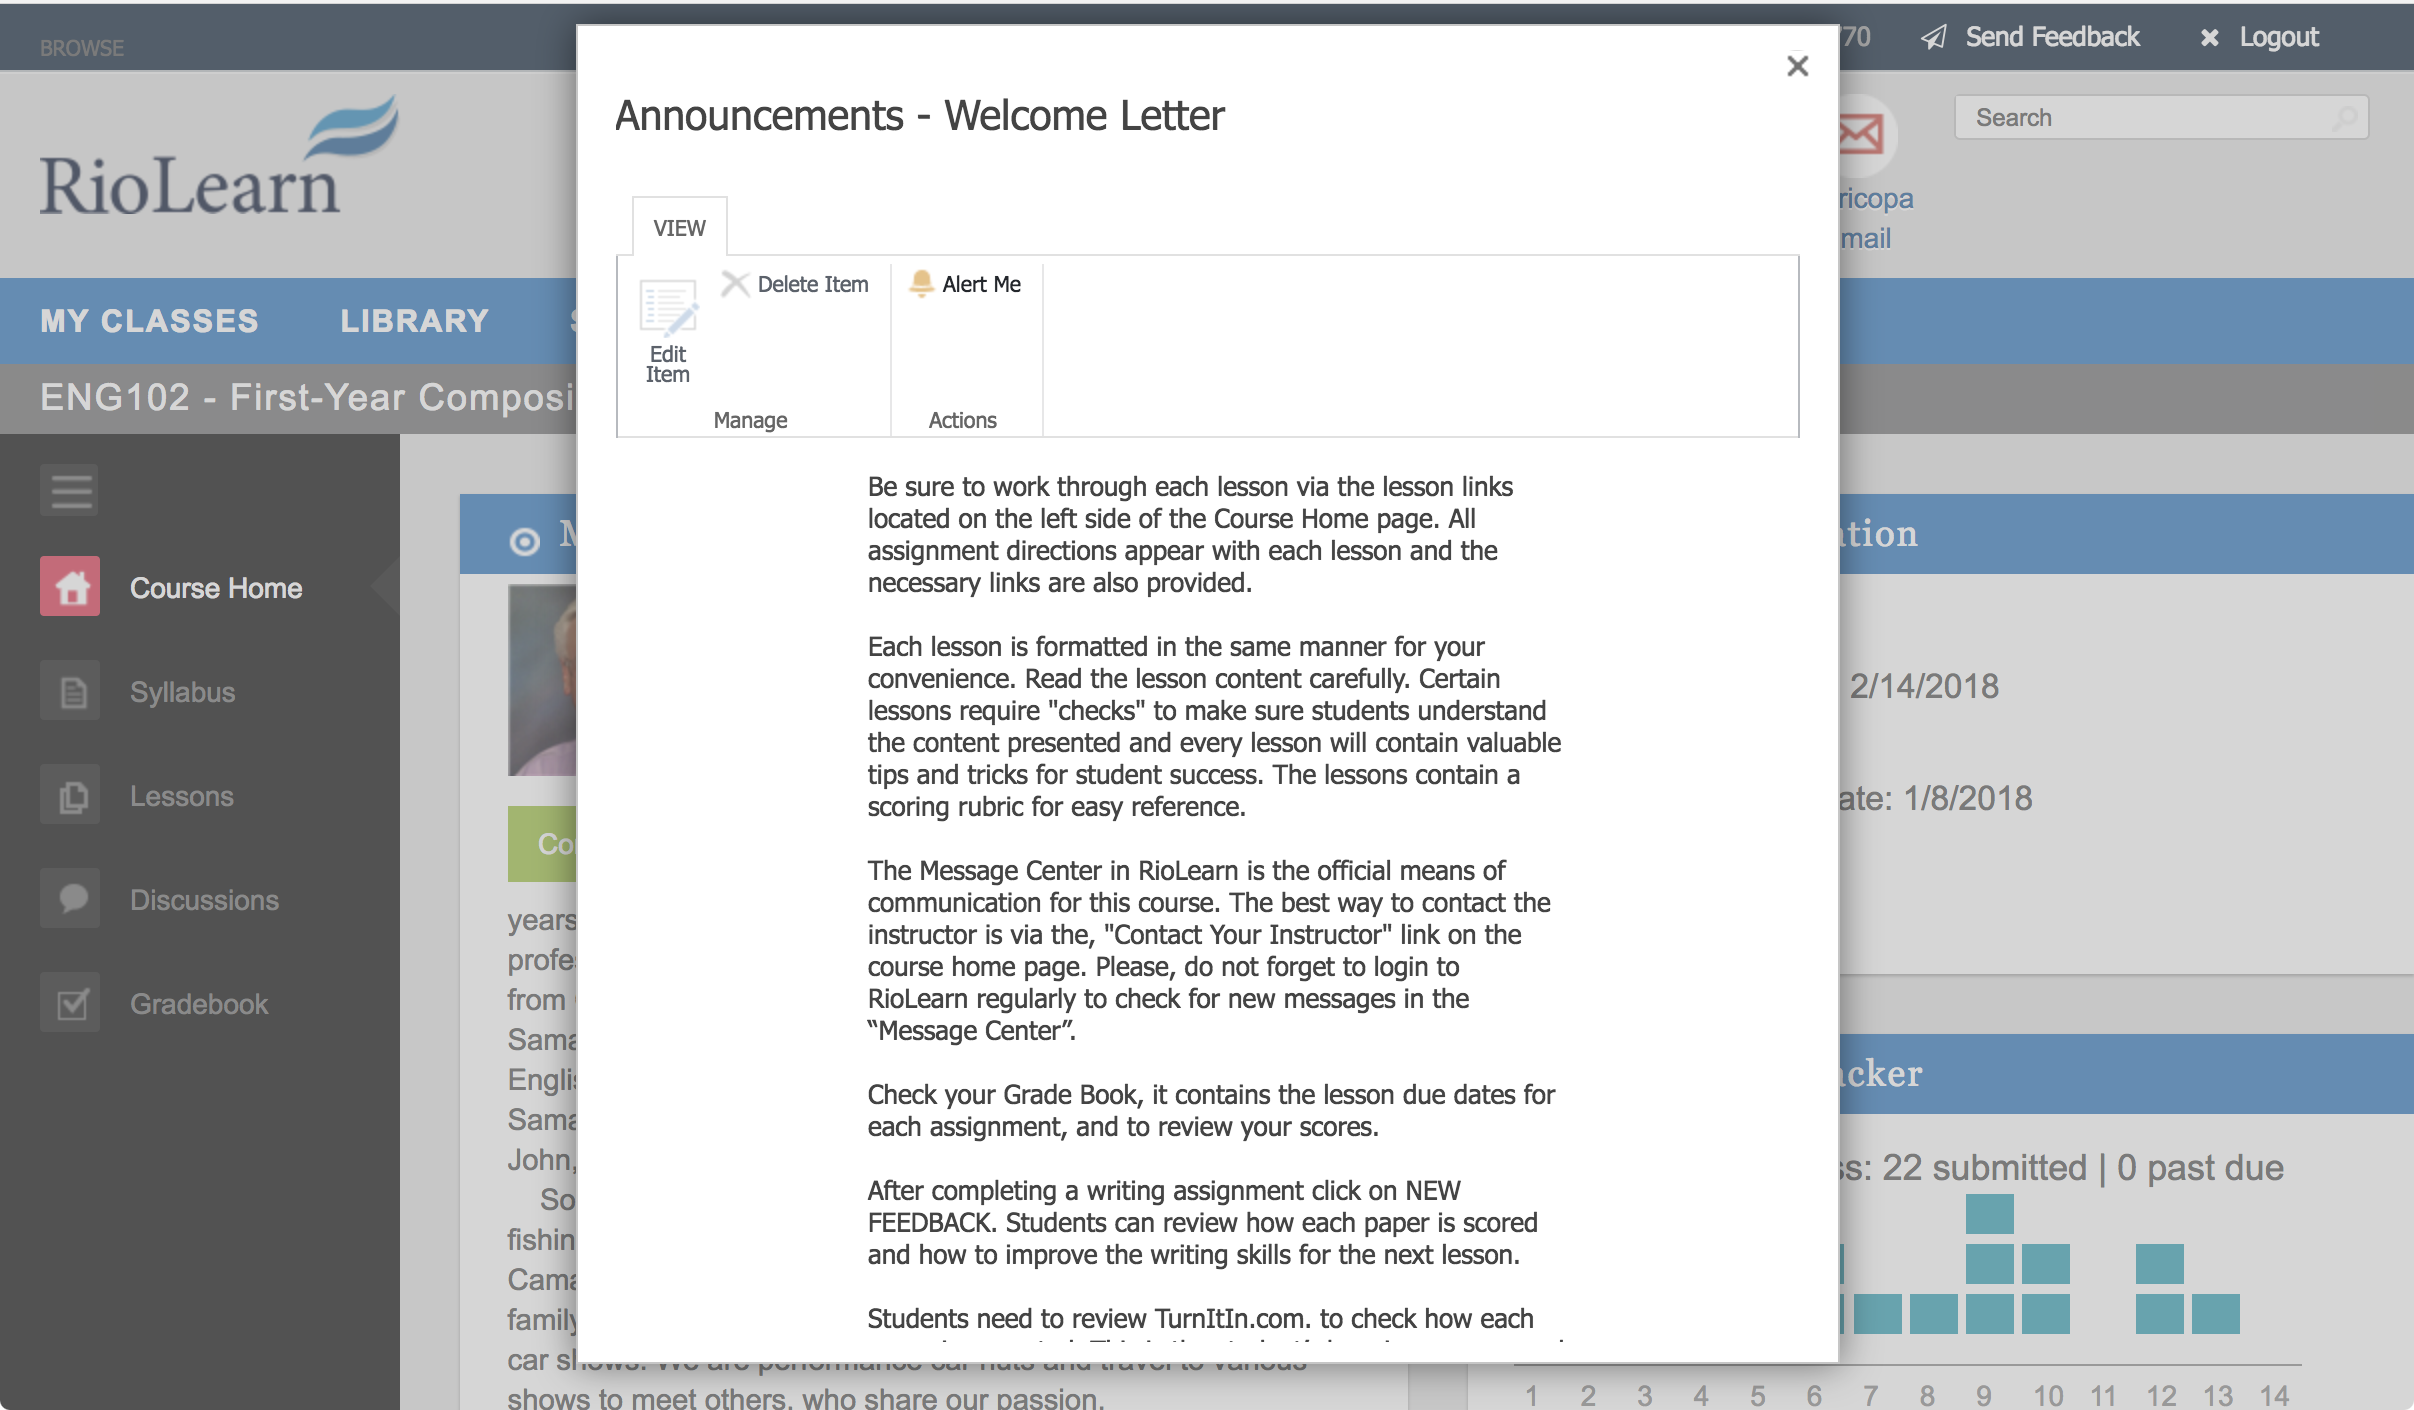
    Course Welcome Message

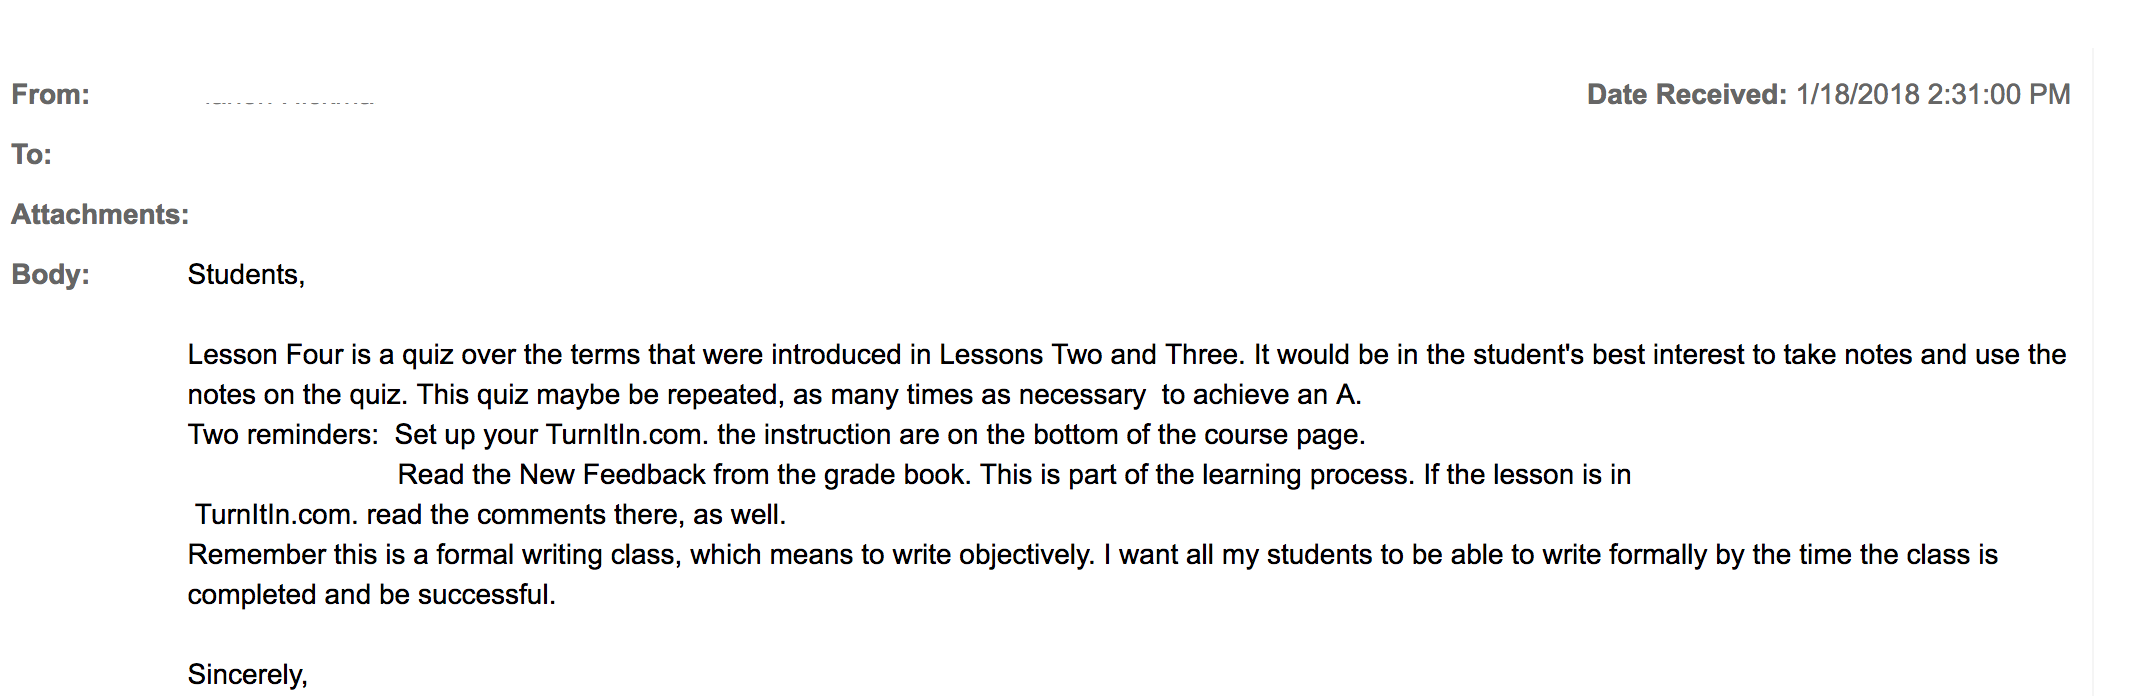
    The instructor sent out several announcements at the beginning of class, a welcome letter, and then one reminder or update message at the beginning of each month. That’s it for instructor-initiated interactions.
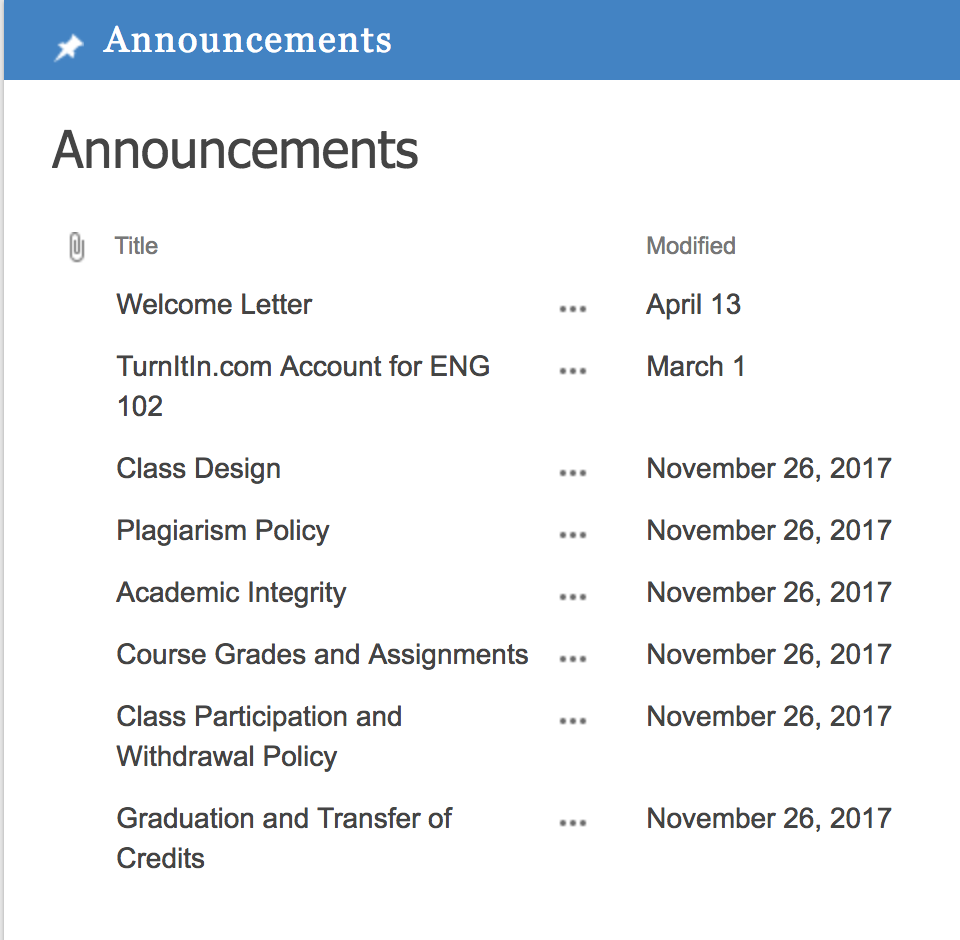
    Course announcements

    Sample Message

    There were no student-to-student discussions, as the discussion board was unused for the course. There was one peer-review activity, but otherwise no interactions between students. I have been a frequent critic of threaded discussion boards, but it is certainly better to have something instead of nothing.
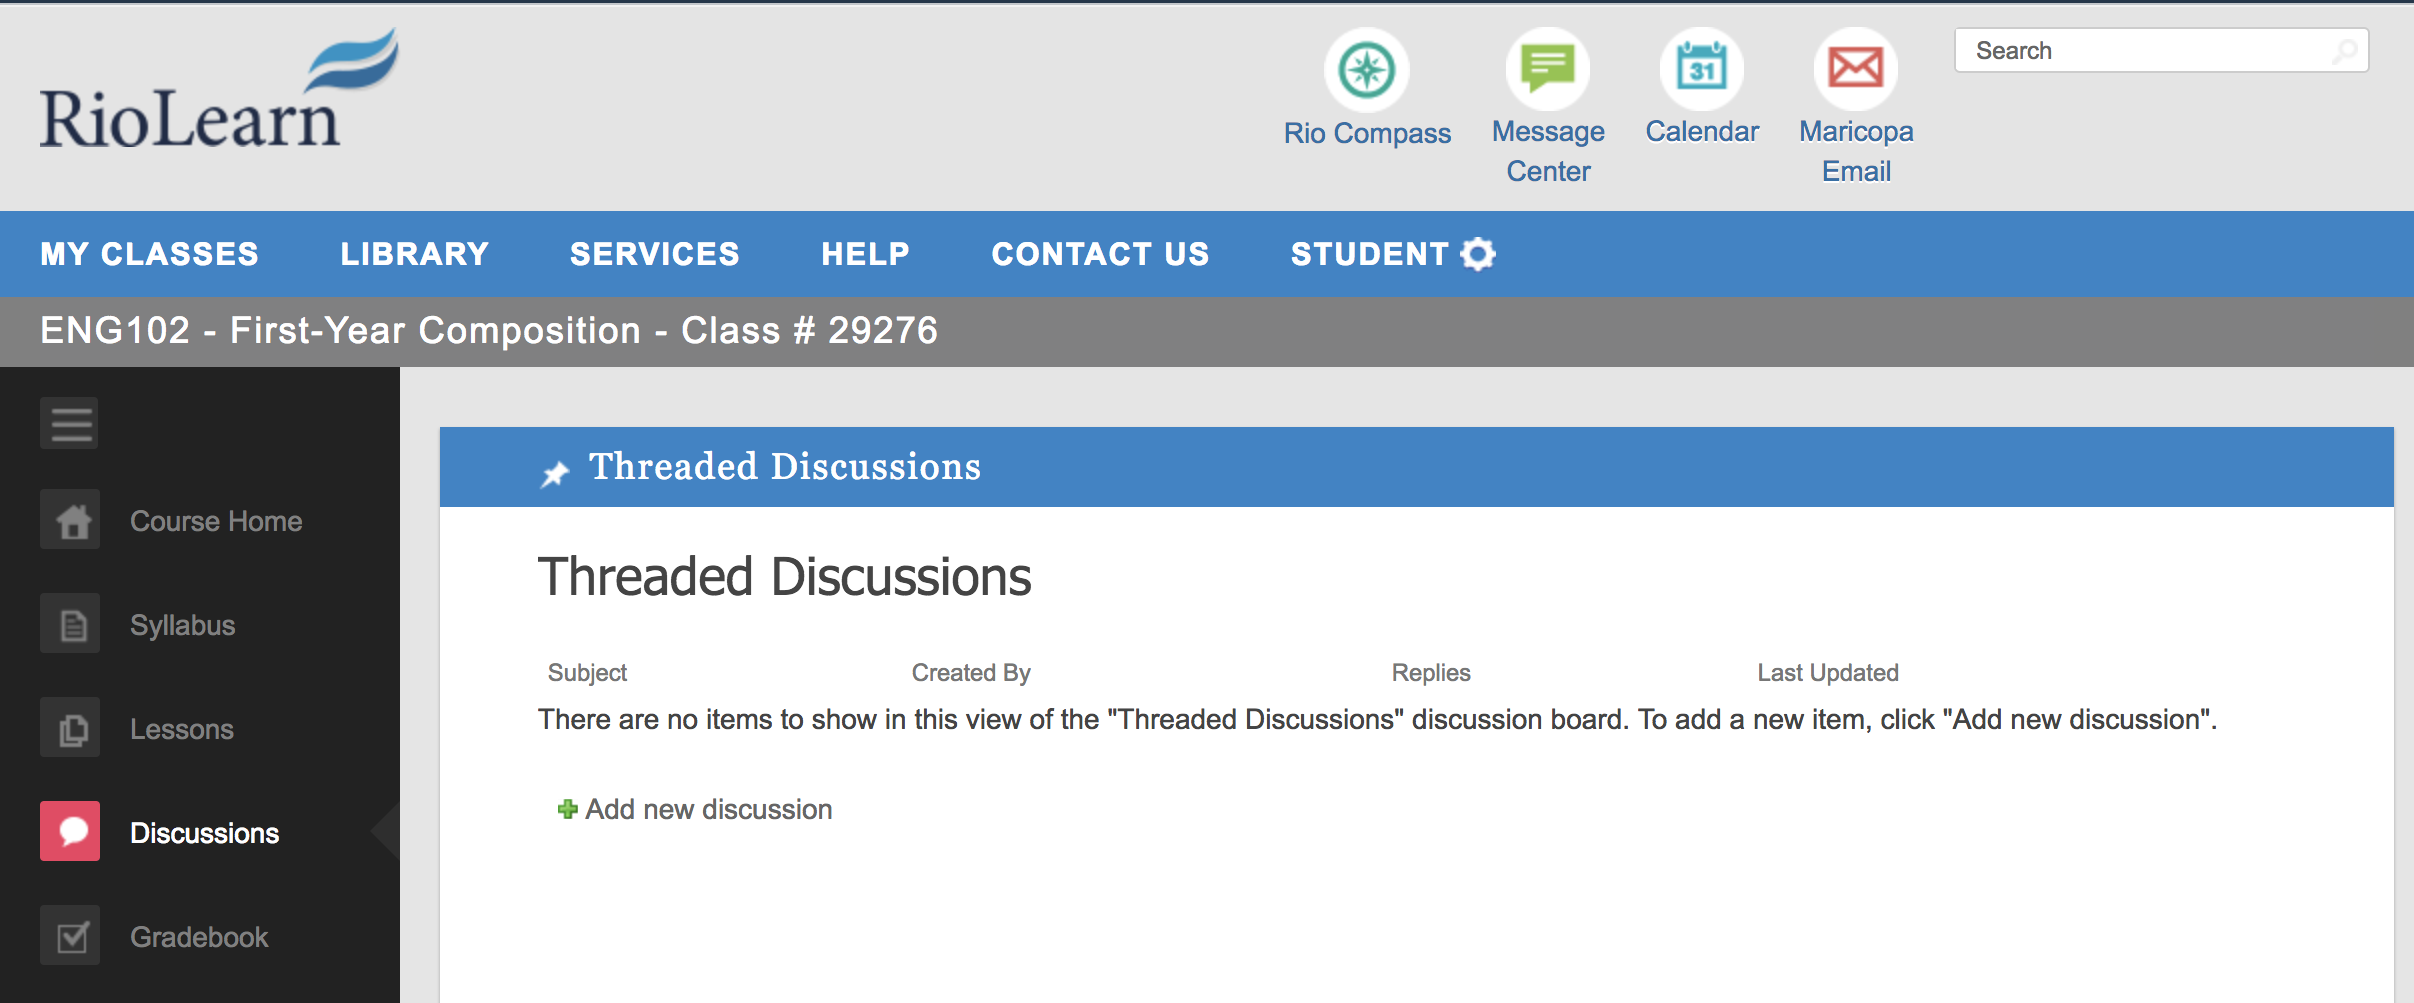
    Discussion Tool

    The rest of the interactions came in two categories: grading of assignments and responses to student-initiated messages. The primary feedback method in these two courses was faculty usage of the custom-developed Feedback Tool, which uses rubrics to grade assignments.
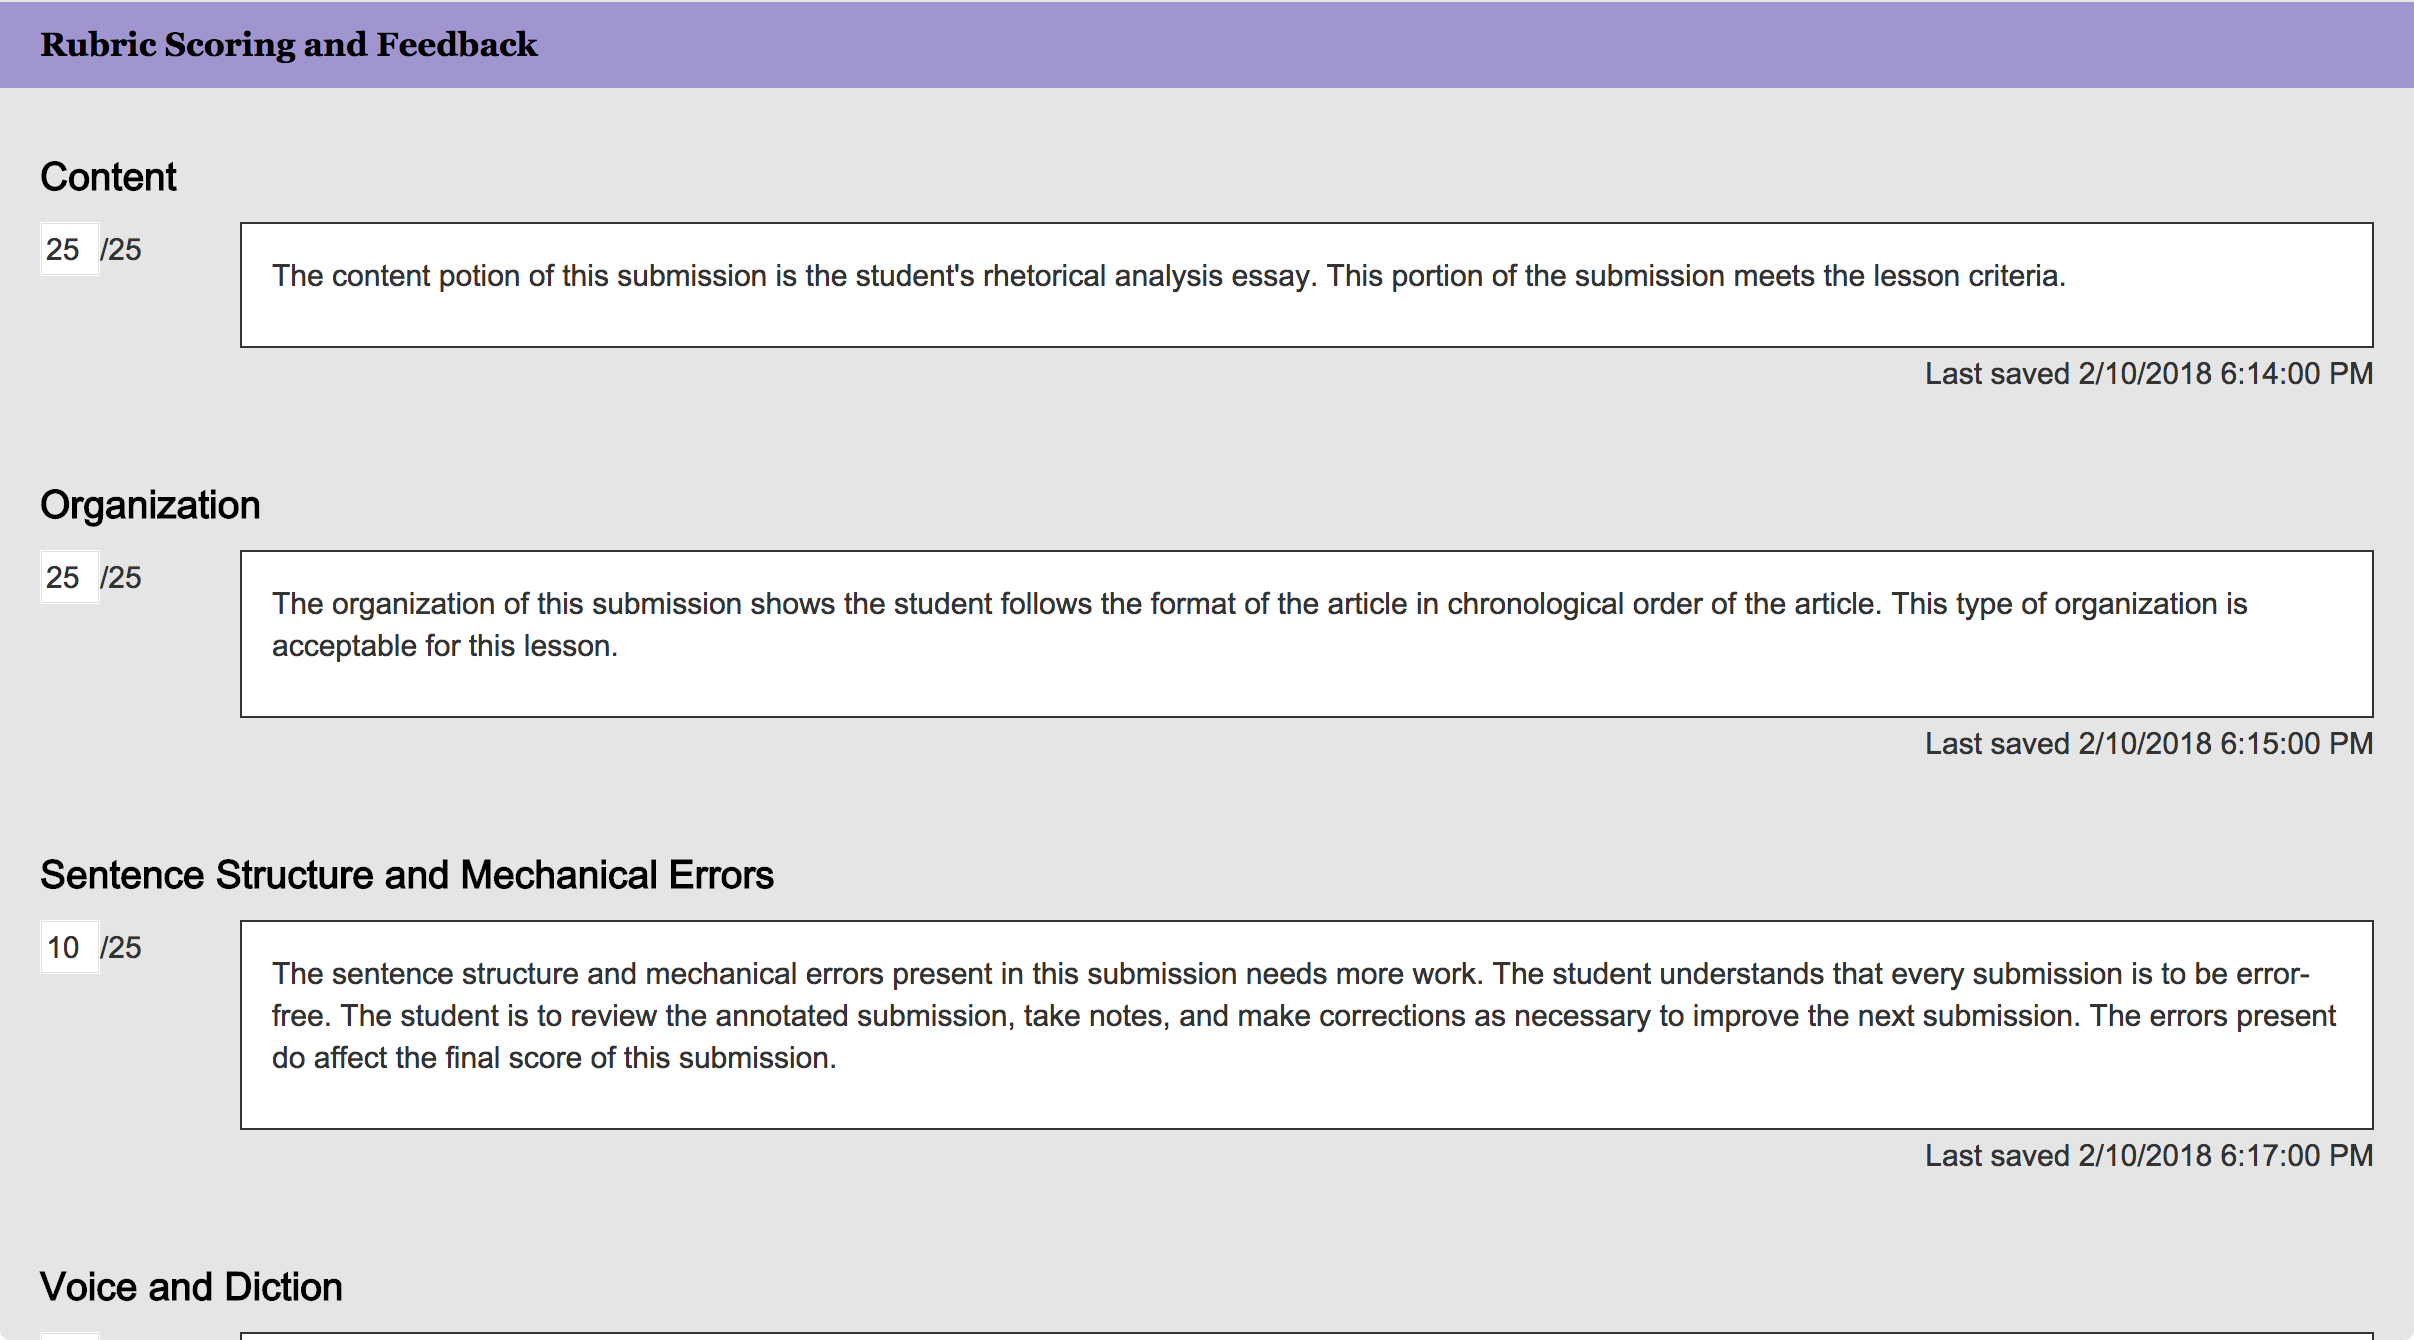
    Lesson Feedback

    There were several assignments that included annotated mark-ups of the submitted papers, which appear to be the most useful feedback from instructors.

    A review of EED200 shows the same course structure – few instructor-initiated interactions, use of rubric grading as feedback on assignments, and specific responses when students send questions in through the Message Center.

    For both courses, the instructors typically responded to student messages within a day or two.

    This approach is troubling, as both courses appear to not meet the “regular and substantive interaction” regulation for credit-bearing online courses. I have been critical about the vague standards and the egregious application by the Department of Education’s Office of Inspector General audit of Western Governors University, but these complaints do not mean that the regulation has no point. The idea is that course design and facilitation should be implemented to ensure that students are not left to figure out static course materials and to be responsible for initiating most forms of interaction. As stated in a 2014 Dear Colleague Letter on the subject of regular and substantive interaction based on competency-based education (CBE) approaches [emphasis added]:

    We do not consider interaction that is wholly optional or initiated primarily by the student to be regular and substantive interaction between students and instructors. Interaction that occurs only upon the request of the student (either electronically or otherwise) would not be considered regular and substantive interaction.

    Some institutions design their CBE programs using a faculty model where no single faculty member is responsible for all aspects of a given course or competency. In these models, different instructors might perform different roles: for example, some working with students to develop and implement an academic action plan, others evaluating assessments and providing substantive feedback (merely grading a test or paper would not be substantive interaction), and still others responding to content questions.

    The problem with case studies is that the selection of cases to study may not be representative or appropriate to prove one’s thesis. It is possible that I happened to look in detail at two courses that are aberrations. But even so, this view is troubling, as these are centrally-developed courses (not subject to the whim of individual instructors), and both courses have little meaningful provisions for faculty-student or student-student interactions. The instructors were responsive to messages, but that is not enough to back up claims of high-quality courses. The dissonance between these two courses and what is described in the ASU / BCG report led me to take a critical look at the data.

    For the next post, I’ll take the external view and look at aggregate public data on Rio Salado College on academic outcomes.


  • Comparing the First Ten Years of Blackboard and Instructure in LMS Market

    Comparing the First Ten Years of Blackboard and Instructure in LMS Market

    Last year Blackboard celebrated their 20th anniversary as a company, and this year Instructure celebrated their 10th. Yes, the company with Canvas, the “new” LMS solution, is a decade old. To gain historical perspective, it is interesting to compare each company’s first ten years in business in terms of primary financials – revenue and income – and performance in their core North American Higher Education market.

    We can only go so far in comparing the companies on this basis, however, due to different circumstances.

    • Most importantly, Blackboard helped create the LMS market and therefore had significant portion of its expansion in a greenfield situation, picking up clients who had not previously used an institution-wide LMS. Canvas entered the market well after saturation, with greater than 90% of institutions already having a standard LMS.
    • Blackboard developed its product line pre-cloud, with on-premise hosting being the primary deployment model. Canvas was cloud-native, developed on top of AWS infrastructure.
    • Blackboard’s growth was heavily based on corporate acquisition of competitors – Prometheus, WebCourse, WebCT in the first decade – while Instructure’s growth has been almost exclusively organic.
    • Both companies sold in more than just the North American Higher Ed (NAHE) LMS market, even if that was the core. Blackboard acquired two companies in 2000 and launched a card-reader transaction business, and they played somewhat in the K-12 and corporate learning space. Instructure developed Bridge for corporate learning, Arc for video platform, and it has a heavy presence in the K-12 LMS market.

    Interestingly, both companies went public in Year 7 (Blackboard in 2004, Instructure in 2015).

    With that in mind, let’s compare revenue, operating income – both derived from public SEC filings and adjusted to 2018 dollars – and market share in their core NAHE market. The financial data comes from public filings, and data for 2018 for Instructure are estimates based on their outlook presented in the most recent quarterly earnings release. Market share data is based on our LMS Market Analysis service and associated financial analysis for premium subscribers.

    Blackboard and Instructure revenue and income in 2018 dollars, and north american higher ed market share in percentage and numbers

    Some notes:

    • Blackboard raised ~$185 million in venture financing pre-IPO while Instructure raised ~$95 million (both in 2018 dollars). Part of this difference can be attributed to the much higher costs associated with pre-cloud enterprise software deployment models.
    • Blackboard’s revenue was higher than Instructure’s at similar points, and their operating income was mostly positive after Year 6. Instructure has maintained a significant loss each year from operations. One way to explain this difference is that Blackboard’s used funds for corporate acquisitions, thus fueling growth, while Instructure invested funds into sales & marketing and organic growth. This is not the whole story, but it is a big difference between the two companies.
    • In market share represented as a percentage, Blackboard’s growth was much faster, but this was in a period where the market was developing and not all schools had a standard LMS. When viewing this market share in raw numbers, we see that Instructure’s growth would have exceeded Blackboard’s were it not for the Year 9 WebCT acquisition.
    • Blackboard was already showing organic market declines (in NAHE market share %) and slowdowns in raw numbers outside of the immediate WebCT acquisition of customers. Instructure’s organic growth shows no signs yet of slowing down, is less lumpy and more predictable.


  • Moody’s Downgrades Blackboard Debt, Focuses On Learn Ultra Delivery

    Moody’s Downgrades Blackboard Debt, Focuses On Learn Ultra Delivery

    In Spring 2015 Moody’s affirmed their B2 rating for Blackboard’s nearly $1.4 billion in debt as part of the company’s acquisition of Schoolwires, with a negative outlook for the ratings (meaning there was risk of a further downgrade). Three weeks ago, that downgrade took place.

    (“Moody’s”) downgraded Blackboard Inc.’s Corporate Family Rating (“CFR”) by two notches to Caa1, from B2, as well as its Probability of Default Rating, to Caa1-PD, from B2-PD. Moody’s also downgraded Blackboard’s $135 million first-lien revolving credit facility and $920 million (remaining balance) first-lien term loan to B3, from B1, and its $378 million second-lien notes to Caa3, from Caa1. Moody’s also changed Blackboard’s outlook to stable, from negative.

    Put in regular terminology, the previous B2 rating indicated that Blackboard ((Disclosure: Blackboard is a subscriber to our LMS market analysis service and is a sponsor for our recent Empirical Educator Project summit.)) had “the capacity to meet its financial commitments. Adverse business, financial, or economic conditions will likely impair the obligor’s capacity or willingness to meet its financial commitments.” But with the new Caa1 rating, Blackboard “is currently vulnerable, and is dependent upon favorable business, financial, and economic conditions to meet its financial commitments.”

    The rationale for the downgrade is that Blackboard holds a very high amount of debt (now more than $1.4 billion) relative to its earnings, and revenue growth is not coming from its core markets.

    Blackboard’s core North American Higher Education (“NAHE”) and K-12 units, representing 56% of total revenue, continue to show weakening top line results, suggesting that the success of its new Ultra user interface is still uncertain. Blackboard’s international segment, also weak, has shown modest stabilization of late. Only the campus enablement segment, consisting of recently acquired educational community communications and transaction processing services and representing a quarter of Blackboard’s revenues, has shown healthy, reliable revenue growth. Some ratings support is provided by Blackboard’s high level of revenue visibility, with three quarters of 2017 revenues coming from recurring products and services, and underpinned by its 90% renewal rates in 2017. Both of these measures, however, represent declines from prior years.

    The turnaround is stalling, and the credit cards are maxed out. Blackboard has continued to cut costs, including “late-year layoffs”, and Moody’s expects “overall revenues to be flat to down slightly in 2018 as competitors have stifled market share gains”.

    While this is not good news for Blackboard, the ratings action does give the ed tech community additional insight into the operations and health of the company. Blackboard total revenues are between $700 – $720 million, with earnings (EBITDA, adjusted by Moody’s) between $160 – $180 million.

    And in the rationale for the ratings comes specific commentary on Learn Ultra.

    Software renewals have been weaker than expected in the NAHE [North American Higher Ed] segment, as the company strives to sell its latest learning management system (“LMS”) software enhancement, Ultra, into a crowded and very competitive marketplace. Given operating seasonality tied to the academic year, the behind-schedule launch of Ultra, in mid-2016, meant that measurable revenue and EBITDA [Earnings before interest, tax, depreciation and amortization] contributions from it began to be realized only in the 2017 academic year. There are indications that Ultra is gaining traction relative to Canvas and Desire2Learn, and Moody’s believes the packaging of Ultra with transaction- and payment-processing services may support its competitive positioning. But the success of Ultra is far from certain, and the threat from existing and possibly new competitors remains high as barriers to entry, specifically for web-based software, are relatively low. Meanwhile Blackboard, with a brand new CFO, is focusing its research, sales and marketing, and product development resources in an effort to ensure Ultra’s future.

    We have covered the 2014 announcement and ongoing fate of Learn Ultra here at e-Literate, and claiming a “launch of Ultra, in mid-2016” is generous at best. At that point there were educator previews with no ability for institutional adoptions. Fall 2017 is the closest to what I would say is an actual launch. As of a January, 2018 meeting Michael and I had with Blackboard’s management team, they claimed dozens of schools actively piloting Learn Ultra ((I have asked several times for this list, or a subset of this list, of schools piloting Ultra to allow interviews. If and when we receive schools to interview, we will cover in another post.)), and their flagship customer University of Phoenix is beginning rollout of the LMS starting this month.

    What is going well at Blackboard is the movement to a SaaS (software as a service, aka ‘the cloud’) model for the LMS – for both the traditional experience and Ultra experience. As of January there were 284 schools on Learn SaaS and 49 others in migration. In a purchase-only report, Moody’s acknowledged this strength and noted the investment that Blackboard is making in this area (more than $50 m expected in 2018).

    While the company has shown good progress in migrating its legacy Learn customers onto the appropriate SaaS-based platform from which those customers may choose, in turn, to migrate to Ultra, Blackboard’s efforts to make those transitions smooth for its customers have entailed elevated capital expenditures, which will likely continue through 2019, cutting into free cash flow.

    Put this all together, and 2018 is the year that Blackboard needs to transition from ‘wait until Learn Ultra is ready’ to ‘Learn Ultra had better lead to increased sales’.  I have been impressed with the new management team’s transparent approach to dealing with analysts, and with their honest approach to understanding the problems they need to solve. But the company needs to deliver, and this is shaping up to be a newsworthy year for Blackboard, for good or ill. There’s a lot to watch here.

  • What is an Empirical Educator?

    We have the first batch of Empirical Educator Project (EEP) summit videos available in the form of a four-episode interview case study. You can see the full set here. I’ll be blogging about the series over the next week or so, starting today with the first episode on the definition of an empirical educator.

    A lot of the currently popular terms of art that bear some relation to “empirical educator”—efficacy, evidence-based, research-backed, data-informed, etc.—tend to produce discipline-inflected responses (e.g., “It makes no sense to talk about ‘data” when you’re teaching English composition”) or suspicion due to vendor, funder, and media hype (e.g., “‘Efficacy’ is just the latest marketing buzz phrase”). And many of these terms tend to emphasize products or implementations. We wanted to put the focus on people, and we wanted the term to be inclusive of a wide range of practices that are discipline- and context-appropriate. So we introduced a new term, which always requires some norming to get people rallied around a common understanding of it.

    Here’s what a sampling of summit participants had to say about the meaning of “empirical educator” after a day of work together:

    (https://youtu.be/-h5-OB4WvwQ)

    The definition becomes increasingly inclusive as you listen to the complementary perspectives over the course of the video.

    I think we’ll develop a more rigorous, evidence-based understanding of what it means to be an empirical educator over time—while hopefully maintaining the inclusive spirit. For now, I’ll put out my own taxonomy of levels of empirical education:

    1. Intuitively empirical: This comes down to whether you pay attention to your students and do something differently with them based on what you observe. Do you always do the same thing, or do you have a bag of tricks that you can draw from when you see students struggle? I believe that the substantial majority of educators are empirical in this sense. They may not think of it as empiricism, but they are observing student behaviors and are adjusting their strategies based on what they see, guided by some sort of rationale for choosing which strategy to employ in different circumstances.
    2. Mindfully empirical: Mindfully empirical educators think about how they can get the maximum amount of useful diagnostic information from day-to-day course work. They design their courses with a goal of creating many feedback loops that enable them to be adjust their teaching to the needs of the students.
    3. Meta-cognitively empirical: Meta-cognitively empirical educators are empirical not only about how they use their existing bag of tricks but also about which tricks they should have and how effective those tricks really are. They consciously and regularly test their own assumptions about effective teaching, and they are open to trying new appropaches. My read of Lauren Herckis’ research is that the barrier of moving from mindfully empirical to meta-cognitively empirical (and to the next level, socially empirical) is where a lot of the difficult work needs to be done. Lots of educators are intuitively empirical, and the transition from there to mindfully empirical is not a huge leap. Getting them to test and challenge their deeply held beliefs about what constitutes effective teaching is a lot harder.
    4. Socially empirical: Socially empirical educators view effective teaching not as an individual art but as a shared pool of knowledge and experience that everyone can learn from and contribute to. They seek out common vocabulary, methods, and standards of proof so that they can learn with their colleagues and raise the collective bar. This is the beginning of disciplinarity.

    One way of thinking about the goal of EEP is to create a critical mass of socially empirical educators. They may not all arrive at one shared vocabulary, set of methods, and standard of proof. We will likely need a family of subdisciplines and empirical approaches to handle all the many meaningful contextual differences in education. But if a majority of educators see their work as embedded in a collective effort to learn together about how we can be more effective educators, then we will progress much more rapidly as a sector.

    I think it’s also important to note that the term “educator” is intended to be more inclusive than just people who work in classrooms. Although instructors will be central change agents in any empirical education movement, anyone who is directly involved with designing or delivering a meaningful educational intervention is included in our definition of an educator. This means program administrators, instructional designers, and product designers, among others, can all be empirical educators.

  • Online Program Management: Spring 2018 view of the market landscape

    Online Program Management: Spring 2018 view of the market landscape

    Nearly two years ago I wrote two blog posts giving a high-level view of the Online Program Management (OPM) market landscape. This is a growing but messy market, and the market changes since mid 2016 call for an updated view.

    OPM providers are for-profit organizations that help non-profit schools develop online programs, most often for Master’s level programs. These companies provide various services for which traditional institutions historically have not had the experience or organizational capability to fully support, at least for fully-online programs and often for non-traditional student populations. Some examples of the services include marketing & recruitment, enrollment management, curriculum development, online course design, student retention support, technology infrastructure, and student & faculty call center support.

    The OPM market has historically been known for a full-service, revenue-sharing model, based on the premise that most traditional institutions are not only operationally unprepared to offer online programs at scale but also are not set up to invest in online programs up front. There are extensive costs, particularly in marketing and recruitment as well as curriculum and course design, that cause most scalable online programs (that is, those designed with the intent and infrastructure to allow more than just a few dozen students) to require investment over the first several years, before tuition revenue catches up. Rather than requiring the institution to spend sizable up-front money without a guarantee of repayment, revenue-sharing OPM vendors provide this financing themselves – which is in itself an expensive proposition. It often takes three to five years for an OPM company to become profitable for any online program, which is why they often require 10-year or even longer contracts.

    As the online education market has matured, however, there has been a growing pushback against revenue-sharing as the only model available. Thus there is an emerging unbundled fee-for-service OPM model, in which the companies offer the same services, or some subset, for the market price of those services. The institution pays for the services used, mostly independent of the amount of tuition revenue coming into the online program. This category leads to the program, or institution, to take the up-front financial risk but not have to sign contracts sending ~40 – 60% of the tuition revenue to the vendor. Fewer strings attached but more responsibilities and risks for the school.

    With the recent success of Southern New Hampshire University and longer-term models from Penn State World Campus (as well as others), there are also questions about whether non-profit schools can create scalable programs without an OPM partner at all. This category, for obvious reasons, is not presented in our market landscape but is a real option.

    In our view, there is not an either-or proposition in the market. We see strong arguments for both bundled revenue-sharing models and for unbundled fee-for-service models, and I personally do not believe that the market is moving away from revenue sharing as much as there is pressure for additional models. There are a growing number of choices available to schools, but there is also a crowded marketplace that is becoming more difficult to understand.

    With that setup in mind, on to the market landscape graphic.

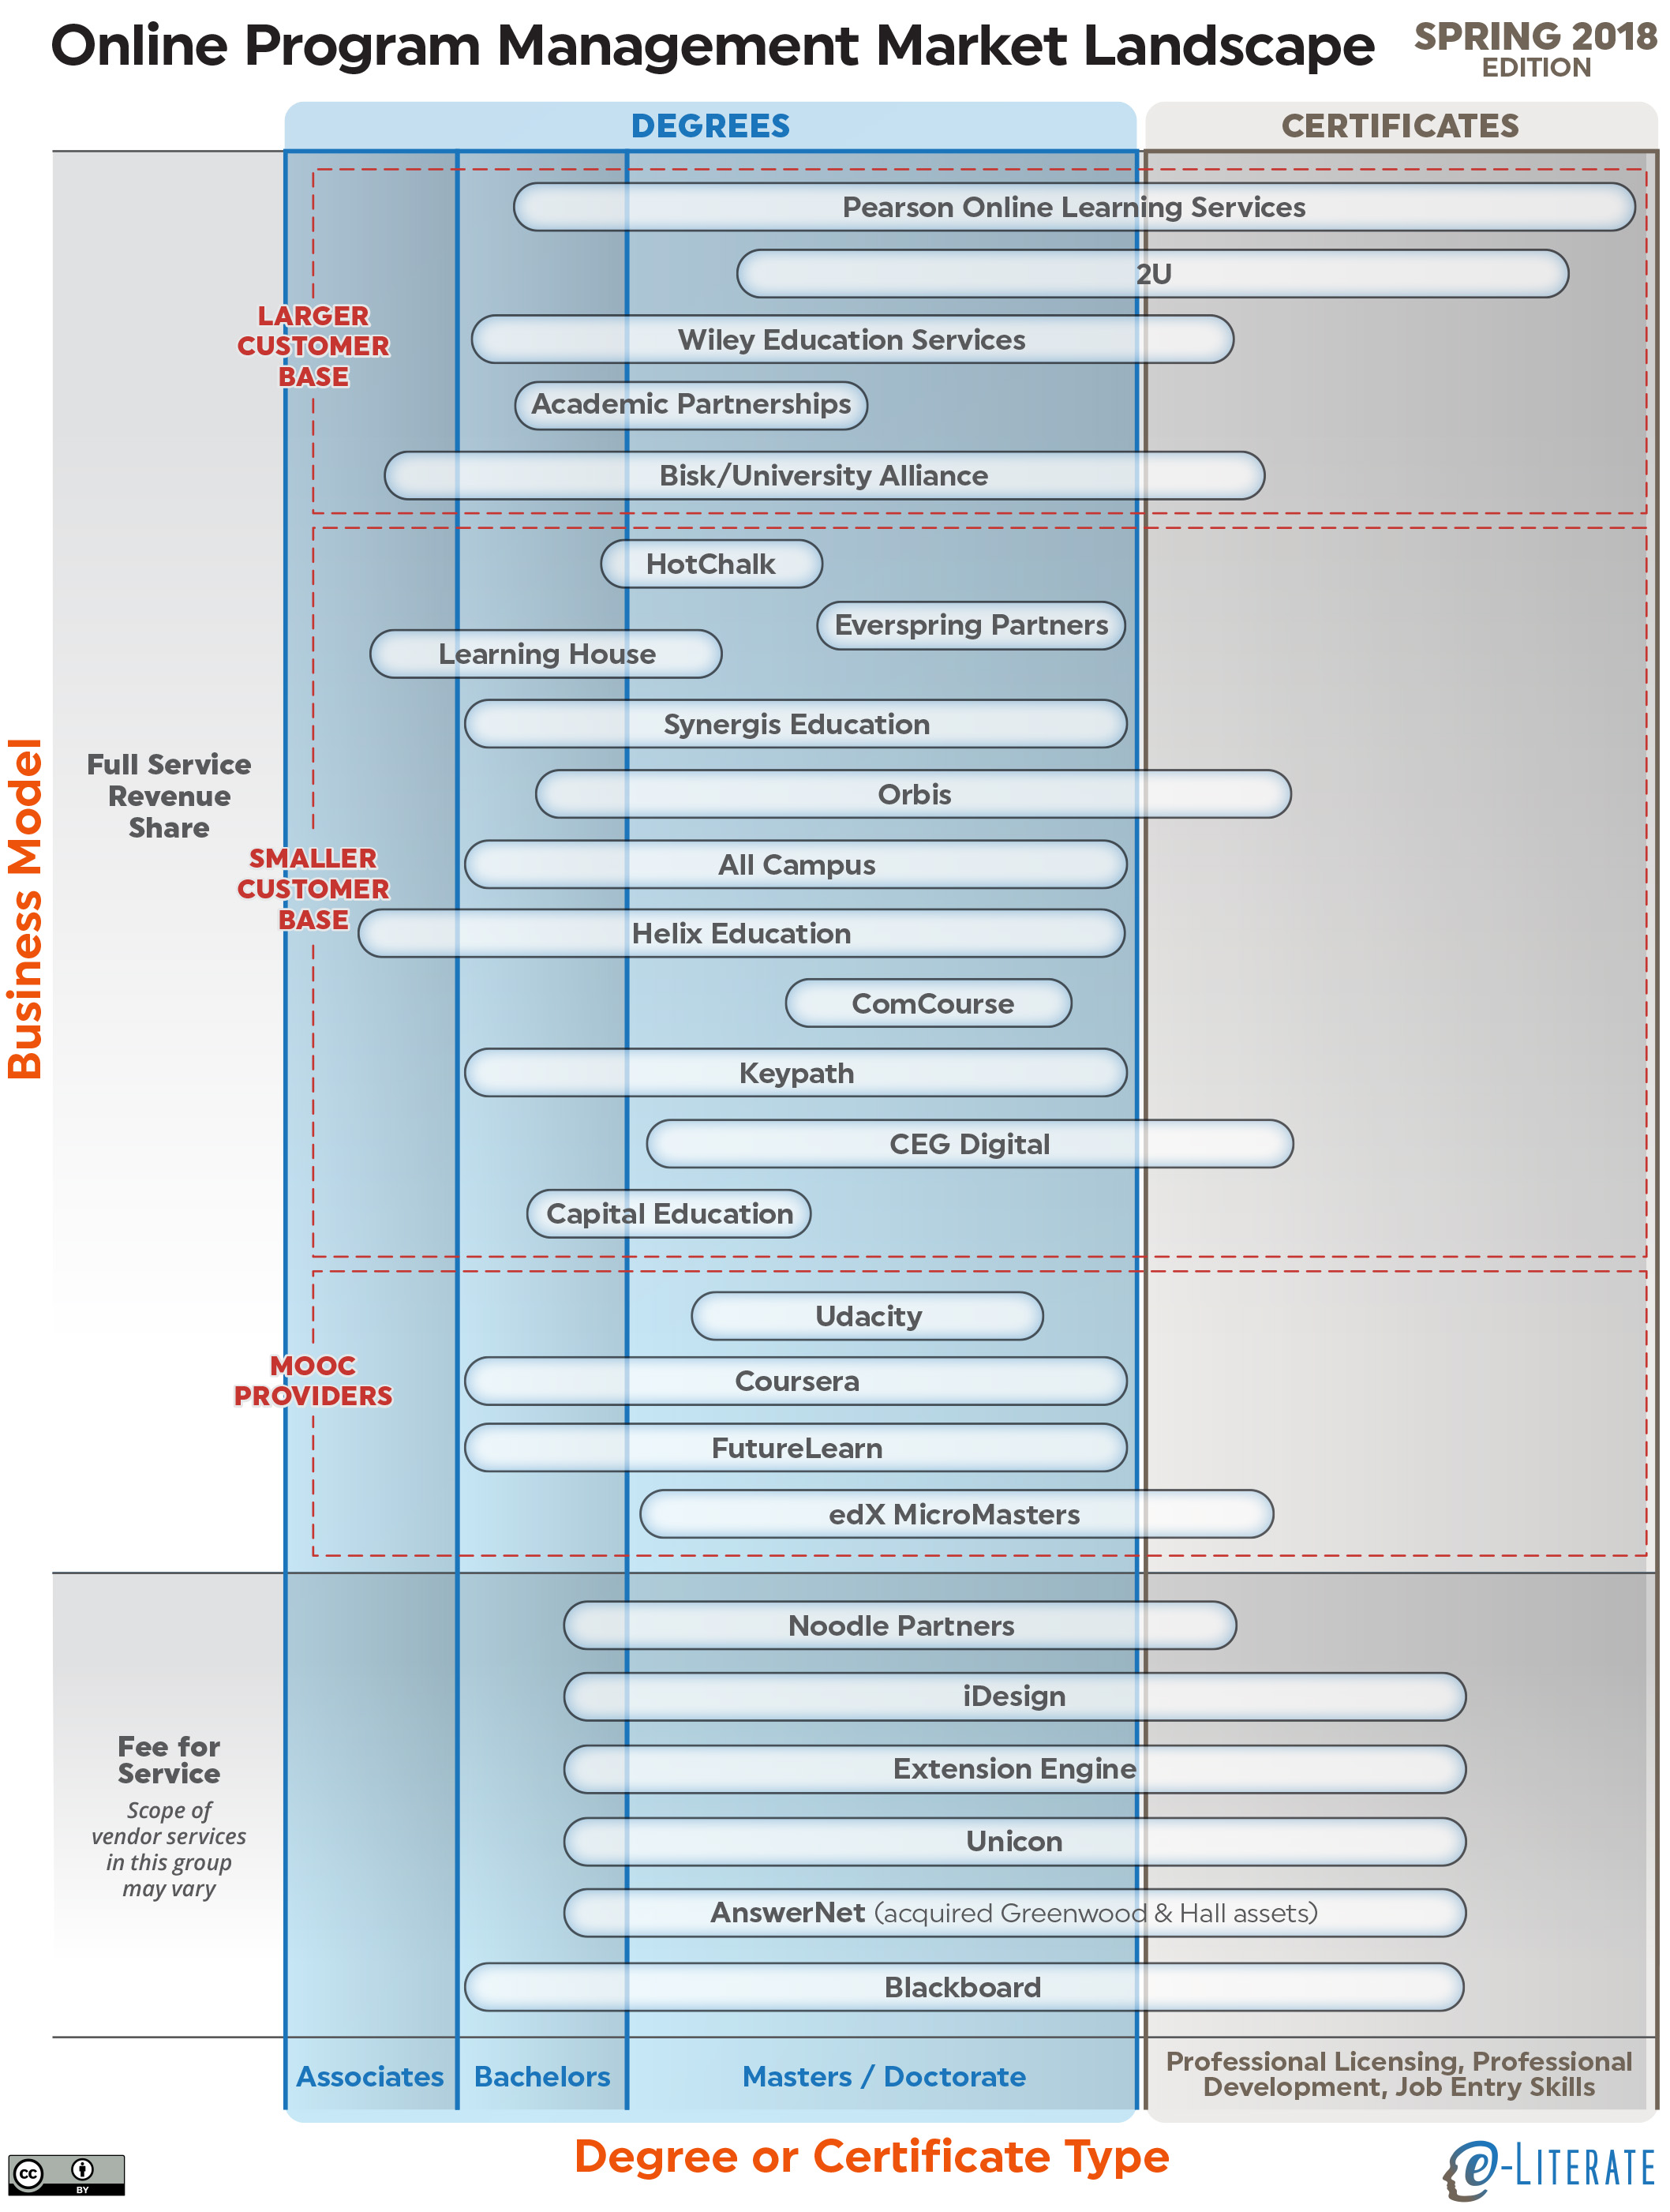
    As before, please note that this view is intended to give a visual overview of the market landscape and is not comprehensive in terms of vendors represented. This is especially important to understand for the Fee for Service category, where there is no clear definition yet of what is an unbundled OPM provider and what is a product or service provider who happens to serve online programs. Treat this category as illustrative and not exhaustive.

    Market landscape of OPM vendors

    There are three primary changes to note in the graphic’s design since 2016:

    • We have combined different categories of Certificates into one column on the right side of the graphic, since it was difficult to to differentiate between OPM target markets.
    • We have added a sub-category of MOOC Providers under Full Service Revenue Share category to capture the recent changes in that market.
    • We have combined the Fee for Service and General Contractor into one category labeled Fee for Service, again due to difficulty differentiating service offerings.

    We should also note that there will likely be another sub-category of Full Service Revenue Share to capture the ongoing pivots by former for-profit institutions. Graham Holdings sold Kaplan University to Purdue University and remains a single-client OPM provider for that new brand Purdue University Global. Grand Canyon University is converting to a non-profit institution with the remaining for-profit company turning into a (single-client?) OPM provider. Bridgepoint Education plans to turn Ashford University and University of the Rockies into a combined non-profit institution, leaving the remaining for-profit company as an OPM. We are not ready to add this sub-category, and it is not clear yet if these providers plan to go beyond servicing the non-profit conversions.

    There are several changes to the vendors listed:

    • Pearson no longer refers to the Embanet brand that they acquired and now goes by Pearson ((Disclosure: Pearson, 2U, iDesign, Unicon, and Blackboard are sponsors for our Empirical Educator Project. See this post for more details.)) Online Learning Services.
    • 2U, after the May 2017 acquisition of GetSmarter, now serves certificate programs and not just masters degree programs.
    • Wiley no longer refers to the Deltak brand that they acquired and now goes by Wiley Education Services.
    • DeVry Integrated Education Solutions no longer appears to be active in the market, based on outdated web site (key executive listed has been gone for seven months) and no marketing or competitive presence. We have removed their listing.
    • Cambridge Education Group’s CEG Digital unit has emerged as an OPM provider serving UK-based institutions.
    • We (re)added Udacity based on the success of the Georgia Tech Masters in Online Computer Science program, which has helped spawn the new sub-category of MOOC Providers in the market, even though Udacity appears to have no interest in pursuing other higher education degree offerings.
    • We added Coursera as an OPM Provider, as this market now appears to be their core market moving forward.
    • We added FutureLearn based on their continuing expansion as a MOOC-based OPM provider.
    • We added edX with their MicroMasters initiative.
    • We added ExtensionEngine as a Fee for Service provider based on their work with Notre Dame and related program creation.
    • We changed Greenwood Hall to AnswerNet. After a spectacular implosion from Greenwood Hall a few months ago, AnswerNet acquired the remaining assets. It is not yet fully clear if AnswerNet will not provide more than Call Center services, so we’ll keep an eye on this one.
    • Excelsior College’s Educators Serving Educators (ESE) initiative, launched in 2012 to provide a non-profit OPM offering, is no longer active.

    We’ll keep updating our landscape diagram over time and look for other methods to help make sense of this market.

  • Short eLiterate Course on Analytics and Adaptive Learning

    A while back, we released a playlist of animated explainer videos that could be used to introduce faculty to personalized learning, which we argue is a family of pedagogical approaches rather than a set of technologies: ((The videos featured in this post were funded by grants from the Bill & Melinda Gates Foundation))

    We now have a new set of six explainer videos that represent a short introductory course to the concepts behind adaptive learning and learning analytics, which are tools that are useful for personalized learning pedagogical approaches:

    We still lead with the pedagogy, as always. For example, we have one explainer that’s focused on continuous formative assessment. Here’s a taste of it:

    And here’s a bit about memory decay from our episode on memory-based adaptive learning:

    We also break down the technologies, connecting them to the pedagogical concepts. For example, we explain that there are actually multiple kinds of adaptive learning products that work in different ways:

    We give individual explanations of memory-based adaptive learning…

    …and skill-based adaptive learning.

    And, as we always try to do, we give educators tips for how to think about these tools in ways that help them evaluate the usefulness of various technologies and products for their particular teaching contexts:

    We hope you find these useful. Let us know what you think.


  • Courseware Without A Silver Bullet: Focusing on faculty enablement

    Courseware Without A Silver Bullet: Focusing on faculty enablement

    In a 2016 post on “Personalized Learning vs. Adaptive Learning”, Michael contrasted the former as a set of technology-enabled teaching practices with the latter as a project label [emphasis added].

    On the other hand, adaptive learning is a label that applies to products. Further, adaptive learning products can support all of the practice areas of personalized learning. They enable teachers to move content broadcast outside of class time, they make homework time into contact time through analytics, and they provide some tutoring function. “Adaptive” tends to provoke a lot of discussion around the latter of the three practice areas. See the piece I wrote for the American Federation of Teachers if you want a primer on the strengths and limitations of adaptive learning products as tutors. But as often as not the first two capabilities, neither of which is dependent on adaptive algorithms, are the ones that enable the biggest gains in personalized learning teaching practices. “Courseware” is a set of products that, when designed well and used properly, can enable faculty to move content broadcast out of the classroom and make homework time content time. Adaptive courseware adds the tutoring element while also, if done well, increasing the value of that homework contact time by providing better feedback through more targeted analytics.

    One problem, of course, is that many advocates end up presenting adaptive learning as a silver bullet, focusing on supposed magical tutoring capabilities and ignoring the messy but valuable work of enabling faculty to improve their own courses. As we will see, it is not a safe assumption that all vendors like this label or set of assumptions.

    In the first episode of this series we explored the challenge of going beyond pilots and deploying systems at scale. In the second episode we explored the importance of increased visibility as an important benefit of course redesign. In this episode we explore the challenge of silver bullets – what happens when a company has no intention of being labeled as “adaptive learning” but has been described that way? Realizeit is not the only company dealing with this same issue, and it is important for educators to understand how a company defines itself and the problems their products are designed to solve. ((This post is not meant to endorse Realizeit’s platform over other companies’ platforms. We are focusing on institutional perspectives and lessons to be learned. Realizeit is one of our sponsors of the Empirical Educator Project.))

    (source: https://youtu.be/xPWBoMhP_yU)

    This post is part of our e-Literate TV series, which is funded in part by the Bill & Melinda Gates Foundation. The findings and conclusions (or views) contained within are those of the authors and do not necessarily reflect positions or policies of the Bill & Melinda Gates Foundation.