e-Literate

Present is Prologue

Category: Ed Tech

The “Ed Tech” category includes posts about educational technology products themselves, including LMSs and other learning platforms, adaptive learning and other digital curricular materials products, learning analytics, and educational apps of all types. It also includes technical aspects of ed tech products, especially interoperability.

  • EDUCAUSE and Robot Tutors In The Sky: When investors are your main customers

    Yippie i ohhh ohh ohh
    Yippie i aye ye ye
    Robot tutors in the sky

    Before I head out to Indianapolis for the EDUCAUSE conference, I keep thinking back to a comment someone made in response to Michael’s description of Knewton marketing as “selling snake oil”. I can’t find the exact quote, but the gist was:

    This is what happens when you start to see VCs as your main customers.

    (more…)

  • The Starling: Pre-K Ed Tech

    The product I am going to tell you about here was created by two of my former seventh and eighth grade students. I love these guys. So yes, I am biased. But that knowledge also presents an opportunity. I am 100% confident that they have only the best of intentions. With that in mind, I can look at the genesis of an idea for pre-K ed tech—a particularly fraught corner of a fraught field—knowing that there is no scam or hidden agenda here and see some of the challenges that arise when trying to go from best of intentions to implemented product.

    I think Starling is a great idea that has the potential to do a lot of good in the world. But I also think it will raise some eyebrows.

    (more…)

  • Why Is Blackboard Laying Off Staff Despite Improved Market Share Position?

    Over the past two weeks Blackboard had another round of layoffs, likely due to the company missing financial targets. While one estimate places the number at roughly 200, from what I have heard the number is closer to 90 – 100 people let go. I asked the company for commentary on the layoffs and associated reorganization. By email they declined to comment on the number of employees let go but added this comment:

    These changes included the elimination of select positions across the company. We deeply appreciate the contributions made by the affected employees and are supporting them in their transition.

    This is not the first layoff at Blackboard since they were taken private in 2011; rather this is the latest in a series of cuts that have gone well beyond “trimming the fat”. Posts on thelayoff.com and glassdoor paint a picture of high attrition due to routine layoffs and many staff leaving by their own choice. We have written on several of these events here at e-Literate. 90 here, 100 there, 74 . . . it adds up, especially when combined with staff departures.

    To get another view into the company downsizing, consider that Blackboard recently signed a lease that will trim its corporate headquarters by 37%:

    Founded in a Dupont Circle row house in 1997, Blackboard, which has occupied 111,895 square feet at 650 Massachusetts Ave. since 2008, will move into Ogilvy Public Relations Wordwide’s former space on the eighth through 10th floors [70,482 square feet] beginning in December 2015.

    This follows a recent move in its Reston, Virginia facility that cuts its office space there by over 50%.

    In an ironic turn of events, the new headquarters move will put the company into the same building it occupied before 2008, and their neighbors in the building will include former CEO Michael Chasen’s SocialRadar and CBE provider FlatWorld.

    Why More Layoffs When US Market Share Finally Stabilizes?

    (more…)

  • State of the US Higher Education LMS Market: 2015 Edition

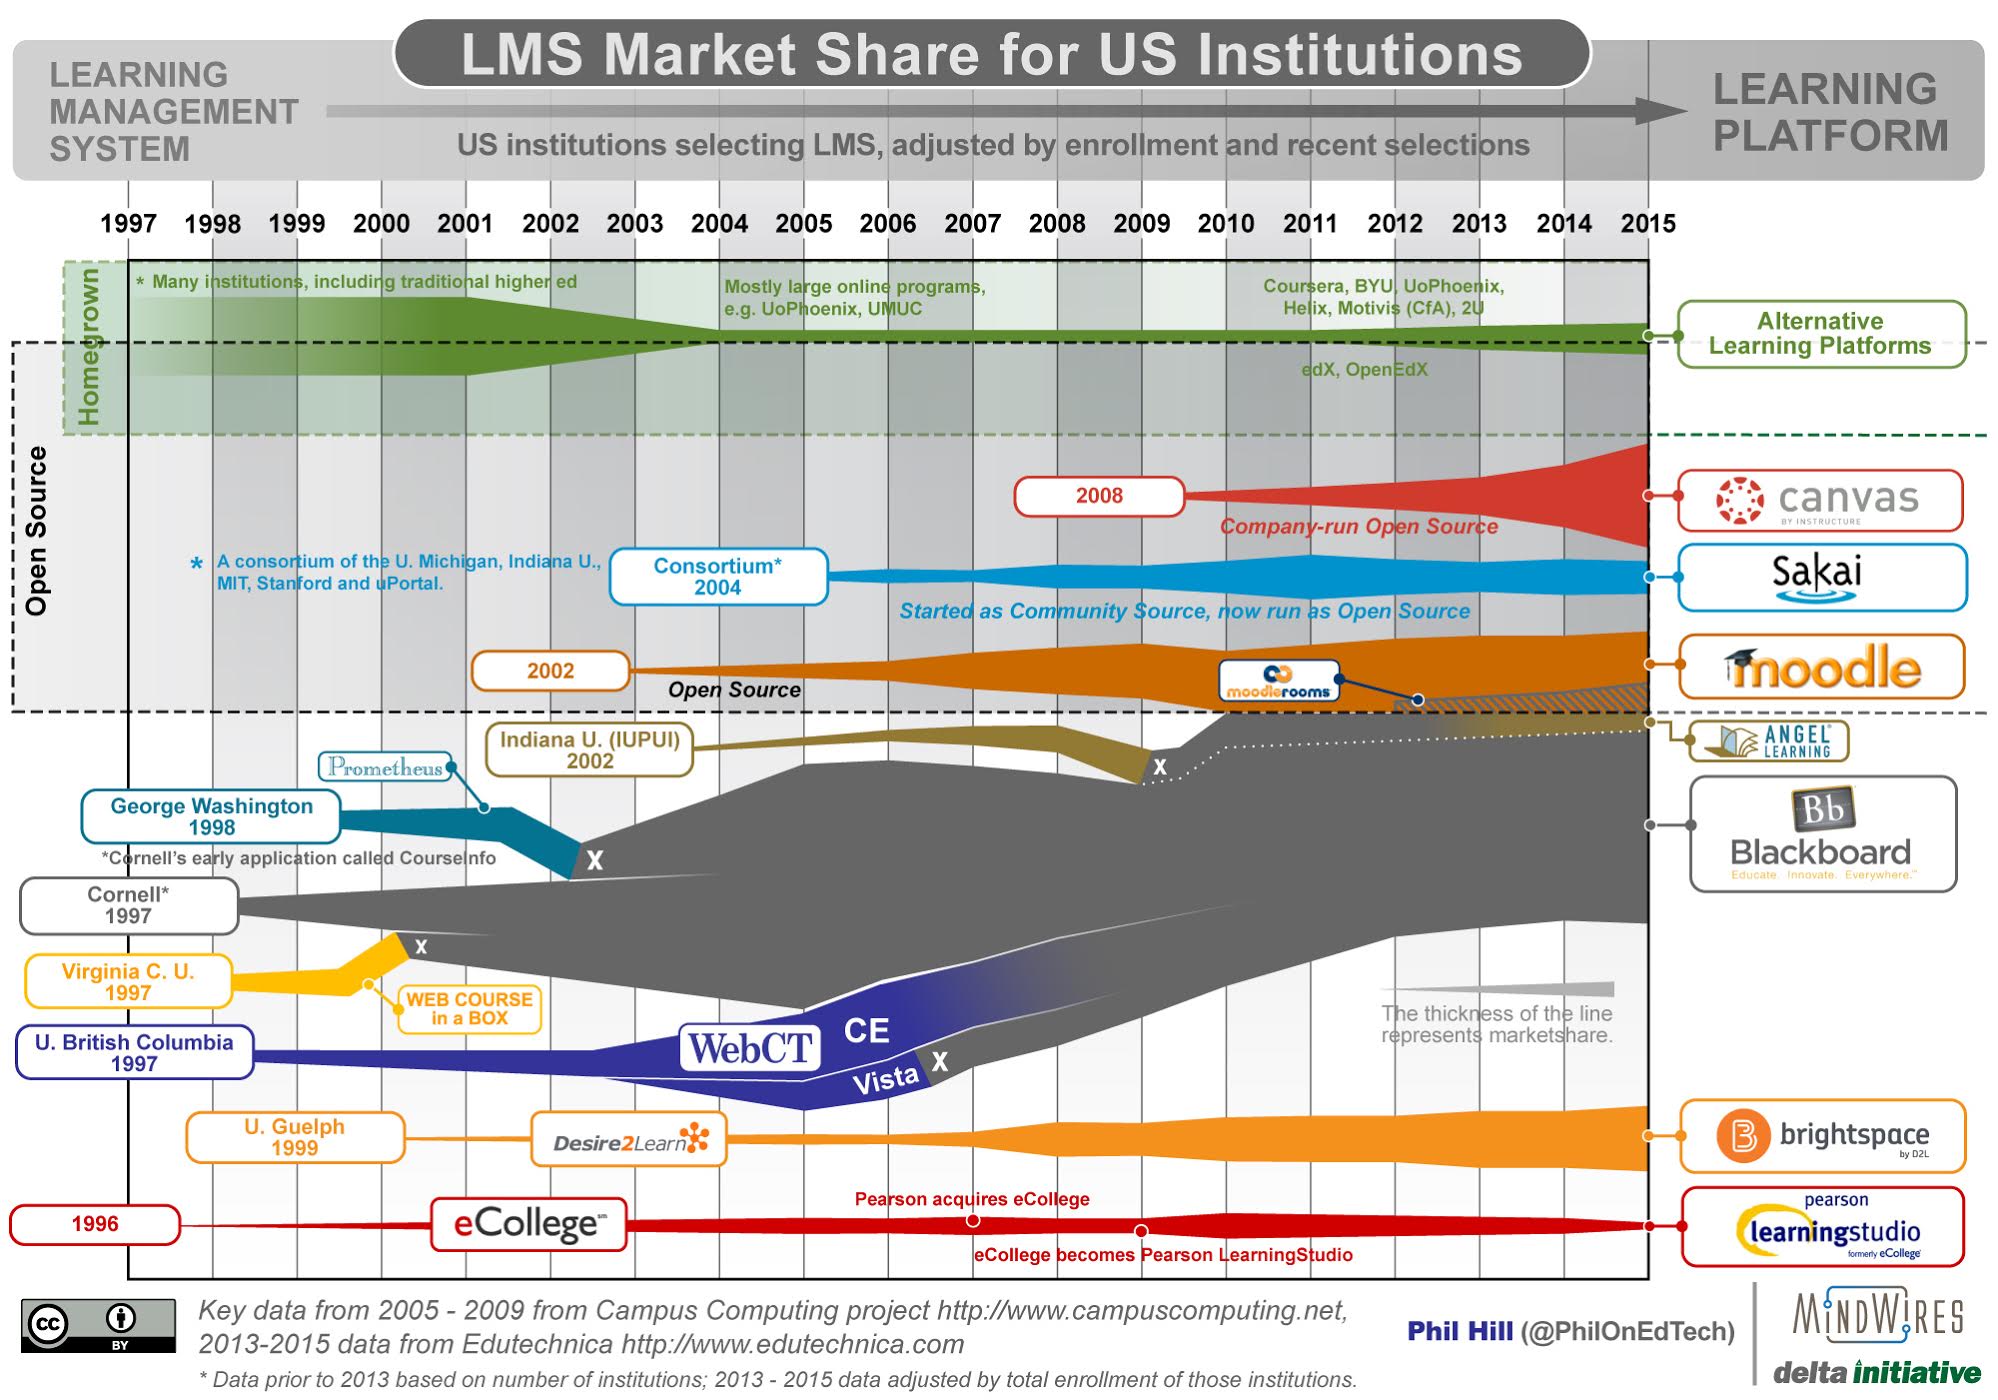
    I shared the most recent graphic summarizing the LMS market in October 2014, and thanks to revised data sources it’s time for an update. As with all previous versions, the 2005 – 2009 data points are based on the Campus Computing Project, and therefore is based on US adoption from non-profit institutions. This set of longitudinal data provides an anchor for the summary.

    The primary data source for 2013 – 2015 is Edutechnica, which not only does a more direct measurement of a larger number of schools (viewing all schools in IPEDS database with more than 700 FTE enrollments), but it also allows scaling based on enrollment per institution. This means that the latter years now more accurately represent how many students use a particular LMS. This post at Edutechnica provides the most recent data for Fall 2015.

    A few items to note:

    • The most important recent feature of the market – the rapid rise of Canvas, surpassing D2L and quickly closing in on Moodle – is quite visible now.
    • Blackboard Learn appears to have stopped its well-documented losses in US higher ed and has even risen in the past year. Its market share is far smaller than at its 2009 peak, but the company is no longer losing large numbers of clients each year.
    • D2L, Sakai, and Moodle have risen ever so slightly, but in effect have hit a plateau.
    • ANGEL and eCollege have lost market share.
    • There is a growing area of “Alternative Learning Platforms” that includes OpenEdX, 2U, Helix and Motivis (the newly commercialized learning platform from College for America).
    • While the data is more solid than 2012 and prior years, keep in mind that you should treat the graphic as telling a story of the market rather than being a chart of exact data.
    • Update (10/16): Removed “Curtin University as origin of Moodle based on Martin’s comments. Mea culpa – should have caught this earlier.
    • Update (10/23): Changed graphic title to refer to US and not North America.

    LMS_MarketShare_20151023

  • Yes, I did say that Knewton is “selling snake oil”

    My comments in today’s NPR article about Knewton are getting some attention on Twitter. One comment in particular, actually. The one where I accused Knewton CEO Jose Ferriera of selling snake oil. To understand the basis of the comment, you have only to look at the quote from Jose earlier in that selfsame article:

    We think of it like a robot tutor in the sky that can semi-read your mind and figure out what your strengths and weaknesses are, down to the percentile.

    Can it read what I’m thinking now?

    And then there’s this:

    We can take the combined data power of millions of students — all the people who are just like you — [who] had to learn a particular concept before, that you have to learn today — to find the best pieces of content, proven most effective for people just like you, and give that to you every single time.

    Really? Every single time?

    Objectively speaking, I don’t know much about Knewton’s platform or the value that it adds. The only efficacy studies I have seen are for Pearson products, and those studies do not differentiate between Knewton features and Pearson-native features in terms of impact. If you dig deep enough on their site, you can find some information on the techniques that they use. For example, this overview paper, while not perfect, is a credible attempt to explain the techniques that the platform employs and the benefits to the users in layperson’s terms. If Knewton were doing more of this, I wouldn’t be as critical. There are still questions about the value of the product, but they are on the same level with many other products in the adaptive learning category. A company like Knewton should be working hard to demystify what their product does and providing hard, reproducible evidence that they add value.

    But much of what Jose says, at least to the media, is the opposite. No responsible educator or parent should adopt a product—even if it is free—from a company whose CEO describes it as a “robot tutor in the sky that can semi-read your mind” and give you content “proven most effective for people like you every single time.” I’m sorry, but this sort of quasi-mystical garbage debases the very notion of education and harms Knewton’s brand in the process.

    If you want to sell me a product that helps students to learn, then don’t insult my intelligence. Explain what the damned thing does in clear, concrete, and straightforward language, with real-world examples when possible. I may not be a data scientist, but I’m not an idiot either. If you can translate the technical mumbo jumbo into sensible teaching insights for me, then you just might make a sale. But most people wouldn’t buy a used car from somebody who describes their product using language as hyperbolic as “robot tutors in the sky.” The same principle should hold for educational technology.

  • Instructure Files for IPO

    This doesn’t exactly come as a shock, but Instructure has filed for an IPO, and is expecting a post-IPO valuation of somewhere between $500 million and $800 million. Whenever a private company does this, they have to file a form called an S-1 with the SEC, which contains all kinds of financial and strategic information. You can find Instructure’s here.

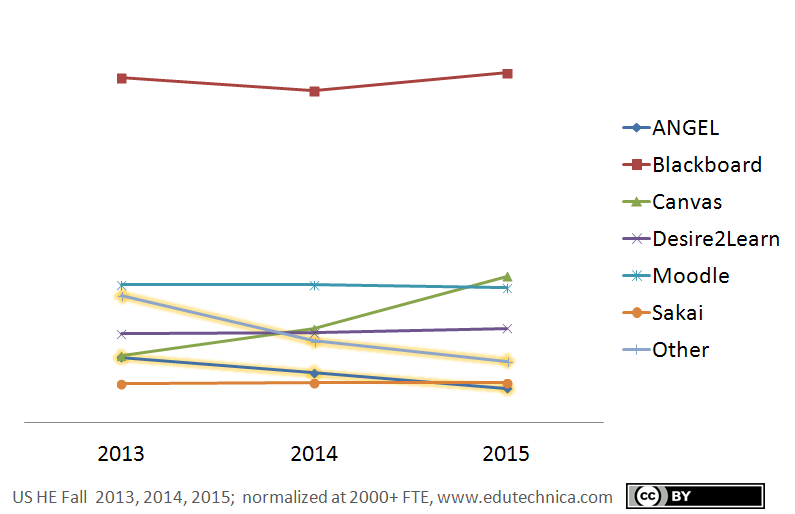
    Also not a big surprise, but the numbers in the report show big growth. Subscription revenue rose 72% from 2013 to 2014. Coincidentally, Edutechinica just published its 3rd annual LMS Data Update. As you can see, Canvas went through the roof in US higher ed while the other major LMS players were either flat or close to it:
    But in order to achieve that growth, they have been running at a loss. The problem seems to be in high expenses rather than low revenues, which suggests that the losses are coming from the company bulking up rather than from them undercutting the competition on price. Also, most of those revenues still come from the US. Instructure has offices in London, Hong Kong, and Sydney. That’s not a huge international presence. And as it happens, Eductechnica has data for the UK and Australia:
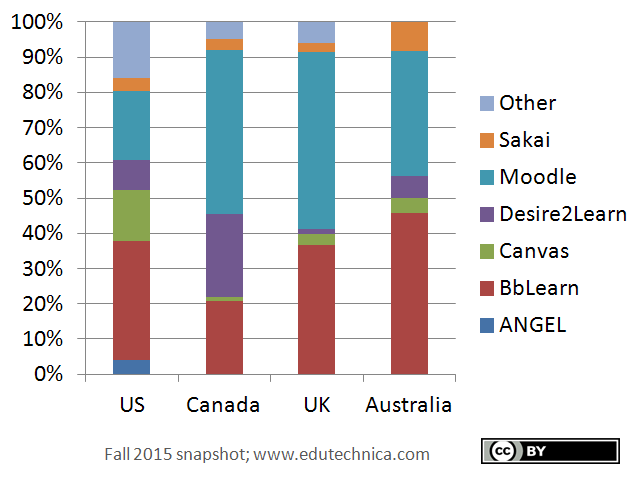
    You can see that Instructure has not made a major dent yet in either country. (You can also see that their biggest competitor by far in those two countries is Blackboard, particularly when you consider that Blackboard now owns major Moodle hosting operations in both countries.)

    One last bit that jumped out at me after a quick scan of the S-1 wasn’t financial. Their characterization of analytics was interesting. Throughout the document, they try to make the case that high user engagement and utilization lead to better learning analytics. For example,

    Strong User Engagement Leads to Robust Data Analytics

    Given today’s focus on accountability and performance, both academic institutions and companies are striving to improve learning outcomes. To do so, an organization must first understand the variables that impact results, such as attendance metrics, user engagement, and the efficacy of various learning content and technologies for individual learners. A learning management system has the potential to provide significant insight to educators and administrators on their students’ and employees’ progress toward meeting learning objectives and the factors impacting performance. In addition, such learning management systems can facilitate insightful benchmarking to allow organizations to explore other drivers of learning outcomes.

    Strong user engagement with learning management systems is critical to maximize the potential of data analytics. High utilization enables the learning management system to capture more data, and leads to more insightful analyses on user behavior, quality of individual courses and effectiveness of digital content. Better analytics enables instructors and administrators to make more informed decisions about instruction and materials that in turn drive improved learning outcomes and performance for individuals and companies. This virtuous cycle among user engagement, data analytics and learning outcomes represents the evolution of learning technology. We believe that the market increasingly is demanding learning management software that delivers both robust analytics and strong user engagement.

    They later go on to say,

    Over eight million instructors, students and employees have used our software over the 12 months ended June 30, 2015. According to self-reported data in an ECAR 2014 survey, 58% of faculty in higher education use a learning management system to share content with students, while our internal analysis of higher education institutions using Canvas shows that 71% of faculty use Canvas to share content with students.

    But their claim in terms of what they actually have for data analytics is fairly weak:

    Our platform provides users with open API access to data analytics. We deliver the analytics in an easy to understand and consumable way, that is optimized for independent analysis. This open visibility allows learners to view their own progress in real-time, educators to adjust programs and personalize curricula for maximum effectiveness and organizations to benchmark user data internally and respond to patterns observed.

    They are not arguing that they have good analytics, but rather that the high utilization of the software plus open APIs will enable customers to build good analytics themselves.

  • Cracks In The Foundation Of Disruptive Innovation

    The overuse of Clayton Christensen’s disruptive innovation theory has rightly been criticized in education circles for years. I say rightly in that judging a non-commodity public good with the same theory as disk drives is a silly notion without some extensive analysis to back up that extrapolation. As Audrey Watters wrote in 2013:

    Rather, my assigning “myth” to “disruptive innovation” is meant to highlight the ways in which this narrative has been widely accepted as unassailably true. No doubt (as a Harvard professor) Christensen has faced very little skepticism or criticism about his theory about the transformation of industries— why, it’s as if The Innovator’s Dilemma were some sort of sacred text.
    Helping to enhance its mythic status, the storytelling around “disruptive innovation” has taken on another, broader and looser dimension as well, as the term is now frequently invoked in many quarters to mean things quite different from Christensen’s original arguments in The Innovator’s Dilemma.

    Referring back to Audrey’s posts, Jim Groom and Brian Lamb made efforts to “reclaim innovation” in 2014:

    To understand much of the disconnect between higher education and innovation, we should take a look at innovation’s unruly cousin: disruption. Certainly, when surveying the rapid pace of change in digital and networked technologies and assessing the wreckage of organizations and industries that have, in one way or another, been swept aside, disruption as a descriptive term is not without merit. But unless we are prepared to rebuild from the wreckage and create something that represents a meaningful advance, it’s difficult to see the value in disruption for its own sake. (more…)