This doesn’t exactly come as a shock, but Instructure has filed for an IPO, and is expecting a post-IPO valuation of somewhere between $500 million and $800 million. Whenever a private company does this, they have to file a form called an S-1 with the SEC, which contains all kinds of financial and strategic information. You can find Instructure’s here.
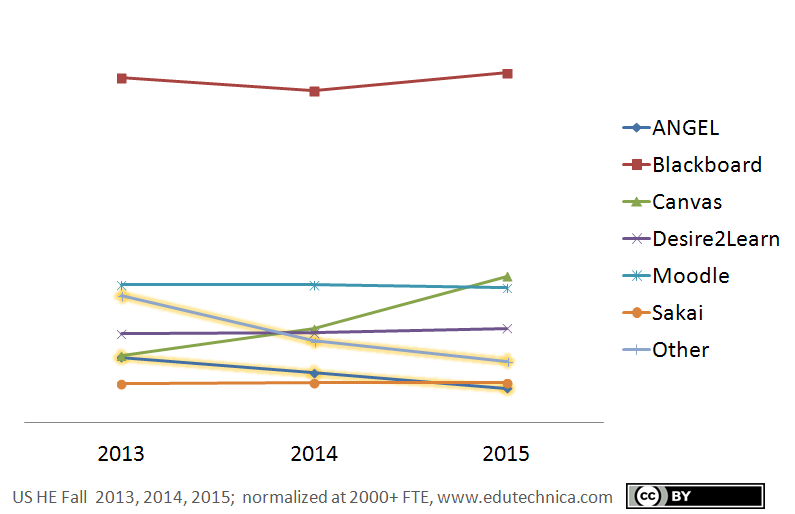
Also not a big surprise, but the numbers in the report show big growth. Subscription revenue rose 72% from 2013 to 2014. Coincidentally, Edutechinica just published its 3rd annual LMS Data Update. As you can see, Canvas went through the roof in US higher ed while the other major LMS players were either flat or close to it:

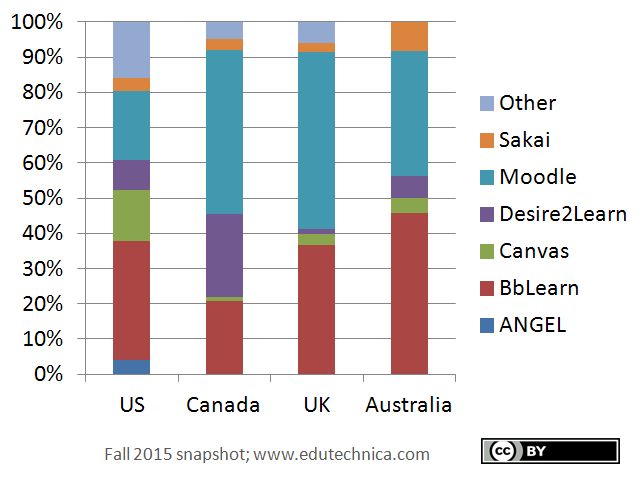
But in order to achieve that growth, they have been running at a loss. The problem seems to be in high expenses rather than low revenues, which suggests that the losses are coming from the company bulking up rather than from them undercutting the competition on price. Also, most of those revenues still come from the US. Instructure has offices in London, Hong Kong, and Sydney. That’s not a huge international presence. And as it happens, Eductechnica has data for the UK and Australia:

You can see that Instructure has not made a major dent yet in either country. (You can also see that their biggest competitor by far in those two countries is Blackboard, particularly when you consider that Blackboard now owns major Moodle hosting operations in both countries.)
One last bit that jumped out at me after a quick scan of the S-1 wasn’t financial. Their characterization of analytics was interesting. Throughout the document, they try to make the case that high user engagement and utilization lead to better learning analytics. For example,
Strong User Engagement Leads to Robust Data Analytics
Given today’s focus on accountability and performance, both academic institutions and companies are striving to improve learning outcomes. To do so, an organization must first understand the variables that impact results, such as attendance metrics, user engagement, and the efficacy of various learning content and technologies for individual learners. A learning management system has the potential to provide significant insight to educators and administrators on their students’ and employees’ progress toward meeting learning objectives and the factors impacting performance. In addition, such learning management systems can facilitate insightful benchmarking to allow organizations to explore other drivers of learning outcomes.
Strong user engagement with learning management systems is critical to maximize the potential of data analytics. High utilization enables the learning management system to capture more data, and leads to more insightful analyses on user behavior, quality of individual courses and effectiveness of digital content. Better analytics enables instructors and administrators to make more informed decisions about instruction and materials that in turn drive improved learning outcomes and performance for individuals and companies. This virtuous cycle among user engagement, data analytics and learning outcomes represents the evolution of learning technology. We believe that the market increasingly is demanding learning management software that delivers both robust analytics and strong user engagement.
They later go on to say,
Over eight million instructors, students and employees have used our software over the 12 months ended June 30, 2015. According to self-reported data in an ECAR 2014 survey, 58% of faculty in higher education use a learning management system to share content with students, while our internal analysis of higher education institutions using Canvas shows that 71% of faculty use Canvas to share content with students.
But their claim in terms of what they actually have for data analytics is fairly weak:
Our platform provides users with open API access to data analytics. We deliver the analytics in an easy to understand and consumable way, that is optimized for independent analysis. This open visibility allows learners to view their own progress in real-time, educators to adjust programs and personalize curricula for maximum effectiveness and organizations to benchmark user data internally and respond to patterns observed.
They are not arguing that they have good analytics, but rather that the high utilization of the software plus open APIs will enable customers to build good analytics themselves.