e-Literate

Present is Prologue

Tag: Brightspace

  • Academic LMS Market Share By Enrollments, Part Deux

    Academic LMS Market Share By Enrollments, Part Deux

    Based on our recent publication of market share data and graphics, we have had multiple requests to share similar data by enrollment. In Friday’s post I shared a non-traditional view of the LMS market based on the percentage of institutions within small, medium, and large enrollment bands for North America (US and Canada) and Europe. This view gave some interesting insights, particularly with large positive correlation (Canvas) and negative correlation (Moodle)  between enrollment bands and market share in North America. Meanwhile, there were other LMS solutions (D2L and Sakai in particular) that have fairly consistent distribution in market share.

    For this second view, instead of showing percentage of institutions within each enrollment band, the data is aggregated for all North American institutions and scaled by each institution’s official enrollment data (e.g. the US data is from IPEDS). The net result shows the percentage of enrollments across the region that have different LMS solutions as their primary system at their school. As always, the underlying data for these market share studies is provided by our partner LISTedTECH.

    Some Notes:

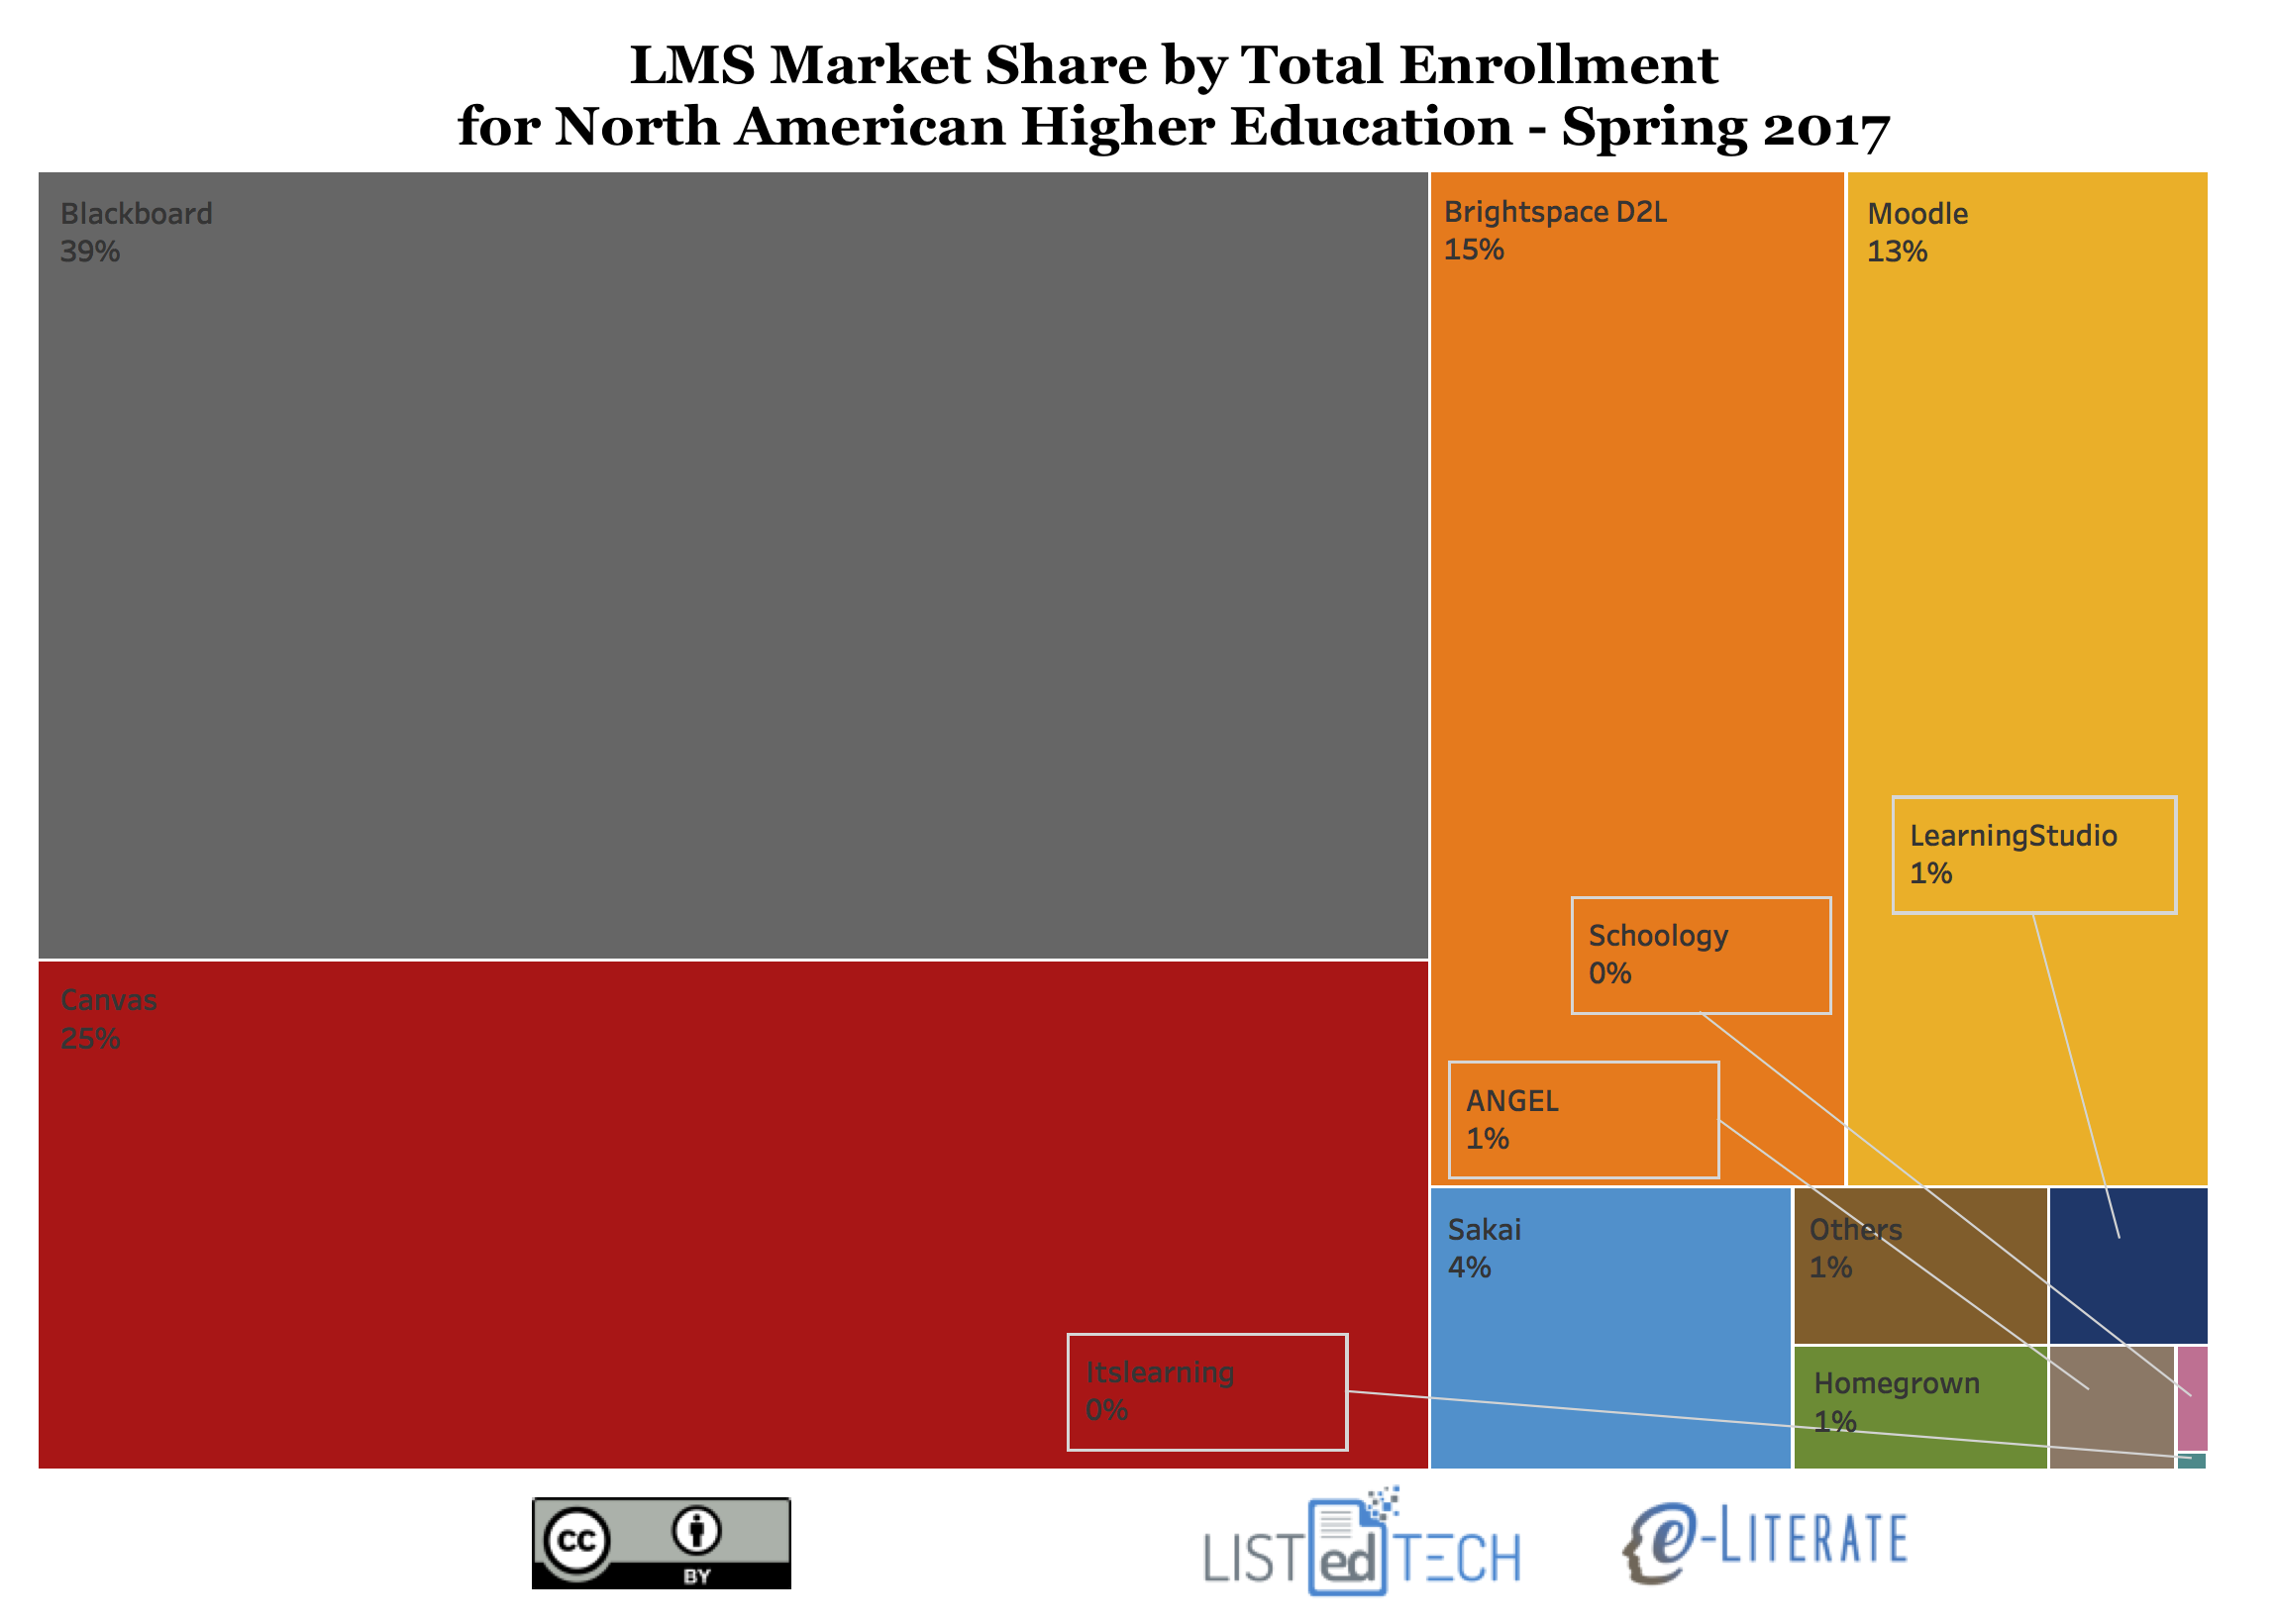
    • For North American Higher Education, Blackboard Learn at 39% is still in first place, Canvas is second at 25%, D2L Brightspace is third at 15%, Moodle is fourth at 13%, and Sakai is fifth at 4%.
    • It has been widely reported when just looking at percentages of institutions that Moodle has long been the second most-used system in North America, but in this view both Canvas and D2L Brightspace have a larger market share.

    It is useful to look at different views using institutional and enrollment metrics to get a deeper understanding of the academic LMS market dynamics.

  • Academic LMS Market Share By Enrollments, Part I

    Since the earliest days of Campus Computing and EDUCAUSE measurement of LMS market data up through recent analysis by Edutechnica and LISTedTECH (the latter our partners for the LMS market analysis service and data behind our LMS graphics), the most common measurement used has been “number of institutions adopting system X as their primary LMS”. But that is only one view, and like any view it has limitations. Sweet Briar College with 900 students is treated with the same metric as Ohio State University with 55,000. I’m sorry, The Ohio State University.

    Based on our recent publication of market share data and graphics, we have had multiple requests to share similar data by enrollment. Both Edutechnica and LISTedTECH have provided such views here and there in the past, but given our recent analysis expansion along with LISTedTECH to cover non-North American regions, we thought it would be worth sharing LMS market data based on enrollments.

    What we cannot do is look at how many students actually use the LMS. But for North America (US and Canada in this case) and Europe, we have sufficient coverage of official enrollment figures that we can scale each institution by its enrollment data. This is how most LMS companies determine their prices for each school, so it is a much better measurement to correlate with market revenues. Not a perfect measure, but a better one.

    In addition, this view gives additional insights into the market and likely future direction of the LMS providers.

    Hey Phil, will you just get to the damn graphics? Let us judge the importance.

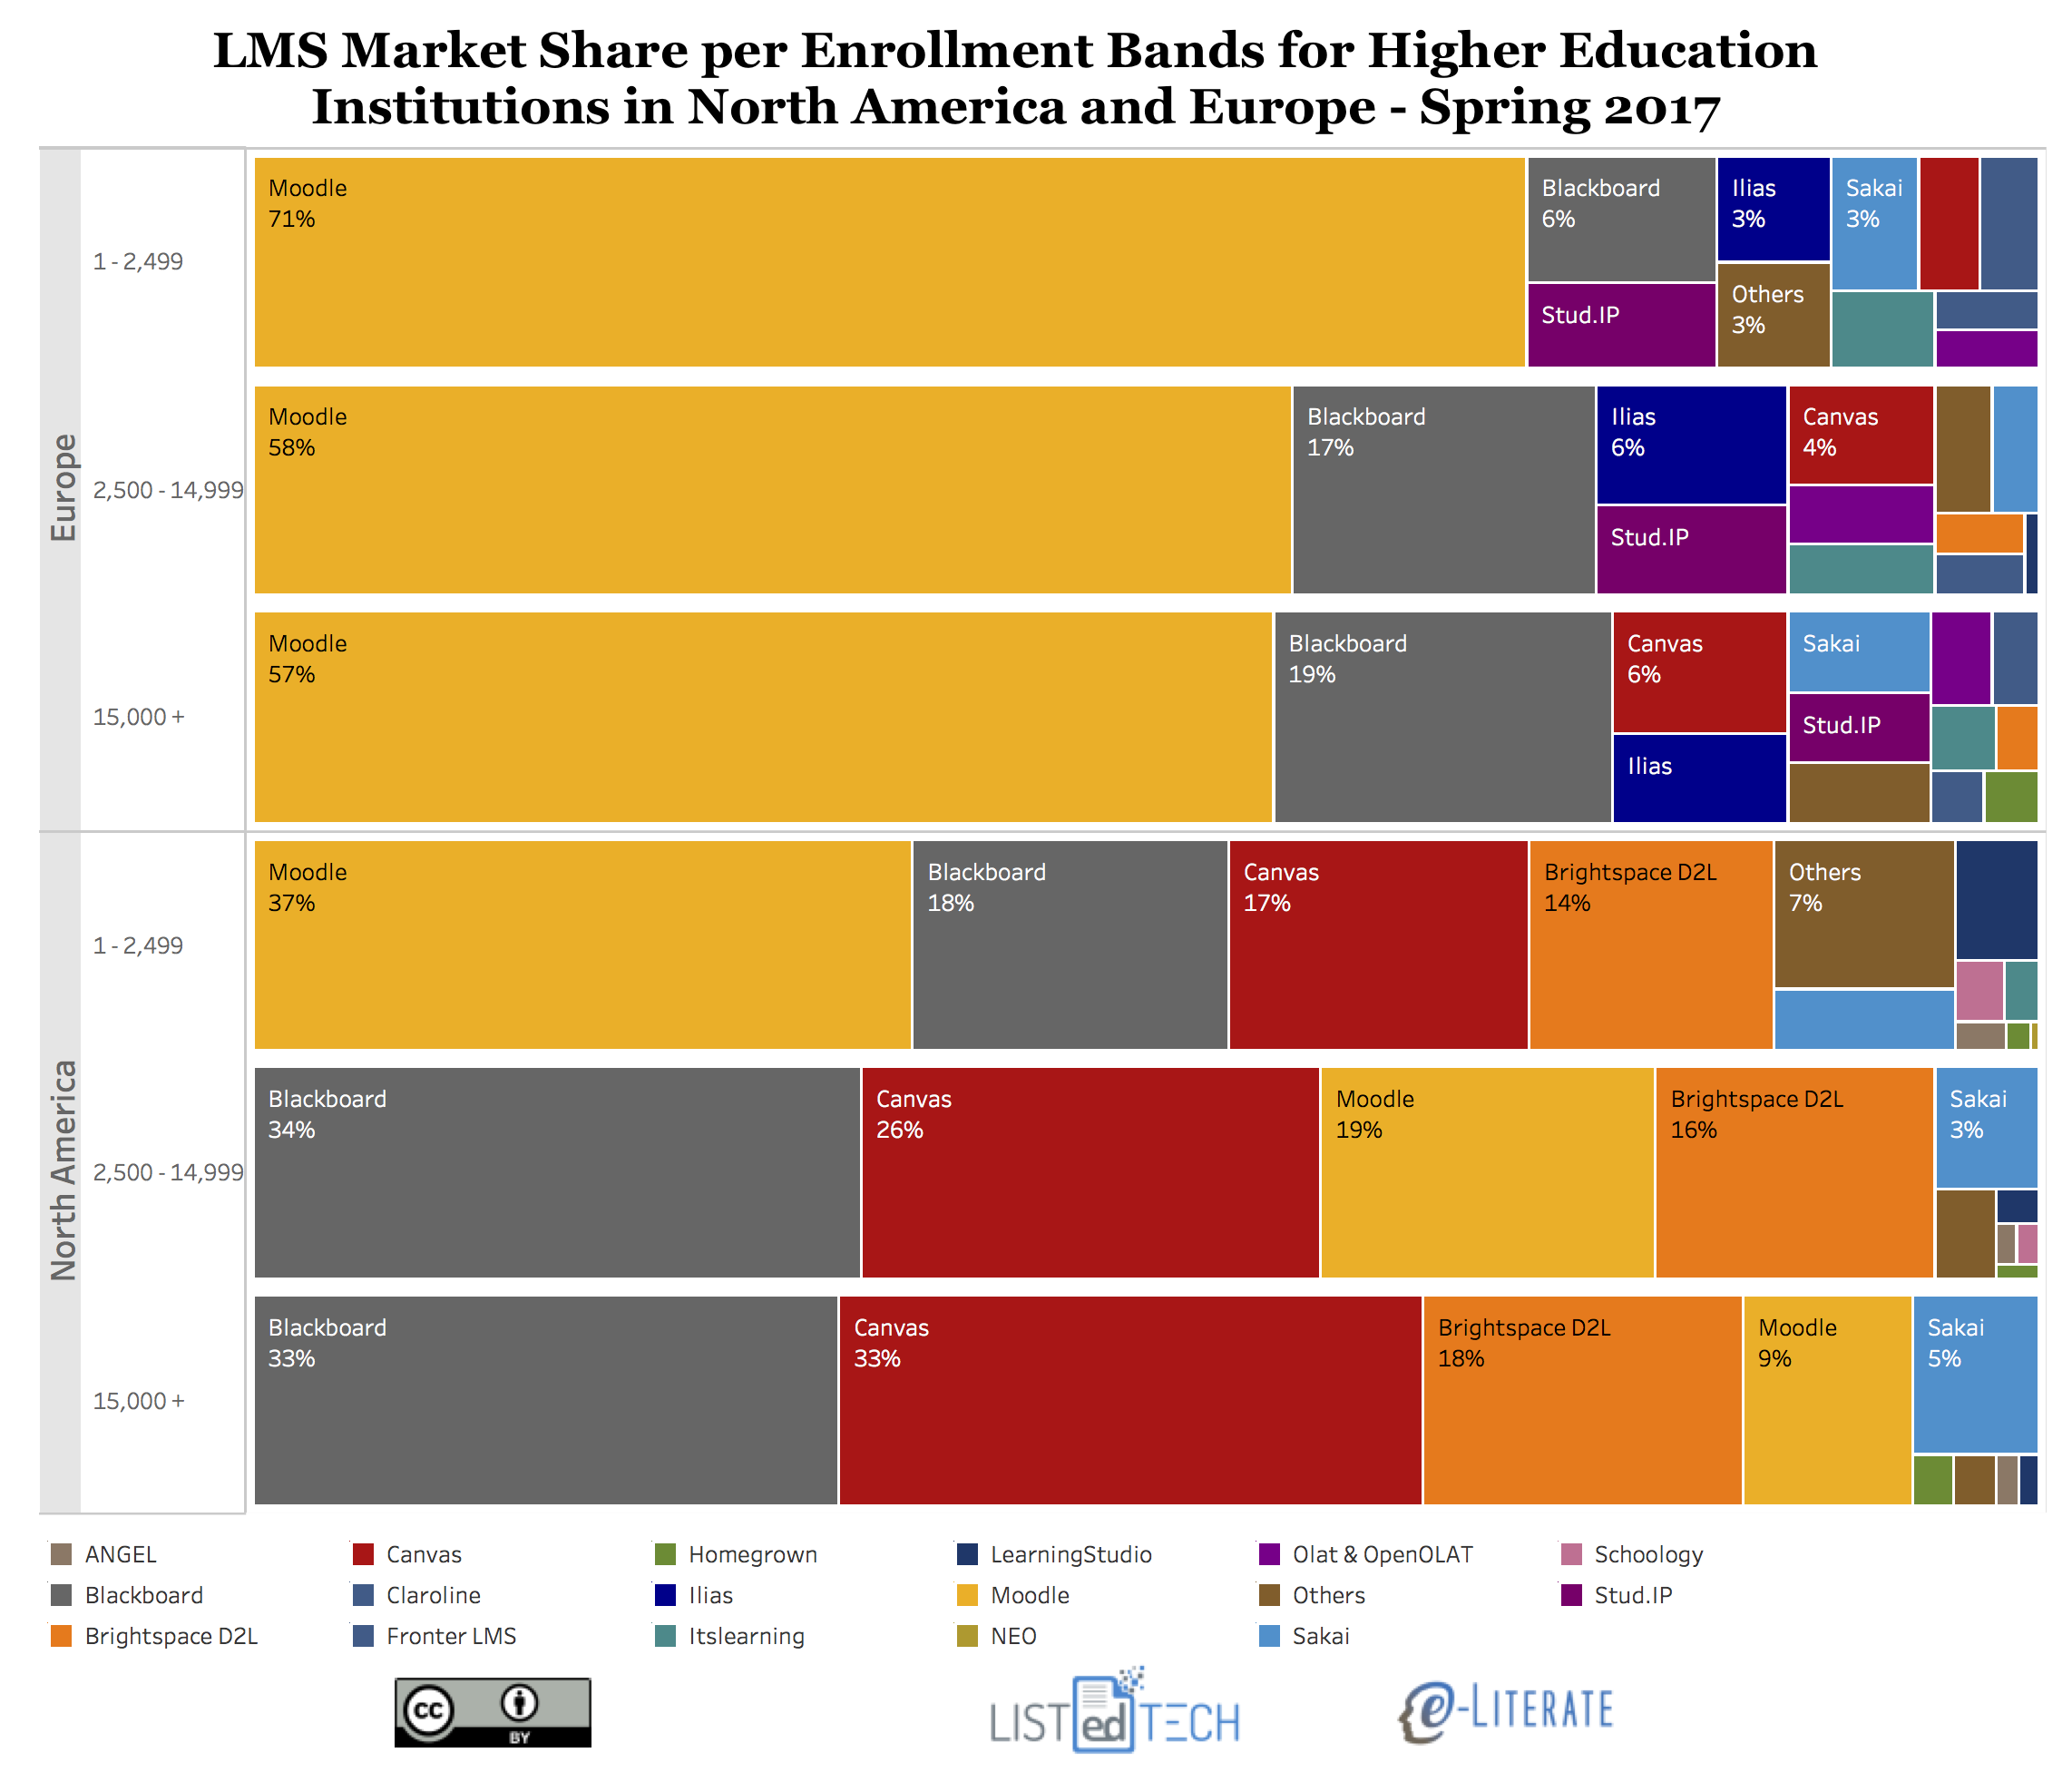
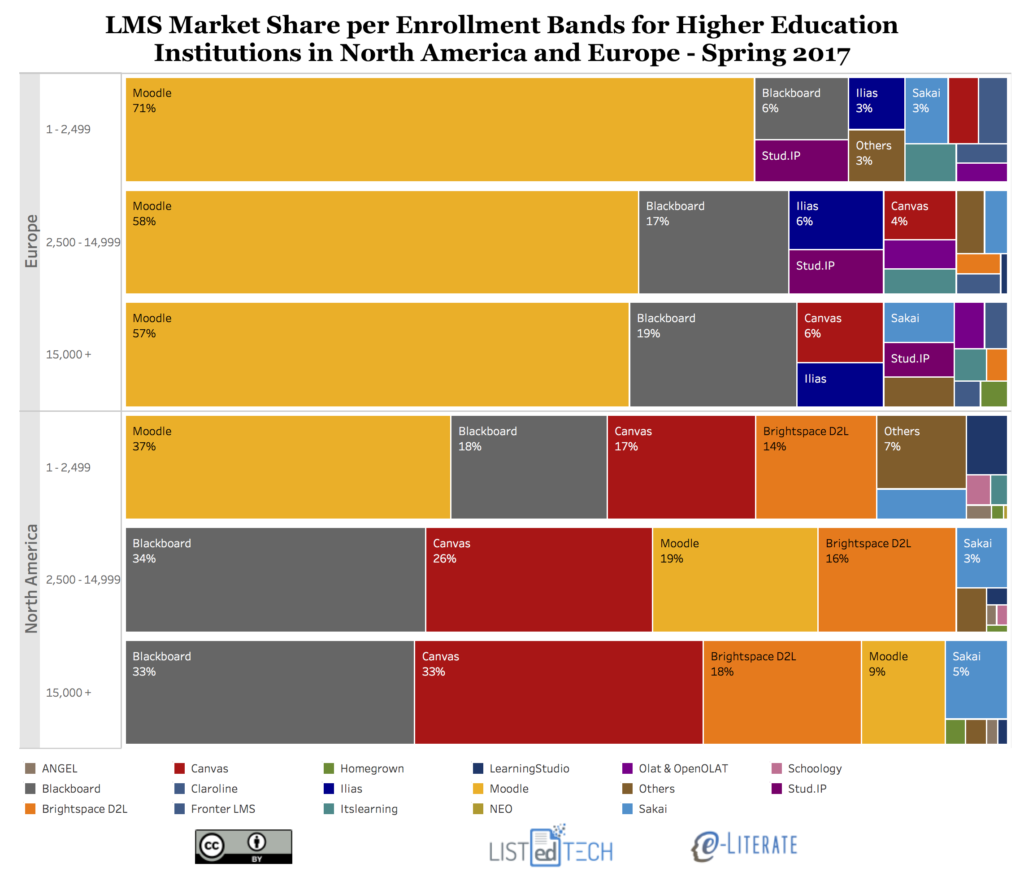
    OK, OK – for our first view, we group all institutions into separate bands of total enrollment and show market share for each band for each region (North America and Europe). Percentage of institutions adopting each LMS within each enrollment band of Small (1 – 2,499), Medium (2,500 – 14,999) and Large (15,000+) enrollments. Update: Clarified language.
    Some Notes:

    • The LMS with the greatest enrollment variation is Moodle, particularly in North America. For small schools below 2,500 students, Moodle is #1 at 37%, but for medium schools it’s #3 at 19% and for large it’s #4 at 9%. A huge difference. In Europe, Moodle market share also inversely correlates with enrollment but to a far smaller degree (71%, 58%, 57%) and it is still #1 in all bands.
    • Blackboard Learn and Canvas vary in North America the opposite direction – larger enrollment sizes equals larger market share – but not quite as dramatically as Moodle’s inverse relationship. Blackboard is #1 with roughly 33% market share for both large and medium institutions but is #2 with 18% for small institutions. Canvas goes from 33% for large to 26% for medium to 17% for small institutions. And note that Canvas and Blackboard Learn are virtually tied for first place for large institutions in North America.
    • D2L Brightspace has the most even distribution, with 18% of large, 16% of medium, and 14% of small institutions. That’s interesting.
    • In Europe, the overall distributions are more consistent with less variation between enrollment bands. While Moodle has smaller market share for larger enrollment bands, the general shape of the market does not change that much – just scaled a bit and with minor variations.
    • In what might be a surprise given its roots in larger research universities, Sakai (like D2L) has a fairly even distribution and similar market share across small, medium and large institutional bands.

    Coming soon – combining data not in enrollment bands but as scaled by each institution’s enrollment numbers.

    Update: See second post here.

  • Academic LMS Market Share: A view across four global regions

    Academic LMS Market Share: A view across four global regions

    In much of our coverage of the LMS market as well as media stories, there is a natural tendency to focus on change. Institution x abandons LMS y and adopts LMS z. In our recent post on Moodle, I described the trajectory of Moodle, noting that “the data seem to indicate a collapse of Moodle selections in the US and Canada, and potentially a significant slow-down in other regions”.

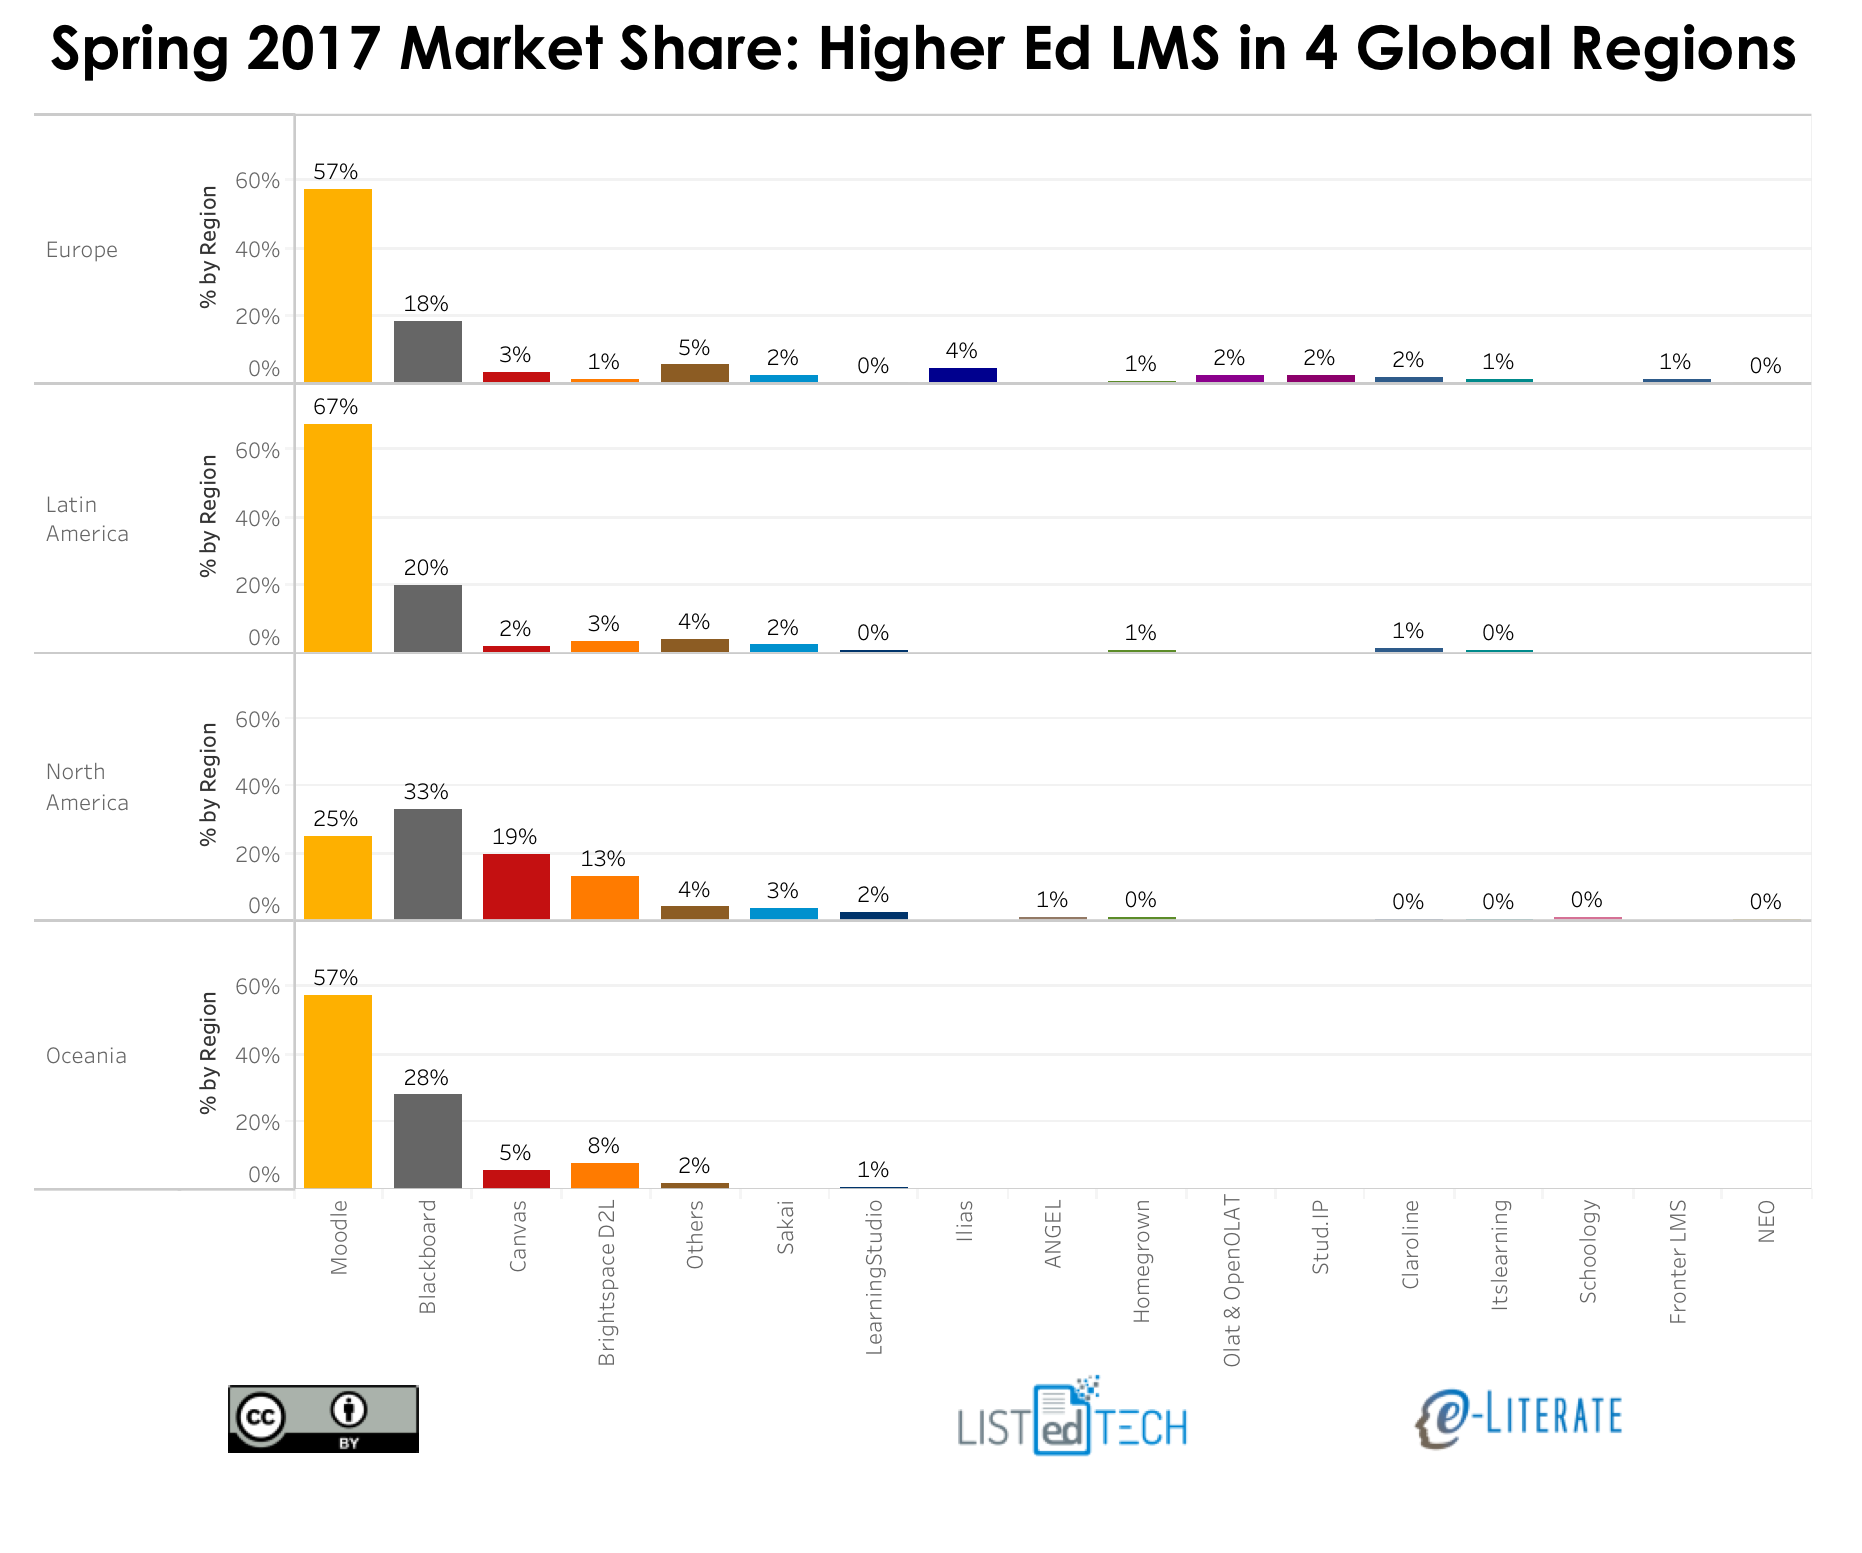
    But we need to be careful to not lose perspective and miss the installed base of LMS customers. While there has market share information for US higher ed available for years, we can now share the broadest description of LMS market share in higher education. The view below, originally shared with subscribers to our LMS market analysis service, shows market share as the percentage of primary systems at degree-granting institutions for each of four global regions: North America (US and Canada), Europe, Latin America, and Oceania (Australia, New Zealand and surrounding island countries).

    (more…)

  • Whither Moodle?

    Whither Moodle?

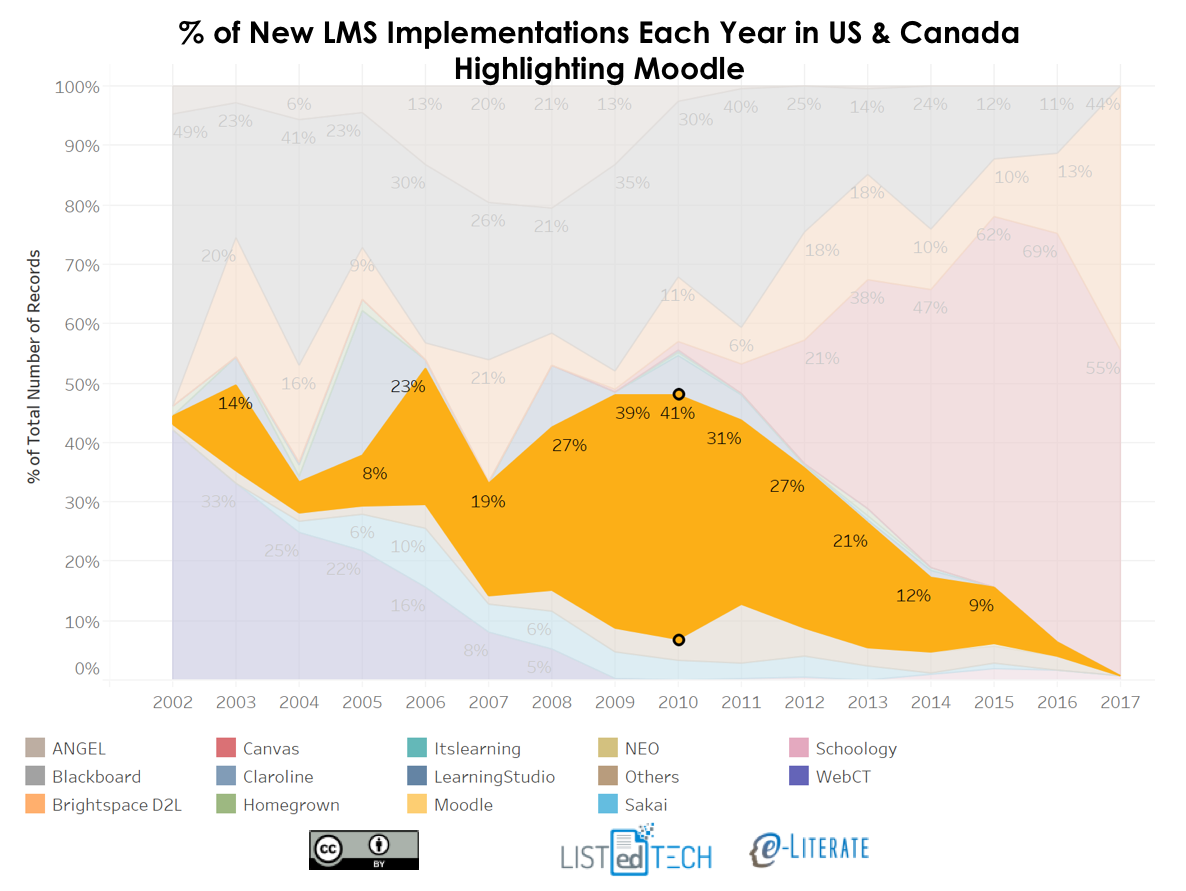
    On e-Literate and even more so with our LMS market analysis service, we have called out many times the broad dominance of Moodle in terms of active installations worldwide. In every region outside of North America (US and Canada), Moodle has largest market share by far, and it is second place in North America.

    But the trajectory of Moodle new implementations (higher education degree-granting institutions moving from another LMS to Moodle as the primary LMS) is striking, especially in the US and Canada as seen below, with Moodle highlighted (all data is from our partner LISTedTECH). (Update: Image link fixed – wasn’t showing in some areas)

    (more…)

  • State of Higher Ed LMS Market for US and Canada: Spring 2017 Edition

    State of Higher Ed LMS Market for US and Canada: Spring 2017 Edition

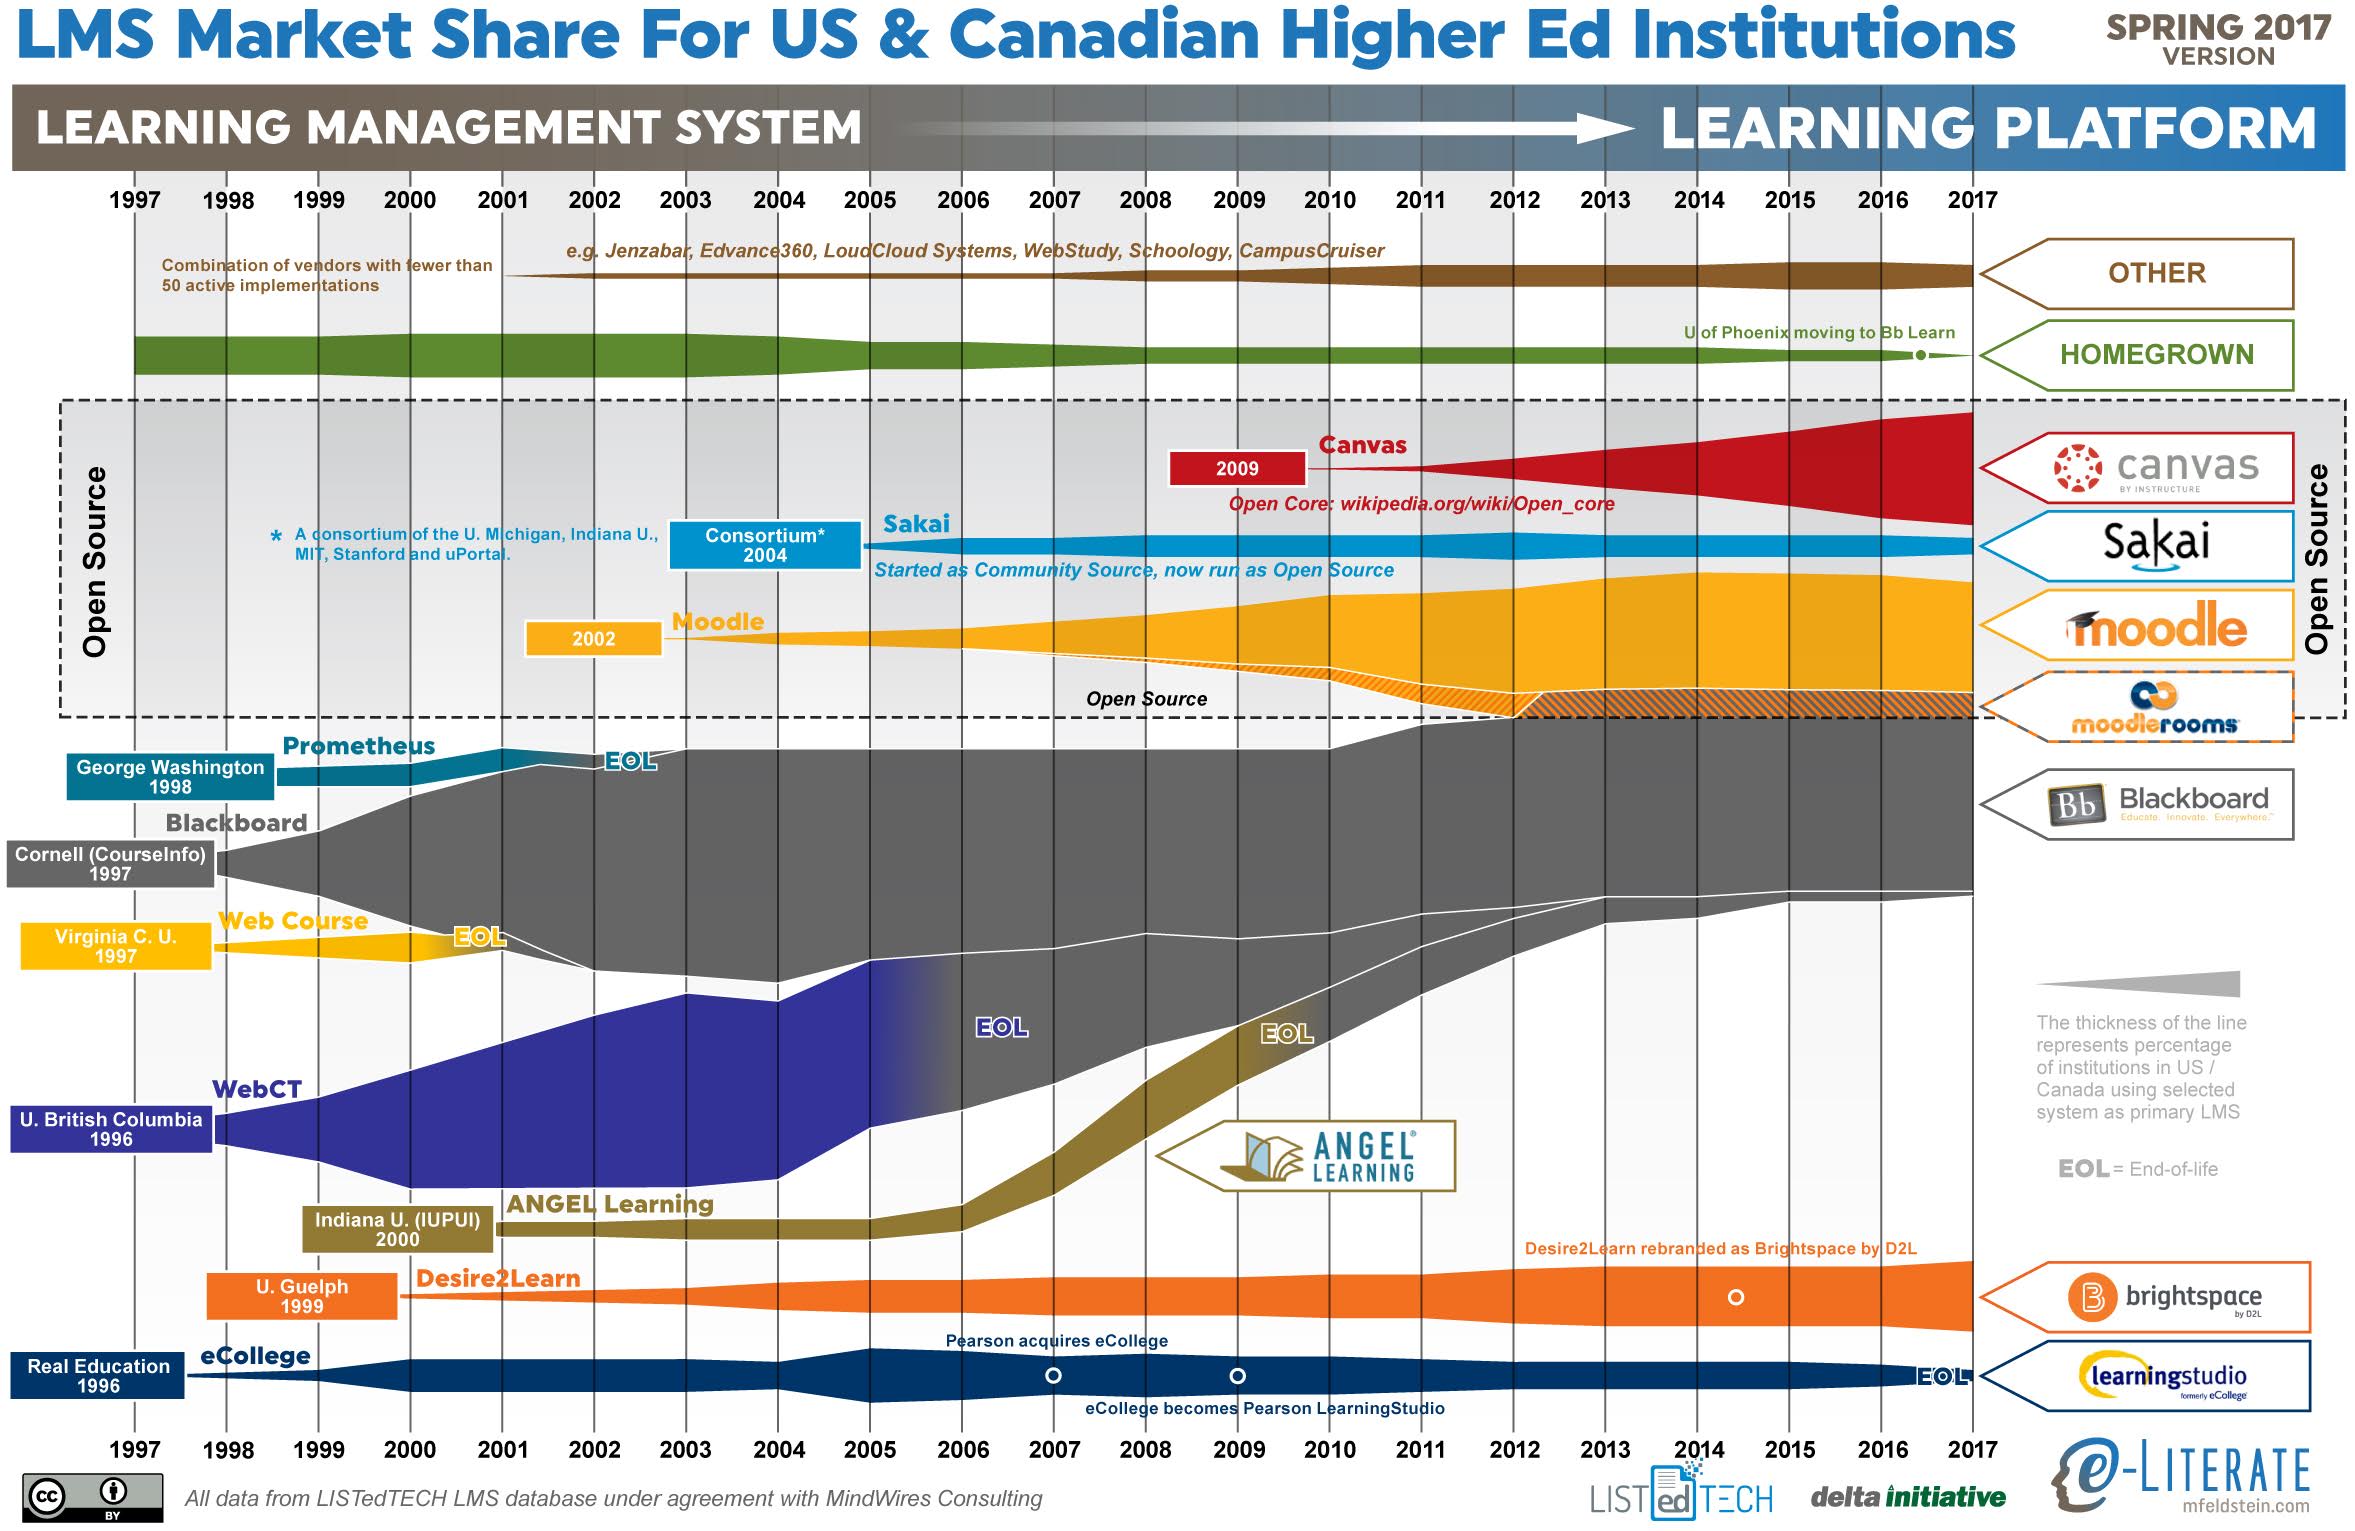
    This is the ninth year I have shared the LMS market share graphic, commonly known as the squid graphic, for US and Canadian higher education. The original idea remains – to give a picture of the LMS market in one page, highlighting the story of the market over time. The key to the graphic is that the width of each band represents the percentage of institutions using a particular LMS as its primary system.

    Last year we made a big shift based on our LMS market analysis service – we are working with LISTedTECH to provide market data and visualizations. This data source provides historical and current measures of institutional adoptions, allowing new insights into how the market has worked and current trends. Our spring report for subscribers will be released this month. Data for 2017 goes through April 1 of this year.

    (more…)

  • Update: LMS Usage In Large Online Programs (Top 50 in US)

    By: Phil Hill and Justin Menard. Cross-posted at LISTedTECH

    Three and a half years ago Phil wrote a post “Snapshot of LMS Market for Large Online Programs in the US” giving a view into this growing segment of higher education.  Large online enrollment institutions typically mean a centrally-coordinated provision of online courses, often with duplicate course sections, and these programs tend to use more of the LMS than ad hoc online courses or blended courses. Further, these programs are dynamic – they are far more likely to grow significantly or shrink significantly than face-to-face or blended programs. As such, this segment can have different usage patterns than the broader market. Thanks to the partnership between e-Literate and LISTedTECH for our LMS subscription service, we have a much richer data set now. One of our subscribers asked a question over the weekend about this subject, so it seemed time to update this view.

    What we are showing below are the 50 institutions with the greatest number of students taking at least one online class based on the IPEDS database, for graduate and undergraduate combined. The most recent enrollment data set was for Fall 2014, so the enrollment data is slightly out of date. But the LMS listings should be up-to-date. In fact, we are showing some leading data, such as the University of Phoenix usage of Blackboard Learn and Kaplan University usage of D2L Brightspace – neither school has fully transitioned to the new LMS, but they have made official decisions and begun deployment. We have grouped the schools by sector, as well. (more…)

  • Quick Update On LMS Subscription Service

    Our LMS Subscription Service has been out for more than three months now, and we’d like to give a quick update(see this page for details, pricing, online signup; or sign up on right column of blog site for listserv to find out more information).

    The e–Literate Big Picture subscription services are designed to help you track the changing landscape in important educational technology topics and make sure that the decisions you make today will still make sense tomorrow.

    Based on our joint research with LISTedTECH and market analysis, we just published an article in TechCrunch titled “The LMS Market Glacier Is Melting”. (more…)