e-Literate

Present is Prologue

Tag: Google Classroom

  • Notes on EDUCAUSE 2018

    Notes on EDUCAUSE 2018

    I recently finished three weeks of travel to ed tech conferences – Online Learning in Toronto, WCET in Portland, and EDUCAUSE in Denver. Given the size of EDUCAUSE and its history of being the place to see the greatest number of vendors in one location, that conference is a good trigger to cover general ed tech market news.

    Official photo of EDUCAUSE exhibit hall from promotional tweet
    Source: https://twitter.com/educause/status/1034810456584740864

    EDUCAUSE By the Numbers

    John O’Brien, president and CEO of EDUCAUSE, described in his welcoming speech and in an interview how this was the largest conference yet for the organization, with more than 8,000 registered attendees including more than 3,000 first-timers. I asked O’Brien about the changing and more crowded environment for ed tech conferences – with WCET, ASU/GSV, Online Learning, various vendor conferences, SXSWedu, and others – and he indicated that more is better. In other words, EDUCAUSE does not see a need to change due to competition, as there is room for multiple conferences with different emphases.

    The direction that EDUCAUSE is going can be seen in O’Brien’s recent article “Strategic IT: What Got Us Here Won’t Get Us There”. In this view, technology is integrated, so the organization and conference must bring in decision-making from outside the IT organization.

    To fully realize the value of information technology as the strategic asset it is, we must embrace strategic IT. What got us here, a remarkable utility mindset, will no longer suffice. Instead, higher education leaders must consider the role and placement of information technology in the strategic fabric of their institutions.

    Based on interviews with O’Brien as well as multiple sponsoring vendors on the exhibit hall, these are the key numbers:

    • Total attendance of 8,018
    • Of these almost 5,900 opted to share registration info, implying that 2,100 opted out of sharing info (and I assume that the vast majority of the 2,100 are from higher ed schools)
    • Just over 3,000 were first-time attendees
    • Almost 2,700 were from vendors, both as sponsors / exhibitors and paying attendees to walk around; another 200 or so were from foundations, media, associations, and other organizations
    • Therefore 5,000 – 5,100 attendees were from institutions of higher ed, with more than 300 of those attendees from outside the US

    In 2017:

    • Total attendance of 8,000
    • More than 1,600 first-time attendees
    • More than 6,900 opted to share registration info

    There is somewhat of a disconnect, however, in that the exhibit hall certainly didn’t feel crowded or busy, at least compared to previous years. Most vendors I talked to described traffic at booths somewhat healthy but not at a peak for this conference. I also do not know why the registration list from last year had more 1,000 more than this year. I have asked EDUCAUSE for commentary or clarification on the attendance numbers; while their PR firm did respond to my email, I have not received any updates on the numbers other than saying “it cannot be assumed that the opt-outs were from higher education schools”.

    One other disconnect was noted by Josh Kim at Inside Higher Ed in his post about the EDUCAUSE Top Ten IT Issues list released at the conference.

    Curious About the Lack of Overlap with the ELI 2019 Key Issues in Teaching and Learning List:

    Perhaps the existence of the ELI Key Issues list exempts the EDUCAUSE mothership from putting teaching and learning related issues on its list. I still read the lack of teaching and learning issues as curious. How could it be that academic transformation is everywhere in the ELI community, and nowhere to be found in the IT list? Maybe the EDUCAUSE list should have one entry that says “see the ELI list.”

    I see the same issue where the EDUCAUSE “mothership” in many ways does not directly speak to teaching and learning issues, which is confusing given the direction the organization is taking. When I asked John O’Brien about this situation, he indicated that they have been increasing their emphasis on T&L issues at the leadership level. The answer is not that EDUCAUSE wants to point all T&L issues to ELI, but the integration is a work in progress, I suppose.

    Big Tech Companies

    Moving beyond the numbers, what struck me the most was the increasing presence of Big Tech at the conference. Amazon, Microsoft, Google, IBM were all there in force, with an increased focus on education as a vertical market. Only Apple was missing.

    The question, especially for Google, is how much they plan to fully jump into higher education as opposed to dabbling in the market with a ‘let’s see how this tech gets used’ approach of the past. I get conflicting messages in this regard, at least for Google. For example, I asked a sales lead in the booth about Google Classroom and whether they plan to push this into the higher ed LMS market. He answer was clear that Classroom belongs in the K-12 market, but in higher ed they have no need to try and displace Canvas, Blackboard, D2L, Moodle, et al. For higher ed, they plan to use Course Kit, their set of tools integration G Suite with the campus LMS, to incrementally get more exposure. When I talked to one well-known university CIO, however, he said that Google is responding to his push to fully jump in and even expand Classroom usage as an LMS alternative. Don’t treat this as a full description of the issues but rather one example of mixed messages.

    Microsoft and Amazon, however, are really expanding their higher ed solutions and market presence.

    In years past, EDUCAUSE exhibit hall was dominated by the ERP companies plus Blackboard and the publishers. In the ERP space, Oracle, Workday, Ellucian, and Jenzabar had large booths and aggressive marketing presence. Yes, I mention Jenzabar in that group, at least in terms of conference booth and marketing presence. Expect more on that story in the coming months.

    Moodle Presence

    For the first time, Moodle HQ had their own booth at the conference rather than solely relying on Moodle Partners for messaging. In fact there was a mini-Moodle alley at the left side of the hall, with eThink, Moodle HQ, and Moonami all together. This marketing move is significant after last year’s funding round of $6 million for Moodle HQ and this year’s news of Blackboard / Moodlerooms leaving the Moodle Partner program. I don’t know how far this new marketing spend will go in influencing LMS decision-making at colleges and universities, but it is significant that the world’s largest LMS is now spending money to raise awareness of what Moodle currently offers and what it can be.

    Additional Notes

    • If you ever wondered how many 20-somethings you could possibly fit in one large conference booth, I hope you visited Splunk to see the answer.
    • Cybersecurity – both in terms of protection / audit services as well as content for training and certificates – was another area with increased emphasis this year.
    • In a strange way, video is becoming a crowded market (again). Lecture capture, streaming, synchronous collaboration tools, etc. Where did this new market investment come from?
    • At the booth with the punching bag game, I should have invited 35-year-old Phil to be competitive with the eThink and Moodle guys. At least, I’ll pretend that this was the issue.

    Update 11/21: Clarified response status from EDUCAUSE at their request.

  • Preliminary Data on K-12 LMS Market

    Preliminary Data on K-12 LMS Market

    Over the past several months, we have worked with our partners at LISTedTECH as they ramp up their efforts to collect data on LMS usage in the K-12 market in the United States. This is a massive effort as the market includes more than 130,000 individual public and private schools, and more than 13,600 school districts, according to recent NCES documentation. We are aware of several private data sources with estimates on the K-12 LMS market, but there are no public sources.

    Part of the challenge is that the K-12 market is messier than higher education’s and its roughly 7,200 institutions. One reason is that the general IT infrastructure in K-12 is less mature than in higher ed, and for smaller schools there are a lot of ad hoc implementations running on a local server not even in a data center. Another reason is the availability of free options such as Google Classroom, or freemium options such as that offered by Schoology and Canvas for individual faculty.

    As we build up the data and improve our methods, we believe we are starting to see some interesting trends in the data worth sharing.

    Our initial sample looks at 6,875 public schools from across the country in the NCES-designated primary, middle, high and other (special ed, vocational or alternative) categories. These results were analyzed over several data collection methods along with manual evaluation of that data. That said, we expect to see movement in the numbers as we collect and verify additional data, including LMS usage at private schools.

    As in our analysis of the higher ed market, we are focusing on school-wide implementations of LMS platforms. At many K-12 schools, in the absence of a school-wide implementation, individual teachers opt to use an LMS for their particular classroom, often for free. We do not consider this case a school-wide adoption and therefore do not include those use cases in our data. This methodology does not fully analyze total usage of a platform like Schoology that has a freemium model, including a free option for individual teachers and an enterprise solution which is a school-wide adoption based on a fee per student model. A platform like Google Classroom likewise has usage by individual teachers as well as school-wide implementations.

    Before we share the preliminary data, some caveats are in order to hopefully avoid anyone misrepresenting this information:

    • This is preliminary data that will likely change as we learn more. While we believe there are some broad trends already emerging, there will be refinements as we increase our coverage over time. We expect the changes to be in small adjustments to specific numbers but not in big changes to market shape.
    • This view is based on number of schools that have implemented an LMS, which is a different metric than district-wide implementations (where many or most of the purchasing decisions occur) or implementations scaled by student enrollments. We will add these views in the future.
    • This view is based on installed base (which represents total estimated deployments), which is different than new implementations in a given time period (which would measure market momentum). Again, we will add these views over time, just as we have done for the higher ed LMS market.
    • Due in particular to the free options available in K-12, there will be schools that have more than one LMS available at the institutional level. Google Classroom in particular is often available as an option at a school even when there is another LMS.
    • As is our practice at e-Literate, we’ll describe the caveats and present the data as is. As we learn more, if the relative percentages change significantly, we will share updates.
    • For more information on our data methods, see this post.

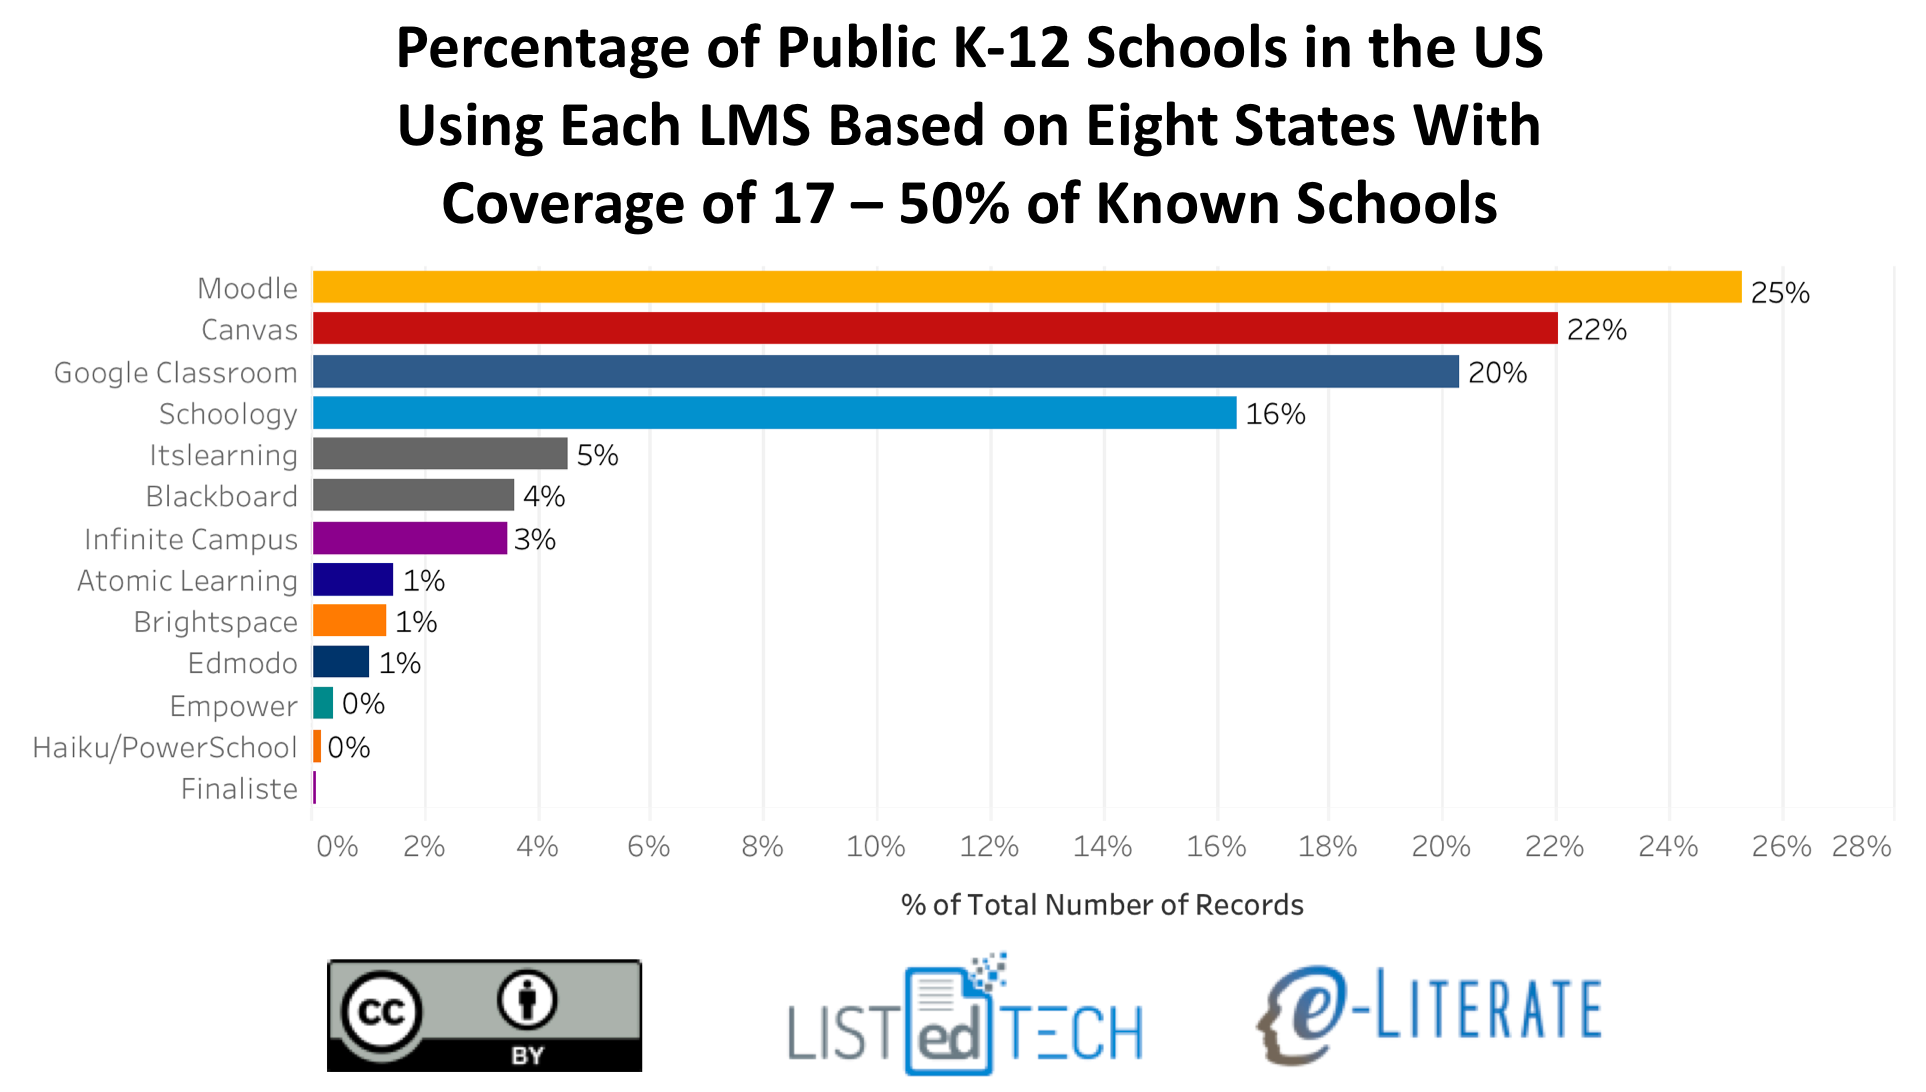
    The first graph presents a view of K-12 school-wide LMS implementations in the United States for the 8 states (and DC) where we have at least 17% coverage of known schools (Alaska, Delaware, District of Columbia, Florida, Massachusetts, Minnesota, Texas, Wisconsin).

    LMS Market Share for K-12 in US, 8 States

    To get a sense of how representative this initial market share is, we made the same calculations across all 6,875 schools from 50 states and DC that in our data thus far. The data for each LMS matched within ~2% for each LMS (e.g. Canvas went from 22% to 24%, Moodle went from 25% to 24%) between the two views.

    As in the higher education market, there appears to be four top contenders in K-12 – Moodle, Canvas, Google Classroom, and Schoology – with all others having 5% or less of market share. Moodle and Canvas are both present in the Big Four for both higher education and K-12, but in K-12 Google Classroom and Schoology are the other big players. We believe that this is the first data set showing just how widely Google Classroom has been adopted. ((Disclosure: Instructure, Schoology, Blackboard, and D2L are subscribers to our LMS Market Analysis service; Instructure and Blackboard also are sponsors for an upcoming event we are organizing.))

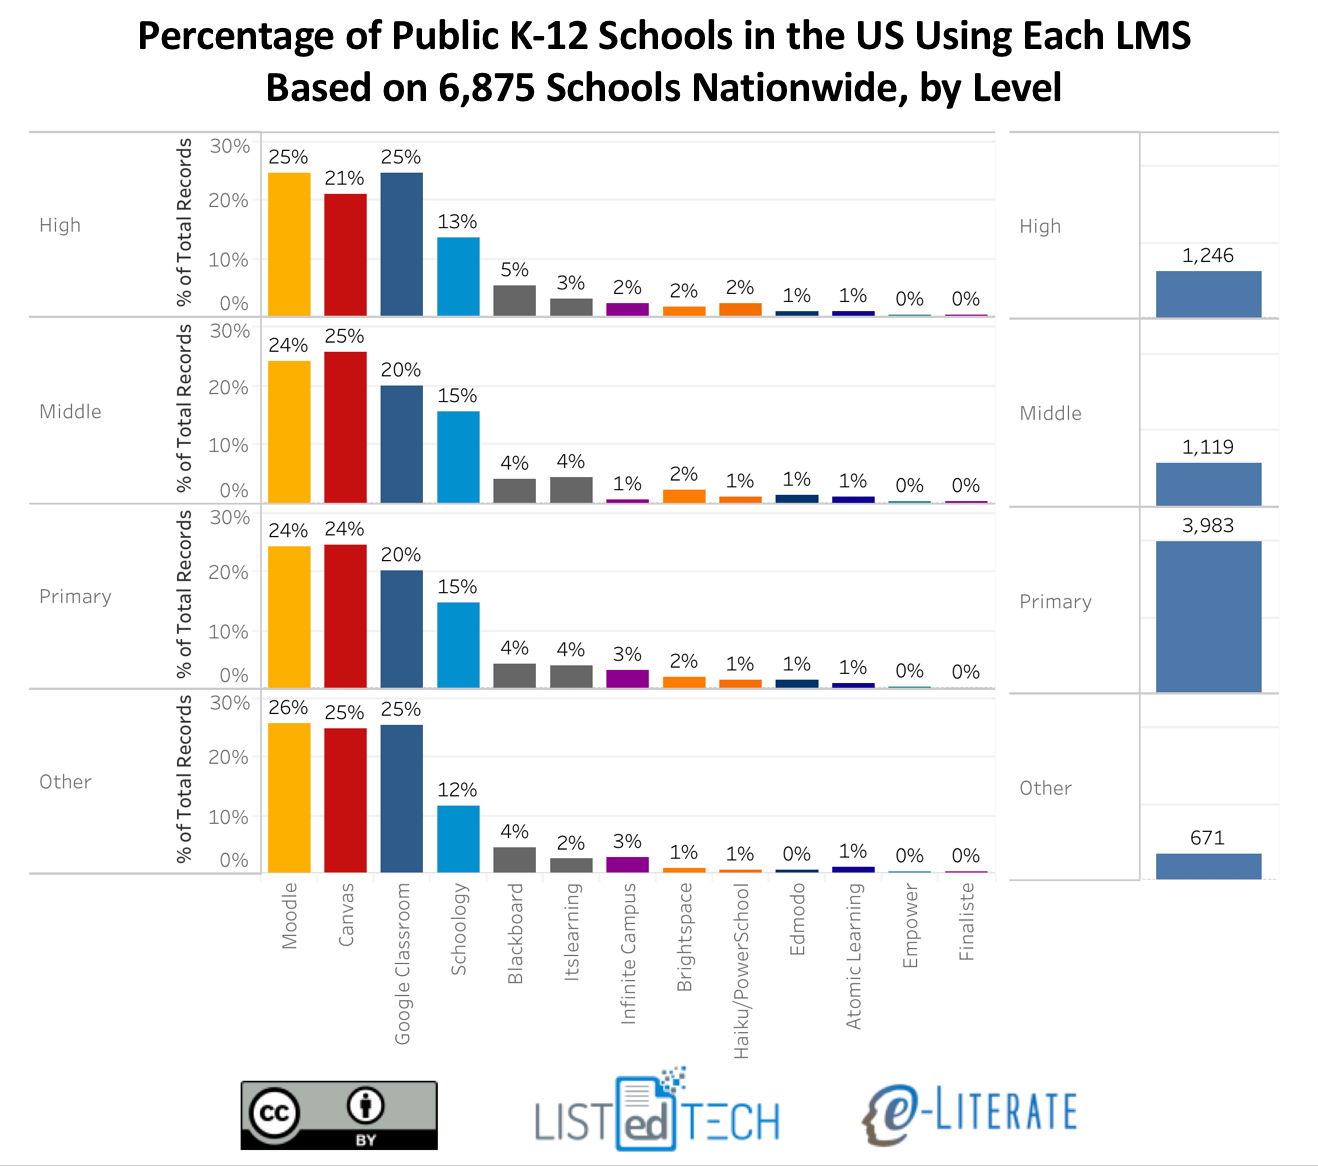
    The general distribution is somewhat consistent across school levels – primary, middle, high school, and others – with some interesting smaller variations. The following view also gives a sense of our relative data coverage by level. In this case we are using all our data across the 6,875 schools. Note that totals are higher than this number due to multiple systems being available at some schools.

    LMS Market Share for US K-12, By Level

    We hope this new data provides a broader view of the academic LMS market. We’d love to hear your feedback and questions.

  • Google Classroom: Isolated adoptions for higher education institutions

    At last month’s Future Trends Forum hosted by Bryan Alexander, I received several questions around the intersection of K-12 and higher education markets for learning platforms. A condensed version of my answer is that the mainline LMS vendors are seeing increased overlap (Canvas, D2L Brightspace, Blackboard, Moodle, and Schoology in particular), but that there was little overlap when it comes to the teacher-oriented Big Classrooms (Google and Facebook).

    Three years ago when the buzz over Google Classroom was at its peak, I wrote several posts looking at the platform, ultimately concluding in the post titled “Why Google Classroom won’t affect institutional LMS market … yet”:

    None of this argues that Google Classroom is an inferior tool – it is just not designed to replace the full-featured LMS. Remember that Google is a technology-vision company that is comfortable putting out new tools before they understand how the tools will be used. Google is also comfortable playing the long game, getting more and more instructors and faculty using, giving feedback, and pushing forward the new toolset. This process will take some time to play out – at least 2 or 3 years in my opinion before a full institutional LMS may be available. If Google like the direction Classroom usage is going.

    Subsequently, Google has addressed some of the gaps in the product, including a programming interface that could allow deeper integration with student record systems used at higher ed institutions.

    We’re now 3 years down the road from the initial analysis – has Google Classroom started to be adopted as a full institutional LMS?

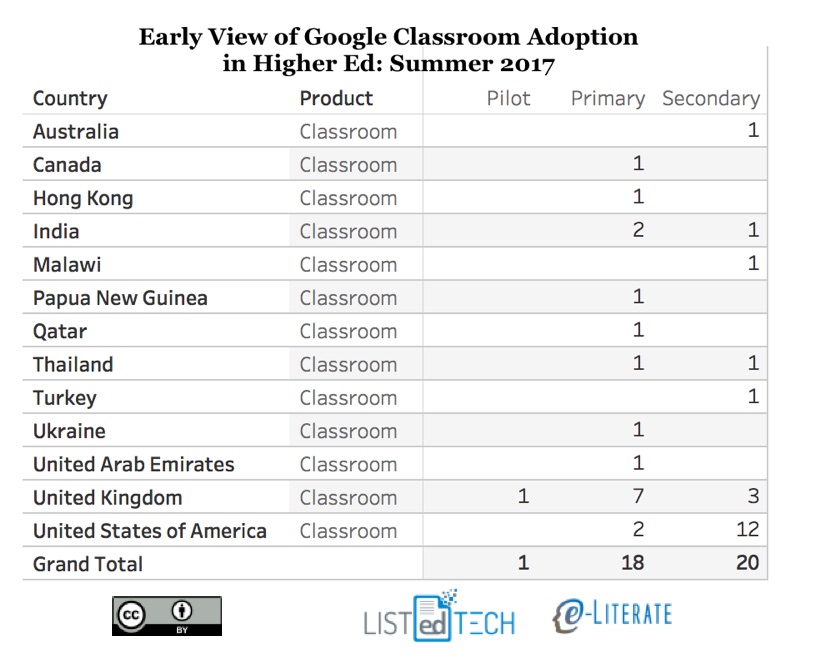
    Our partners at LISTedTECH have performed an initial analysis on this question. We do not yet have full data coverage in the same fashion as our LMS market analysis, but this early view should give some insight into higher ed adoption of the platform.

    For this initial view, we are looking at institutional adoption. Where a school supports Google Classroom as their primary or secondary system. There are plenty of other cases where individual faculty choose to use the platform in an unsupported manner.

    Notes from initial view:

    • A lot of the interest seems to come from developing countries where the education budgets are quite low. Malawi, Papau New Guinea, etc.
    • For the United Kingdom, the number is artificially high as 5 of the institutions are all part of Warwickshire College Group (a collection of Further Education colleges). Nevertheless, the UK has the higher number (so far) of institutional adoptions.
    • The usage of Google Classroom as a secondary system makes sense – an alternative platform that doesn’t have all the features and integrations typically needed for primary system usage – but there are cases now of primary usage.
    • In the US, the most notable adoption is the California University of Management and Sciences, a Student and Exchange Visitor Program (SEVP)–certified institution in Anaheim. They support both Moodle and Google Classroom for primary LMS usage.
    • While we don’t have comprehensive coverage yet, it appears that there are some isolated cases of Google Classroom institutional adoption in higher education. The platform is still not a true LMS competitor, but we’ll keep watching.
  • Year-end Updates on e-Literate News Posts

    For my final 2014 post, I thought it would be interesting to provide year-end updates to some news posts on e-Literate over the past year. You’ll notice that there is somewhat of an emphasis on negative stories or implications. For most positive stories, companies and institutions are typically all too happy to send out press releases with the associated media paraphrasing, and we have little need here to cover as news. The following non-exhaustive list is in date order.

    D2L Growth Claims

    In December 2013 I described layoffs at Desire2Learn (now officially named D2L). The significance of this story is that it calls into question D2L’s growth claims and trumpeting of massive new investment of $85 million. Some updates:

    IPEDS Data on Online Learning

    (more…)

  • e-Literate Top 20 Posts For 2014

    I typically don’t write year-end reviews or top 10 (or 20) lists, but I need to work on our consulting company finances. At this point, any distraction seems more enjoyable than working in QuickBooks.

    We’ve had a fun year at e-Literate, and one recent change is that we are now more willing break stories when appropriate. We typically comment on ed tech stories a few days after the release, providing analysis and commentary, but there are several cases where we felt a story needed to go public. In such cases (e.g. Unizin creation, Cal State Online demise, management changes at Instructure and Blackboard) we tend to break the news objectively, providing mostly descriptions and explanations, allowing others to provide commentary.

    The following list is based on Jetpack stats on WordPress, which does not capture people who read posts through RSS feeds (we send out full articles through the feed). So the stats have a bias towards people who come to e-Literate for specific articles rather than our regular readers. We also tend to get longer-term readership of articles over many months, so this list also has a bias for articles posted a while ago.

    With that in mind, here are the top 20 most read articles on e-Literate in terms of page views for the past 12 months along with publication date.

    1. Can Pearson Solve the Rubric’s Cube? (Dec 2013) – This article proves that people are willing to read a 7,000 word post published on New Year’s Eve.
    2. A response to USA Today article on Flipped Classroom research (Oct 2013) – This article is our most steady one, consistently getting around 100 views per day.
    3. Unizin: Indiana University’s Secret New “Learning Ecosystem” Coalition (May 2014) – This is the article where we broke the story about Unizin, based largely on a presentation at Colorado State University.
    4. (more…)