e-Literate

Present is Prologue

Tag: LMS

  • D2L Bets on The Cloud and Advances in User Experience

    D2L Bets on The Cloud and Advances in User Experience

    One of the arguments that we have made as part of our LMS Market Analysis service is that if you look beyond market share numbers, there has been a tectonic shift in the academic LMS market that started around 2012, moving from being Blackboard-centric to Canvas-centric. Meaning that the current market trends are largely driven by Canvas adoptions and market reactions to Canvas adoptions. This change has elevated the need for viable LMS solutions to have both a cloud-based deployment strategy as well as a more modern, intuitive user experience than what was acceptable just five years ago.

    Blackboard’s move to Learn SaaS (deployment) and Learn Ultra (new user experience) is a prime example of this market dynamic, and it has tended to get the lion’s share of analysis, including here at e-Literate. We have described that D2L has joined Canvas in “an emerging two-horse race for new implementations”, but we could do a better job of describing why we believe they are gaining in the market. ((Disclosure: D2L, Blackboard, and Instructure are subscribers in our LMS Market Analysis service and sponsoring participants in our Empirical Educator Project.))

    Short story – D2L has made fairly substantial bets on cloud deployment and a streamlined user experience, and the product design changes present the best explanation for the market gains.

    Head in the Cloud

    The data looking at new LMS implementations (changing from one system to another) in higher ed across the four global regions we cover in our market analysis shows a remarkable movement away from self hosting, or on-premises hosting, towards a combination of managed hosting by the LMS vendor or cloud hosting designed by the vendor but running on AWS, in particular. From 15% external hosting to 77% in just one decade. Within the external models, there is another major shift away from managed hosting and towards cloud hosting.
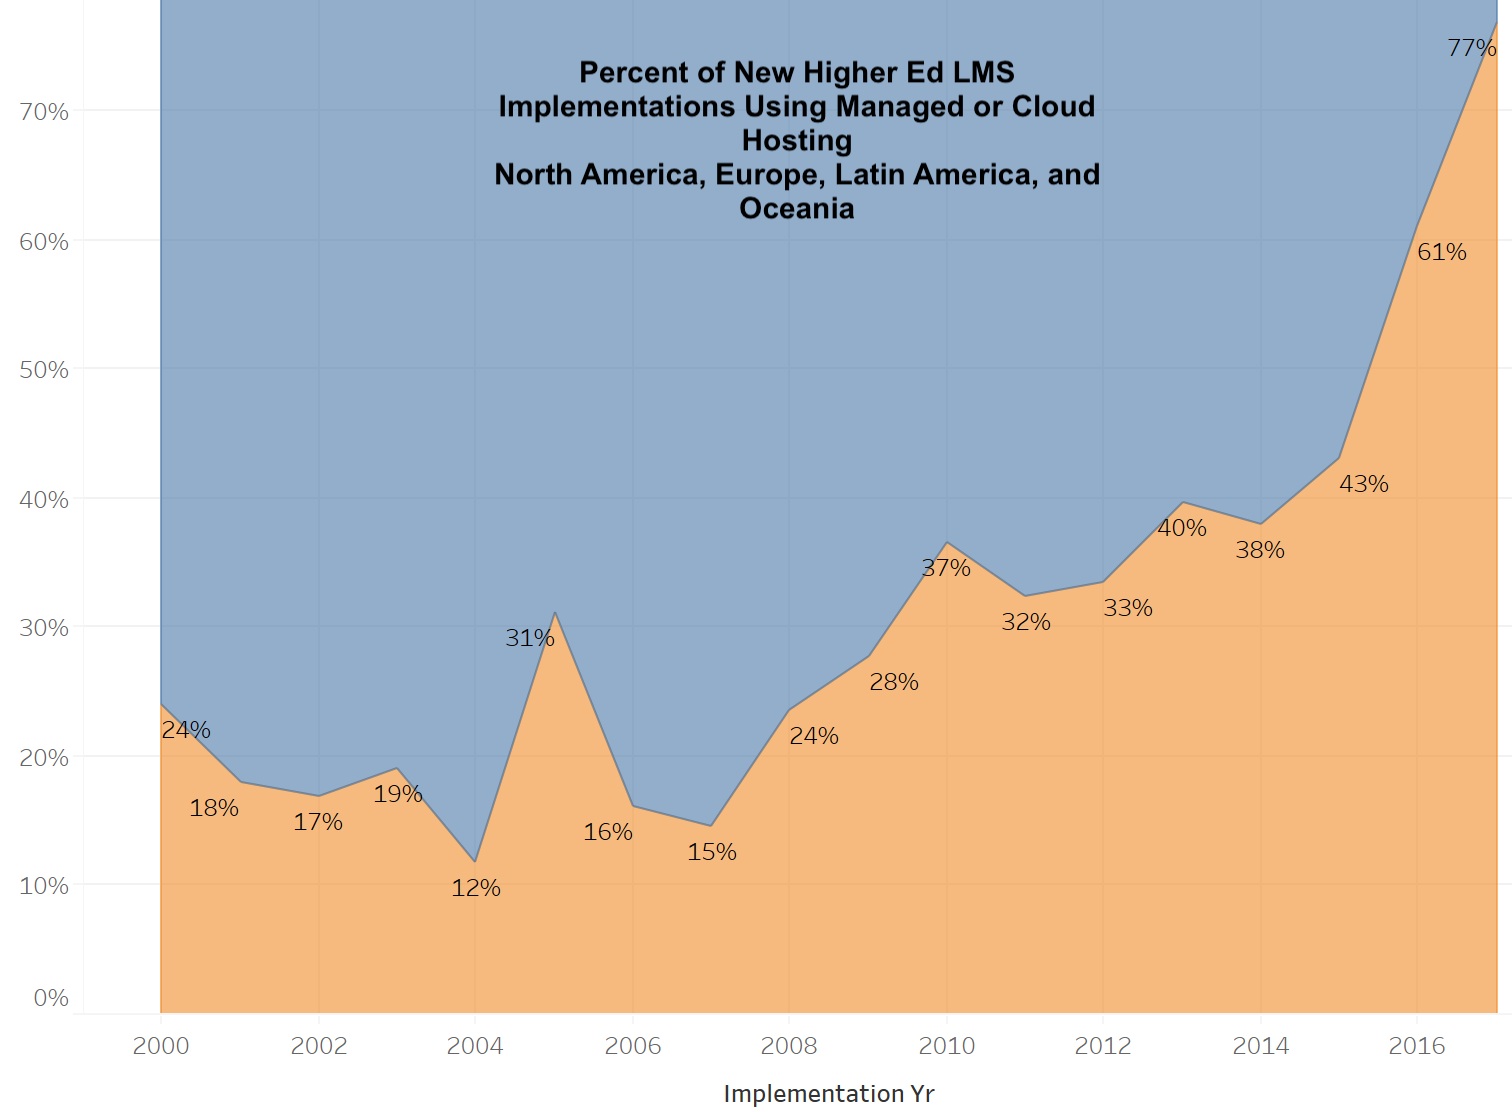
    Growth of LMS external hosting

    D2L has long worked on managed hosting options, but in late 2013 the company introduced Continuous Delivery where software releases are pushed to customers incrementally, such that customers would jointly run the latest versions of Brightspace, their LMS. This move is important, as one primary benefit of cloud deployment is to remove the explosion of software configurations and versions that make it expensive and difficult to diagnose and fix bugs and to release new features.

    Three years later in 2016 D2L announced their move to AWS for cloud deployment.

    AWS Data Centers for D2L

    While we heard grumblings from multiple clients during the transition – especially thru early 2017 – D2L clearly made some hard choices and and is aggressively moving to the cloud, not just as an option, but as their primary delivery model. According to David Koehn, VP of Product Management at D2L:

    • All new Brightspace implementations are on AWS cloud;
    • Virtually all current Brightspace implementations use Continuous Delivery; and
    • Approximately 50% of current customers are already on the AWS version of cloud deployment; and
    • By the end of 2018, a large majority of customers will be on cloud deployment.

    Contrast this move to the cloud with Blackboard’s where they plan to continue offering self hosting, managed hosting, and their own AWS-based cloud hosting options at the customer’s choice, while they believe SaaS and Ultra will lead on new sales. The primary constraint being that to go to Learn Ultra experience, you must first be on Learn SaaS, the cloud hosting option. But the key point is that Blackboard has tended to view the cloud as one deployment option among others, and the numbers show it. According to a company blog post this week from CEO Bill Ballhaus:

    As of today, more than 50 clients are running Ultra, with dozens more planning to start using the Ultra experience and courses in the second half of the year. Also, 361 clients around the globe have moved to SaaS deployment for Learn.

    Our data show more than 2,000 higher ed customers on Learn, but if you add in K-12 and corporate customers, this roughly equates to just over 10% on or moving to Learn SaaS and 2% on Learn Ultra. These are generous numbers, but more on that in a separate post.

    The point is that D2L is making a much more aggressive and focused bet on the cloud than is Blackboard, for better or worse. Canvas, of course, is designed natively for the cloud, and essentially 100% of their customers are on the AWS cloud.

    Run to Daylight

    David Koehn also pointed out that the real driver for the AWS cloud move by D2L is to enable a redesign of the user experience and to provide improved scalability and reliability. In other words, the cloud deployment is a means to the Daylight end.

    Daylight is the name for D2L’s redesign of the user experience and its streamlined user interface. When it was first announced just over a year ago, I was somewhat skeptical as the initial changes were evident in different fonts and cleaner look-and-feel, but not significant improvements in the workflow for faculty and students.

    As time goes on and I see more advanced demos, my view is changing. The Daylight Experience does have some real improvements not just in look-and-feel but in fewer and more intuitive clicks to get the same job done. A major focus on the release this summer (in time for D2L Fusion users conference) is more fully encouraging usage of the activity stream for higher ed clients (this feature was initially targeted at K-12 market but has been adapted for colleges and universities).
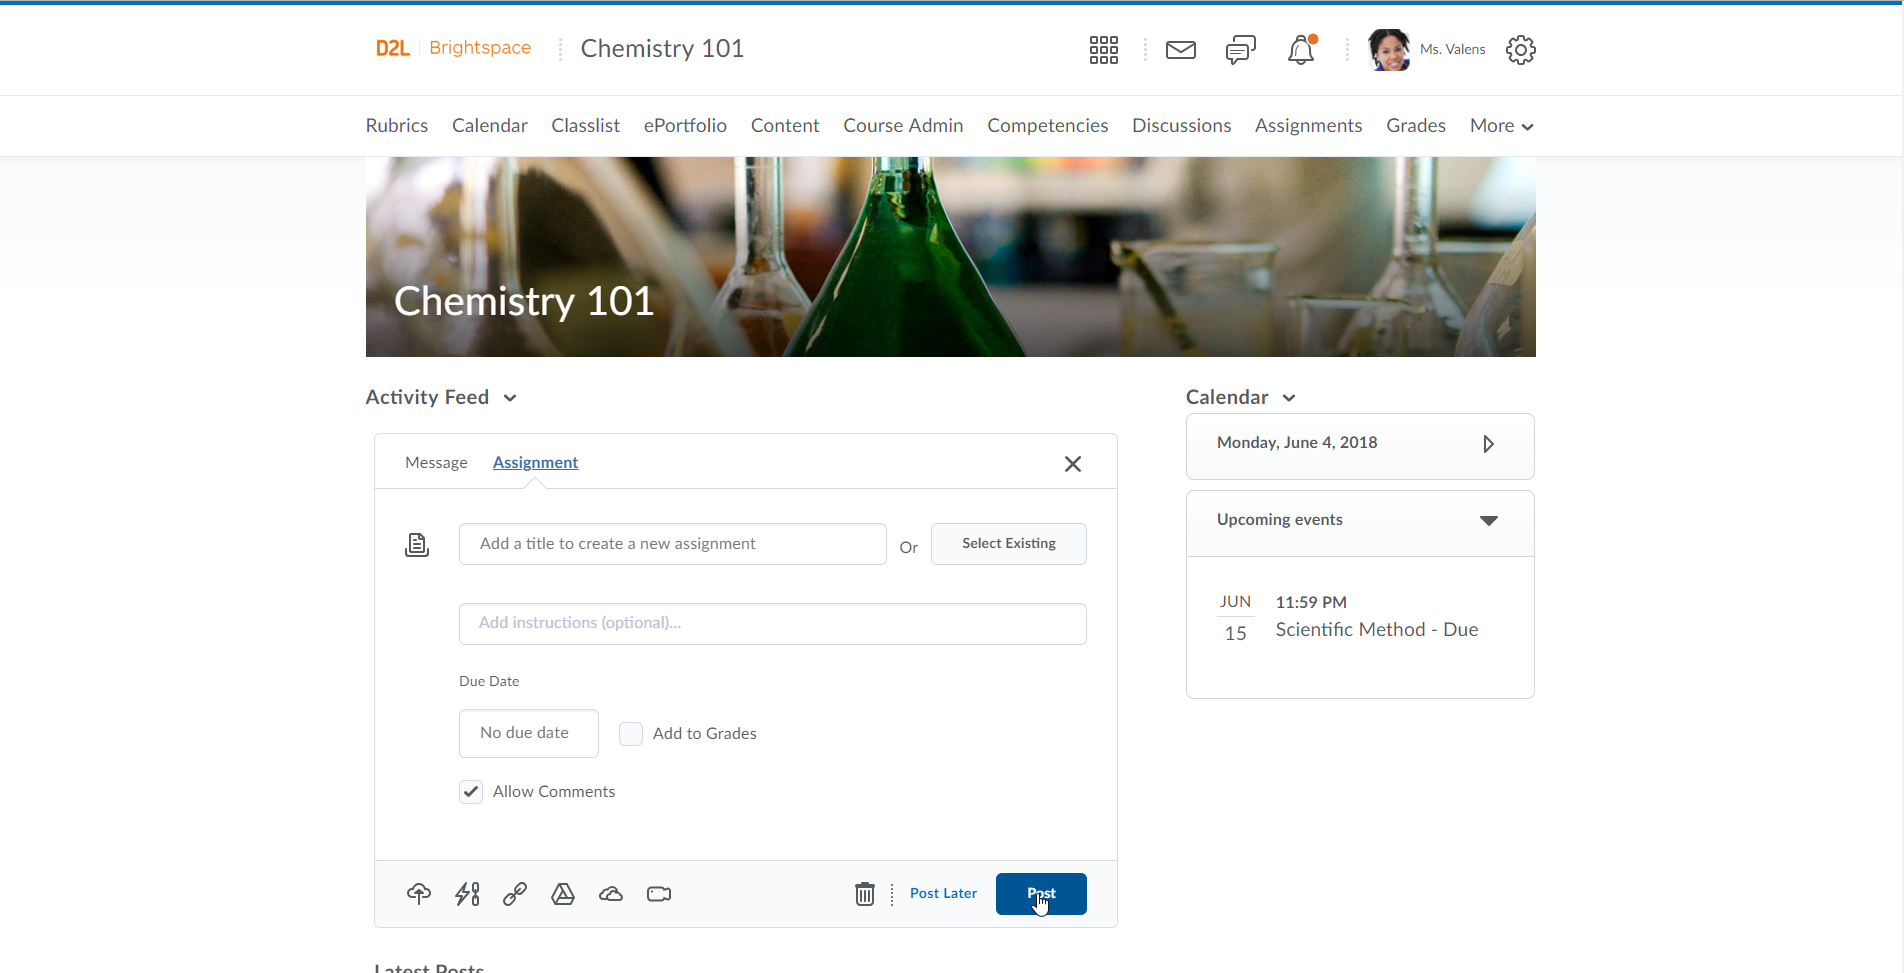
    Brightspace add assignment

    D2L has long played the Mutually Assured Destruction game of features, targeted at cumbersome procurement processes. D2L (along with Blackboard and Moodle) has a deep set of features which contrasts with Canvas and its streamlined set of features that rely on third-party integrations to solve some of the more specialized use cases. For D2L, it is important to maintain these features as a competitive differentiator with Canvas, and the design approach guiding them is Progressive Disclosure. This design technique relies on progressing from simple to complex, showing the user the information and options they need when they need it or request it and not before.

    Consider adding a multiple choice quiz, where the desire is to make this process very simple, but to then have a page or area that exposes more and more options as requested by user or in context of the quiz setup.
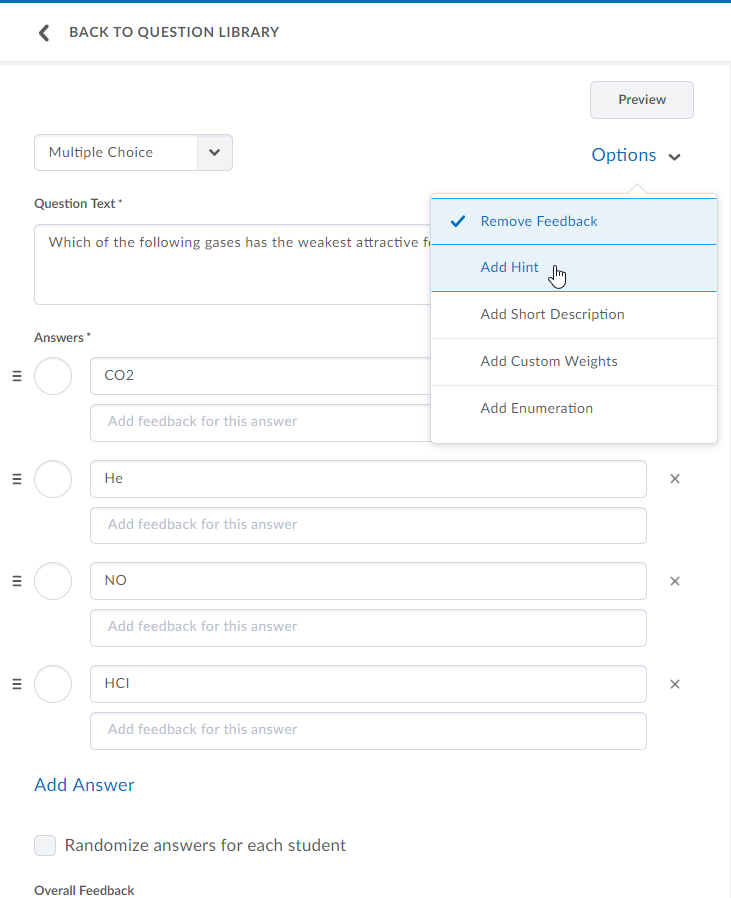
    Brightspace details on quiz

    As D2L further implements this design approach within the Daylight Experience, we are seeing a more modern and intuitive user experience for Brightspace customers, yet one that is showing real promise to also tap into deeper feature sets. And these changes are being used in production.

    Again by way of contrast, Blackboard’s user experience redesign for Learn Ultra has had a bumpy ride, with multi-year delays of getting any customers to use in production. They took more of a big bang approach to releasing Learn Ultra, and when customers pushed back saying that Ultra wasn’t ready, this led to additional delays and eventually a change in the design team. D2L’s Daylight has proven to be a more iterative release of their new user experience.

    What to Watch

    This year it is becoming difficult to separate LMS products from company finances. Instructure is trying to balance Canvas and Bridge growth to satisfy public markets along with a new executive team. Blackboard is dealing with corporate debt challenges while needing to fully release Learn Ultra. As mentioned in this post, D2L is moving strongly to the cloud with a new user experience while managing expenses. Schoology is trying to grow higher ed market under the radar. Moodle HQ took investment for the first time. There are a lot of open questions on the future of the academic LMS market, and we expect much to be revealed at the big summer (and fall) events.

    As for D2L Fusion, we plan to get a better read on how customers and prospects are reacting to the cloud deployment move and streamlined user experience. We are seeing real changes in the Brightspace design and deployment model, but do paying and prospective customers value these changes? Furthermore, will D2L be able to improve its customer service and delivery on promises made for new customers as well as it has improved its product design?

    As for Blackboard, Learn Ultra now has D2L’s Brightspace as a major user experience to compete with as well as Canvas. There is a lot more changing in the LMS market than what is obvious on the surface.

    Update: Clarified D2L numbers to be specifically for AWS cloud deployment. Also changed several instances of “cloud hosting” to be “cloud deployment” to make terminology more accurate.

  • Interview with CEO of Instructure on changes to executive team

    Interview with CEO of Instructure on changes to executive team

    Instructure is now a decade old as a company and faces a crucial test this year with recent changes to their executive management team and the need to scale both Canvas (academic LMS) and Bridge (corporate learning LMS). The long-time head of sales, Marc Maloy, and head of marketing, Misty Frost, left Instructure in the fall. The company eventually hired a new head of marketing, Bjorn Eriksson from the world of corporate HR, in January. After a months-long search, Instructure did not directly replace Marc with a new head of sales, but instead they hired a new president, Dan Goldsmith, who also has sales leaders reporting directly to him. With this move, Mitch Macfarlane, the long-time chief operating officer and former head of client services, will be leaving the company this summer. ((Disclosure: Instructure and D2L are subscribers to our LMS market analysis service and were sponsors at our recent Empirical Educator Project summit.))

    We’ve written about previous executive changes for Instructure – when their two founders left the company and when their CTO departed after just one year – but in each case the company managed the transitions and came out stronger in the end. As we have shared in our LMS Market Analysis service and on e-Literate, the Canvas track record is remarkable in terms of not losing customers and gaining new customers from most other LMS providers.

    But the executive changes over the past year come at a time when Instructure faces new challenges in product development and implementation support. At InstructureCon 2016, the company announced their next-generation quizzing platform, Quizzes.Next, stating that it would be “made available to you over the course of the next several months”. Last summer at InstructureCon 2017, Quizzes.Next entered a limited beta program, but the new set of tools is still not fully in production. To our knowledge, this might be the biggest product schedule miss in the company’s history, and it will be quite interesting to see what happens with this summer’s InstructureCon.

    In addition, we have had several people contact us privately, even before the most recent management change, telling us about a new level of frustration in implementation projects and product upgrades. None of the tales were extreme, but they were unusual for Canvas clients and in general spoke to distractions from staff and lack of clear answers and updates.

    The press release announcing the hiring of Dan Goldsmith included this description:

    With more than 20 years of experience in software and services, Goldsmith’s career is marked by directing high-performing global teams and achieving outstanding penetration and growth in challenging markets. Goldsmith spent the last eight years as a senior executive at Veeva Systems, a cloud-based software company, where he started and ran Veeva’s international business, led the company’s strategy in new markets and products, and most recently was responsible for Veeva’s global engagement and growth in strategic accounts.

    “It is an exciting time for Instructure. We are well positioned for success as we focus on the continued growth of Canvas, expansion of Bridge, and international execution,” said Josh Coates, CEO of Instructure. “Dan’s energy, creativity and proven track record in driving go-to-market strategies and rapidly scaling businesses make him a tremendous addition to Instructure at the perfect time to lead us through our next phase of growth.”

    Goldsmith was one of the first 50 employees at Veeva. He helped lead the company through a successful IPO and a growth path to a $10 billion market cap. Prior to Veeva, he worked in various executive positions at top companies, including Accenture, PwC and IBM. During his years in management consulting, Goldsmith led initiatives in global markets and developed new offerings. Goldsmith will have an immediate impact on Instructure’s strategy. His initial focus will be on market growth, with the sales leaders reporting directly to him.

    This was the setup for an interview that we had with Josh Coates, the CEO of Instructure, last week. Given our focus at e-Literate on education markets, we in particular wanted to ask about how the company is balancing the needs of Canvas and Bridge.

    Coates came prepared for the interview, and up front he made the point that the “vast majority of company resources” are allocated to the academic markets and that this is their foundational business. After we pointed out that the majority of discussions on quarterly earnings calls focus on Bridge, Coates noted that Wall Street is overly focused on corporate learning markets and unfortunately takes Canvas’ academic market performance for granted. He does not do so, but some of the investor community seems to.

    The primary selling points bringing Goldsmith to Instructure are that he helped Veeva grow into a $10 billion company, having joined as one of first ~40 employees, and that he specifically helped them grow international markets. According to Coates, Goldsmith spent his first three years opening up the Europe, Middle East, and Africa (EMEA) markets, and that yes, his international experience is a big reason for Instructure recruiting him.

    We have noted at e-Literate that Canvas really began international expansion just 3-4 years ago. According to our current data, Canvas leads in higher ed adoptions in Europe and Australia / New Zealand, but interestingly, D2L is beating Canvas in Latin America higher ed adoptions despite Instructure having a bigger investment in its regional office in São Paulo. At some point Canvas’ market share growth rate in North America will have to flatten out and international markets will naturally increase in importance for company finances. While market wins in Europe and Australia / New Zealand are impressive, Instructure will need more aggressive growth in other markets, and clearly Goldsmith is being tapped as a catalyst to increase sales overseas.

    We pointed out that Goldsmith had no education background and appears to be more closely aligned to corporate learning markets than higher ed or K-12 markets. Coates responded that Goldsmith has done quite well for himself at Veeva but is also passionate about education, as evidenced by his experience as the chair of the Montgomery School board of trustees. Coates acknowledged that this is not deep academic sector experience and that the company will need to give Goldsmith a big education on higher ed and K-12 markets. If we had a dollar for every time we heard of a rich dude who is passionate about education, well, we’d be rich dudes who are passionate about education. It is good to hear, however, the acknowledgement that the new executive brings rich software company scaling and international market growth experience but not domain knowledge of the academic markets for Canvas.

    We asked for an update on Quizzes.Next – when it will be generally available (GA) and whether the schedule challenges are related to the executive changes. Josh Coates assured me that no executives are working on the code, but Jared Stein, VP of higher ed product strategy, answered more directly.

    Quizzes.Next’s GA release is scheduled for Summer 2018. This is later than planned because we underestimated the complexity of building assessments entirely as a micro-service at the level of quality we set for ourselves and our users.

    The executive management team over the years has played a big role in establishing the company culture that is a large part of Instructure’s success. Now that the three M’s (Marc, Misty and Mitch) are out, the question is not whether the culture will change, but how. Coates’ acknowledges this reality and trusts that Instructure’s internal rudder is strong enough to keep the company on course.

    There are two company risks that stand out in trying to balance Canvas and Bridge. First is that complacency sets in not just with some in the investment community but with Instructure itself, and they begin to take their strong position in the academic market for granted. Second, and related, is that resources and talent end up flowing disproportionately to the corporate learning market given its increasing importance. These are risks to watch and not observations of actions, however, and Coates was emphatic that the academic market will always be the foundation of Instructure’s business. The corporate learning market is significantly larger than the academic market, however, and Coates estimated that in ten years or so, corporate will likely drive a larger portion of Instructure’s revenue.

    It should be noted that growth in corporate does not have to come at the expense of the academic market. It actually has the potential to strengthen product offerings in higher ed and K-12 as Instructure gains deeper insights into teaching and learning more broadly. There is also the potential for convergence, or at least cross-pollination, in these markets as the profile and needs of learners evolve.

    We’ll keep a close eye on academic LMS market trends in the coming months for signs of new developments. For the near term, at least, Instructure’s success is predicated on the continued success of Canvas in higher education and K-12 despite the quarterly investor calls skewing toward the corporate learning markets and new management hires with experience outside of the education sector.

  • Comparing the First Ten Years of Blackboard and Instructure in LMS Market

    Comparing the First Ten Years of Blackboard and Instructure in LMS Market

    Last year Blackboard celebrated their 20th anniversary as a company, and this year Instructure celebrated their 10th. Yes, the company with Canvas, the “new” LMS solution, is a decade old. To gain historical perspective, it is interesting to compare each company’s first ten years in business in terms of primary financials – revenue and income – and performance in their core North American Higher Education market.

    We can only go so far in comparing the companies on this basis, however, due to different circumstances.

    • Most importantly, Blackboard helped create the LMS market and therefore had significant portion of its expansion in a greenfield situation, picking up clients who had not previously used an institution-wide LMS. Canvas entered the market well after saturation, with greater than 90% of institutions already having a standard LMS.
    • Blackboard developed its product line pre-cloud, with on-premise hosting being the primary deployment model. Canvas was cloud-native, developed on top of AWS infrastructure.
    • Blackboard’s growth was heavily based on corporate acquisition of competitors – Prometheus, WebCourse, WebCT in the first decade – while Instructure’s growth has been almost exclusively organic.
    • Both companies sold in more than just the North American Higher Ed (NAHE) LMS market, even if that was the core. Blackboard acquired two companies in 2000 and launched a card-reader transaction business, and they played somewhat in the K-12 and corporate learning space. Instructure developed Bridge for corporate learning, Arc for video platform, and it has a heavy presence in the K-12 LMS market.

    Interestingly, both companies went public in Year 7 (Blackboard in 2004, Instructure in 2015).

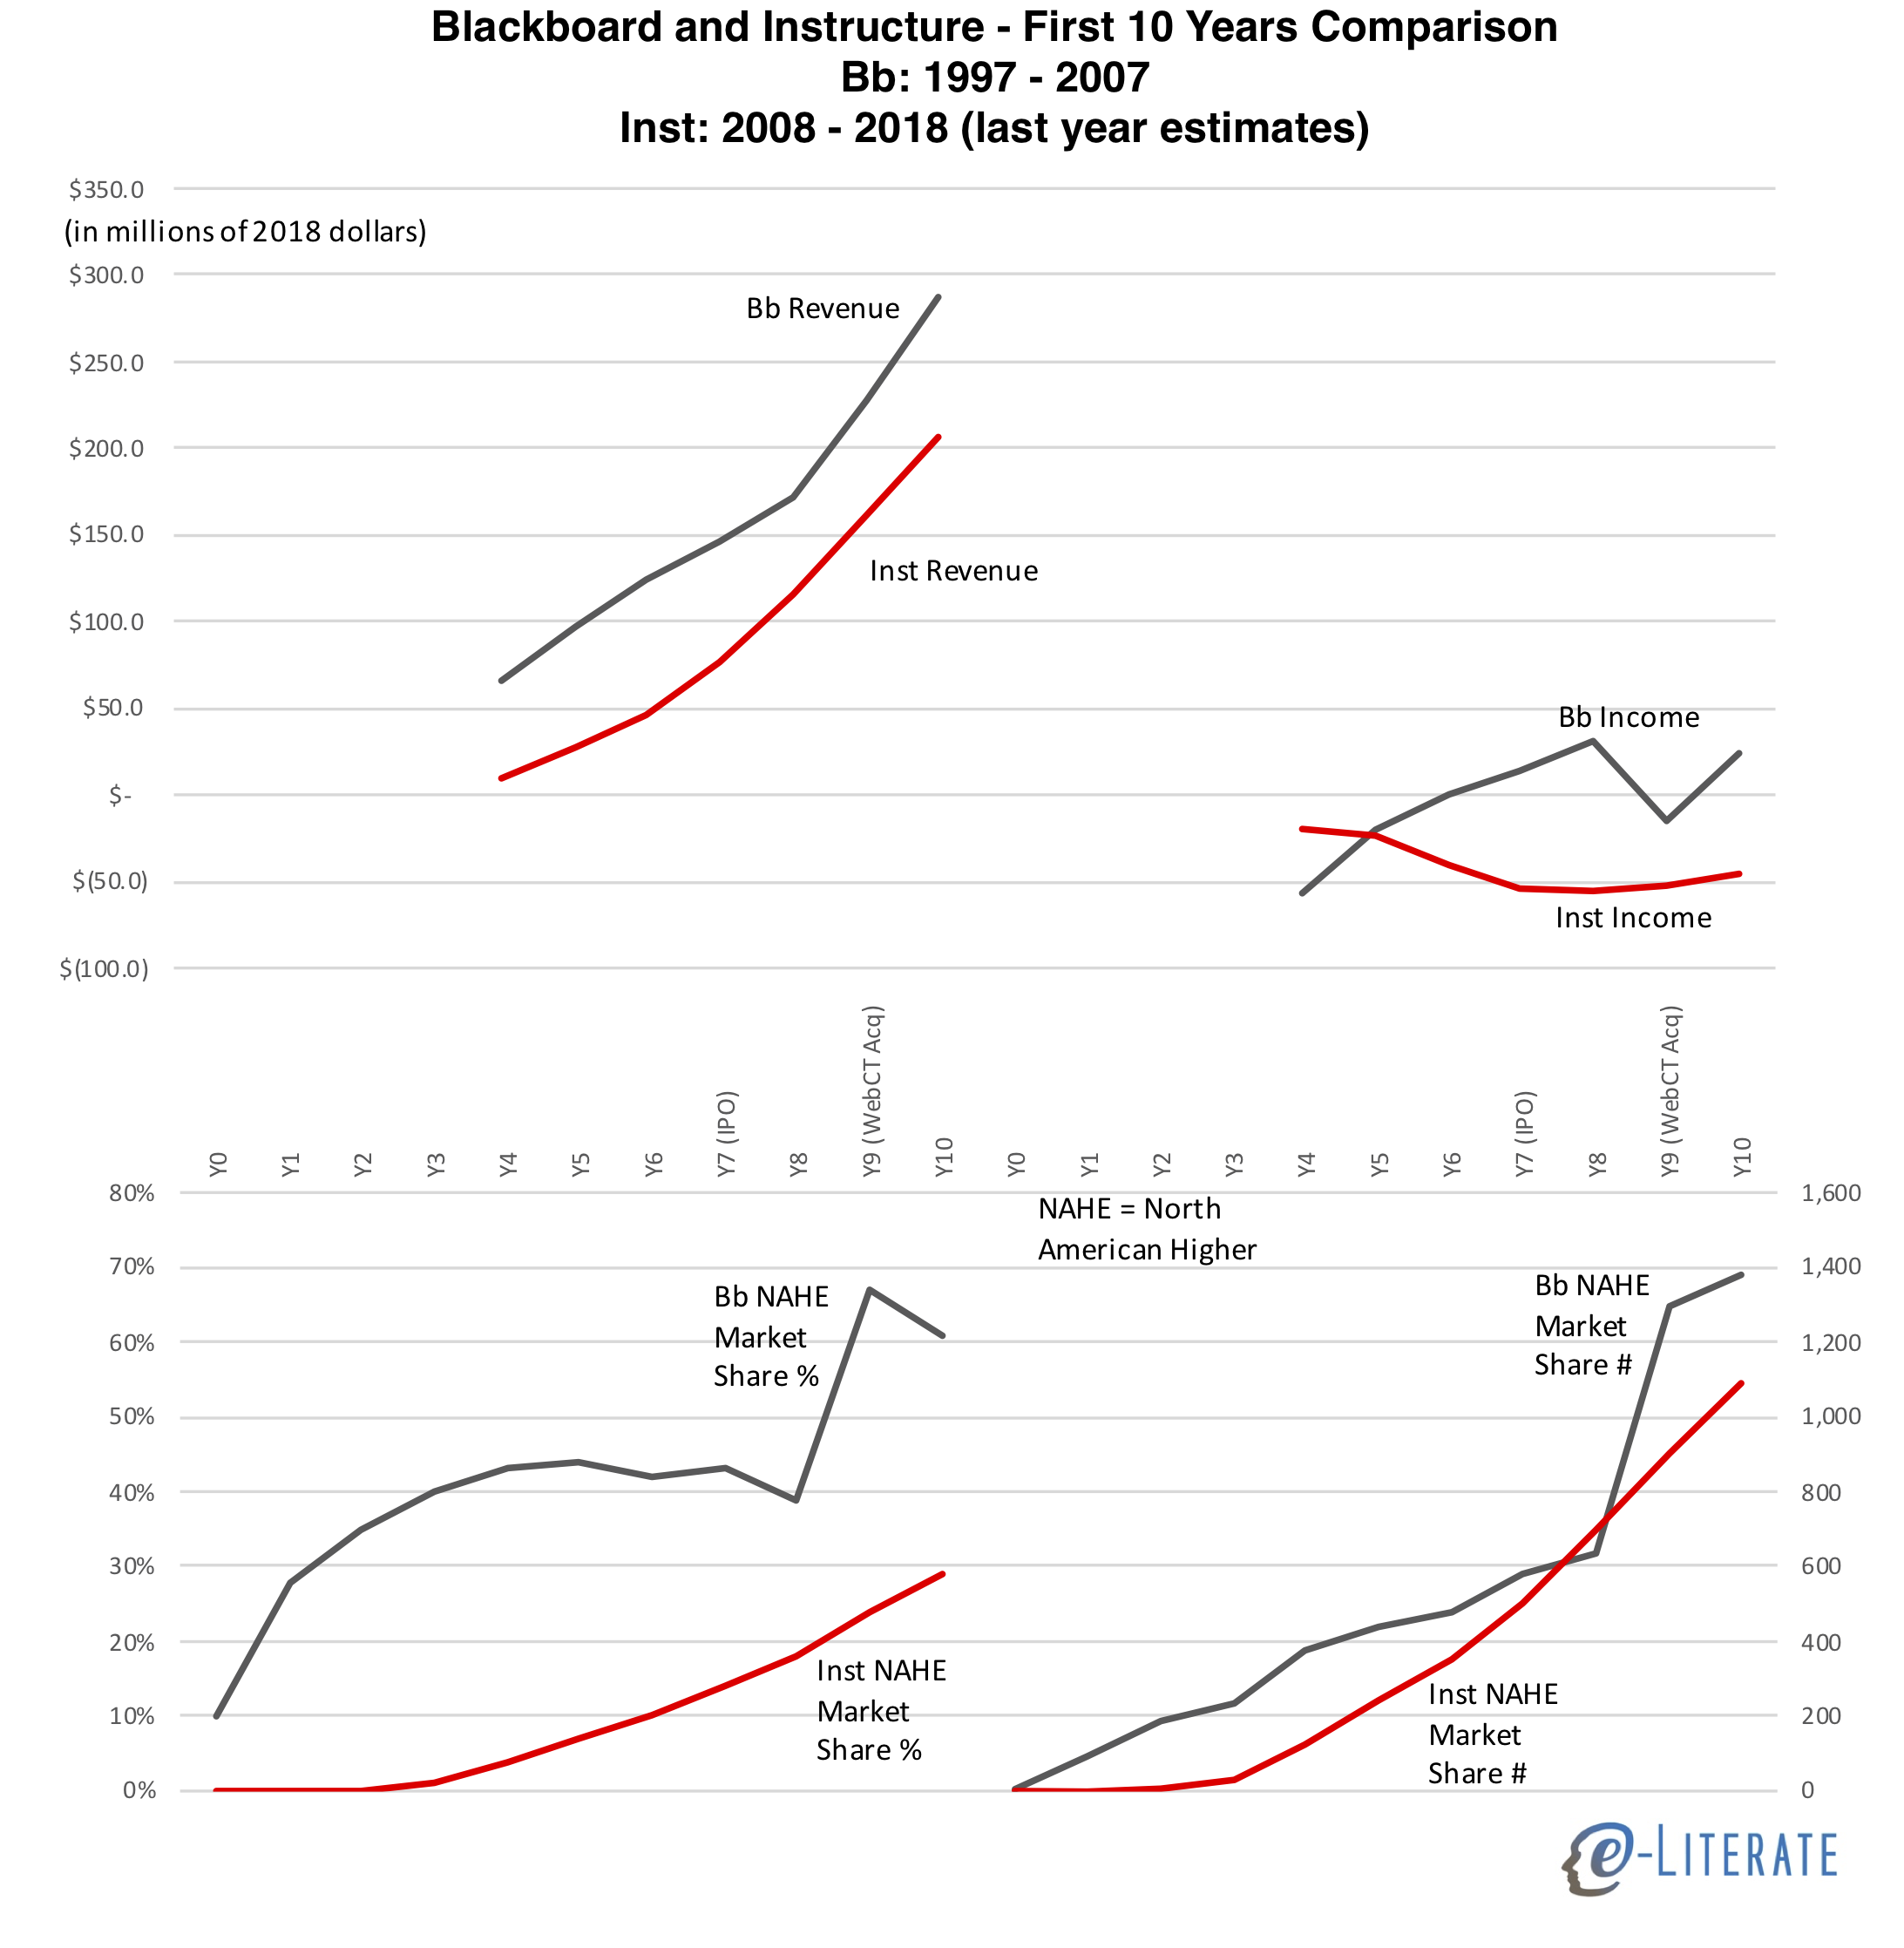
    With that in mind, let’s compare revenue, operating income – both derived from public SEC filings and adjusted to 2018 dollars – and market share in their core NAHE market. The financial data comes from public filings, and data for 2018 for Instructure are estimates based on their outlook presented in the most recent quarterly earnings release. Market share data is based on our LMS Market Analysis service and associated financial analysis for premium subscribers.

    Blackboard and Instructure revenue and income in 2018 dollars, and north american higher ed market share in percentage and numbers

    Some notes:

    • Blackboard raised ~$185 million in venture financing pre-IPO while Instructure raised ~$95 million (both in 2018 dollars). Part of this difference can be attributed to the much higher costs associated with pre-cloud enterprise software deployment models.
    • Blackboard’s revenue was higher than Instructure’s at similar points, and their operating income was mostly positive after Year 6. Instructure has maintained a significant loss each year from operations. One way to explain this difference is that Blackboard’s used funds for corporate acquisitions, thus fueling growth, while Instructure invested funds into sales & marketing and organic growth. This is not the whole story, but it is a big difference between the two companies.
    • In market share represented as a percentage, Blackboard’s growth was much faster, but this was in a period where the market was developing and not all schools had a standard LMS. When viewing this market share in raw numbers, we see that Instructure’s growth would have exceeded Blackboard’s were it not for the Year 9 WebCT acquisition.
    • Blackboard was already showing organic market declines (in NAHE market share %) and slowdowns in raw numbers outside of the immediate WebCT acquisition of customers. Instructure’s organic growth shows no signs yet of slowing down, is less lumpy and more predictable.


  • Preliminary Data on K-12 LMS Market

    Preliminary Data on K-12 LMS Market

    Over the past several months, we have worked with our partners at LISTedTECH as they ramp up their efforts to collect data on LMS usage in the K-12 market in the United States. This is a massive effort as the market includes more than 130,000 individual public and private schools, and more than 13,600 school districts, according to recent NCES documentation. We are aware of several private data sources with estimates on the K-12 LMS market, but there are no public sources.

    Part of the challenge is that the K-12 market is messier than higher education’s and its roughly 7,200 institutions. One reason is that the general IT infrastructure in K-12 is less mature than in higher ed, and for smaller schools there are a lot of ad hoc implementations running on a local server not even in a data center. Another reason is the availability of free options such as Google Classroom, or freemium options such as that offered by Schoology and Canvas for individual faculty.

    As we build up the data and improve our methods, we believe we are starting to see some interesting trends in the data worth sharing.

    Our initial sample looks at 6,875 public schools from across the country in the NCES-designated primary, middle, high and other (special ed, vocational or alternative) categories. These results were analyzed over several data collection methods along with manual evaluation of that data. That said, we expect to see movement in the numbers as we collect and verify additional data, including LMS usage at private schools.

    As in our analysis of the higher ed market, we are focusing on school-wide implementations of LMS platforms. At many K-12 schools, in the absence of a school-wide implementation, individual teachers opt to use an LMS for their particular classroom, often for free. We do not consider this case a school-wide adoption and therefore do not include those use cases in our data. This methodology does not fully analyze total usage of a platform like Schoology that has a freemium model, including a free option for individual teachers and an enterprise solution which is a school-wide adoption based on a fee per student model. A platform like Google Classroom likewise has usage by individual teachers as well as school-wide implementations.

    Before we share the preliminary data, some caveats are in order to hopefully avoid anyone misrepresenting this information:

    • This is preliminary data that will likely change as we learn more. While we believe there are some broad trends already emerging, there will be refinements as we increase our coverage over time. We expect the changes to be in small adjustments to specific numbers but not in big changes to market shape.
    • This view is based on number of schools that have implemented an LMS, which is a different metric than district-wide implementations (where many or most of the purchasing decisions occur) or implementations scaled by student enrollments. We will add these views in the future.
    • This view is based on installed base (which represents total estimated deployments), which is different than new implementations in a given time period (which would measure market momentum). Again, we will add these views over time, just as we have done for the higher ed LMS market.
    • Due in particular to the free options available in K-12, there will be schools that have more than one LMS available at the institutional level. Google Classroom in particular is often available as an option at a school even when there is another LMS.
    • As is our practice at e-Literate, we’ll describe the caveats and present the data as is. As we learn more, if the relative percentages change significantly, we will share updates.
    • For more information on our data methods, see this post.

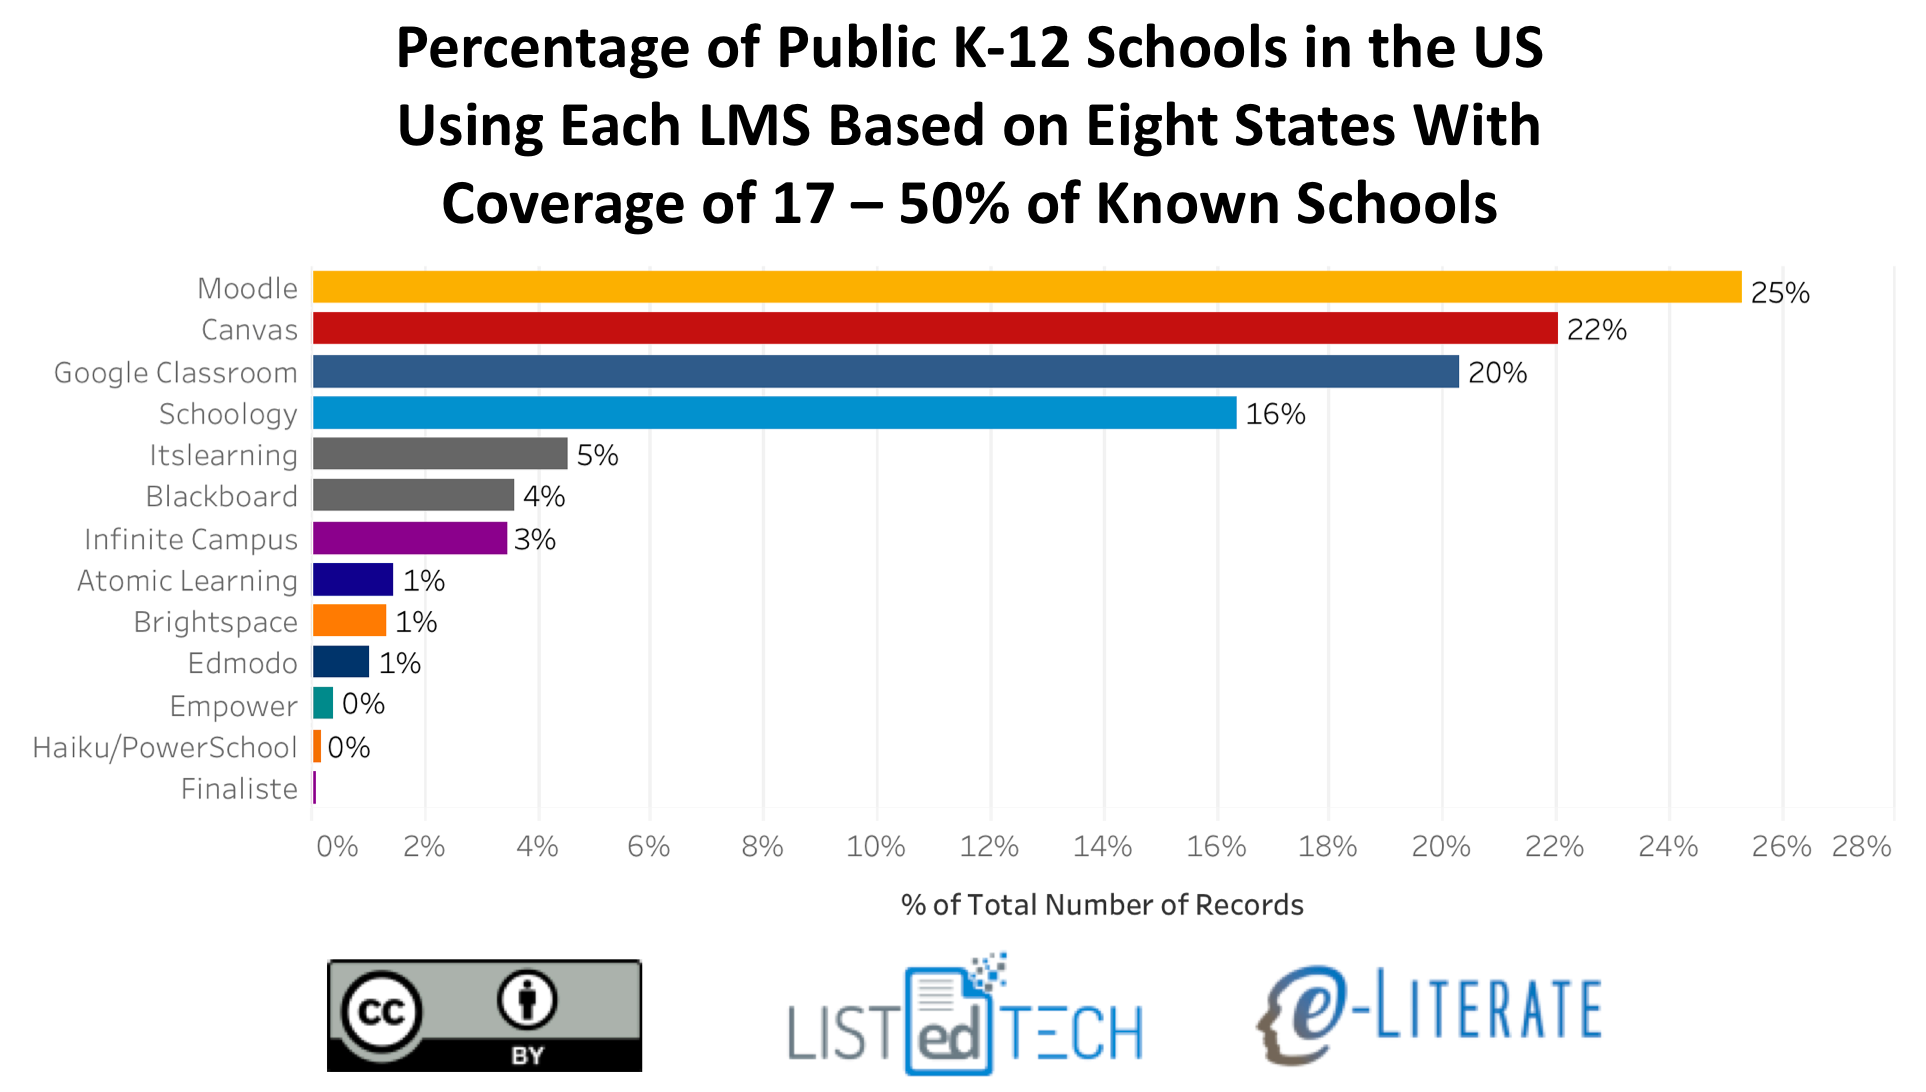
    The first graph presents a view of K-12 school-wide LMS implementations in the United States for the 8 states (and DC) where we have at least 17% coverage of known schools (Alaska, Delaware, District of Columbia, Florida, Massachusetts, Minnesota, Texas, Wisconsin).

    LMS Market Share for K-12 in US, 8 States

    To get a sense of how representative this initial market share is, we made the same calculations across all 6,875 schools from 50 states and DC that in our data thus far. The data for each LMS matched within ~2% for each LMS (e.g. Canvas went from 22% to 24%, Moodle went from 25% to 24%) between the two views.

    As in the higher education market, there appears to be four top contenders in K-12 – Moodle, Canvas, Google Classroom, and Schoology – with all others having 5% or less of market share. Moodle and Canvas are both present in the Big Four for both higher education and K-12, but in K-12 Google Classroom and Schoology are the other big players. We believe that this is the first data set showing just how widely Google Classroom has been adopted. ((Disclosure: Instructure, Schoology, Blackboard, and D2L are subscribers to our LMS Market Analysis service; Instructure and Blackboard also are sponsors for an upcoming event we are organizing.))

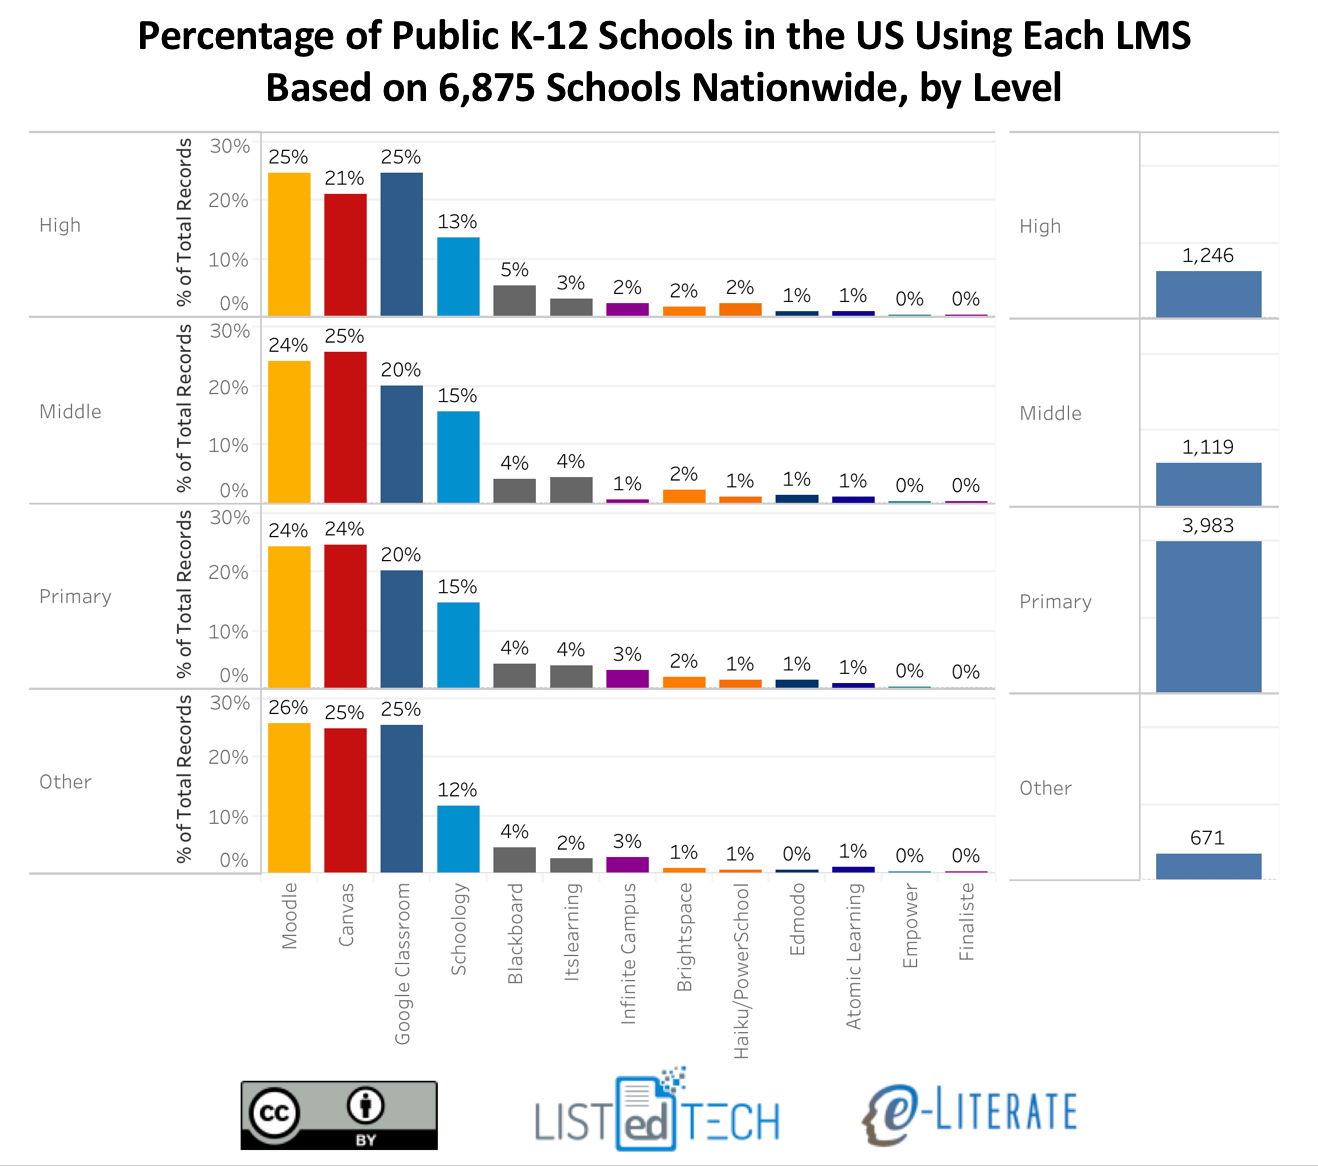
    The general distribution is somewhat consistent across school levels – primary, middle, high school, and others – with some interesting smaller variations. The following view also gives a sense of our relative data coverage by level. In this case we are using all our data across the 6,875 schools. Note that totals are higher than this number due to multiple systems being available at some schools.

    LMS Market Share for US K-12, By Level

    We hope this new data provides a broader view of the academic LMS market. We’d love to hear your feedback and questions.

  • A Note on Data Used for LMS Market Analysis

    A Note on Data Used for LMS Market Analysis

    Recently Martin Dougiamas of Moodle has questioned our data analysis for the LMS market. In some useful notes posted at Moodle.com on two recent Future Trends Forums hosted by Bryan Alexander:

    Bryan finished the Future Trend Forum by asking for Martin’s thoughts on the recent article by Phil Hill titled: “Whither Moodle?” [edited] which speculated that Moodle’s growth is slowing down and hitting a plateau.

    Martin commented that is not the case from what he is seeing and that a lot of the information contained in the article is US-based where there a lot of more LMS vendors and venture capitalists building learning platforms.

    While this description from Martin is inaccurate, the issues raised are representative of some of the questions we occasionally get about our data for our LMS market analysis service. I think it would be useful to share a deeper description in public of how our partners at LISTedTECH collect and organize the underlying data.

    What We Measure

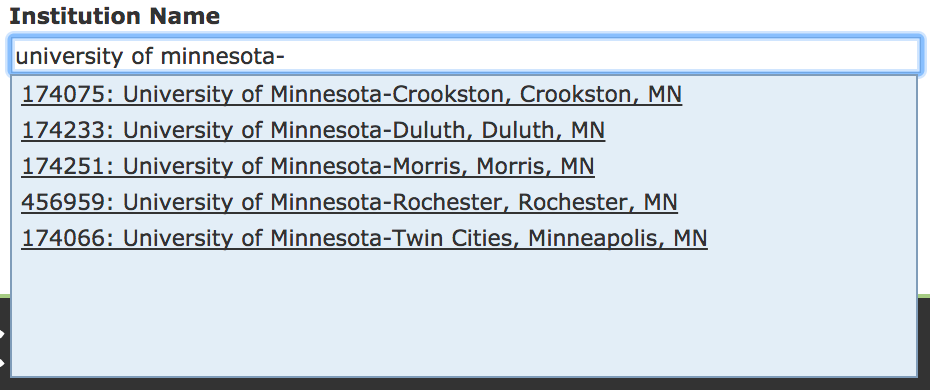
    The market data are organized in a dataset that captures system usage on a per higher education institution basis. For most schools, a campus is equivalent to an institution. But there are also cases where there multiple campuses per university (e.g. University of Minnesota system with five campuses, or DeVry University with dozens of campuses) and the LMS decision is made at the system level. In these situations, one decision will lead to multiple institutions listed in the data. In the US, the definition of an institution is guided by unique identifiers in the Department of Education’s IPEDS data, and each region or even country has its own way of defining institution.

    The dataset goes beyond “school X uses system Y”, as it also includes dates of implementation and decommission, usage as primary or secondary system (there may be more than one system in use at a school), and hyperlinks to the public information documenting a system selection or usage. The definition of institutions includes information about its sector (public two-year, private non-profit four-year, etc) as well as student enrollments.

    How We Measure

    Looking deeper at LMS selection, there are multiple layers of data gathering at different intervals. Some of the sources:

    • Extensive search engine notification such as Google Alerts on product keywords in multiple languages;
    • URL and domain scrapers looking for system information at official school websites; and
    • Targeted human-directed searches.

    Each new data point is verified by someone using the associated hyperlinks tied to selection or usage data.

    Our North American data is essentially saturated, in that we know the vast majority of degree-granting institutions based on US Department of Education data or Canadian provincial governmental data. We have well above 90% of all schools in the dataset.

    For the global regions outside of North America, we are building up the dataset and do not have saturated coverage yet. For example, in Europe we estimate that we have 60 – 75% of institutions. We have less than that in Latin America and more than that in Oceania.

    Where feasible, we include on-the-ground subjective coverage by visiting the global regions, testing theses, finding out unique context, and finding local sources who can provide QA to our data.

    Besides our home base of North America, we have made multiple trips to Europe and Latin America thus far, and we are currently arguing about who gets to visit Australia and New Zealand.

    We plan to expand coverage to additional regions as we develop at least 30% coverage of institutions and have time to do additional research to back up our analysis.

    Degrees of Uncertainty

    Because higher education data is lumpy and based on extended implementation times, we offer the following caveats:

    • Market share information provided in percentages and trends are more reliable than absolute counts outside of North America. When we do provide absolute numbers, we advise caution for readers or subscribers to not over-interpret the absolute numbers, at least without us providing additional details to keep the data in context.
    • We typically separate North American data from Rest of World data (Europe, Latin America, Oceania) to avoid problem of North America numbers dominating aggregates and obscuring important regional differences.
    • When we have system usage information but do not have accurate implementation dates (per month or quarter), we assign these system records to June. Therefore the summer data for new systems will appear artificially high. We currently have implementation dates for approximately 75% of the listed LMS records.
    • Put another way, annual data is more reliable (i.e. without additional data collection noise) than half-year or quarterly data. The more-granular data is provided to certain subscribers, but we take great care in attempting to describe sources of “lumpiness” in the data that should be understood for any analysis.

    Overall, we have LMS data for 4,523 institutions in the US and Canada and 8,824 institutions worldwide.

    Back to the Future (Trends)

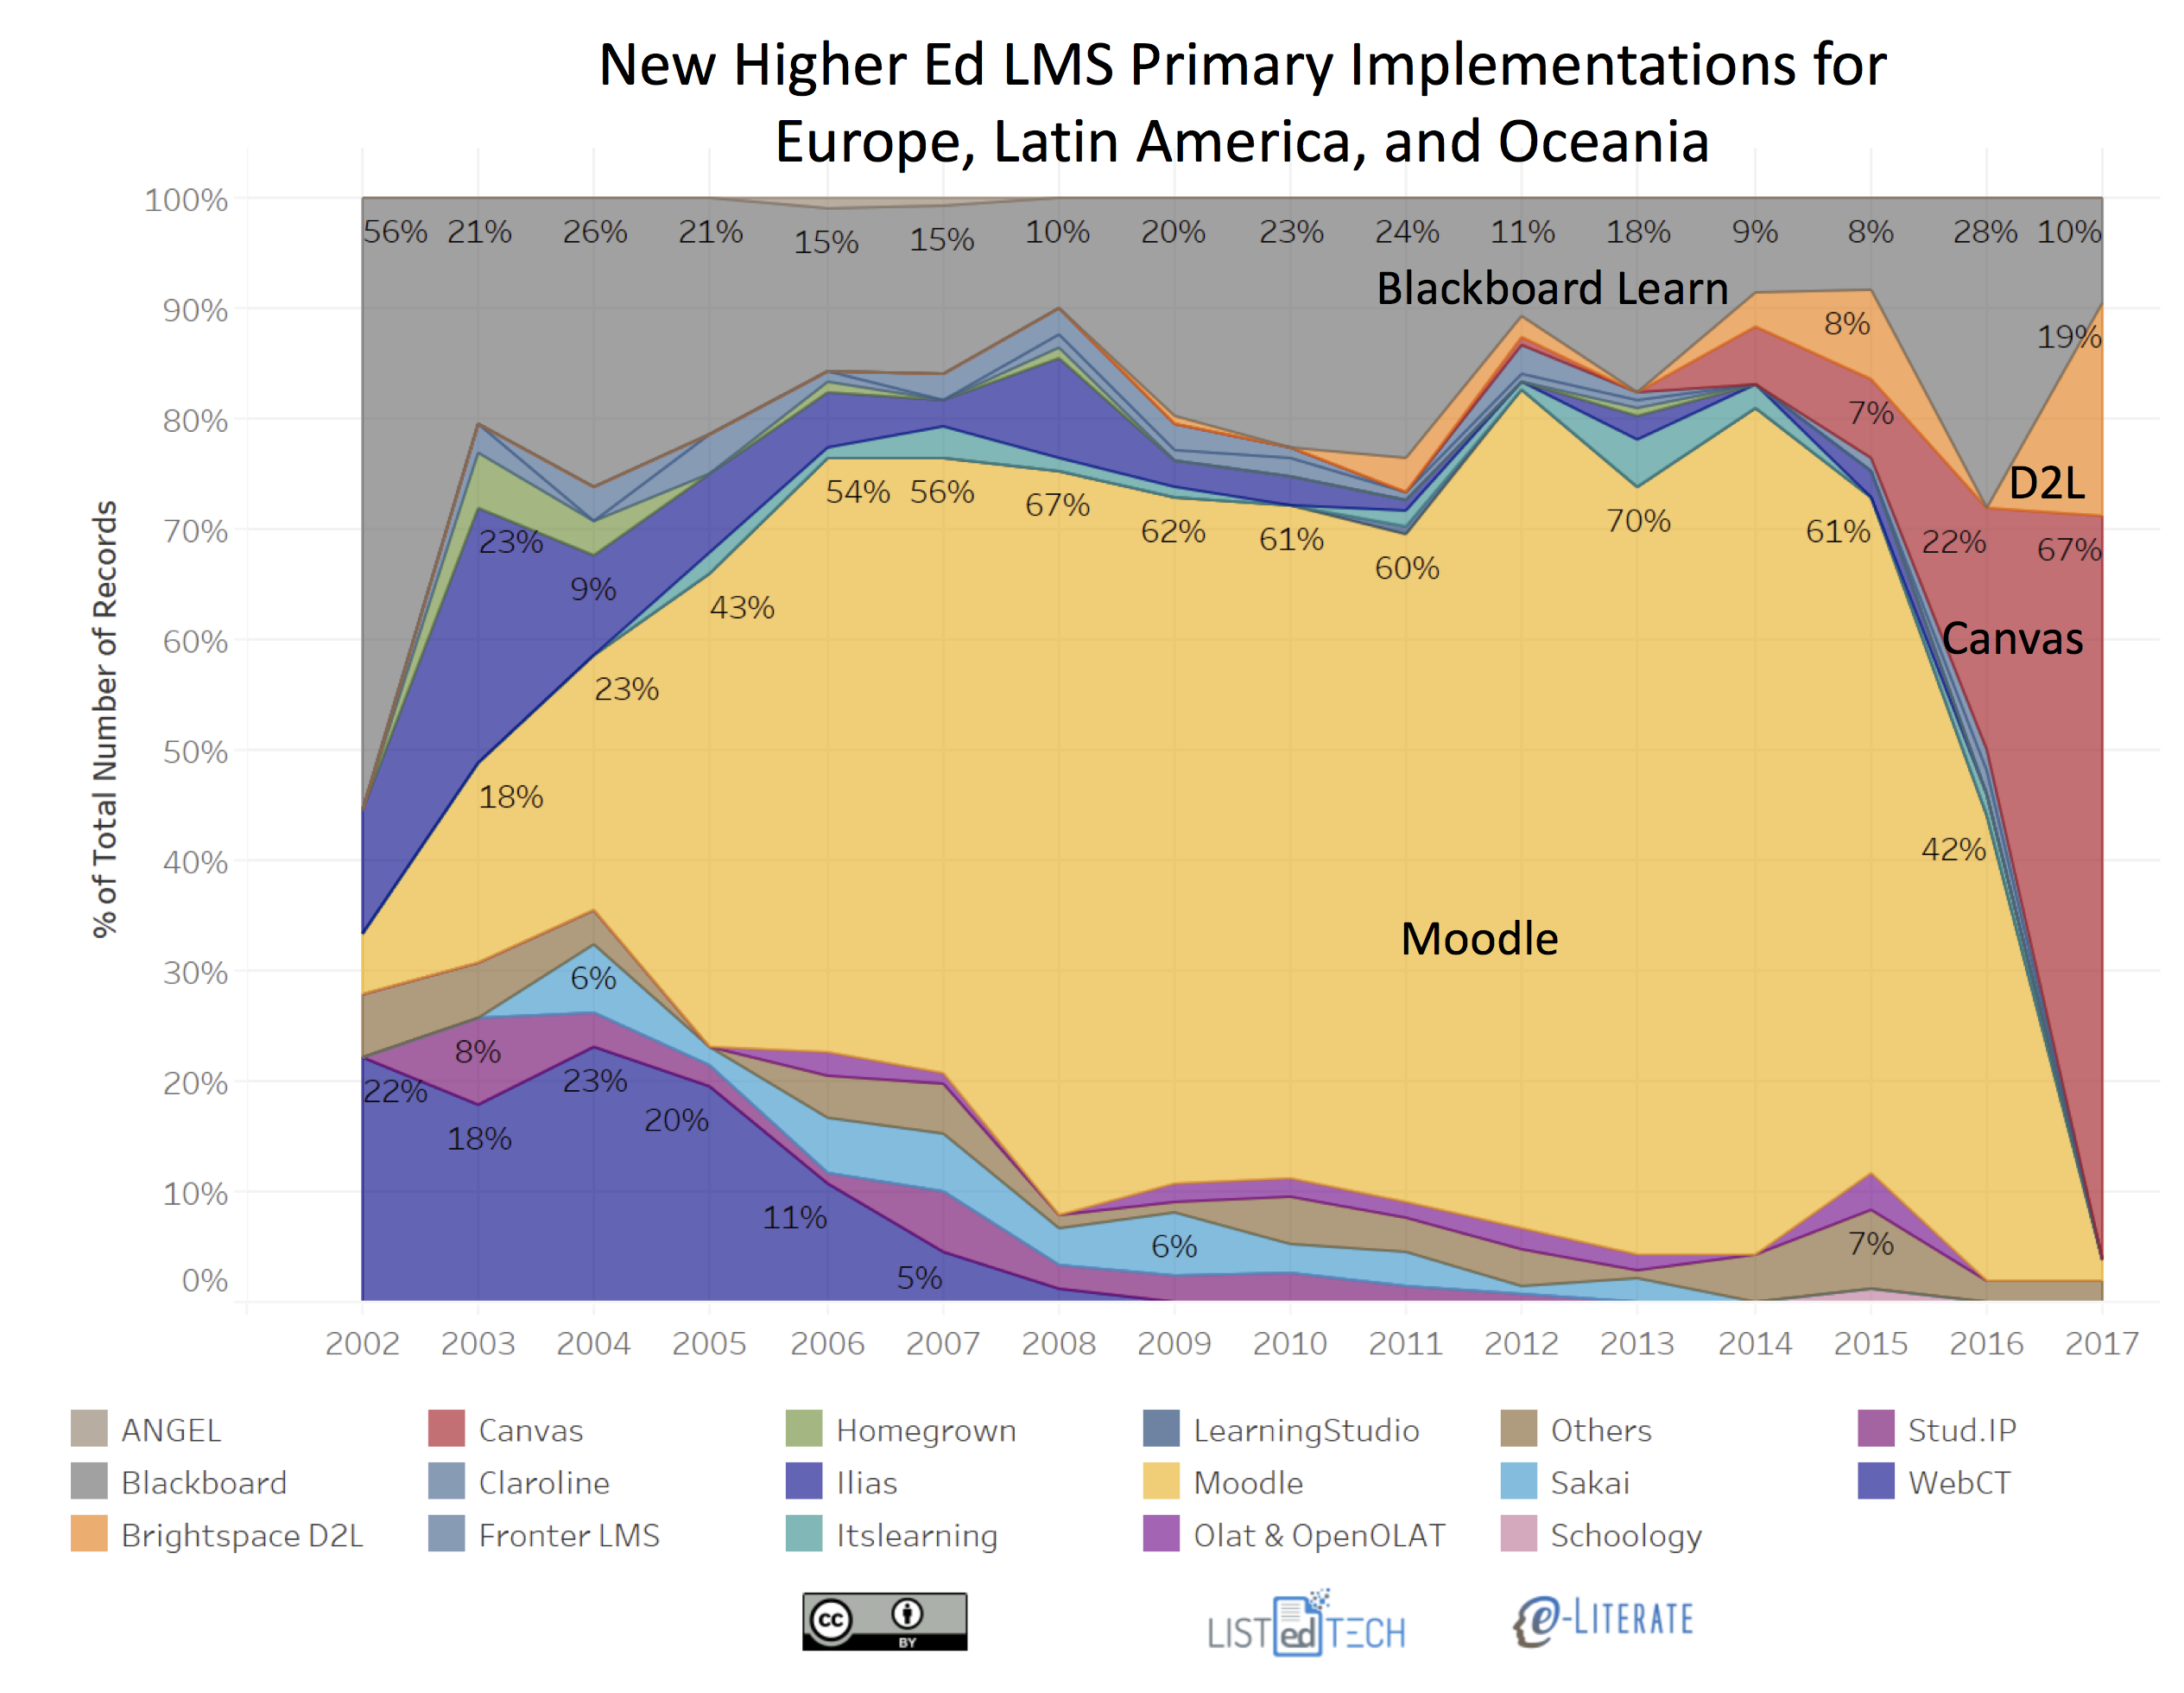
    To see these issues with an example, consider the updated chart of new implementations that led to the Future Trends Forum discussion described above.

    What is relevant to the dataset for this chart:

    • The data is based not on North American data – it is based on data from Europe, Latin America, and Oceania (Australia, New Zealand, and surrounding island countries).
    • The data comes from public sources per institution as described above and does not come from vendors;
    • The data is for primary systems – the official campus LMS; and
    • The caveats listed above should apply. Note that we identified a new trend early in 2017 (collapse of Moodle new implementations) that we can update with data through 10 months of the year – the data today is more solid than it was in early summer.

    I hope this description will answer some of the questions people have asked about our data.

  • State of Higher Ed LMS Market for US and Canada: Fall 2017 Edition

    State of Higher Ed LMS Market for US and Canada: Fall 2017 Edition

    Now that we’re past the 2017 WCET conference and headed to the EDUCAUSE conference, let’s look at updates on the institutional LMS market for North America (US and Canada). Last year we started our LMS market analysis service, where we are working with LISTedTECH to provide market data and visualizations, and our fall report for subscribers will be released in about a month. Data for 2017 presented below goes through October 1 of this year.

    We present the data “by institutions”, with market share as a percentage of the total number of institutions using each LMS as a primary system, and “by enrollments”, where we scale the institutions by their total enrollment. The latter better captures the business of the LMS market, since most licensing deals are based the number of students. We have also included data from Fall 2016 by institutions for comparison purposes.

    Some notes on the market share as defined by percentage of institutions:

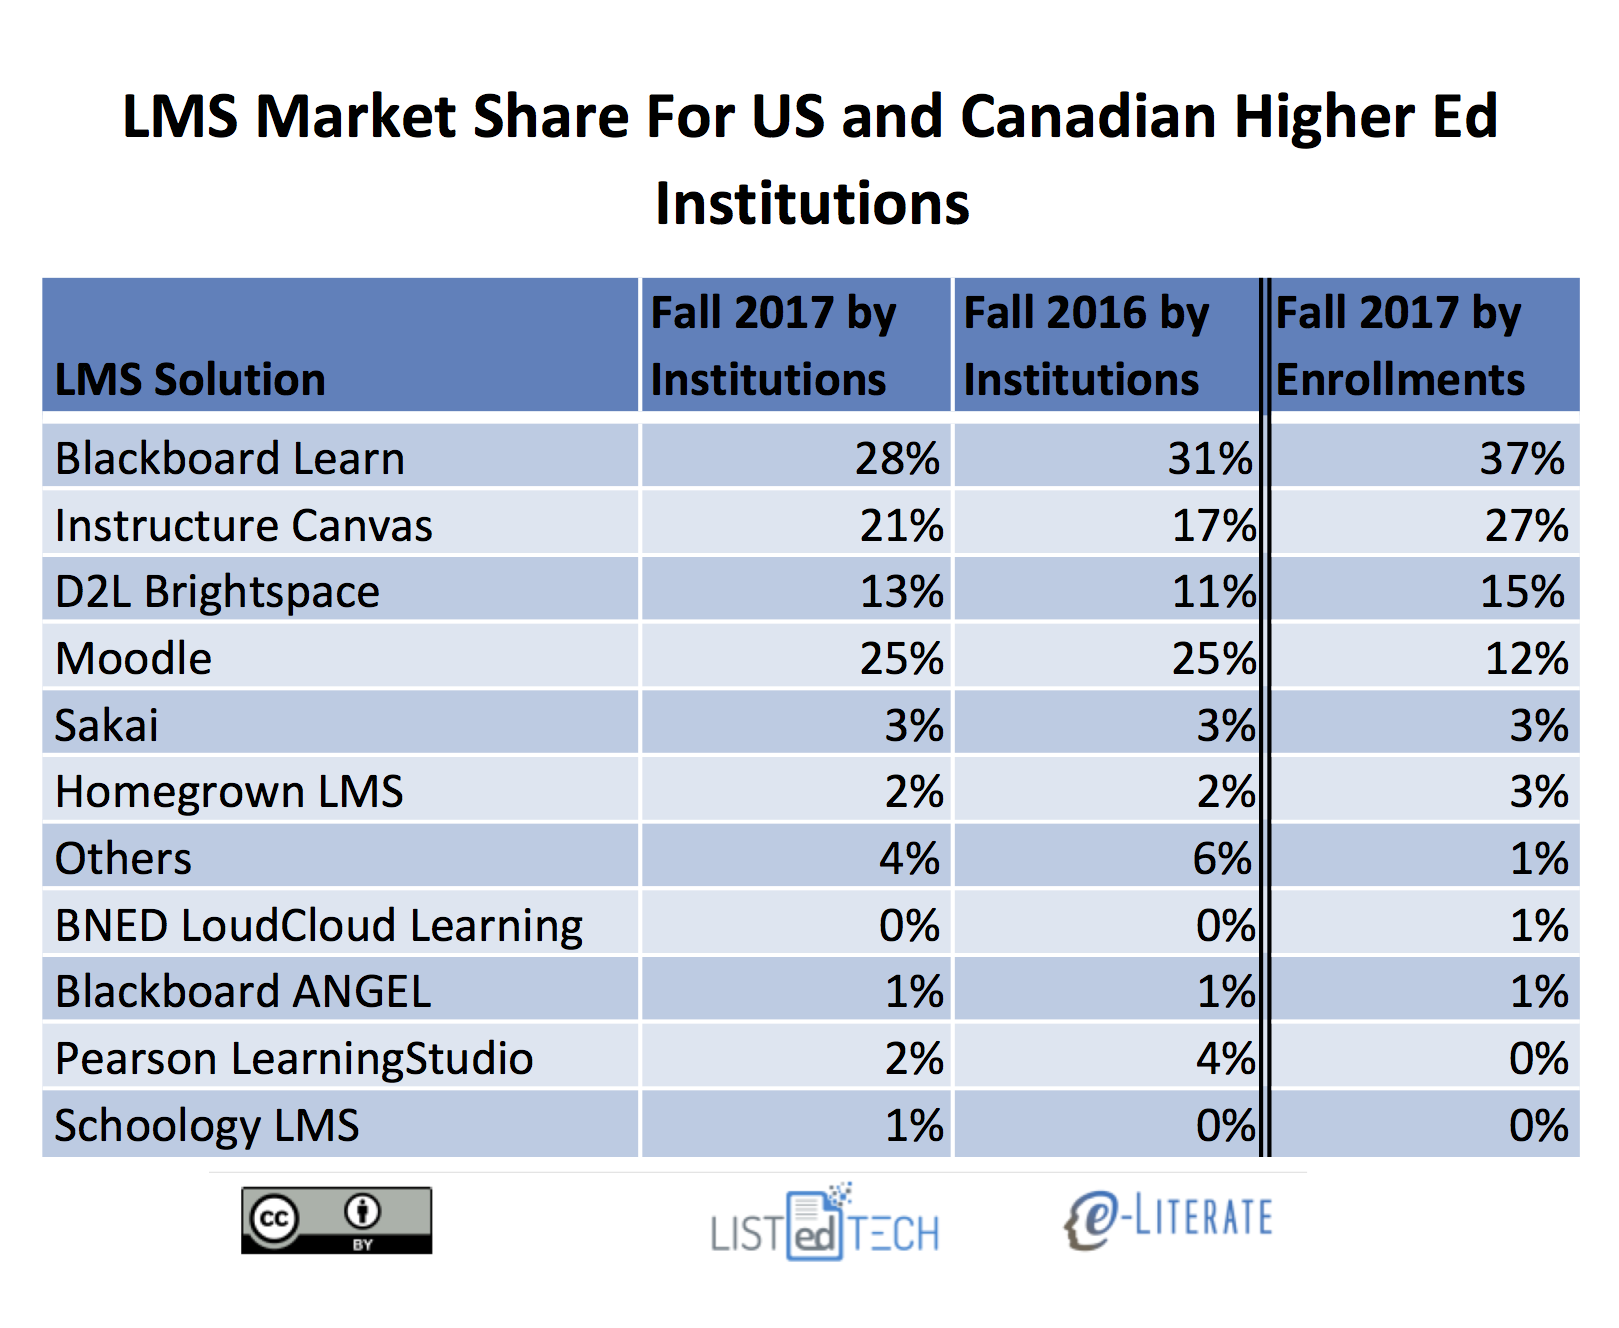
    • In terms of new selections the market continues to be a two-horse race recently with Canvas by Instructure and Brightspace by D2L as the only two solutions with material gains in market share. Canvas grew from 17% to 21% , and Brightspace from 11% to 13%, of the market.
    • Outside of the big four – Blackboard Learn, Canvas, D2L Brightspace, and Moodle – no other system has more than 3% of the market measured either by percentage of institutions or percentage of enrollments. Furthermore, the category of “Others”, capturing systems not listed above and having less than 1% market share, actually dropped from 4% to 2% of the market. This indicates that continued market consolidation.
    • Schoology and BNED LoudCloud grew slightly, but not nearly to the degree of the Canvas and Brightspace.
    • Blackboard Learn fell the farthest, from 31% to 28% of of the market. The second biggest drop was Pearson LearningStudio, from 4% to 2%, based on its end-of-life notice for December 2017.
    • Moodle and Sakai both lost market share of just under 1%, not enough to show up in the rounded numbers in the table but enough to show up in our underlying data.
    • The difference in Moodle’s market share by institutions at 25% and by enrollments at 12% really shows how concentrated their usage is for smaller schools.
    • When viewing market share as defined by percentage of enrollments, Blackboard and Canvas are the most-used systems, at 37% and 27% of the market, followed by D2L at 15% and Moodle at 12%.

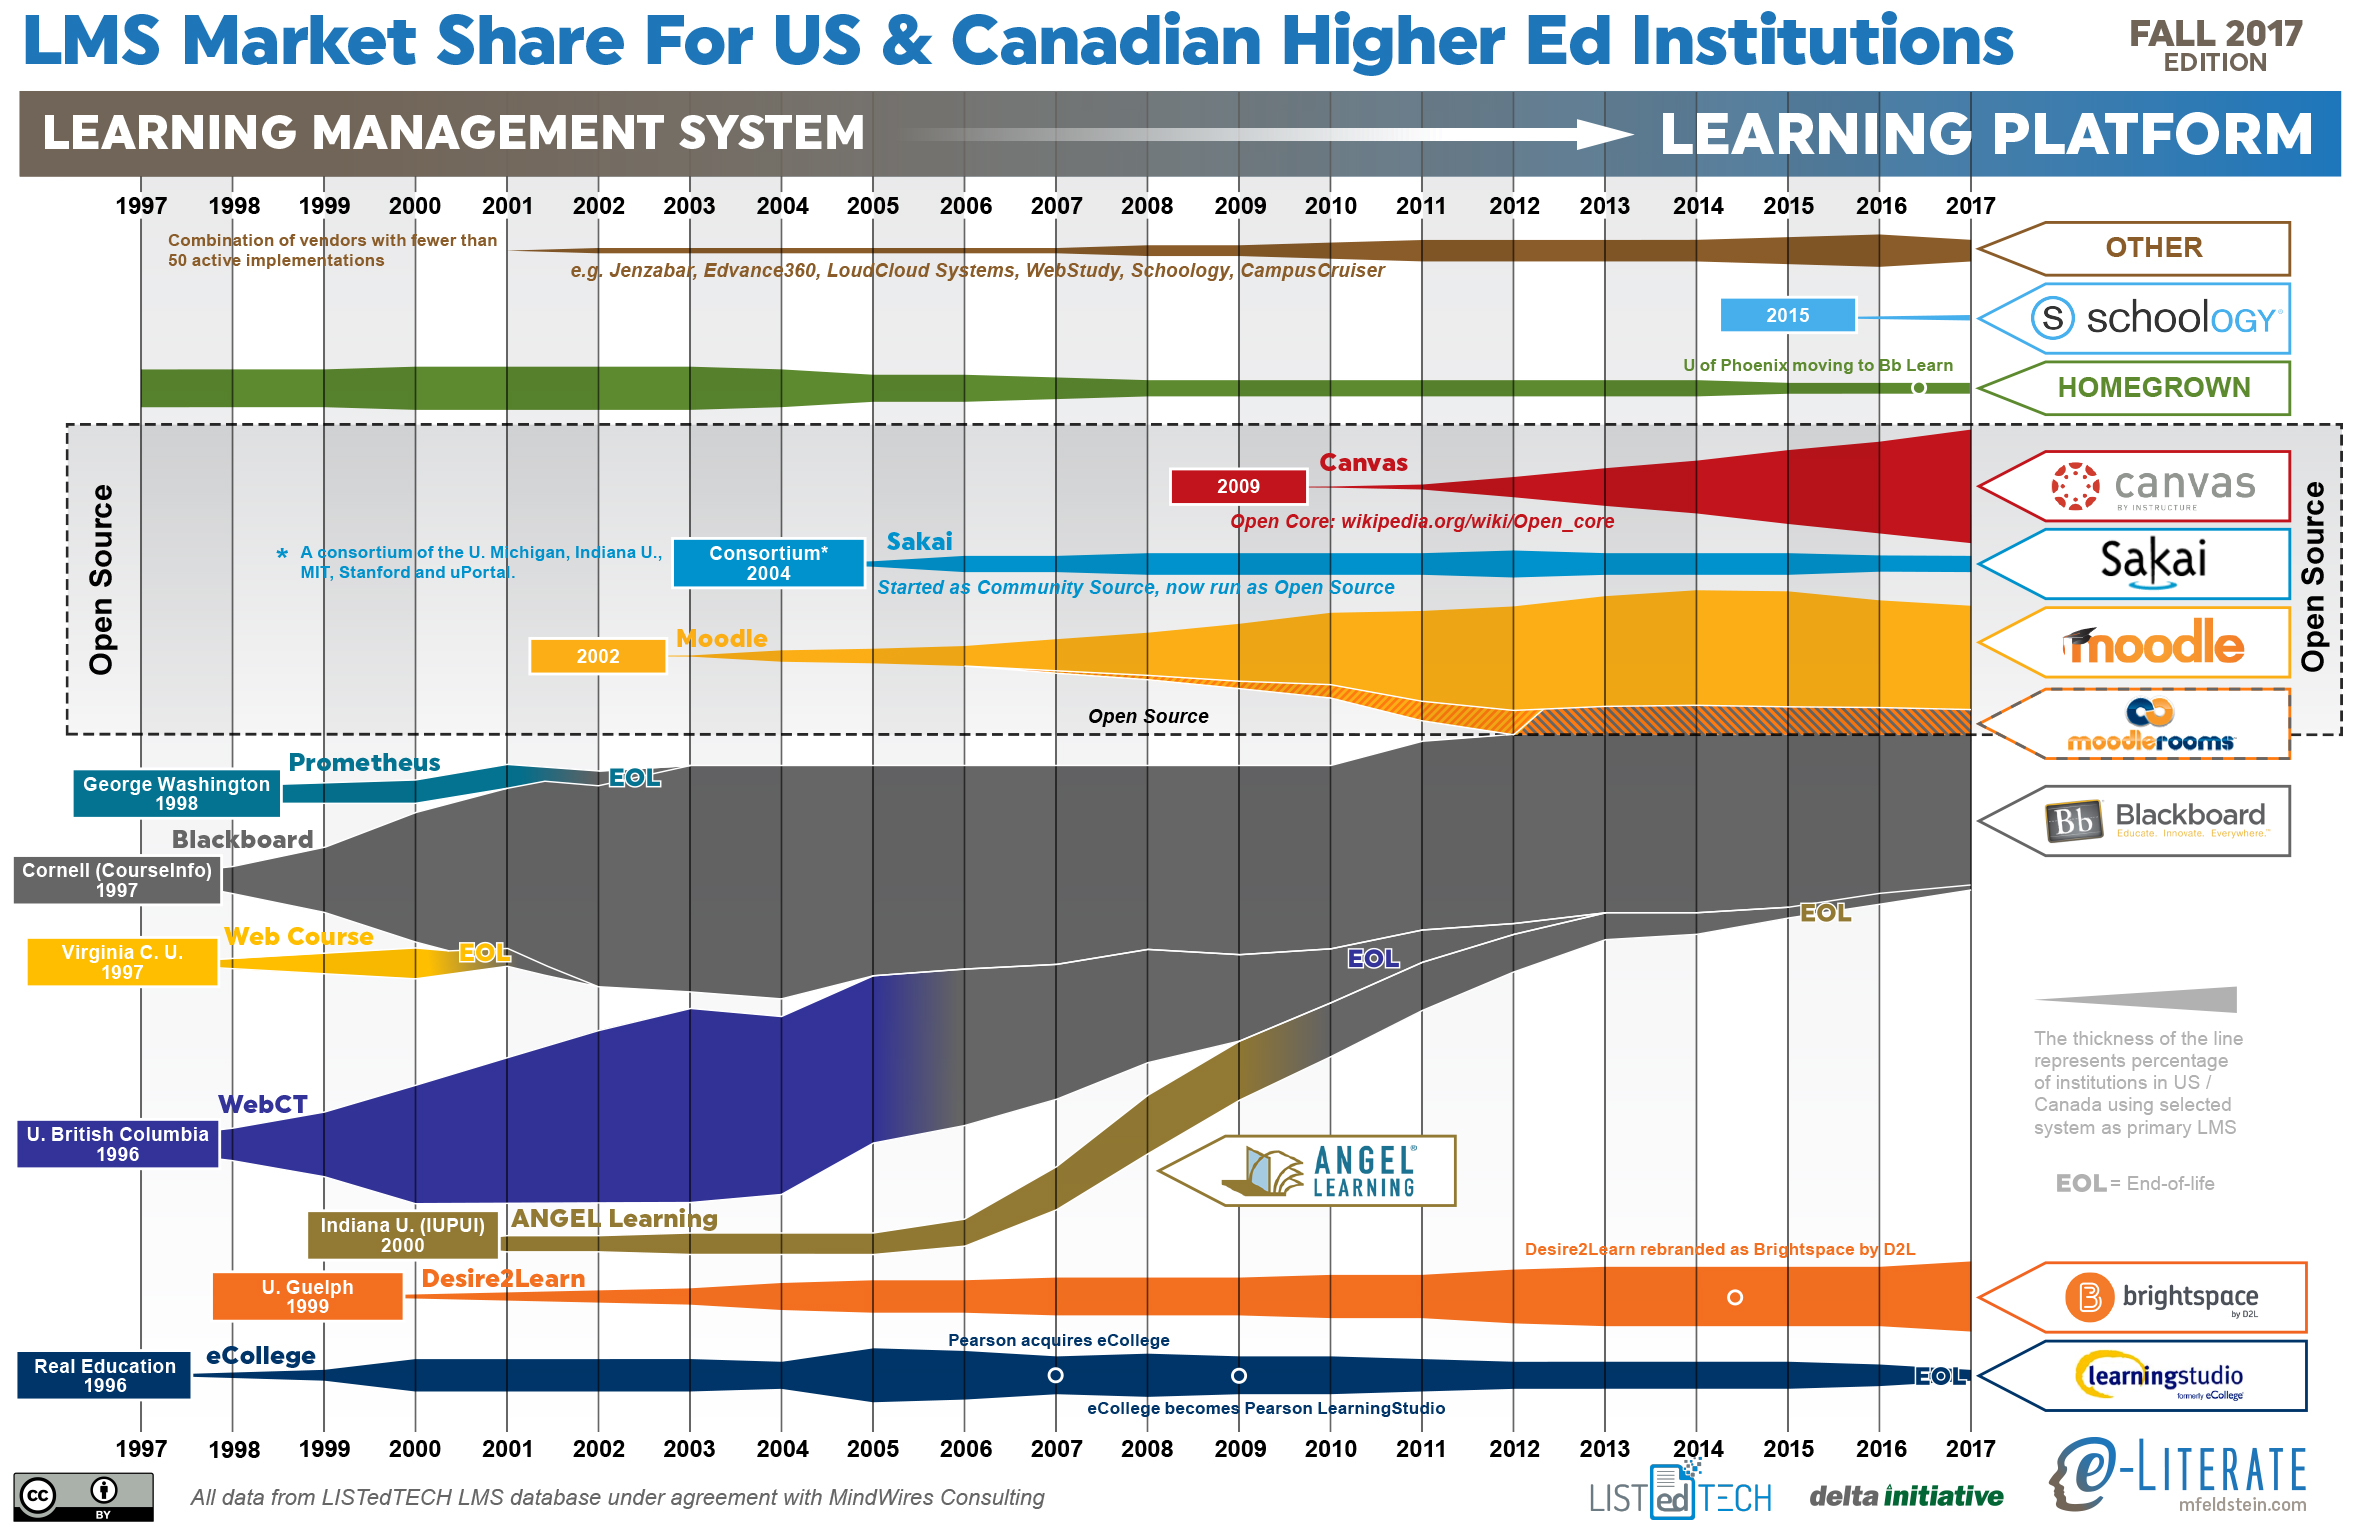
    Stepping back from the immediate data, let’s look at an updated LMS market share graphic, commonly known as the squid graphic, for US and Canadian higher education. The original idea remains – to give a picture of the LMS market in one page, highlighting the story of the market over time. The key to the graphic is that the width of each band represents the percentage of institutions using a particular LMS as its primary system.

    Some additional notes:

    • Blackboard and Moodle have been the market leaders as number one and two in share as they have been for the past decade. However, Canvas is quickly approaching Moodle’s market share.

    We’ll share any updates we discover at the conference this week.

  • Unizin Membership Now Set As Annual Fee Of Up To $427.5k

    Unizin Membership Now Set As Annual Fee Of Up To $427.5k

    I’ve been meaning to provide an update on Unizin now that the consortium is three years old (started officially in July 2014). Thanks to public documents from the University of Minnesota, one of the 11 founding members, we now have additional clarity on the ongoing costs to remain a member of Unizin.

    Membership Fees

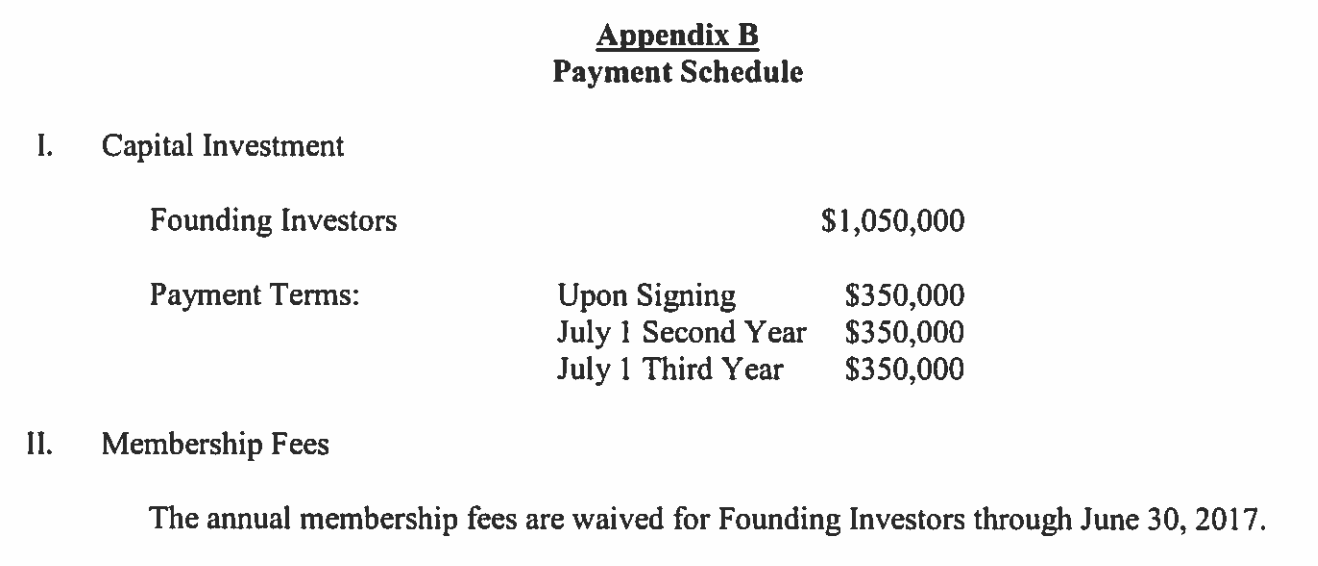
    For some background, Colorado State University staff back in April 2014 described the $1,050,000 initial fee in their meeting minutes for the University Technology Fee Advisory Board:

    3. Will this decrease overall costs on our end through collaboration?
    a. We are investing $1 million up front, but there is about a 7-year payback. We are investing in a $10 million product since the other 9 universities are putting their money in as we are too. This will absolutely decrease our costs.

    One year later, when the Florida State University System joined Unizin as associate members, we noted this item from the University of Florida / Unizin Consortium Membership Agreement:

    We noted at e-Literate in our article from 2015:

    Does this mean that founding institutions that “invested” $1.050 million over three years will have to start paying annual fees of $100,000 starting in June 2017? That’s my assumption, but I’m checking to see what this clause means and will share at e-Literate.

    Update (7/17): I talked to Amin Qazi today (CEO of Unizin) who let me know that the annual membership fee for institutional members (currently the 11 schools paying $1.050 million) has not be determined yet.

    Fast forward to 2017 and we have an answer. The University of Minnesota has to submit purchases over $1 million to its board of regents for consent, and at the July 2017 meeting the new Unizin membership fees were presented:

    To Unizin, Ltd. for $1,282,500 for a three-year renewal of membership in the higher education consortium for the Office of Information Technology (OIT) for the period July 1, 2017, through June 30, 2020. The annual payment of membership fees will be covered from OIT’s central O&M funds. The FY18 budget includes planning and funding for this expense.

    That equals $427,500 per year for the next three years for the 70,000+ enrollment university. What this now makes clear is that the up-front investment in Unizin was not a one-time fee broken up into three easy payments. Unizin member has an ongoing annual fee set in three-year periods.

    I again asked Amin Qazi for clarification, including whether all Unizin members were now paying the higher fee ($427.5k vs. $350k for initial three years). Amin confirmed via email:

    Unizin is a non-profit organization and seeks to cover its costs. We have found that our cost to provide our services and tools somewhat scale with the size of the institution. The Unizin Founding Member Fees have been adjusted after the initial three year period. So while larger institutions do pay more, smaller institutions pay less. We anticipate further adjustments as we grow and are able to recognize even greater economies of scale.

    I would then assume that the University of Minnesota, along with University of Michigan and Penn State University, are paying at the highest level and more than $350k, and that smaller schools like the University of Iowa and the University of Nebraska are paying less than $350k.

    LMS Fees

    The same University of Minnesota document also describes their costs for the Canvas ((Disclosure: Instructure is a subscriber to our market analysis service.)) LMS based on the Unizin agreement.

    To Unizin, Ltd. for $5,023,000 for a purchase of Canvas Learning Management System (LMS) for the Office of Information Technology (OIT) for the period July 1, 2017 through June 30, 2022. [snip]

    Unizen [sic], on behalf of its member institutions, conducted a competitive Request for Proposal followed by a detailed evaluation process. Through this process Canvas by Instructure was selected as a Learning Management System (LMS). The University then conducted a two year pilot of Canvas and a majority of the stakeholders preferred Canvas to the University’s current LMS, Moodle. Most of the Big Ten schools have adopted or are adopting Canvas.

    The University receives an additional 30% discount by purchasing Canvas through Unizen [sic] rather than purchasing directly through Infrastructure [sic] and 3% caps on annual increases, rather than 5%, has been negotiated.

    This five-year deal comes out to $12 – $14 per student per year. The document does not specify what level of support they have chosen, although they describe a “dedicated test server”.

    New Associate Members

    In other news, Unizin announced in July that the University of Nebraska system has joined as associate members.

    The Unizin Consortium is thrilled to welcome the full University of Nebraska system, bringing the total number of institutions in the consortium to 25. With the addition, the University of Nebraska at Kearney, University of Nebraska at Omaha, and University of Nebraska Medical Center join Unizin Founding Member the University of Nebraska Lincoln.

    Note that associate members do not pay the same amount as full members. In Florida, the State University System deal costs each associate member $100k per year.

    We’ll likely give updates at e-Literate after the EDUCAUSE conference on how Unizin has evolved in terms of services and potential new members. But for now we at least have more clarity on the financial terms of the consortium.