e-Literate

Present is Prologue

Tag: MOOC

  • Back To The Future: Looking at LMS forecasts from 2011 – 2014

    At today’s Learning Analytics and Knowledge 2015 conference (#LAK15), Charles Severance (aka Dr. Chuck) gave the morning keynote organized around the theme of going back in time to see what people (myself and Richard Katz primarily) were forecasting for education. By looking at the reality of 2015, we can see which forecasts were on track and which were not. I like this concept, as it is useful to go back and see what we got right and wrong, so this post is meant to provide some additional context particularly for LMS market. Chuck’s keynote also gives cover for doing so without seeming too self-absorbed.

    But enough about me. What do you think about me?

    I use the term forecast since I tend to describe patterns and trends and then try to describe the implications. This is different than the Katz video which aimed to make specific predictions as a thought-provoking device.

    Pre-2011

    I introduced the LMS squid diagram in 2008 as a tool to help people see the LMS market holistically rather than focusing on detailed features. Too much of campus evaluations then (and even now) missed the big picture that there were only a handful of vendors and some significant market dynamics at play.

    A 2009 presentation, by the way, was the basis for Michael and me connecting for the first time. Bromance. (more…)
  • The Battle for Open and MOOC Completion Rates

    Yesterday I wrote a post on the 20 Million Minds blog about Martin Weller’s new book The Battle for Open: How openness won and why it doesn’t feel like victory. Exploring different aspects of open in higher education – open access, MOOCs, open education resources and open scholarship – Weller shows how far the concept of openness has come, to the point where “openness is now such a part of everyday life that it seems unworthy of comment”. If you’re interested in OER, open courses, open journals, or open research in higher education – get the book (it’s free and available in a variety of formats).

    Building on the 20MM post about the ability to reuse or repurpose the book itself, I would like to expand on a story from early 2013 where I happen to play a role. I’ll mix in Weller’s description (MW) from the book with Katy Jordan’s data (KJ) and my own description (PH) from this blog post.

    (MW) I will end with one small example, which pulls together many of the strands of openness. Katy Jordan is a PhD student at the OU focusing on academic networks on sites such as Academia. edu. She has studied a number of MOOCs on her own initiative to supplement the formal research training offered at the University. One of these was an infographics MOOC offered by the University of Texas. For her final visualisation project on this open course she decided to plot MOOC completion rates on an interactive graph, and blogged her results (Jordan 2013).

    (more…)

  • Upcoming EDUCAUSE Webinars on Dec 4th and Dec 8th

    Michael and I will be participating in two upcoming EDUCAUSE webinars.

    Massive and Open: A Flipped Webinar about What We Are Learning

    On Thursday, December 4th from 1:00–2:00 p.m. ET we will be joined by George Siemens for an EDUCAUSE Live! webinar:

    In 2012, MOOCs burst into public consciousness with course rosters large enough to fill a stadium and grand promises that they would disrupt higher education. Two years later, after some disappointments, setbacks, and not a small amount of schadenfreude, MOOCs seem almost passé. And yet, away from the sound and the fury, researchers and teachers have been busy finding answers to some basic questions: What are MOOCs good for, and what can we learn from them? Phil Hill and Michael Feldstein will talk about what we’re learning so far. (more…)

  • LISTedTECH: New wiki site and great visualizations

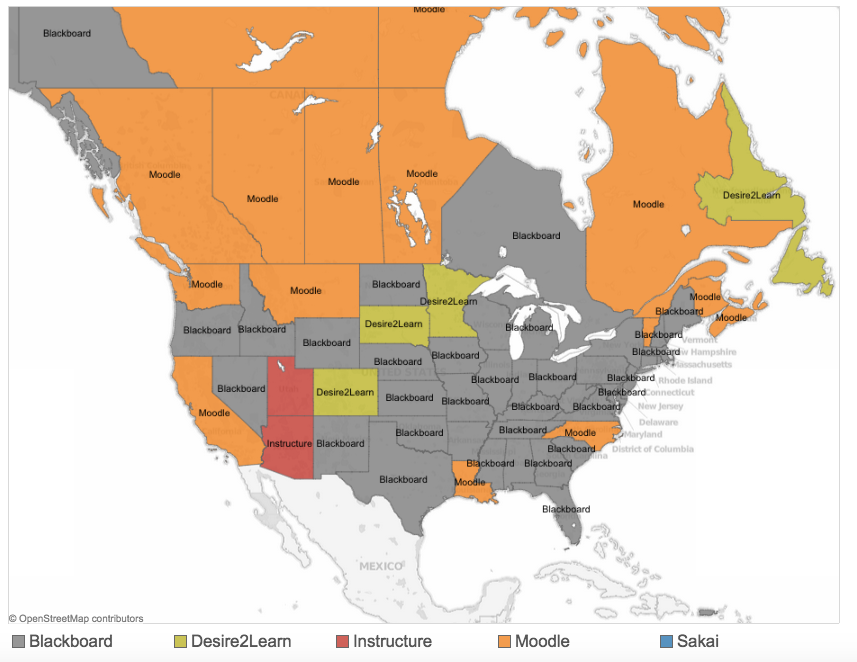
    Last year I wrote about a relatively new site offering very interesting data and visualizations in the ed tech world. LISTedTECH was created by Justin Menard, who is Business Intelligence Senior Analyst at University of Ottawa. First of all, the site is broader in scope than just the LMS – there is a rich source of data & visualizations on MOOCs, university rankings, and IPEDS data. Most of the visualizations are presented by Tableau and therefore interactive in nature, allowing the user to filter data, zoom in on geographic data, etc. Since e-Literate is not set up for full-page visualizations, I have included screen shots below, but clicking on the image will take you to the appropriate LISTedTECH page.

    Top_Learning_Management_System__LMS__by_State_or_Province_-_LISTedTECH

    (more…)

  • Keynote: The Year After the Year of the MOOC

    Here’s a talk I gave recently at the CIT event in Duke. In addition to being very nice and gracious, the Duke folks impressed me with how many faculty they have who are not only committed to improving their teaching practices but dedicating significant time to it as a core professional activity.

    Anyway, for what it’s worth, here’s the talk:

  • State of the US Higher Education LMS Market: 2014 Edition

    I shared the most recent graphic summarizing the LMS market in November 2013, and thanks to new data sources it’s time for an update. As with all previous versions, the 2005 – 2009 data points are based on the Campus Computing Project, and therefore is based on US adoption from non-profit institutions. This set of longitudinal data provides an anchor for the summary.

    The primary data source for 2013 – 2014 is Edutechnica, which not only does a more direct measurement of a larger number of schools (viewing all schools in IPEDS database with more than 800 FTE enrollments), but it also allows scaling based on enrollment per institution. This means that the latter years now more accurately represent how many students use a particular LMS.

    A few items to note:

    • Despite the addition of the new data source and its inclusion of enrollment measures, the basic shape and story of the graphic have not changed. My confidence has gone up in the past few years, but the heuristics were not far off.
    • The 2013 inclusion of Anglosphere (US, UK, Canada, Australia) numbers caused more confusion and questions than clarity, so this version goes back to being US only.
    • The Desire2Learn branding has been changed to Brightspace by D2L.
    • The eCollege branding has been changed to Pearson LearningStudio.
    • There is a growing area of “Alternative Learning Platforms” that includes University of Phoenix, Coursera, edX and OpenEdX, 2U, Helix and Motivis (the newly commercialized learning platform from College for America).
    • While the data is more solid than 2012 and prior years, keep in mind that you should treat the graphic as telling a story of the market rather than being a chart of exact data.

    LMS_MarketShare_20141107

    Some observations of the new data taken from the post on Edutechnica from September:

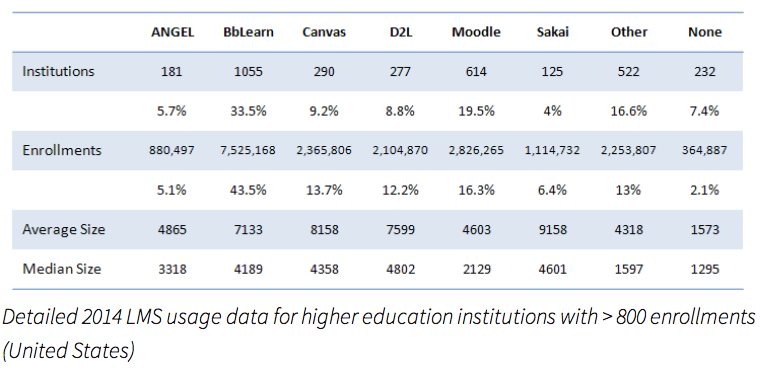
    • Blackboard’s BbLearn and ANGEL continue to lose market share in US -[1] Using the 2013 to 2014 tables (> 2000 enrollments), BbLearn has dropped from 848 to 817 institutions and ANGEL has dropped from 162 to 123. Using the revised methodology, Blackboard market share for > 800 enrollments now stands at 33.5% of institutions and 43.5% of total enrollments.
    • Moodle, D2L, and Sakai have no changes in US – Using the 2013 to 2014 tables (> 2000 enrollments), D2L has added only 2 schools, Moodle none, and Sakai 2 schools.
    • Canvas is the fasted growing LMS and has overtaken D2L – Using the 2013 to 2014 tables (> 2000 enrollments), Canvas grew ~40% in one year (from 166 to 232 institutions). For the first time, Canvas appears to have have larger US market share than D2L (13.7% to 12.2% of total enrollments using table above).
  • New LMS Market Data: Edutechnica provides one-year update

    In Fall 2013 we saw a rich source of LMS market data emerge.

    George Kroner, a former engineer at Blackboard who now works for University of Maryland University College (UMUC), has developed what may be the most thorough measurement of LMS adoption in higher education at Edutechnica (OK, he’s better at coding and analysis than site naming). This side project (not affiliated with UMUC) started two months ago based on George’s ambition to unite various learning communities with better data. He said that he was inspired by the Campus Computing Project (CCP) and that Edutechnica should be seen as complementary to the CCP.

    The project is based on a web crawler that checks against national databases as a starting point to identify the higher education institution, then goes out to the official school web site to find the official LMS (or multiple LMSs officially used). The initial data is all based on the Anglosphere (US, UK, Canada, Australia), but there is no reason this data could not expand.

    There is new data available in Edutechnica’s one-year update, with year-over-year comparisons available as well as improvements to the methodology. Note that the methodology has improved both in terms of setting the denominator and in terms of how many schools are included in the data collection.

    The Fall 2014 data which now includes all schools with more than 800 enrollments:

    (more…)