e-Literate

Present is Prologue

Tag: open source

  • Moodle Workplace: A new product and change in open source deployment

    Moodle Workplace: A new product and change in open source deployment

    Moodle unveiled its new product, Moodle Workplace, at the the Learning Technologies conference in London three weeks ago. While the open source Moodle LMS has been used by companies and organizations for employee training for years (approximately 40% of Moodle implementations worldwide according to this 2015 interview), Workplace represents a new approach for Moodle’s usage of open source deployment.

    Moodle Workplace

    Based on an email interview with Moodle Pty Ltd (aka Moodle HQ) CEO and founder Martin Dougiamas, Moodle Workplace is a “a series of well-written plugins that sit cleanly on top of the standard core distribution” and is being released under an open source GPL license. The plugins add functionality to:

    • Create training paths;
    • Create departmental structures and reporting;
    • Automate enrollment, certificates and other back end processes; and
    • Customize reporting and report delivery.

    From first reading, the Workplace functionality is a subset of the features available in other products, notably Totara Learning. That solution is also based on Moodle core, although Totara forked its code base more than three years ago. ((At the time of the fork, Totara management also predicted Moodle was planning to offer the market ‘Moodle for Workplace’.)) Workplace appears to be a solid, if somewhat unremarkable platform for organizational training delivery which can provide compliance tracking, learning pathways, and other business-focused features. For organizations looking to add training features to existing stock Moodle, Workplace should offer an easier migration path than Totara.

    The bigger news is the change in the distribution and business model as described by Dougiamas.

    We are restricting distribution to Moodle Partners for now so that we can give more value back to our Moodle Partners who invested time and money into it.

    Similar to Totara’s business model, there are limitations put on the Moodle Partners to prevent modification or distribution of the code. By providing Workplace only as a SaaS solution, Moodle is using the same distribution loophole in the GPL. ((For those unfamiliar with the peculiarities of open source licensing, Moodle and Workplace are released under the General Public License (GPL). The GPL requirement to release the source code ONLY applies if you are providing someone a copy of the binary. Providing software as a service does not constitute “distribution” under the GPL. This is how Google, Amazon, Facebook and all the other major internet players can build on open source, but not release their source code.)) The upshot is that if a company or organization wants to use Moodle Workplace, they have to work through a Moodle Partner and cannot download and install the software for free.

    The business model around Moodle Workplace is clearly a departure from the norm for Moodle, where the core GPL code is available to anyone, anytime, for free. But it is not clear whether this change in model for Workplace is a limited play or has broader applications that may impact education markets. In our interview, Dougiamas directly addressed our question on whether we should expect similar changes to Moodle core:

    No, we remain intensely committed to developing and improving Moodle core as a GPL product with the same license, open source practices and active community as now.

    He further stated:

    Our team developing Workplace have been contributing features (the more general ones) into core at the same time, and the plan is that any Workplace features that also supports sectors like Higher Ed or schools will always be migrated into core this way.

    So, what are educational institutions to make of the new business model around Moodle Workplace? We’re not entirely sure at this point. At a minimum, it would appear to be an attempt to better monetize the large installed base – a move to satisfy investors and to replace the Blackboard revenue after cancellation of their Moodle Partner agreement. At a more strategic level, it could be an attempt to stay competitive with peers, particularly SumTotal and Totara, who are going after the corporate learning space.

    If Workplace is successful, it will create a new revenue stream for Moodle HQ, potentially accelerating the development of the core educational product. A Moodle Partner we interviewed for this piece claimed they were already seeing increased lead generation from the announcement. The small and medium business (SMB) market is larger and generally has faster sales cycles than the education market, which could drive partner revenue and cash flows. The partners who are able to create sales momentum in both spaces and find their product / market niche are likely to see some accelerated growth. If this is successful, Moodle HQ should capture additional revenue and accelerate the product and service roadmap. This move directly addresses the issue Michael raised in the Fall about the termination of the Blackboard contract and revenue stream.

    For Moodle, everything rides on their ability to grow alternative sources of revenue. The company has been touting newer offerings such as MoodleCloud, MoodleNet, LearnMoodle, and MoodleServices. Since we don’t have any external evidence that these are material sources of revenue for the company, and since the company itself has not shared numbers that we can independently evaluate, it’s very hard to tell what their chances are. Moodle has a huge installed base, which gives the project a lot of momentum. But the company that drives most of the core platform development has a business model that has not aged well and is in the process of diversifying into business models that are as yet unproven. I remember enough physics to know that momentum and acceleration are not the same thing. I think the risks are probably greater for Moodle Pty. than they are for Blackboard. But both sides of the equation bear watching.

    Moodle Workplace as a monetization strategy seems to be a stronger bet than the previous offerings.

    The risk for education institutions, however, is that the Workplace development roadmap pulls resources from making investments in core Moodle necessary to keep pace with better-funded rivals. At worst case, Workplace fails to find a market niche and position itself in a crowded field. The opportunity cost of investing in Workplace vs other potential investments in the core education product and cloud services could end up having larger knock on effects downstream.

    What we have observed over the past 6 – 9 months is an increased customer focus by Moodle HQ, acknowledging the importance of market messaging (e.g. first-time presence at EDUCAUSE, announcing Workplace at London conference) and better understanding and satisfying business needs of revenue-generating Moodle Partners. The jury is still out on how these changes will impact financial sustainability and competitiveness of Moodle in education markets, but there is little doubt that there are changes in behavior.

    In the end, this is another example of corporate financial health issues having an outsized impact on the LMS market in 2018 – 2019. And one that bears watching, coming from the LMS provider with the world’s largest installed base.

    Update 3/6: Changed naming throughout to Moodle HQ instead of Moodle Pty to reflect more accurate and common usage. Also edited footnote about ‘Moodle for Workplace’ prediction to remove the implication of Moodle Workplace being a copy of Totara code.
  • State of Higher Ed LMS Market for US and Canada: 2018 Year-End Edition

    State of Higher Ed LMS Market for US and Canada: 2018 Year-End Edition

    This is the eleventh year I have shared the LMS market share graphic, commonly known as the squid graphic, for US and Canadian higher education. This past year we at e-Literate shifted our LMS Market Analysis reports from Spring / Fall to Mid-Year / End-of-Year to better allow analysis of entire years. With the release of our end-of-2018 report last week to subscribers, it’s time for us to look at updates on the institutional LMS market for North America (US and Canada) higher education. Note that our coverage for the market analysis includes Europe, Latin America, Oceania (Australia, New Zealand, and surrounding island countries) as well as emerging coverage of the Middle East.

    We present the following data “by institutions”, with market share as a percentage of the total number of institutions using each LMS as a primary system, and “by enrollments”, where we scale the institutions by its total enrollment. The latter better captures the business of the LMS market, since most licensing deals are based the number of students.

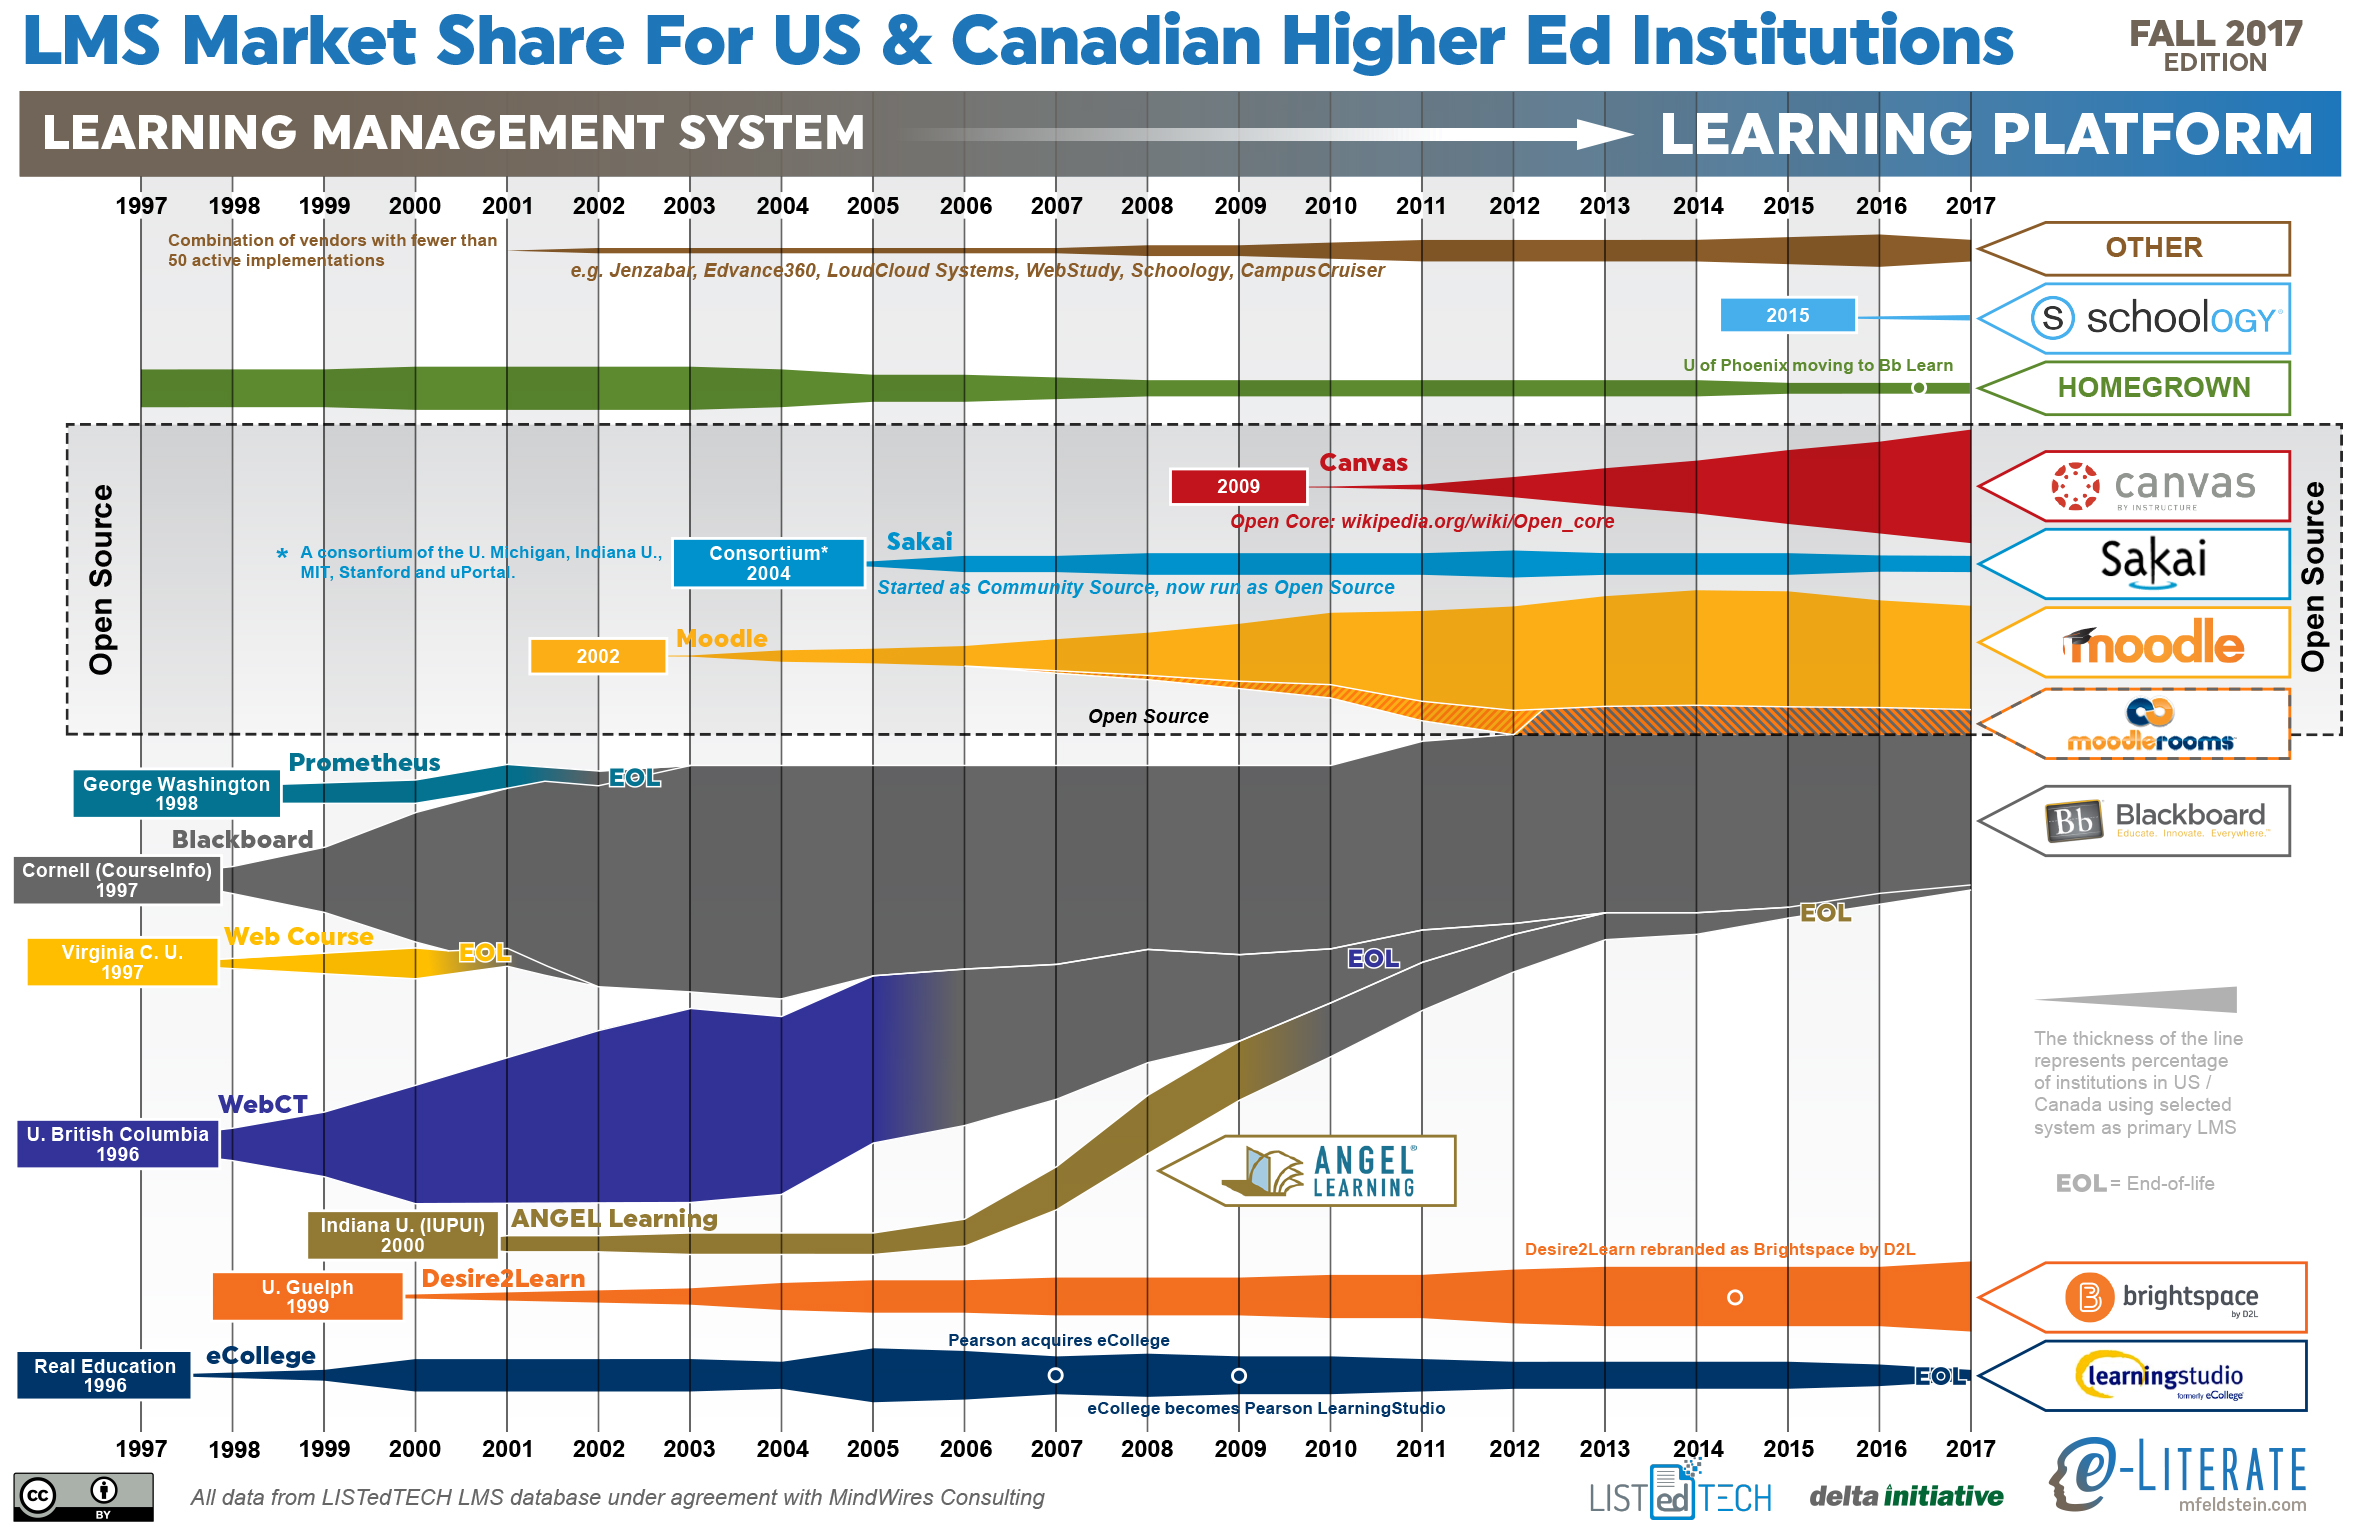
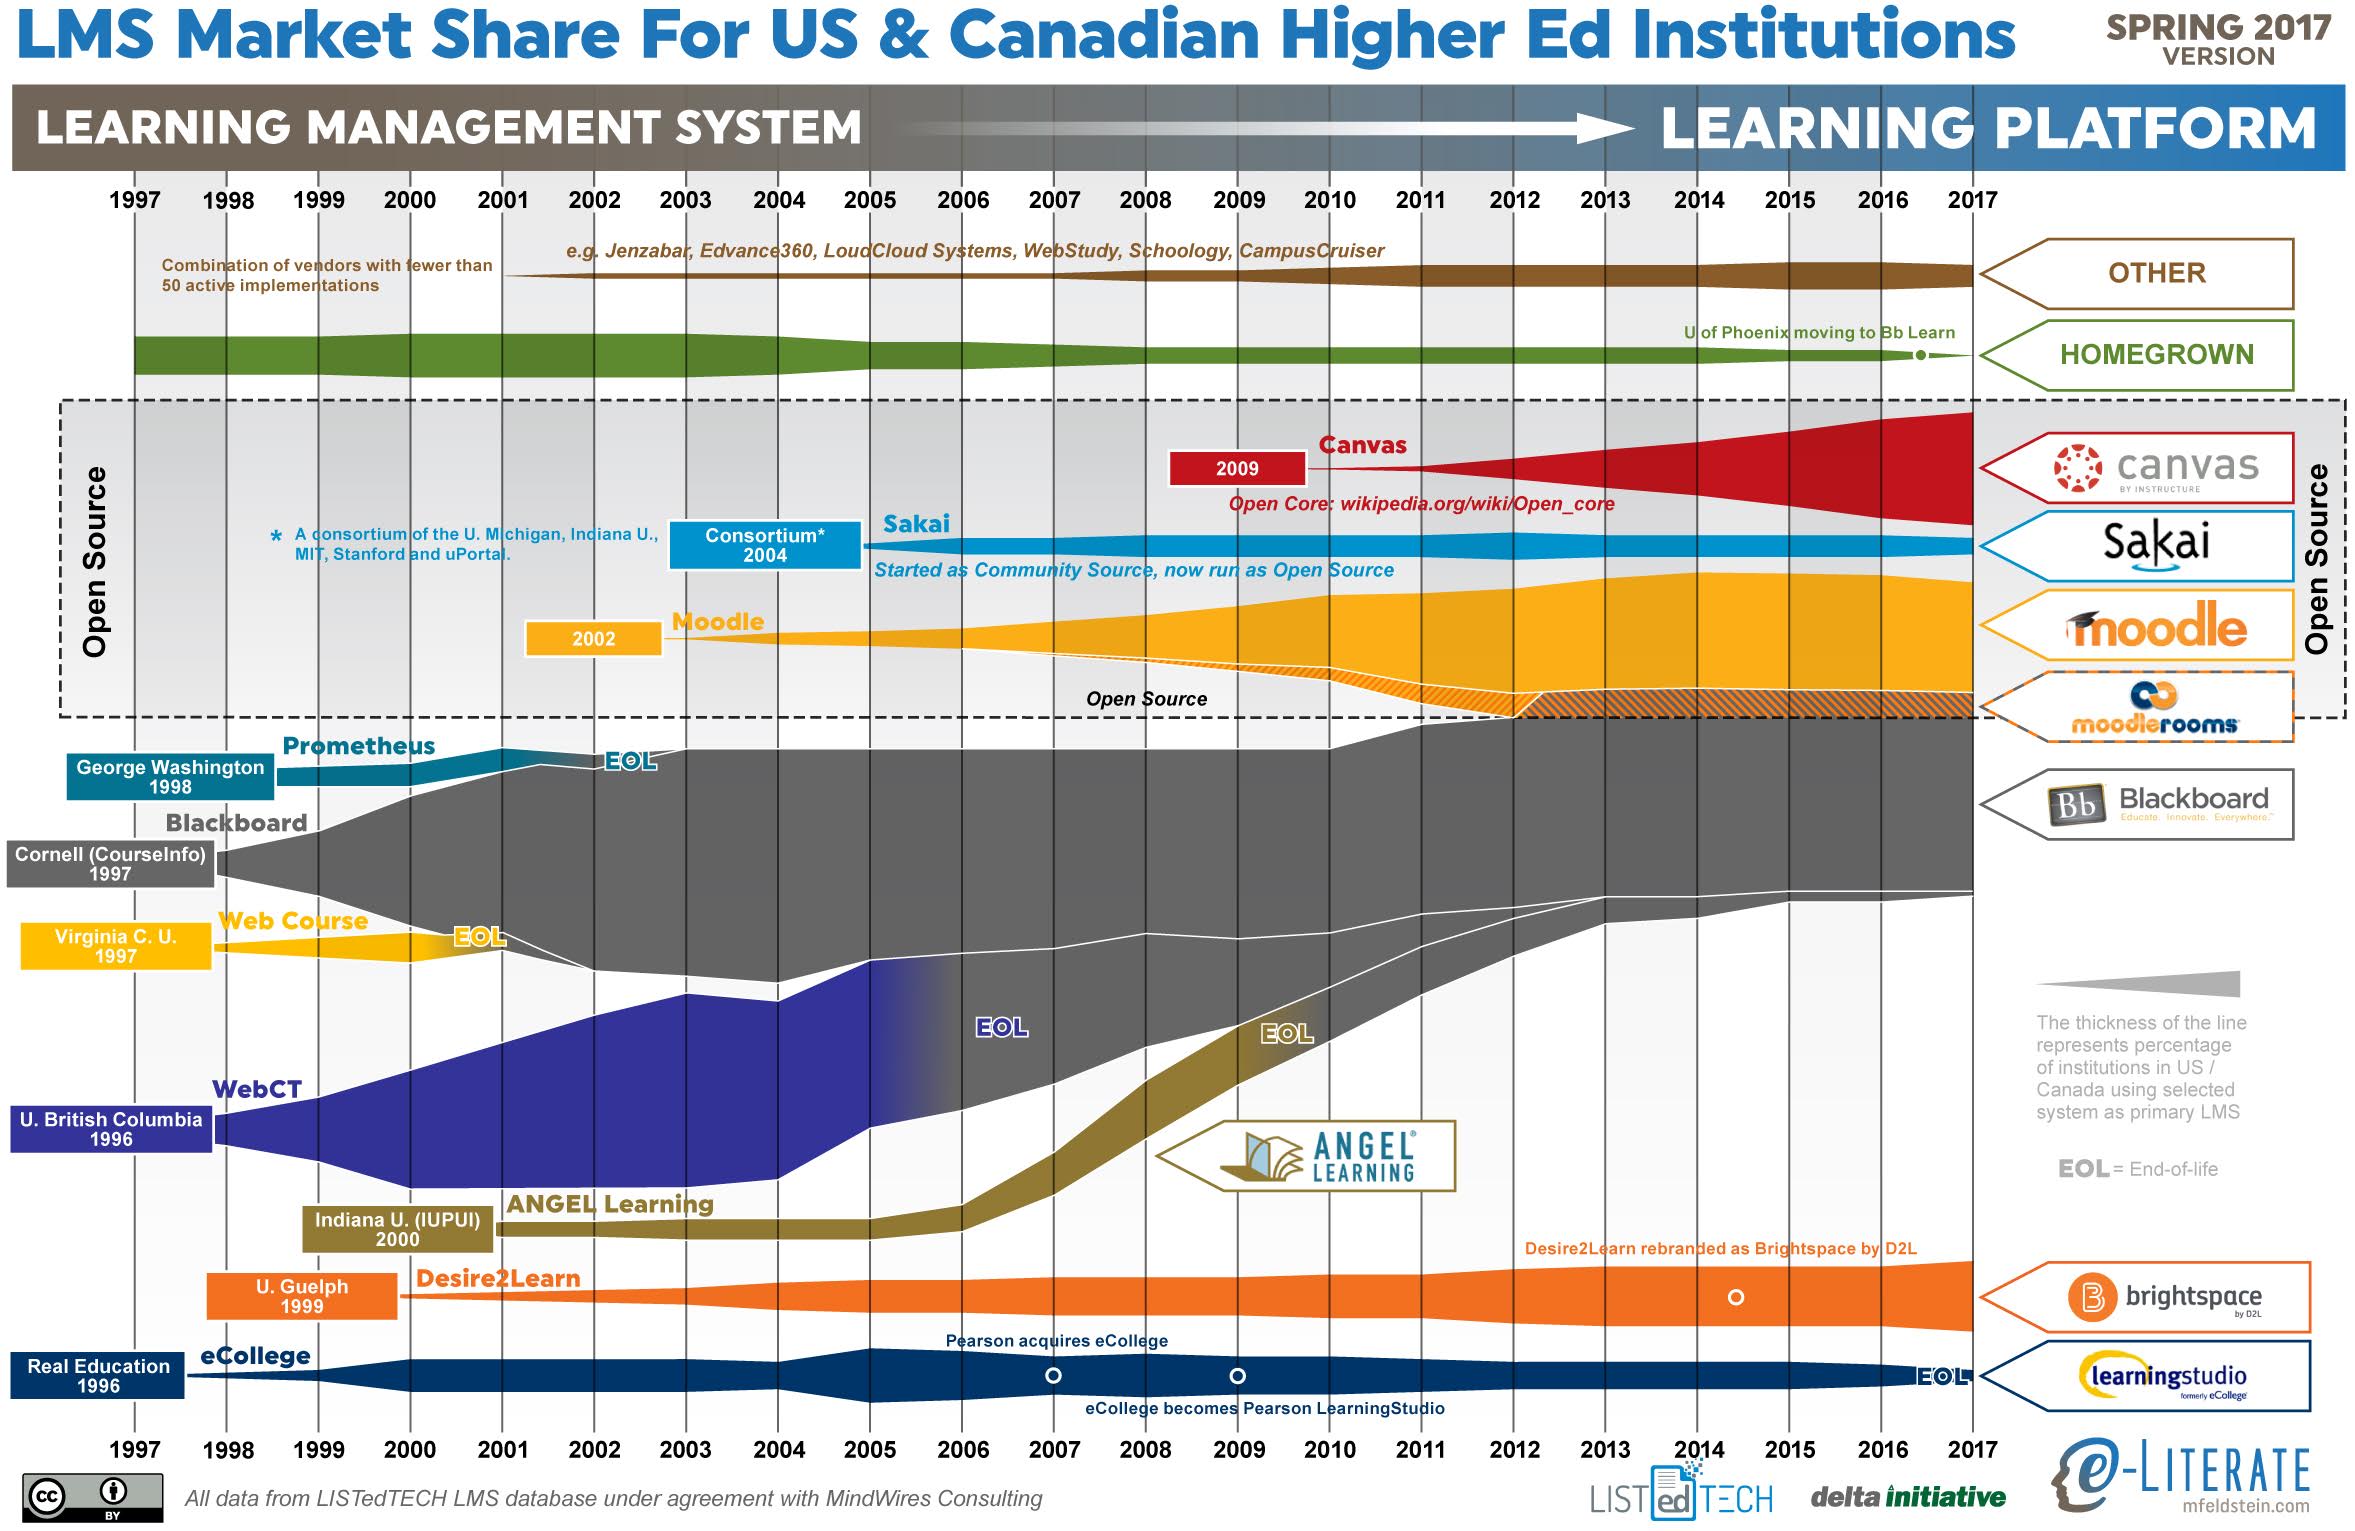
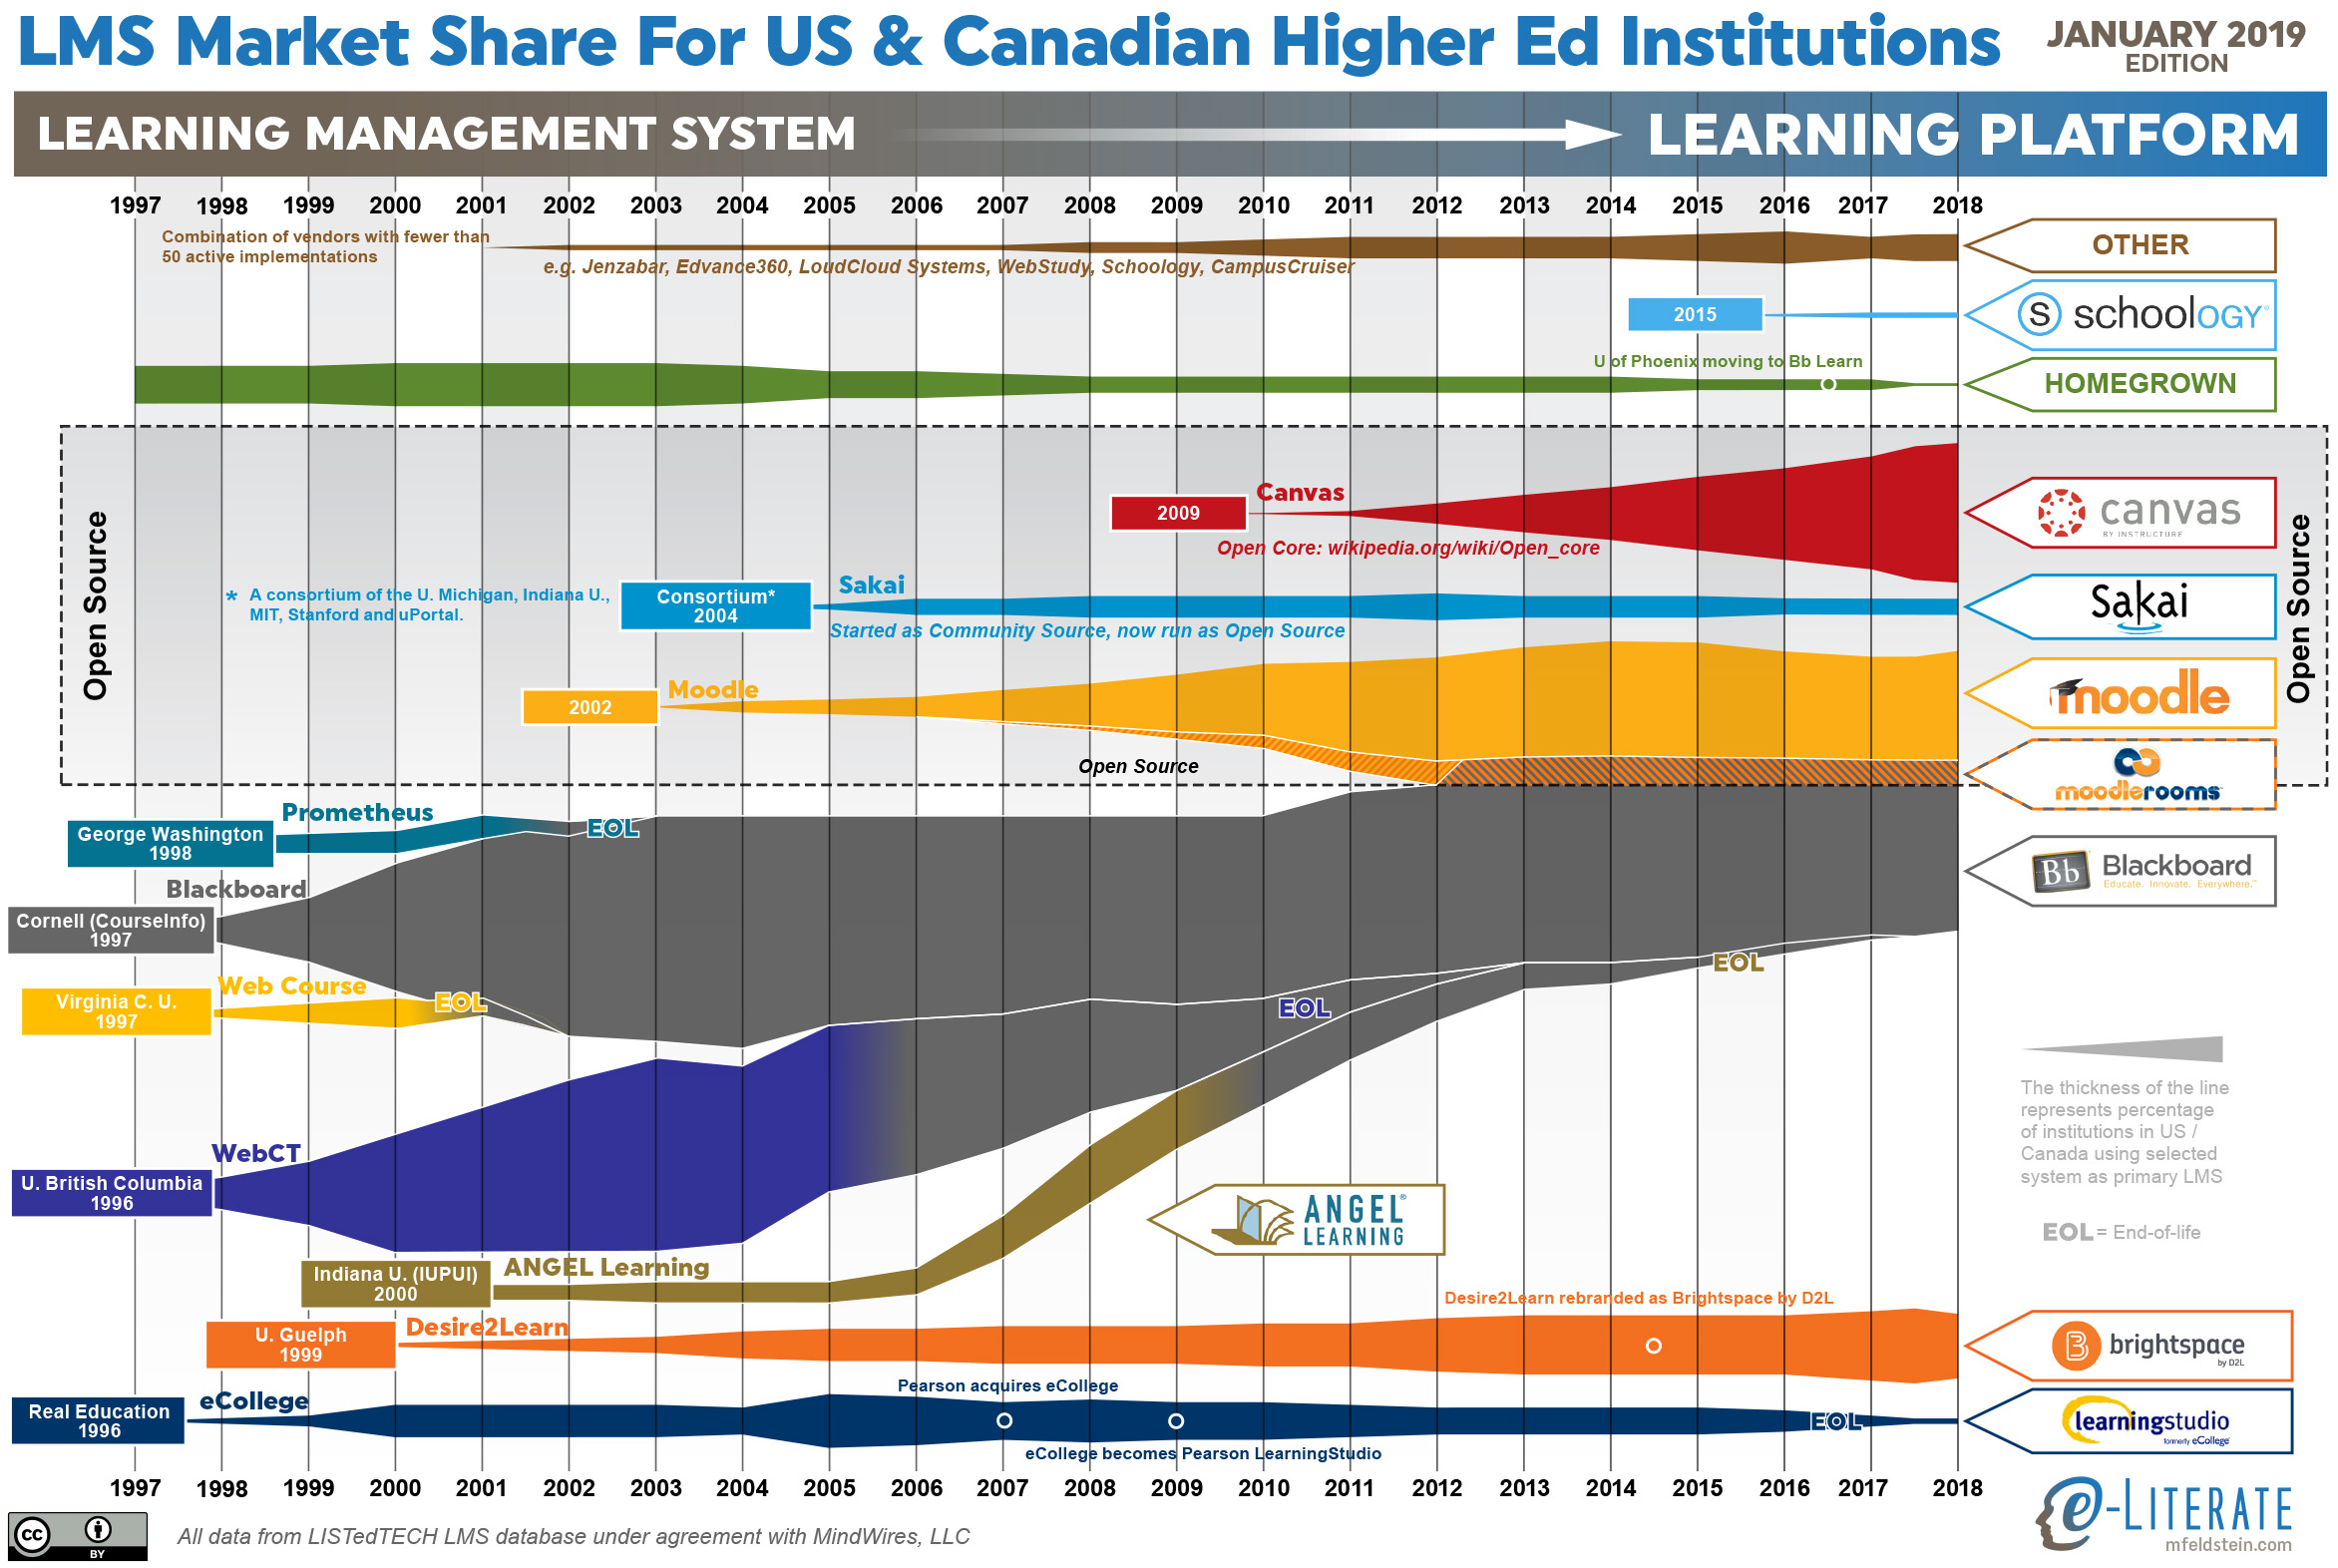
    But first, let’s look at an updated LMS market share graphic, commonly known as the squid graphic, for US and Canadian higher education. The original idea remains – to give a picture of the LMS market in one page, highlighting the story of the market over time. The key to the graphic is that the width of each band represents the percentage of institutions using a particular LMS as its primary system.

    Higher ed LMS market share for US and Canada, January 2019

    This year there are two inter-related trends that deserve a broader explanation -the LMS market slowed down with less activity overall, and Canvas and Blackboard continue to be neck-and-neck in the top spot of this market.

    We recently described the overall market activity slowdown in that there are fewer LMS formal evaluations taking place since mid 2018, with initial data pointing to a 20 – 25% drop from a year earlier. This slowdown seems to be a type of plateau rather than a continuing trend, and we are watching to see if it is temporary or not.

    Last summer we shared the symbolic passing of the torch where Canvas surpassed Blackboard in US market share, which was the first time Blackboard was not the top system since the market emerged two decades ago. What is interesting is that half a year later, the two systems are still neck-and-neck. In the US Canvas is still slightly ahead, and in North America (adding in Canada), Blackboard remains in the top spot by 0.4% (26.8% to 26.4%). Why is Canvas not continuing to extend its lead? Looking at the underlying data, there seems to be three reasons to consider:

    • The overall market slowdown means that there are fewer deals for Canvas to win lately.
    • Blackboard continues its University of Phoenix implementation, which still includes dozens of campuses despite its enrollment drop.
    • The shutdown in December of the for-profit Education Corporation of America (Virginia College and Brightwood College systems) meant that Canvas lost several dozen campuses.

    The latter two points should fully play out in the next three months, possibly making this a one-time change in trends, but it is important to call this situation out.

    Some other notes:

    • The market continues to consolidate around the Big Four – Blackboard, Canvas, D2L Brightspace, and Moodle.
    • The Homegrown option for LMS usage is going away, at least in a statistical sense. Only a handful of schools even consider this option.
    • D2L shares the challenge of having picked up several large for-profit systems that are closing campuses and therefore hurting market share. In D2L’s case, the biggest one is the former EDMC schools – the Art Institutes, Argosy University, and South University – that were sold out of bankruptcy to a non-profit entity and have closed dozens of campuses over the past year. These losses offset many of D2L’s wins in 2018.
    • Moodle had a few new wins in North America.

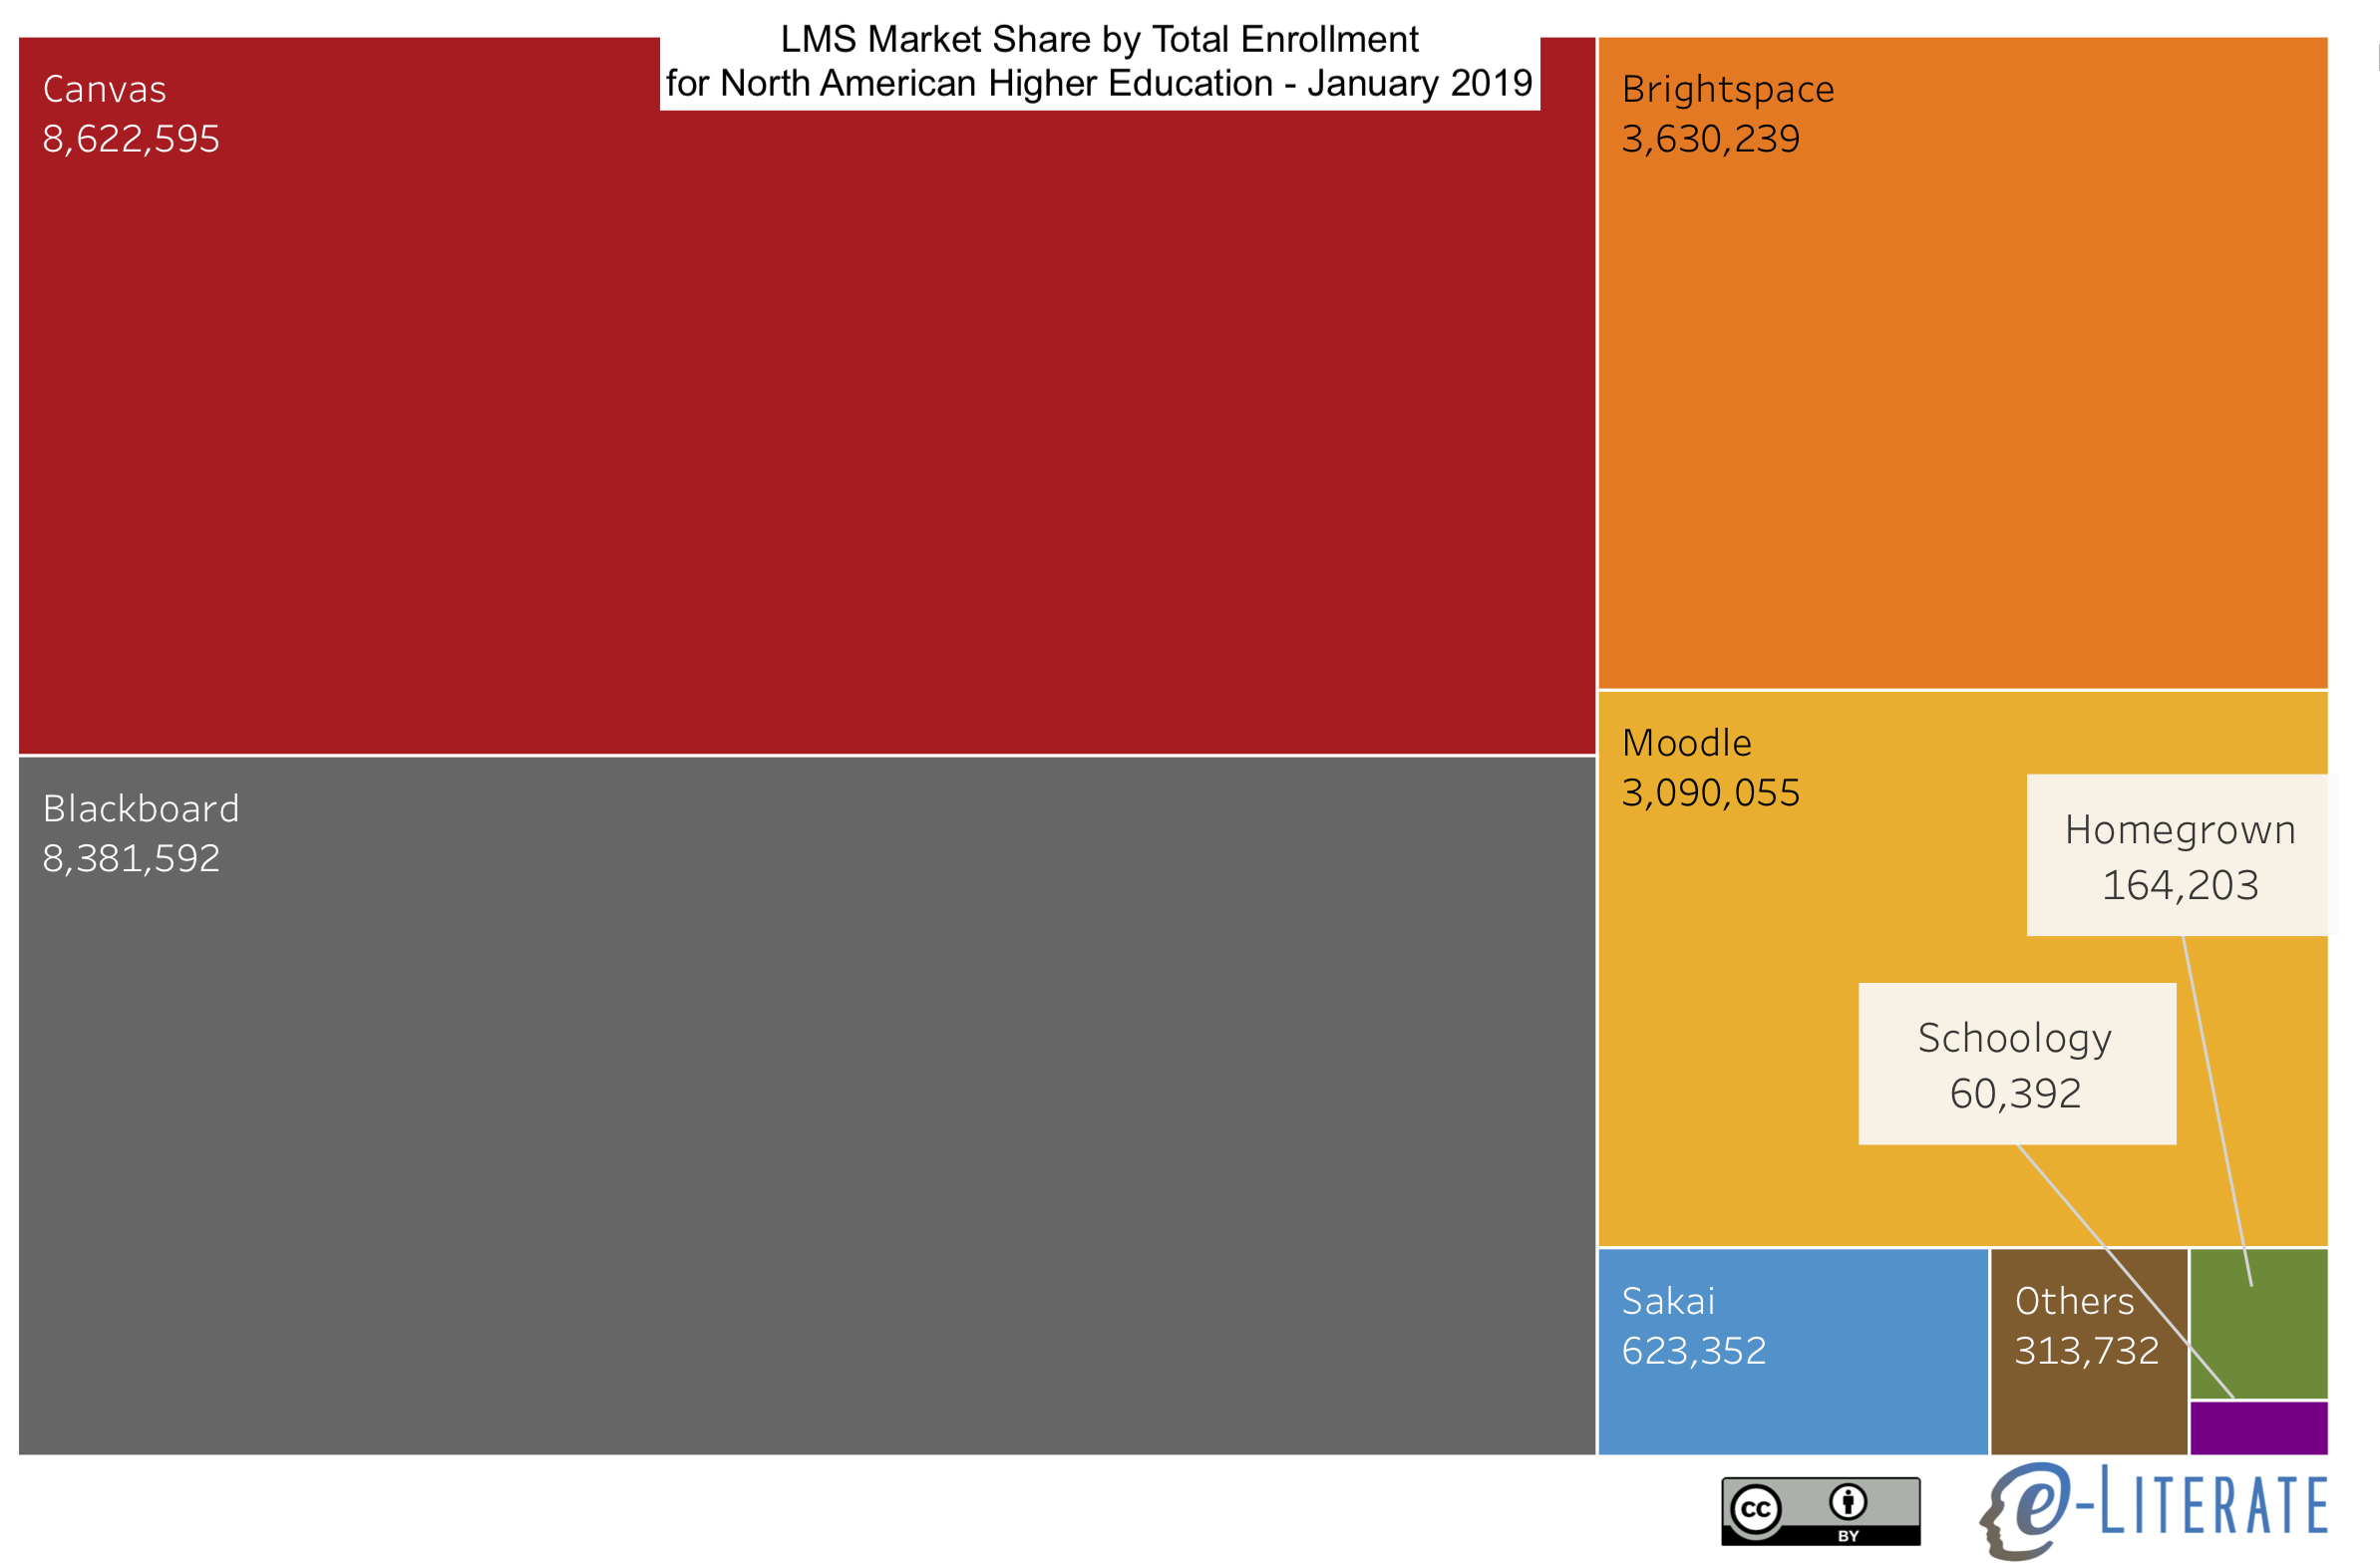
    Sticking with North America, we can also show LMS market share scaled by the enrollment of each institution, giving a different measure worth considering.

    NA LMS Market Share by Enrollment

    We’ll share more information on other global regions in the coming months.

  • Response to MoodleNews: Some considerations for critical reading of market sizing claims

    Response to MoodleNews: Some considerations for critical reading of market sizing claims

    There is an interesting post at MoodleNews titled “Open Source LMS Alive And Well: Moodle Breaks World Higher Ed Records, Tops North America, Grows Everywhere” looking at some of our recent LMS market data, focusing primarily on what the data reveal about open source systems such as Moodle, Sakai, Claroline, and Chamilo.

    Open Source LMS Alive And Well Moodle Breaks World Higher Ed Records, Tops North America, Grows Everywhere

    We welcome the usage of our data posted at e-Literate for these purposes, ((That’s why the blog is available for use under a Creative Commons Attribution license.)) but there are some misunderstandings evident in the MoodleNews post that we see too often in critical readings of market sizing reports. Unfortunately the misreadings can cloud otherwise valuable analytical reporting.

    The latest e-Literate report on “active LMS” shows Moodle as the incontrovertible LMS leader in global Higher Ed for primary and secondary systems, including North America.

    Incontrovertible seems quite strong, and we at e-Literate try to be very careful in our language and we rarely use words like incontrovertible or unequivocal. ((For the record, in the 14 year history of e-Literate, the former has been used one time and the latter five times.)) The reason is that for most people reading the data is a translation exercise. There is a need to understand the level of confidence the reader should have and what the limits of the claims are.

    It is useful that MoodleNews called out the global nature of data and measure of primary and secondary systems.

    Assuming it uses data provided by self-reporting service LISTedTECH from the last month, it shows dominance in every region, unsurmountable everywhere but the US, and healthy growth rates. The report mentions the “LMS long tail” as well as “the Big Four” (Moodle, Blackboard, Instructure Canvas and D2L Brightspace) but by their own accounting a more accurate distinction would be “the big one.”

    The data set used from our partners LISTedTECH is not a self-reporting service. Read this post for more information on the multiple channels of data collection used.

    But unsurmountable comes out of the blue. The whole point of doing reports like we do is that we don’t know for certain what the future trends will be, and we gather the data to reduce uncertainty. A while back, many would have said that Blackboard has an insurmountable dominance in North America, but we have seen major changes that would have made those claims invalid.

    I can see the argument for describing Moodle as “the big one” as an alternate description to “the Big Four”.

    LISTedTECH sample (apparently totaling 12,879 active LMS) lists 1,419 active Moodle sites in Higher Ed for North America, self-acknowledged as their most complete dataset. It appears that the advantages in Canada compensate for Instructure Canvas’ growth in the US. In July, it had listed 1,000 sites only for Higher Ed in the US.

    The first sentence is a good example of characterizing the data in a useful way, as it gives the reader a sense of the data set while also clarifying usage in a specific global region.

    Unfortunately the article then jumps into some confusing claims based on misreading the data descriptions. The June 2017 post captured percentage of primary systems at degree-granting institutions for each of four global regions with North America = US and Canada combined, the July 2018 post captured primary LMS in … US colleges and universities, and the August 2018 post captured total counts of both primary and secondary system usage in six global regions. We chose this latter method for the August post due to the frequency of long tail and open source LMS systems being used as secondary systems (i.e. some other LMS is the campus standard, or primary system). There is little basis for concluding that Moodle’s advantages in Canada compensate for Instructure Canvas’ growth in the US.

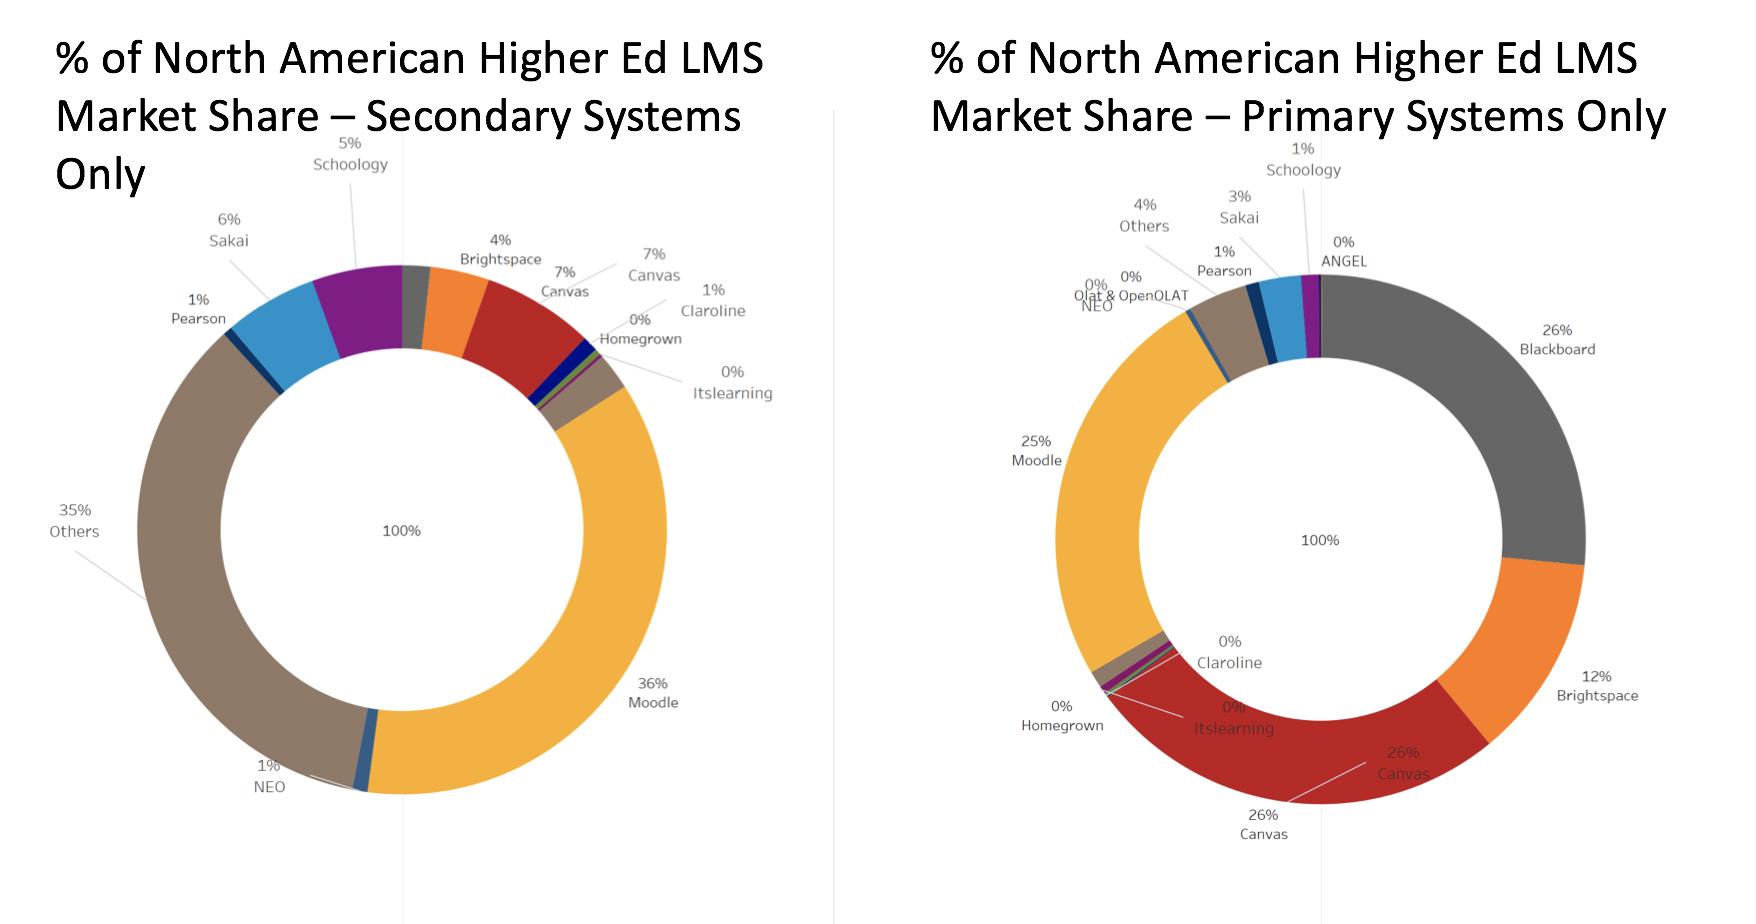
    The larger point here is that there are lots of ways to slice and dice data that end up with similar-lookinggraphs that represent different things – it’s important to read the legends and surrounding text carefully. To give a sense on the issue of primary vs. secondary systems  for North America, consider the difference shown below. ((Graphic shown as clarification, not present in articles referenced by MoodleNews.))

    With MoodleNews’ natural focus on Moodle, it would be accurate to note that Moodle is used quite frequently as a secondary system.

    For comparison, official stats at moodle.net set the total figure at 11,490 as of writing. 9,776 for the US, the biggest Moodle nation; 1,714 for Canada. Moodle does not offer discriminated site data for Higher Ed only.

    This is a helpful comparison and description with a different data set.

    Unfortunately, I need to be careful with further quotations. MoodleNews does not use a creative commons license and clearly limits usage based on the site’s terms of use. So the remainder of this post will have to be limited to short descriptions.

    There is a useful section looking at Moodle’s shares in six different global regions. The main caution I would add comes from our November 2017 post describing the data.

    Market share information provided in percentages and trends are more reliable than absolute counts outside of North America. When we do provide absolute numbers, we advise caution for readers or subscribers to not over-interpret the absolute numbers, at least without us providing additional details to keep the data in context.

    But in this case, MoodleNews also included the percentages for each region, which is helpful.

    The next four paragraphs all focus on market trends (year over year comparisons) that cannot be supported by the data (see above).

    At the end of the MoodleNews post, there is some valuable commentary about other (non-Moodle) open source LMS system and the origins and deployments across various regions.

    Given these clarifications, I would also add the the MoodleNews title has some serious flaws.

    All-in-all, it’s good to see valuable discussions spawned from our CC-BY licensed posts. But readers should be cautios when trying to understand market sizing data and make comparisons and trends analysis carefully.

    Update 8/26: Please see comment from Martin Dougiamas clarifying that MoodleNews “is not associated or affiliated with the Moodle organisation in any way”.

  • Schoology, NEO, Claroline, Chamilo: The beginning of the LMS long tail

    With reporting contributions from Jeanette Wiseman and O’Neal Spicer

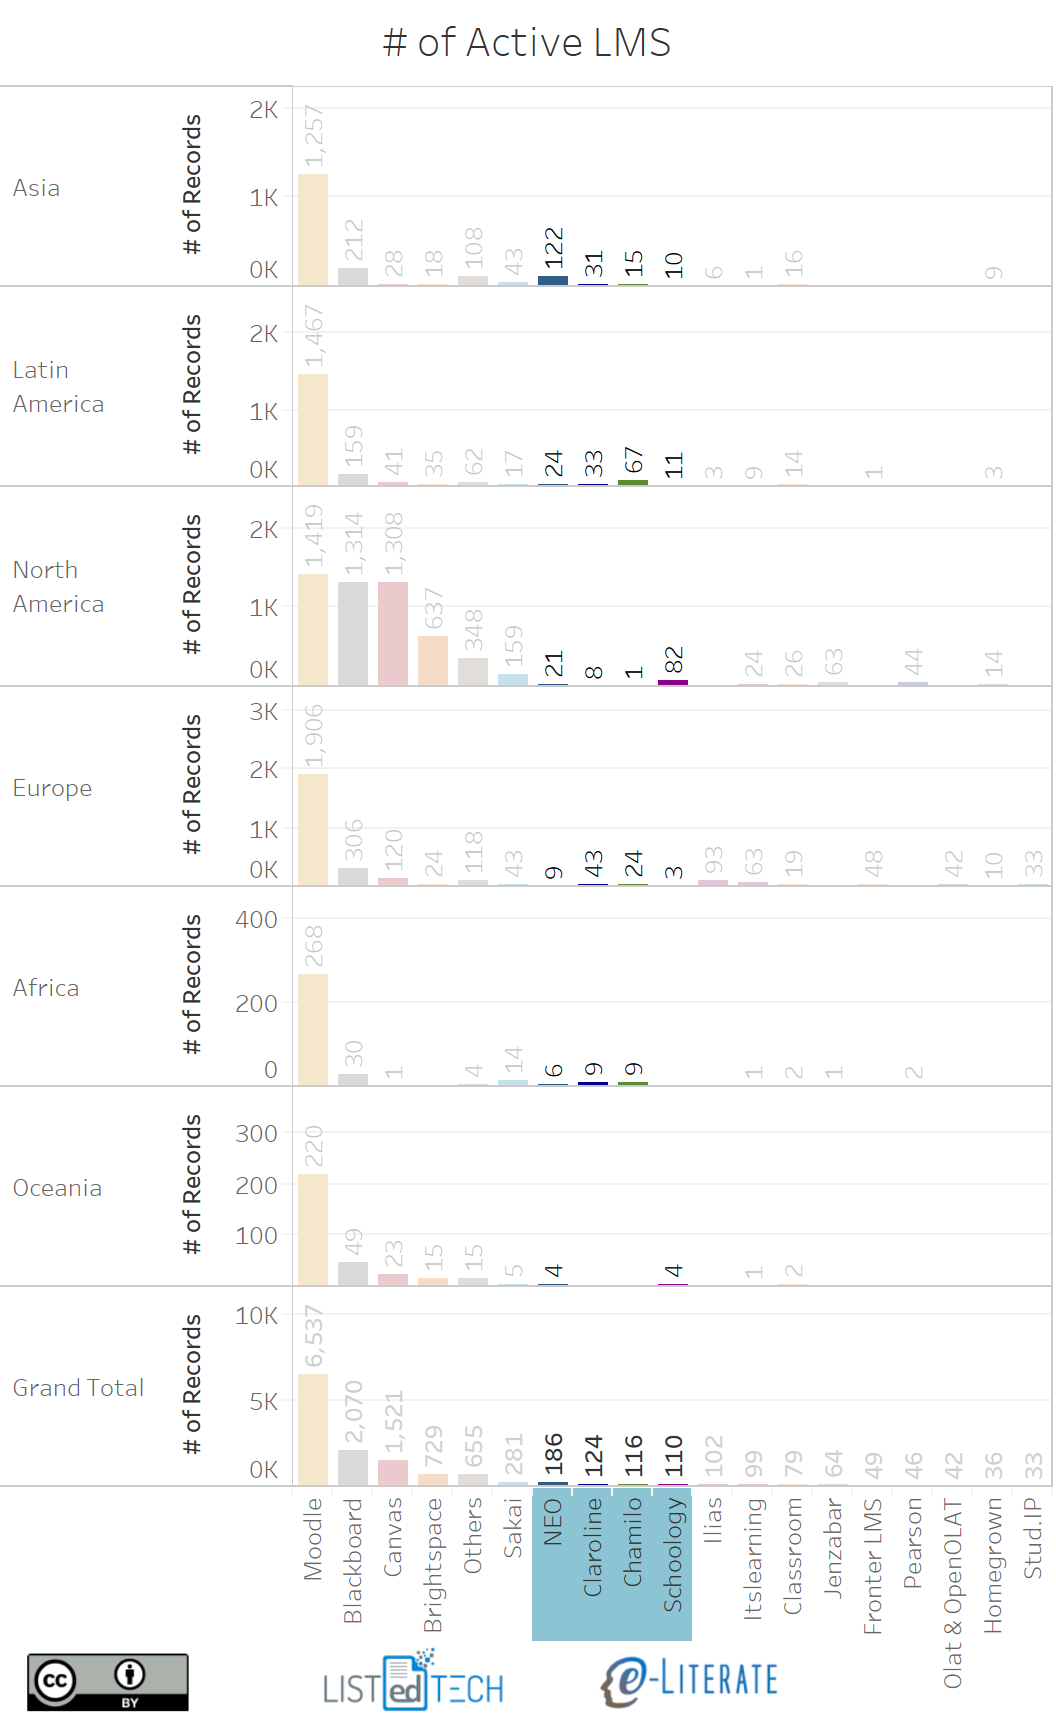
    We have described how the global LMS market is converging in the sense that the Big Four – Moodle, Blackboard, Instructure, and D2L – end up being the primary competitors in more and more global regions, often with similar dynamics. We have also described Sakai and its decline in some detail. But what about the next level down? Let’s consider four LMS solutions that are still quite active but with fewer institutional users than Sakai – Schoology (whom we have described before), NEO, Claroline, and Chamilo. ((Disclosure: Blackboard, Instructure, D2L, and Schoology are subscribers to our LMS Market Analysis service. Blackboard, Instructure, D2L, and Pearson are sponsoring participants in our Empirical Educator Project.)) The following graphic shows both primary and secondary system usage in higher education in six different global regions, and all four systems have more than 100 active implementations.

    LMS higher ed counts by global region


    Schoology NEXT

    • The Schoology NEXT conference occurred at the same time as BbWorld this year. This is a mostly K-12 conference – as that is the primary market for Schoology – with a different attendance demographic than most LMS conferences with the majority of the attendees being actual classroom teachers or instructional designers, not the typical administrators or IT staff that you see at the other user conferences. This audience is more focused on the use of technology to enhance teaching and learning in their classrooms, to assist with assessment, or to fill a requirement of use of technology for professional development. The break-out sessions reflected this academic focus.
    • The only new features or development that were discussed at any length during the keynote presentations involved the vague promise of “Personalized Learning” support. There was little information about what new features would look like, what they would encompass, or if they would entail additional charges like Schoology’s assessment platform. In an interview with CEO Jeremy Friedman and the new President Justin Serrano, they said that the vagueness is by design. The company is still working through their users’ needs and will be completing development on those features once that assessment was complete.
    • When discussing if the company saw Google Classroom’s continued growth in the K-12 market as a threat, Friedman said it is the opposite. They see that in K-12 space Google Classroom fills a need for a classroom, a school or a district that are dipping their toes in the LMS space, and once the school starts actively using the technology they quickly outgrow it. In these cases, Schoology sees Google Classroom as seeding the market for them, and they actively target those Google Classroom schools. In most cases, if responding to an RFP, it will be Canvas they will be up against. Rarely do they see Blackboard or even Moodle in these situations. They feel like, and this was reiterated by their users, that one of the most significant benefits that Schoology users see in the platform is their ease of use. The interface is reminiscent of Facebook; it is familiar to the teachers they quickly can navigate and load announcements and content to their site with very little training or IT support. It may not carry with it the bells and whistles of a Blackboard Learn or even Canvas by Instructure, but for what these K-12 teachers need, it fits the bill. For now.
    • Regarding targeting customers in higher education, the company stayed the course from January 2017 in which they will continue to support their higher education customers and will take easy sales opportunities, but are not planning to aggressively pursue that market. While this strategy only lightly targets higher education, Schoology has over 100 clients at universities and colleges worldwide – mostly small private schools, and often as secondary systems – using their platform. Customers using as a primary system include Wheaton College and Saint Vincent College in the US and the Universidad Metropolitana de Monterrey in Latin America. Schoology is also used as a secondary system at schools including UC San Diego.

    NEO, Claroline, and Chamilo

    The other three systems – NEO, Claroline, and Chamilo – are important in the global market, even if most academic buyers (in the US, at least) likely have not heard of them. All have more than 100 higher education implementations worldwide.

    • NEO is the academic LMS from Cypher Learning: Based on our conversations at the K-12 focused ISTE conference this summer, Cypher Learning has 60 employees and claims 2 million customers worldwide (combining NEO with the Indie and Matrix LMS for corporate markets). In higher ed, their largest implementation is with STI College in the Philippines with a systemwide deal that gives them 77 campus adoptions. The system has been designed native to the cloud and boasts a fairly intuitive user interface that addresses competency-based education and mastery learning.

    • Claroline Connect is an Open Source project run out of France: This system – which has the greatest adoption in Europe, Latin America, and Asia – is a second-generation open source project. In the early 2000s, the University of Lyon and the Université catholique de Louvain created two open source LMSs, and subsequently Claroline Connect combined these projects into the current system based on more modern technology. Get your French ready, or use captions.

    • Chamilo is an Open Source project run out of Spain: This system, used most often in Latin America and Europe, also has origins in the predecessors to Claroline, forking into the Dokeos project and then forking again to Chamilo in 2010. The system is supported by official supporting vendors in the following countries: Belgium, Spain, Italy and Germany. The Belgian company also has offices in Peru. Again, get your French ready.

    While we have only described this second tier of global LMS providers in broad strokes, we hope this post gives a richer view of the broader LMS market and available systems.

  • State of Higher Ed LMS Market for US and Canada: Fall 2017 Edition

    State of Higher Ed LMS Market for US and Canada: Fall 2017 Edition

    Now that we’re past the 2017 WCET conference and headed to the EDUCAUSE conference, let’s look at updates on the institutional LMS market for North America (US and Canada). Last year we started our LMS market analysis service, where we are working with LISTedTECH to provide market data and visualizations, and our fall report for subscribers will be released in about a month. Data for 2017 presented below goes through October 1 of this year.

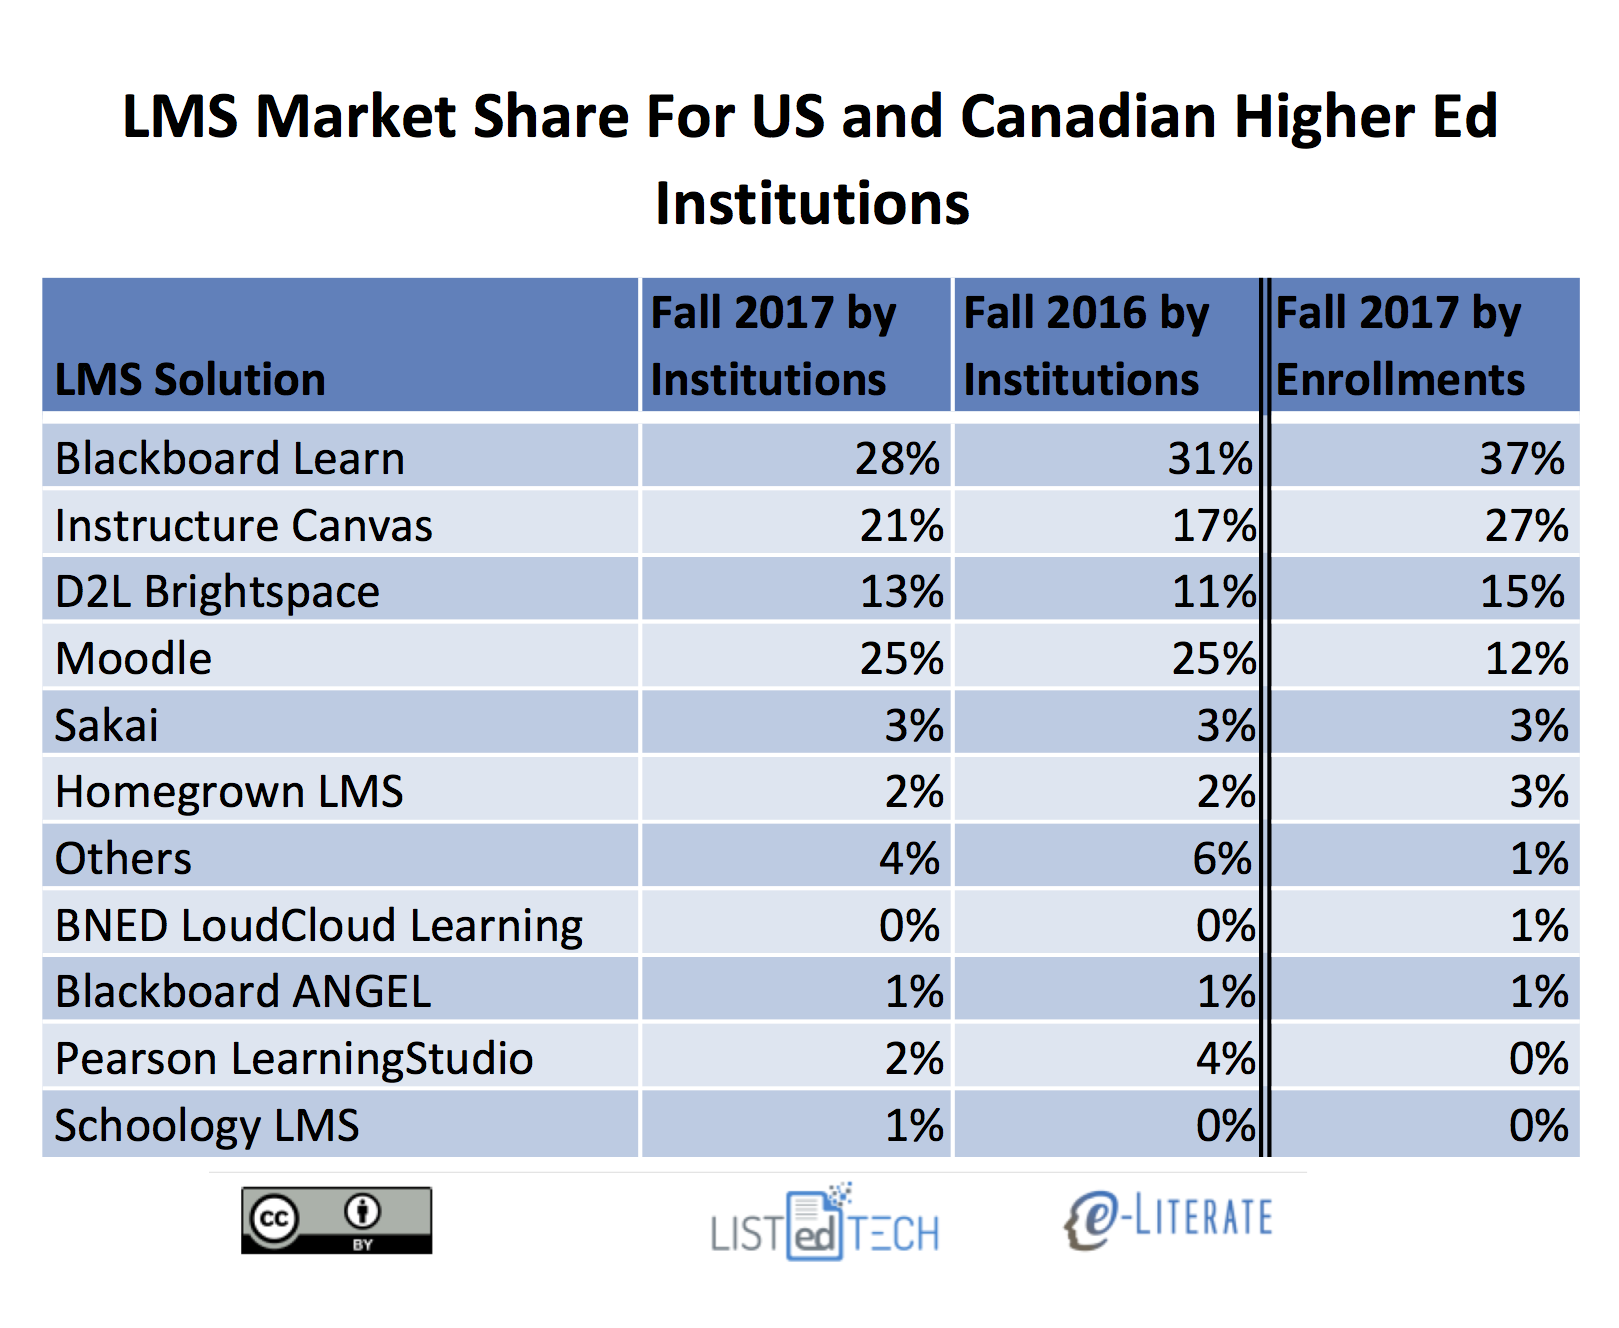
    We present the data “by institutions”, with market share as a percentage of the total number of institutions using each LMS as a primary system, and “by enrollments”, where we scale the institutions by their total enrollment. The latter better captures the business of the LMS market, since most licensing deals are based the number of students. We have also included data from Fall 2016 by institutions for comparison purposes.

    Some notes on the market share as defined by percentage of institutions:

    • In terms of new selections the market continues to be a two-horse race recently with Canvas by Instructure and Brightspace by D2L as the only two solutions with material gains in market share. Canvas grew from 17% to 21% , and Brightspace from 11% to 13%, of the market.
    • Outside of the big four – Blackboard Learn, Canvas, D2L Brightspace, and Moodle – no other system has more than 3% of the market measured either by percentage of institutions or percentage of enrollments. Furthermore, the category of “Others”, capturing systems not listed above and having less than 1% market share, actually dropped from 4% to 2% of the market. This indicates that continued market consolidation.
    • Schoology and BNED LoudCloud grew slightly, but not nearly to the degree of the Canvas and Brightspace.
    • Blackboard Learn fell the farthest, from 31% to 28% of of the market. The second biggest drop was Pearson LearningStudio, from 4% to 2%, based on its end-of-life notice for December 2017.
    • Moodle and Sakai both lost market share of just under 1%, not enough to show up in the rounded numbers in the table but enough to show up in our underlying data.
    • The difference in Moodle’s market share by institutions at 25% and by enrollments at 12% really shows how concentrated their usage is for smaller schools.
    • When viewing market share as defined by percentage of enrollments, Blackboard and Canvas are the most-used systems, at 37% and 27% of the market, followed by D2L at 15% and Moodle at 12%.

    Stepping back from the immediate data, let’s look at an updated LMS market share graphic, commonly known as the squid graphic, for US and Canadian higher education. The original idea remains – to give a picture of the LMS market in one page, highlighting the story of the market over time. The key to the graphic is that the width of each band represents the percentage of institutions using a particular LMS as its primary system.

    Some additional notes:

    • Blackboard and Moodle have been the market leaders as number one and two in share as they have been for the past decade. However, Canvas is quickly approaching Moodle’s market share.

    We’ll share any updates we discover at the conference this week.

  • State of Higher Ed LMS Market for US and Canada: Spring 2017 Edition

    State of Higher Ed LMS Market for US and Canada: Spring 2017 Edition

    This is the ninth year I have shared the LMS market share graphic, commonly known as the squid graphic, for US and Canadian higher education. The original idea remains – to give a picture of the LMS market in one page, highlighting the story of the market over time. The key to the graphic is that the width of each band represents the percentage of institutions using a particular LMS as its primary system.

    Last year we made a big shift based on our LMS market analysis service – we are working with LISTedTECH to provide market data and visualizations. This data source provides historical and current measures of institutional adoptions, allowing new insights into how the market has worked and current trends. Our spring report for subscribers will be released this month. Data for 2017 goes through April 1 of this year.

    (more…)

  • Vert Capital and Scriba Corp: Institutions losing course data in company’s death throes

    Vert Capital and Scriba Corp: Institutions losing course data in company’s death throes

    After last year’s disastrous outage at UC Davis due to Scriba Corp’s change of data center for the Sakai LMS (branded as SmartSite at UC Davis), it turns out that there is more damage to be done as the company slowly disappears. What appears to have happened in the past few months is that Scriba has not been paying this new data center provider (IO Data Centers), and that company is withholding the data on its servers until the issue is resolved. The end result is that several remaining Scriba customers have lost not just a live Sakai site but also the underlying current and historic course data. In at least one case, this dispute has caused a distance education program to be halted until the school figures out how to set up a new LMS site and to recreate their course content.

    Based on two people familiar with Scriba’s recent operations, despite several remaining schools continuing to pay hosting fees, Scriba was not fully paying IO Data Centers. While I have no information on whether there was a legitimate complaint or whether this was simply non-payment to save cash while Scriba died, I will point out that last Spring Scriba’s contract with the Apereo Foundation to remain a commercial affiliate was cancelled under similar circumstances. Scriba simply stopped paying Apereo until the foundation’s board voted to terminate their contract. (more…)