e-Literate

Present is Prologue

Tag: Sakai

  • State of Higher Ed LMS Market for US and Canada: 2018 Year-End Edition

    State of Higher Ed LMS Market for US and Canada: 2018 Year-End Edition

    This is the eleventh year I have shared the LMS market share graphic, commonly known as the squid graphic, for US and Canadian higher education. This past year we at e-Literate shifted our LMS Market Analysis reports from Spring / Fall to Mid-Year / End-of-Year to better allow analysis of entire years. With the release of our end-of-2018 report last week to subscribers, it’s time for us to look at updates on the institutional LMS market for North America (US and Canada) higher education. Note that our coverage for the market analysis includes Europe, Latin America, Oceania (Australia, New Zealand, and surrounding island countries) as well as emerging coverage of the Middle East.

    We present the following data “by institutions”, with market share as a percentage of the total number of institutions using each LMS as a primary system, and “by enrollments”, where we scale the institutions by its total enrollment. The latter better captures the business of the LMS market, since most licensing deals are based the number of students.

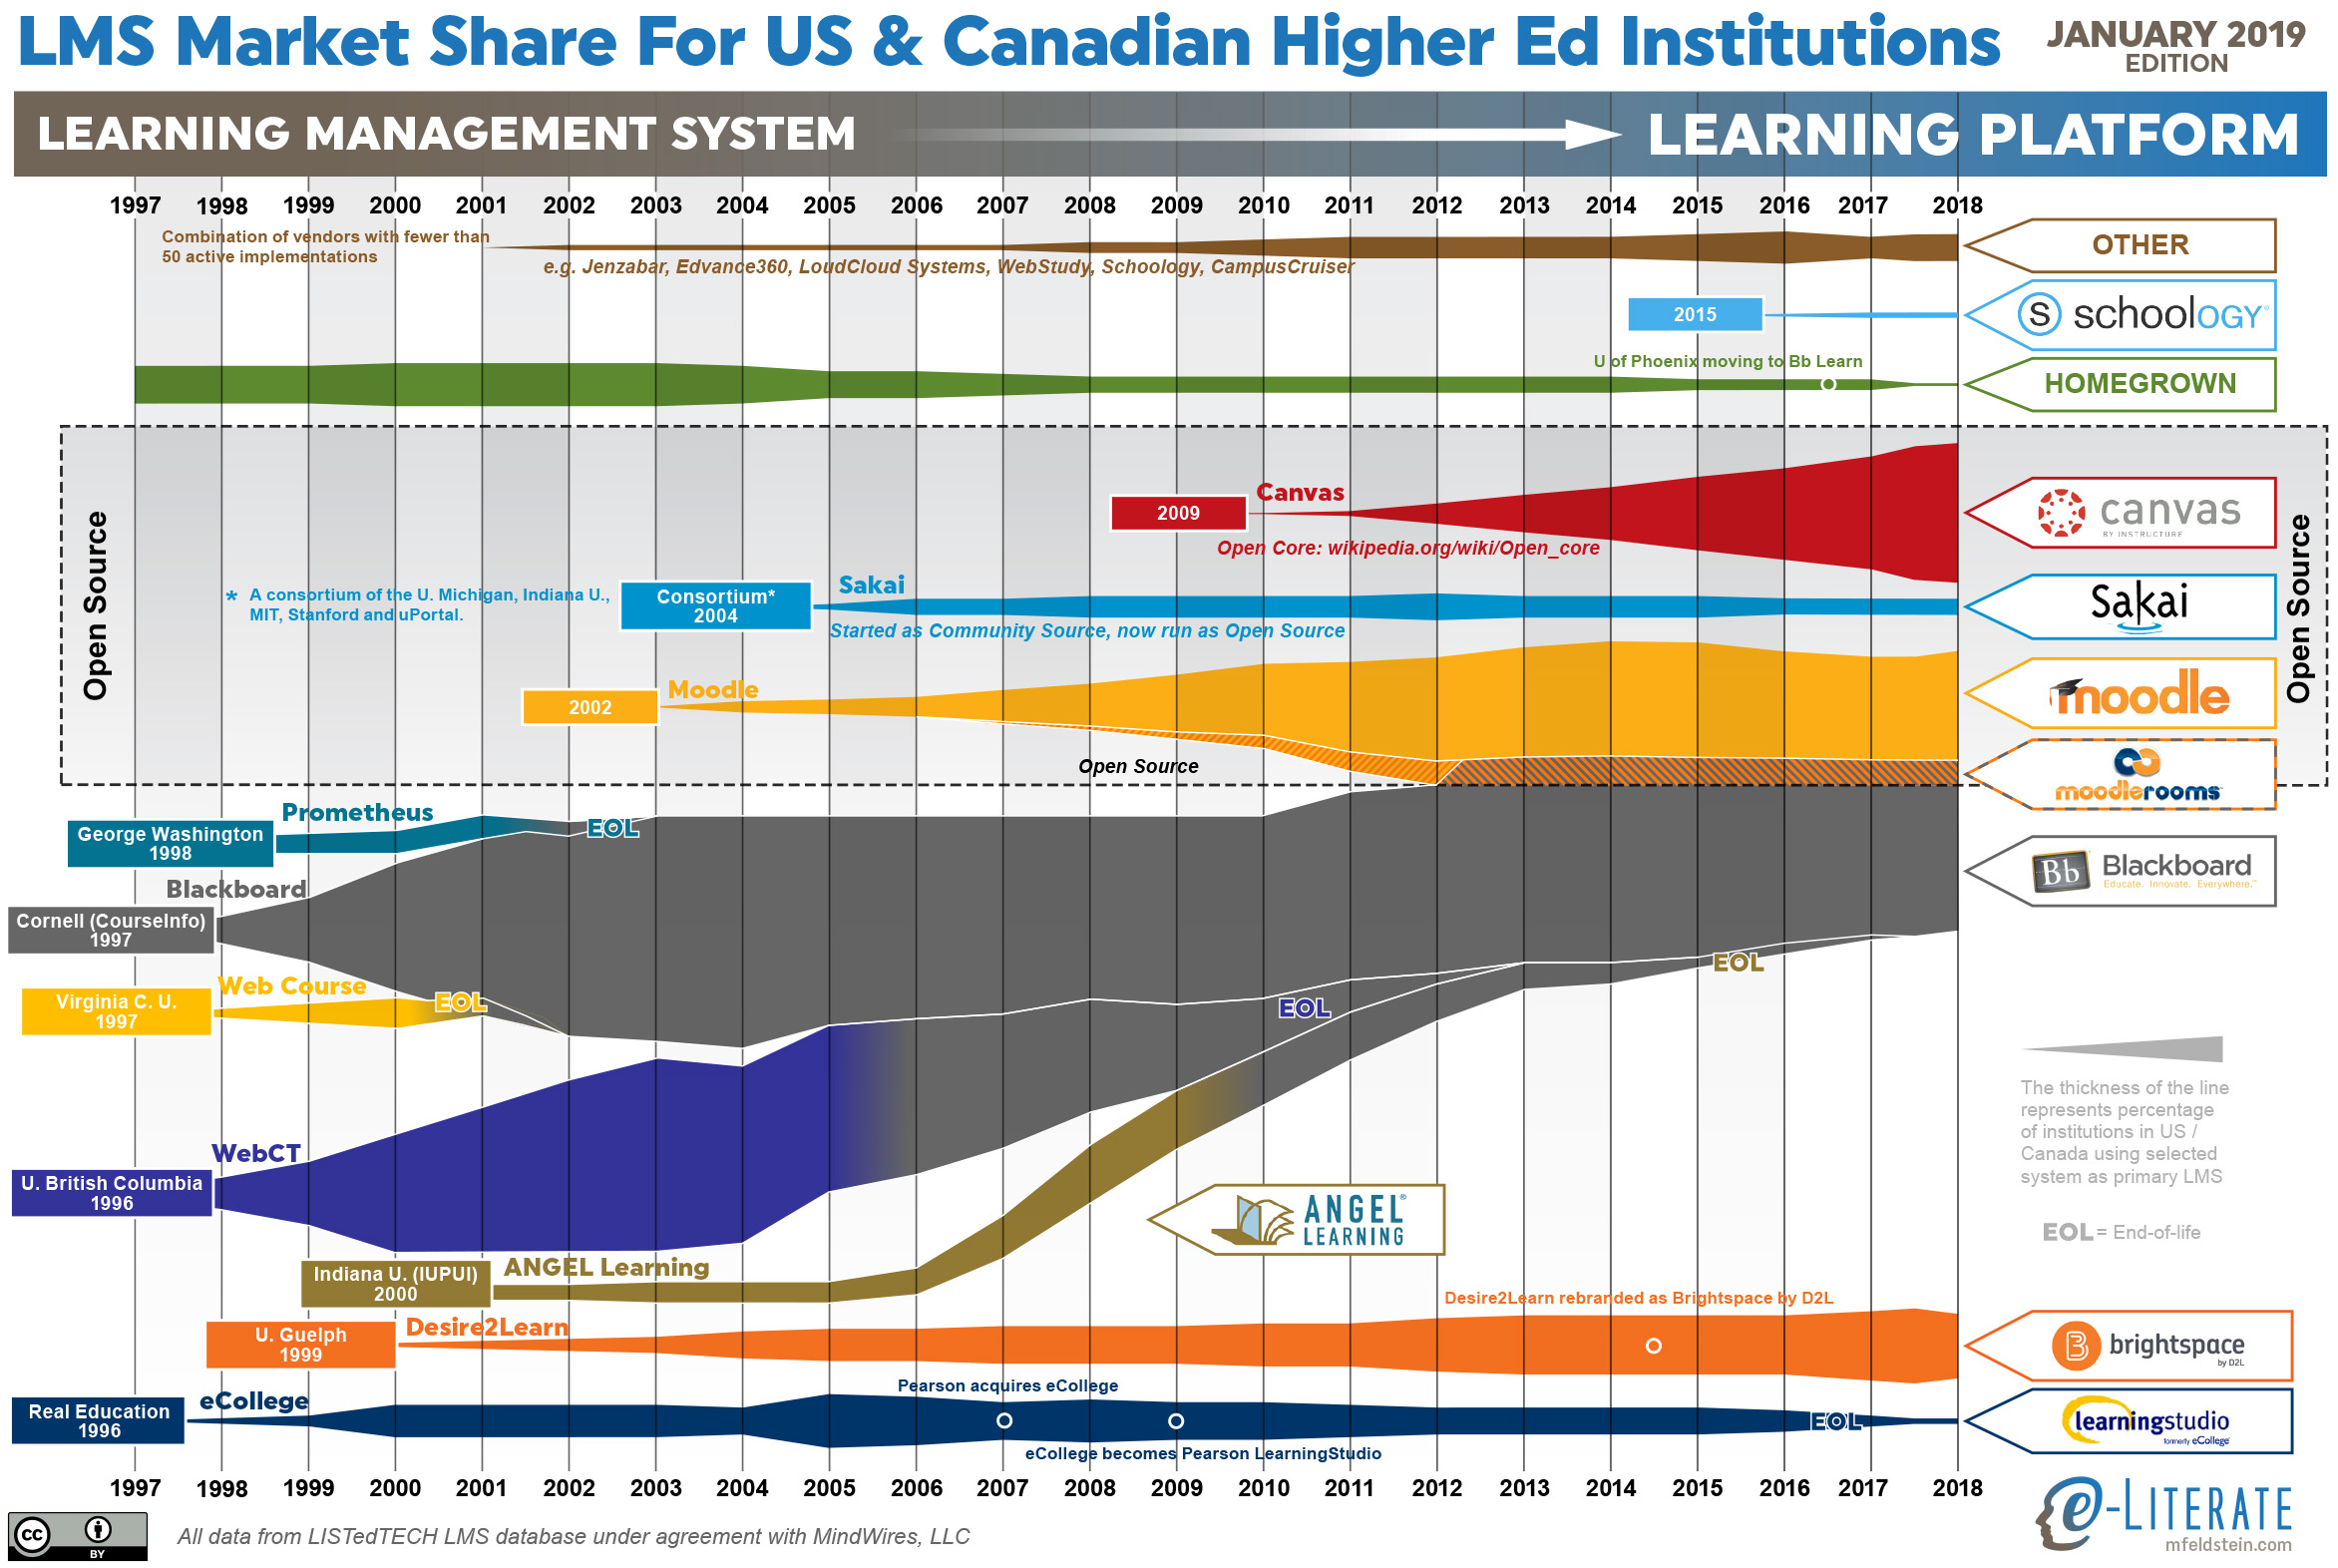
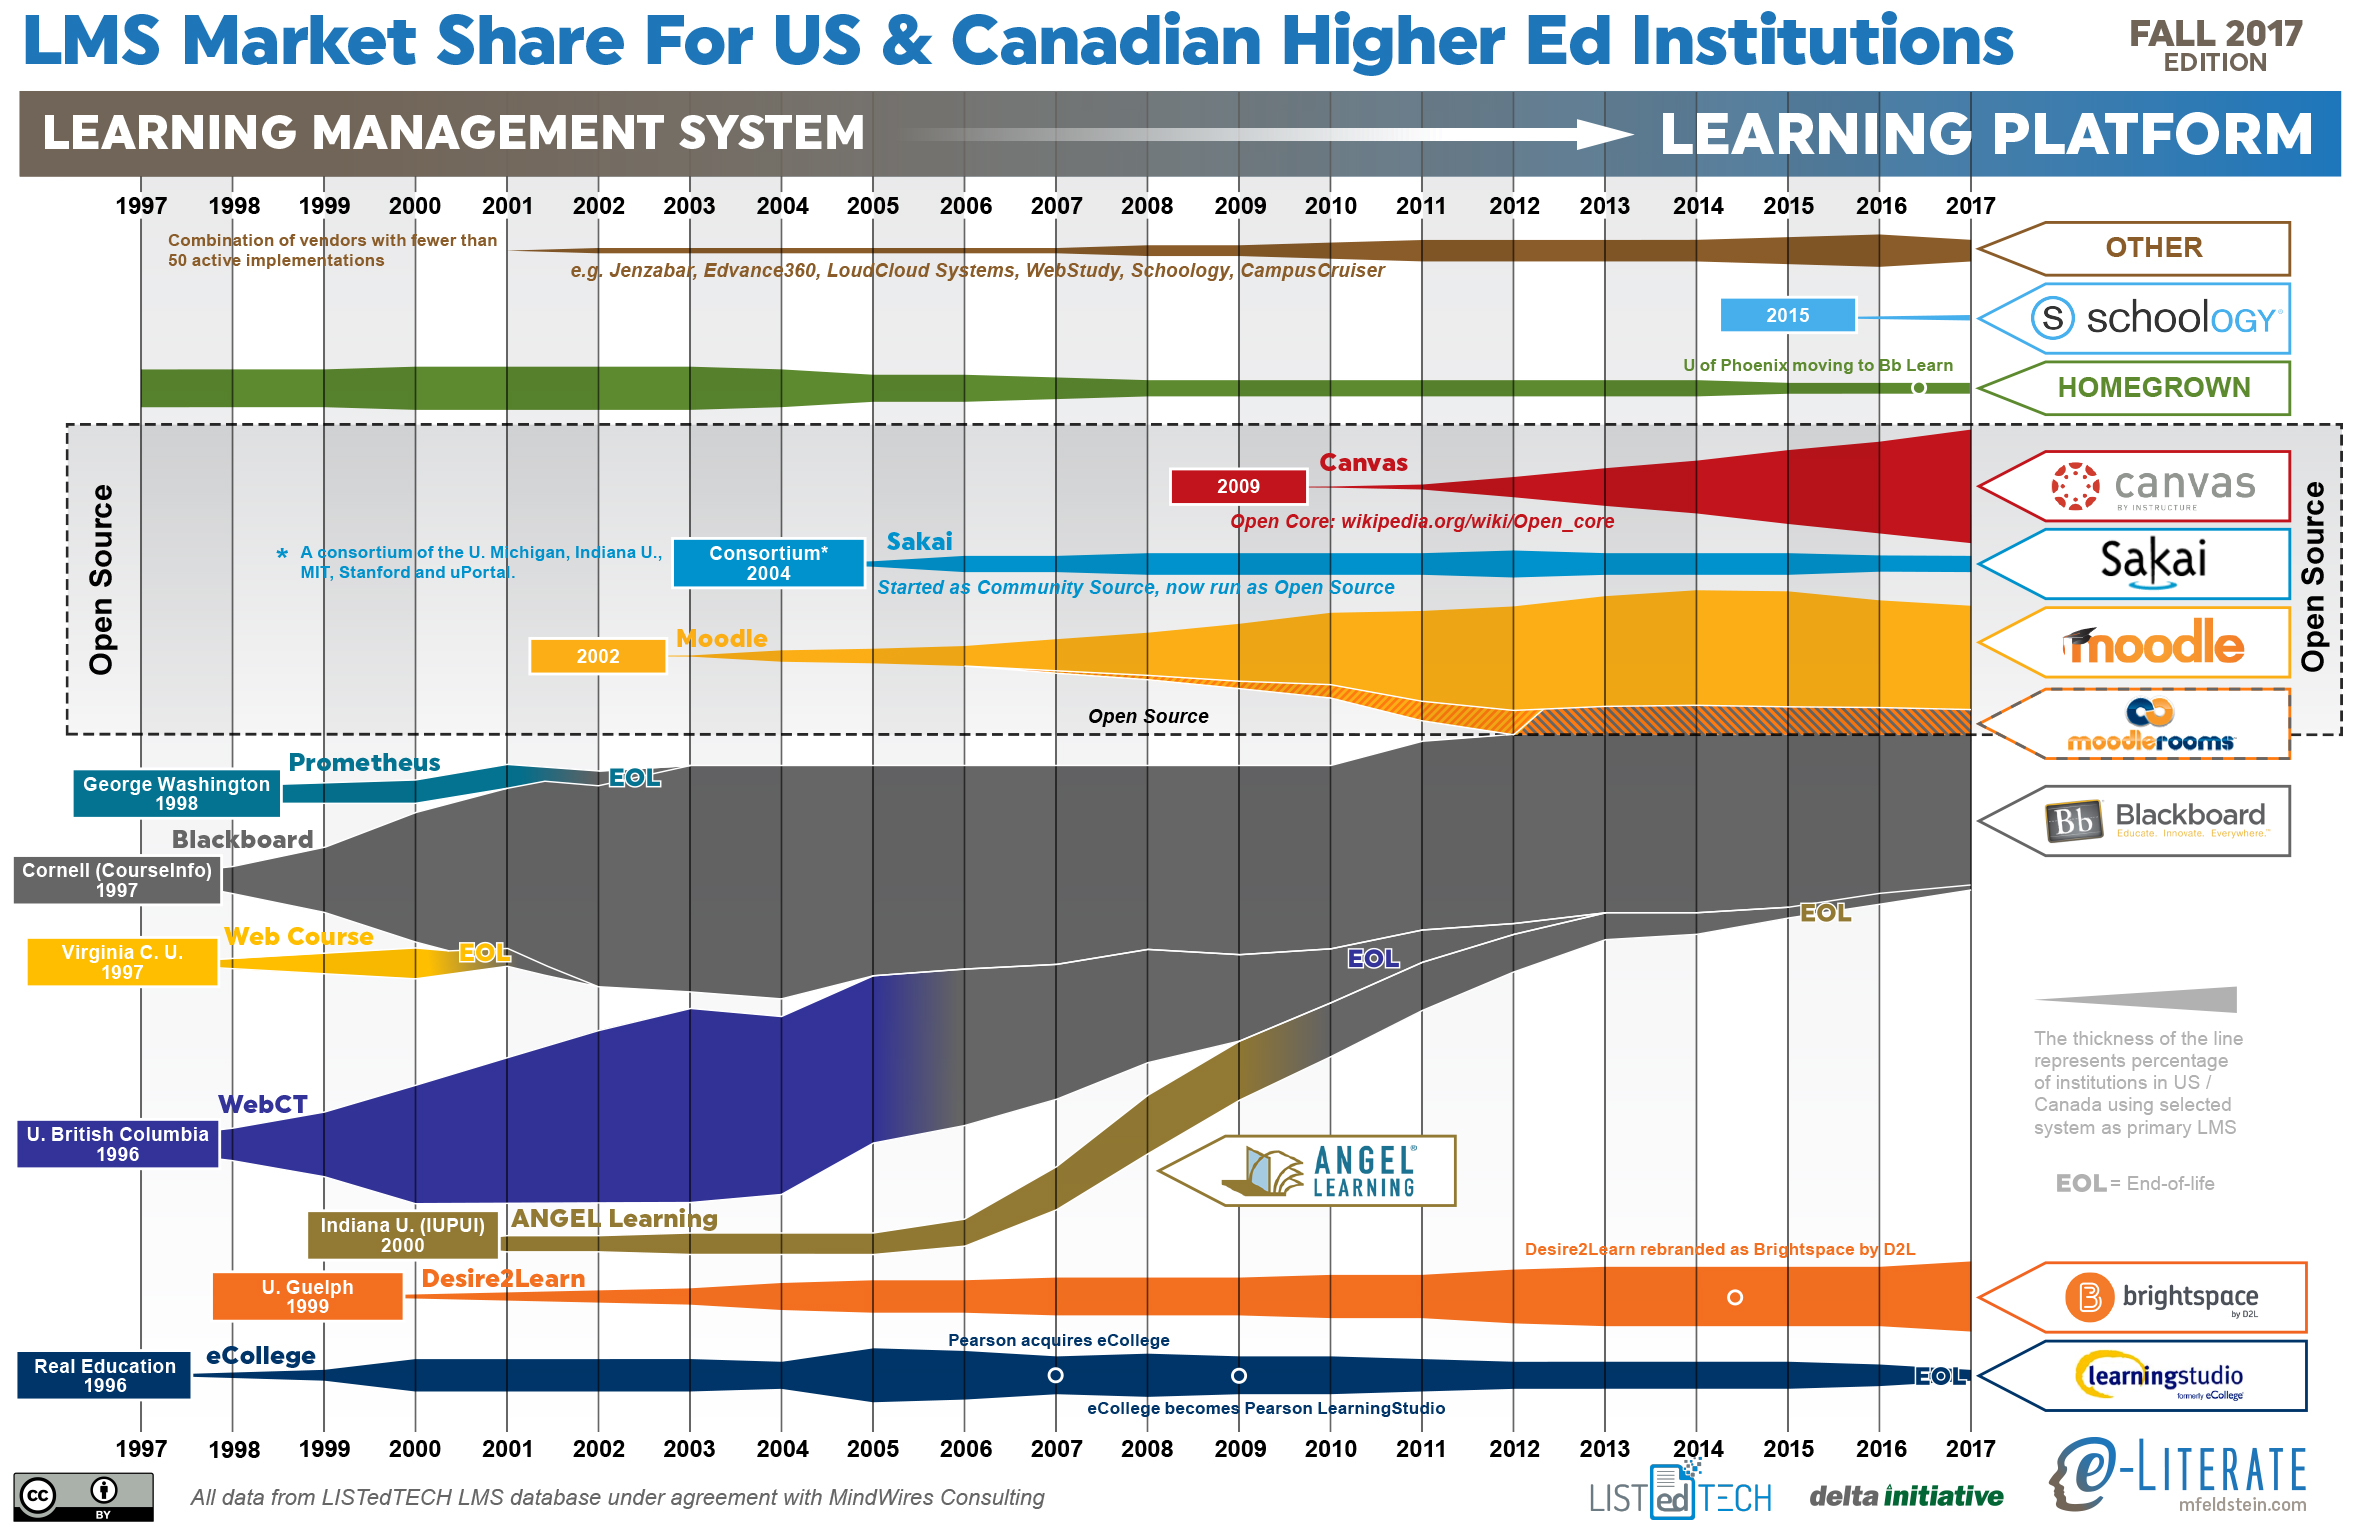
    But first, let’s look at an updated LMS market share graphic, commonly known as the squid graphic, for US and Canadian higher education. The original idea remains – to give a picture of the LMS market in one page, highlighting the story of the market over time. The key to the graphic is that the width of each band represents the percentage of institutions using a particular LMS as its primary system.

    Higher ed LMS market share for US and Canada, January 2019

    This year there are two inter-related trends that deserve a broader explanation -the LMS market slowed down with less activity overall, and Canvas and Blackboard continue to be neck-and-neck in the top spot of this market.

    We recently described the overall market activity slowdown in that there are fewer LMS formal evaluations taking place since mid 2018, with initial data pointing to a 20 – 25% drop from a year earlier. This slowdown seems to be a type of plateau rather than a continuing trend, and we are watching to see if it is temporary or not.

    Last summer we shared the symbolic passing of the torch where Canvas surpassed Blackboard in US market share, which was the first time Blackboard was not the top system since the market emerged two decades ago. What is interesting is that half a year later, the two systems are still neck-and-neck. In the US Canvas is still slightly ahead, and in North America (adding in Canada), Blackboard remains in the top spot by 0.4% (26.8% to 26.4%). Why is Canvas not continuing to extend its lead? Looking at the underlying data, there seems to be three reasons to consider:

    • The overall market slowdown means that there are fewer deals for Canvas to win lately.
    • Blackboard continues its University of Phoenix implementation, which still includes dozens of campuses despite its enrollment drop.
    • The shutdown in December of the for-profit Education Corporation of America (Virginia College and Brightwood College systems) meant that Canvas lost several dozen campuses.

    The latter two points should fully play out in the next three months, possibly making this a one-time change in trends, but it is important to call this situation out.

    Some other notes:

    • The market continues to consolidate around the Big Four – Blackboard, Canvas, D2L Brightspace, and Moodle.
    • The Homegrown option for LMS usage is going away, at least in a statistical sense. Only a handful of schools even consider this option.
    • D2L shares the challenge of having picked up several large for-profit systems that are closing campuses and therefore hurting market share. In D2L’s case, the biggest one is the former EDMC schools – the Art Institutes, Argosy University, and South University – that were sold out of bankruptcy to a non-profit entity and have closed dozens of campuses over the past year. These losses offset many of D2L’s wins in 2018.
    • Moodle had a few new wins in North America.

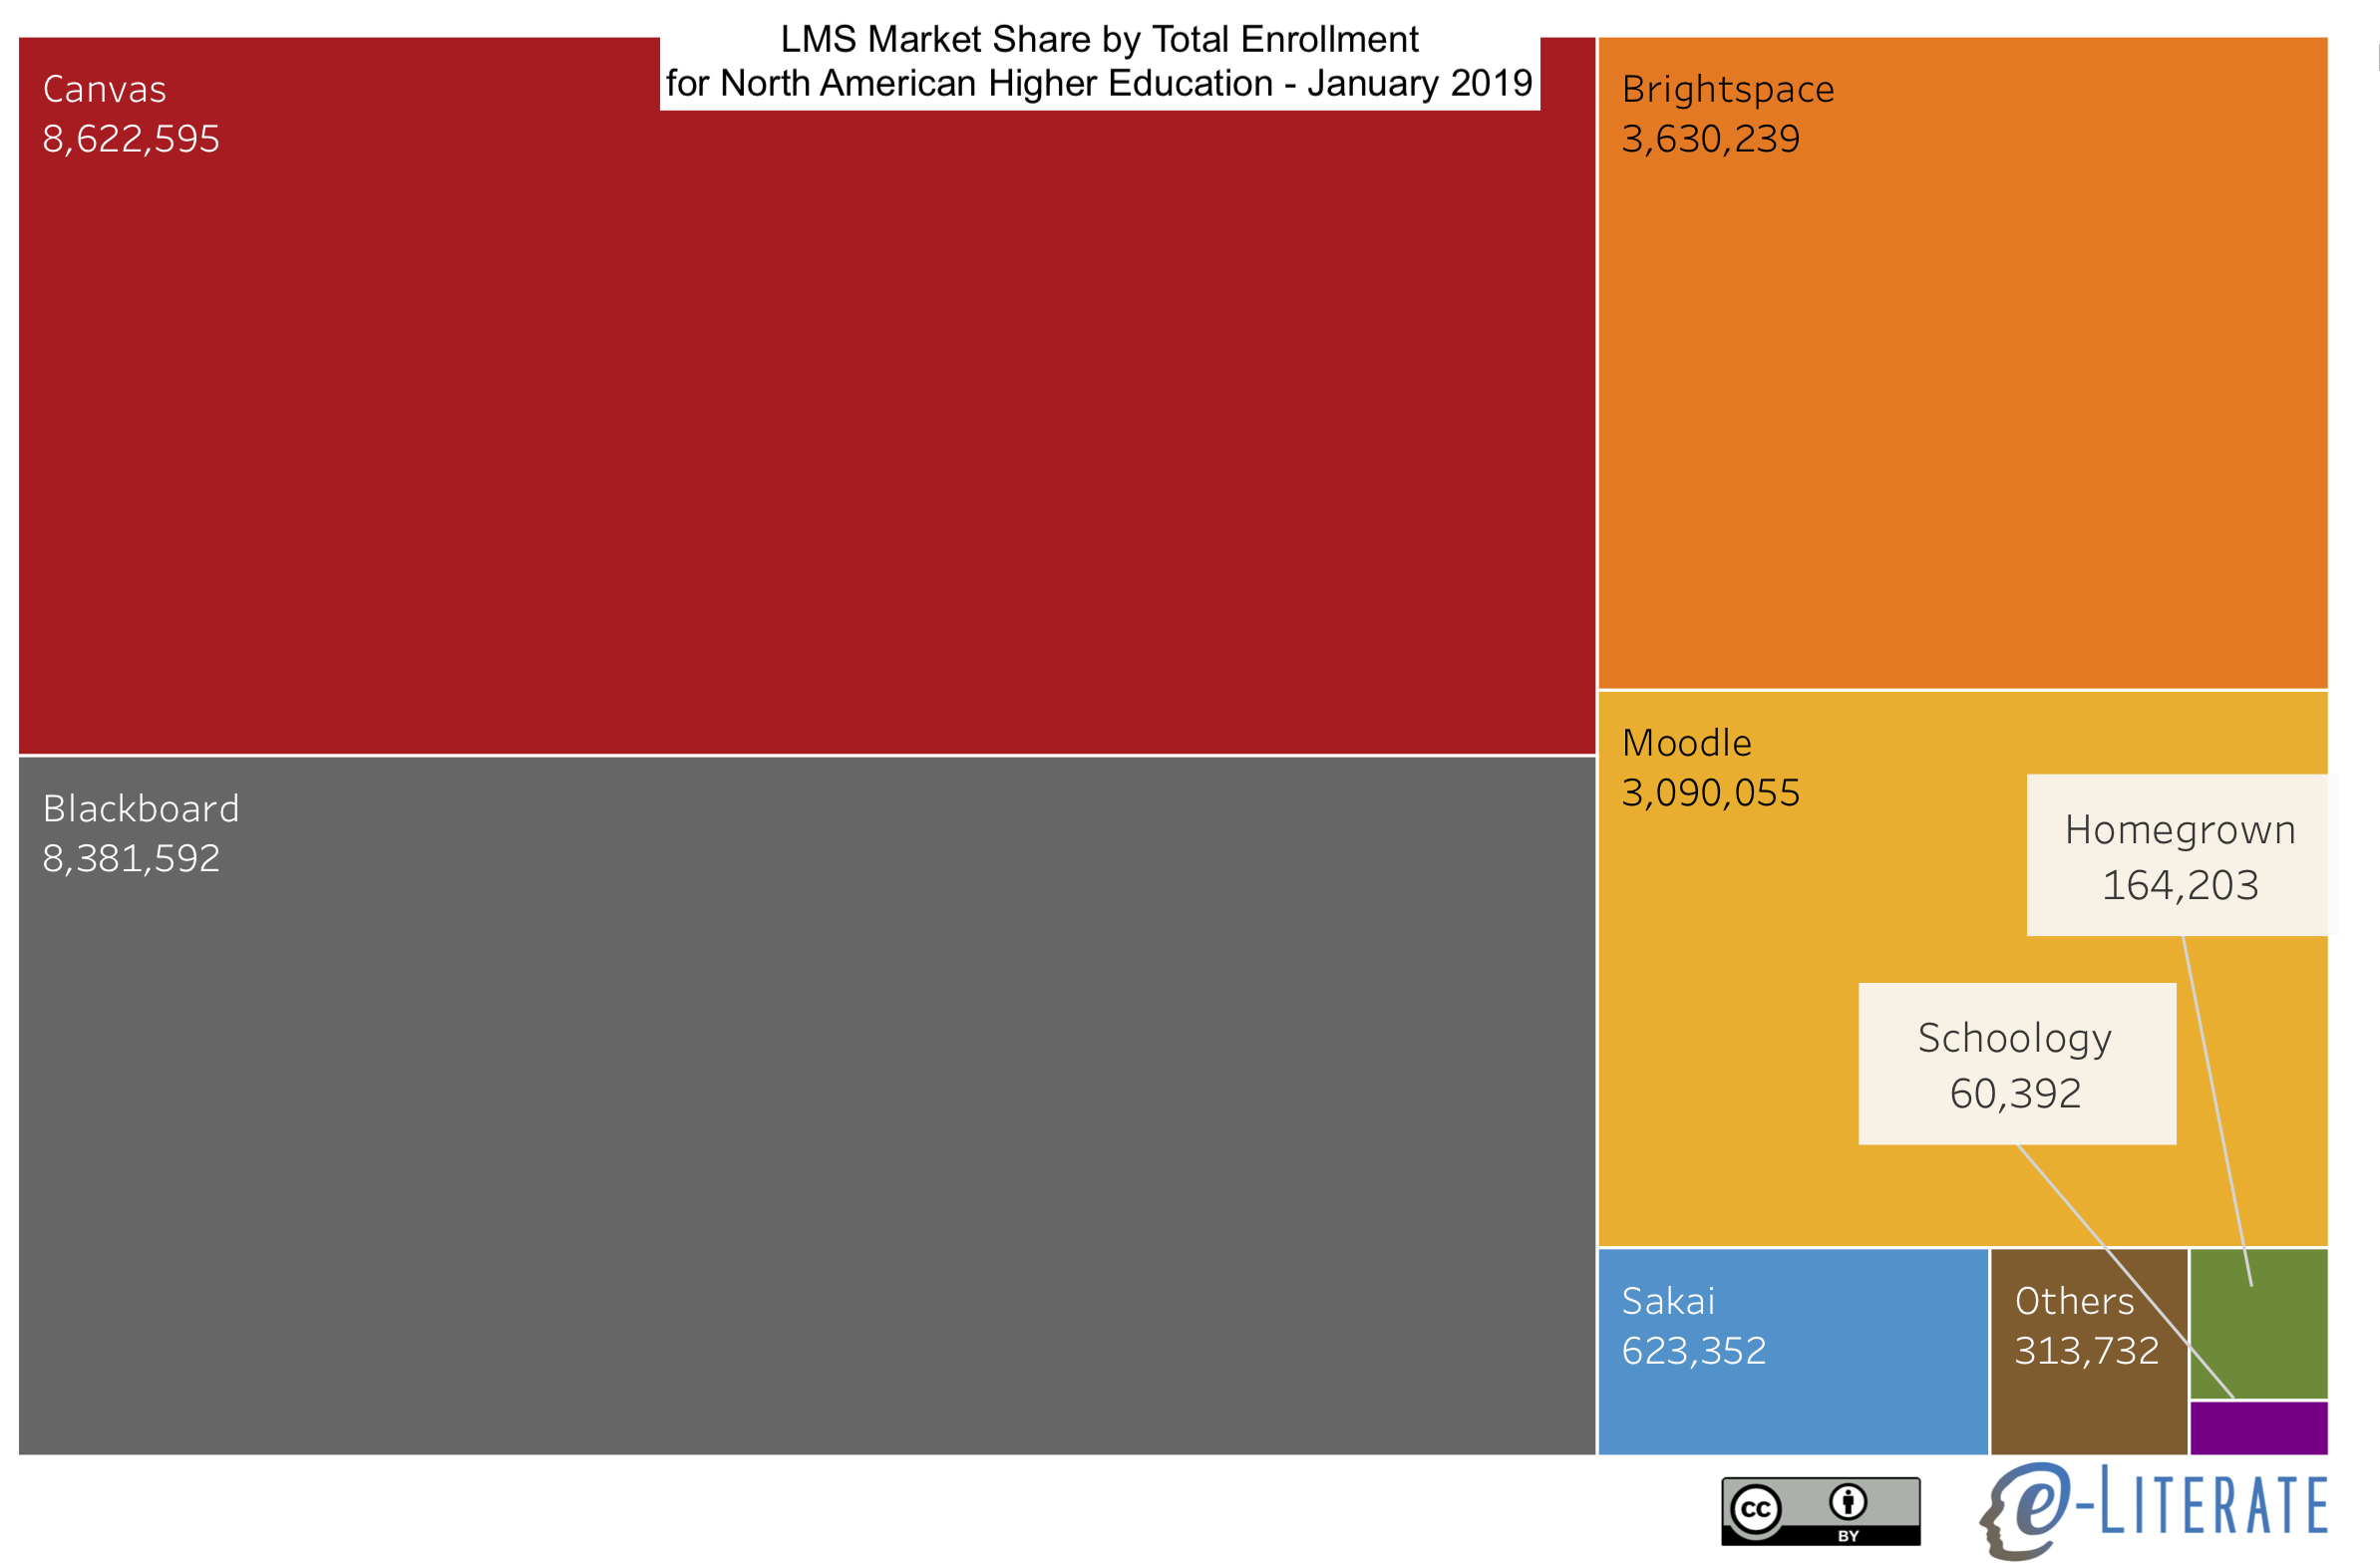
    Sticking with North America, we can also show LMS market share scaled by the enrollment of each institution, giving a different measure worth considering.

    NA LMS Market Share by Enrollment

    We’ll share more information on other global regions in the coming months.

  • Contrasting LMS Adoption Patterns in Four English-Speaking Countries

    Contrasting LMS Adoption Patterns in Four English-Speaking Countries

    The article is Cross-posted at LISTedTECH.

    One of the trends we have been covering is the gradual consolidation of global LMS markets in higher education around “the Big Four”, Moodle, Blackboard, Canvas, and D2L Brightspace. While there are market similarities in terms of this consolidation along with the broader move to the cloud, it would be a mistake to view various global regions as having the same same trends overall, even in a subset of English-speaking countries.

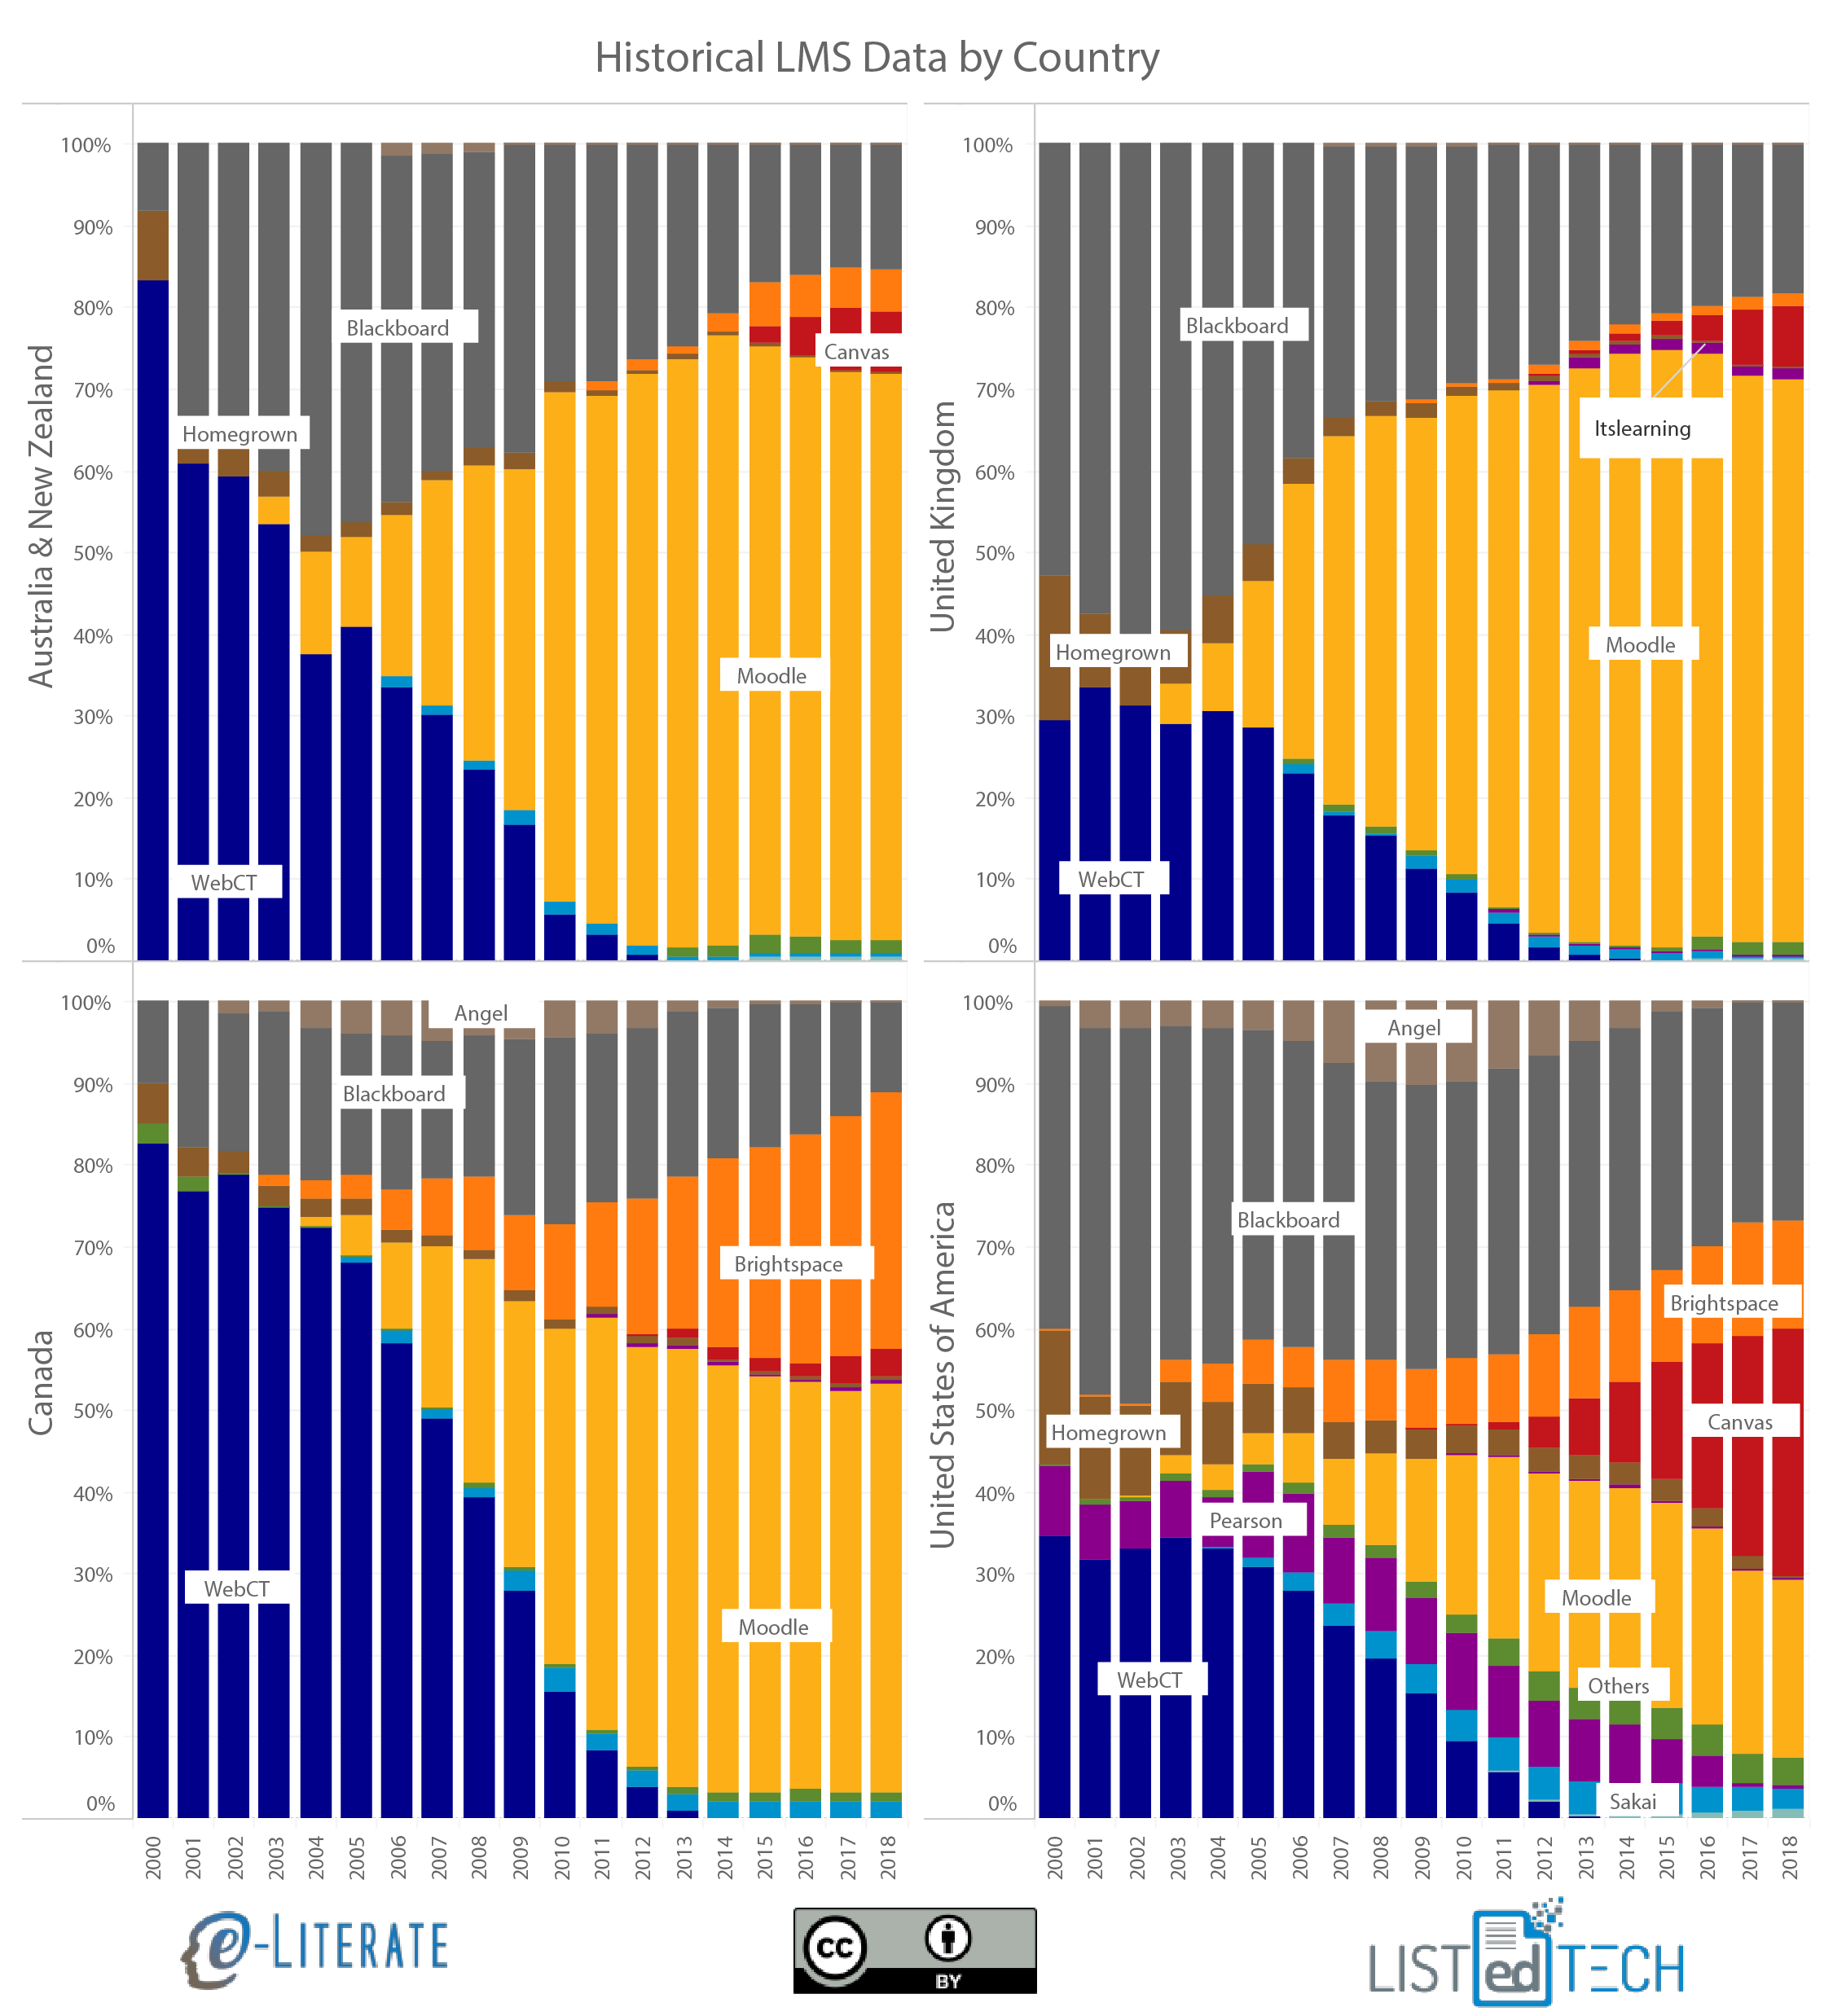
    By taking a step back and looking at institutional market share per country per year since 2000 (i.e. the percentage of higher education institutions having a particular LMS as their primary system), different adoption patterns become more apparent. In this case we’re looking at Australia / New Zealand (see note below), the United Kingdom, the US, and Canada. Note ahead of time that Blackboard acquired WebCT in 2004 and ANGEL in 2009 – this view separates out the product lines regardless of ownership, thus “Blackboard” means “Blackboard Learn / Academics Suite”. Also note that his is just one subset of the global market intended to show different patterns.

    Historical LMS adoption in US, Canada, UK, Australia & New Zealand

    • While the very early market was practically a duopoly, the preference for WebCT vs. Blackboard varied significantly.
    • Australia and New Zealand have a rich history of homegrown LMS development, including CECIL (University of Auckland in New Zealand), which some argue was the very first web-based LMS. There was still quite a bit of Homegrown LMS activity in the early 2000s along with a strong early preference for WebCT over Blackboard. Australia is the home country for Moodle (Perth), yet it lagged the UK in terms of late 2000s adoption of that system.
    • The UK showed a preference for Blackboard over WebCT, while also having significant Homegrown LMS adoptions early in the 2000s. Starting in 2003 we see the most rapid shift towards Moodle of any of these four countries, followed by a more recent move towards Canvas starting in 2013, starting with the Birmingham University adoption.
    • Canada is the home country for both WebCT (Vancouver, British Columbia) and D2L Brightspace (Kitchener, Ontario), and accordingly we see the highest percentages for both systems. This country also shows the slowest market gains for Canvas compared to the other three. Overall, early in the market, Homegrown solutions were much more common.
    • The US – home country to Blackboard, Pearson, Canvas, and Sakai –  is seen as an outlier by not having Moodle as the dominant system in terms of installed base. Pearson LearningStudio, formerly eCollege, was quite important in the US market, largely due to its position in the for-profit sector. And this is the leading country in terms of Canvas installed base and growth.

    There are other patterns to see in the data, but the overall point is to note how different adoption patterns can be in the LMS market, even for a subset of English-speaking countries since 2000. ((Disclosure: Blackboard, D2L, Moodle HQ, Instructure are all subscribers to our LMS Market Analysis service.))

    Update 27 Nov: We have duplicated the x axis to show on both levels for clarify. The data is based on number of institutions and represent running totals of active implementations where we have implementation / decommission dates – approximately 75% of all known active systems. The current totals used for each country are approximately 200 for Australia, 250 for Canada, 700 for the UK, and 3,500 for the US.

    Update 30 Nov: In an embarrassing mistake I credited CECIL to Australia when it was based at the University of Auckland in New Zealand. We have since updated the graphic to include both countries combined and edited the description of that region’s Homegrown activity. The article now combines Australia and New Zealand and treats as one country for the purposes of this analysis.

  • North American Higher Ed LMS Market Share by Enrollments: A consolidating market

    North American Higher Ed LMS Market Share by Enrollments: A consolidating market

    We have published market share data measured by total institutional enrollment instead of institutional count in several posts at e-Literate over the years, within the twice-annual reports of our LMS Market Analysis service, and for several of our premium subscribers of the same service. In July of this year we reported that Canvas had overtaken Blackboard as the market leader in US higher education in terms of institutional adoptions as well as scaled by enrollment. These last two posts got a fair amount of media and vendor attention.

    What we have realized, however, is that we have not made this information on market share by enrollment easy to access in one place. LMS company revenue tends to be based on the total enrollment of adopting institutions, thus this enrollment-based measure provides a more direct connection to company finances. Given the increased importance of LMS provider business models and revenue to the future trends of the market, we are sharing the information more broadly.

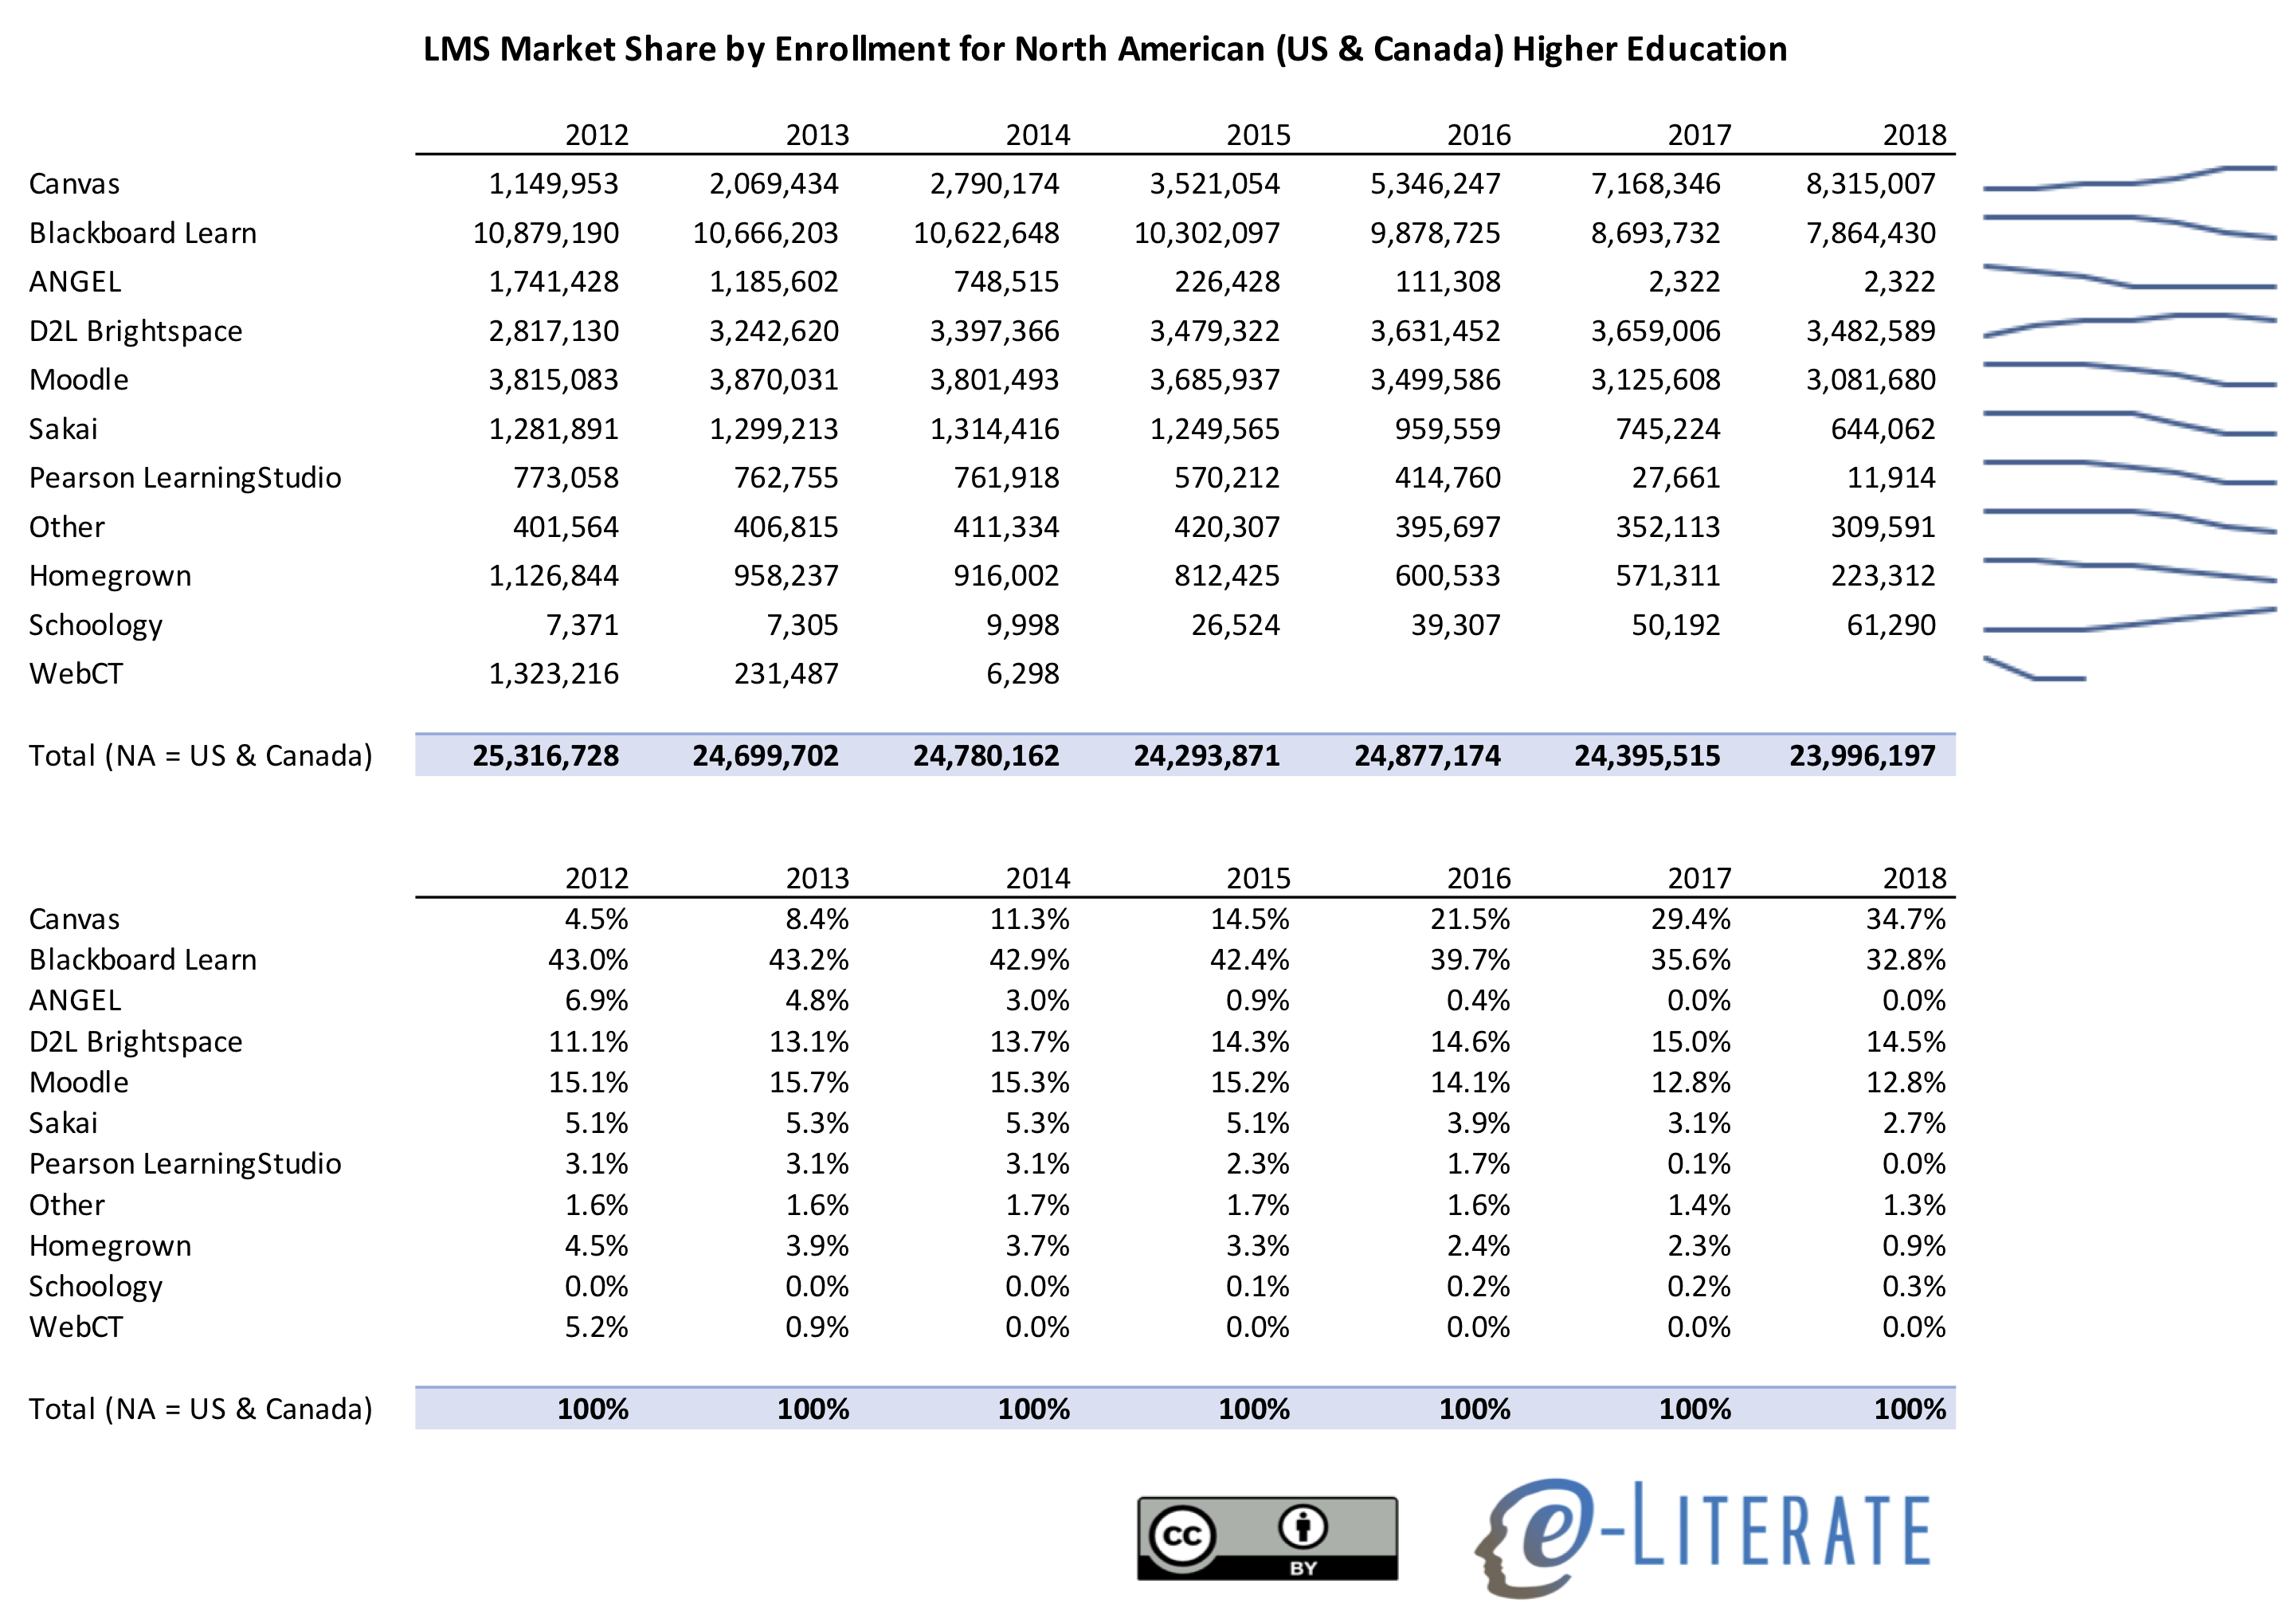
    In this view below we share North American (US and Canada combined) total enrollment for LMSs that are primary – that is, available for the entire institution. Total enrollment in this case means the institutional student count, but it does not imply that all students at that institution actually have courses using the LMS (see comment below from John Fritz). It is important to note that during an LMS transition there is often a period of time (6 – 18 months) where two systems overlap, with both available to the school. Therefore the total market share enrollments will be somewhat higher than actual total enrollments, as a subset of LMS-transitioning institutions will be counted twice.

    You can download a spreadsheet version here.

    LMS Market Share by Enrollment NA HE

    Some notes on the data worth considering:

    • Canvas has not just surpassed Blackboard Learn in this updated view, 35% to 33% – it has also expanded its lead as the most-adopted LMS in North American higher ed markets (while Moodle has clear lead worldwide in total installed base).
    • D2L Brightspace has been in third place for NA HE markets since 2016 when viewing by enrollments.
    • Moodle is fourth and has been dropping in recent years.
    • The top view of total enrollments adds in the effect of changing enrollments – both at a national level and an institutional level.
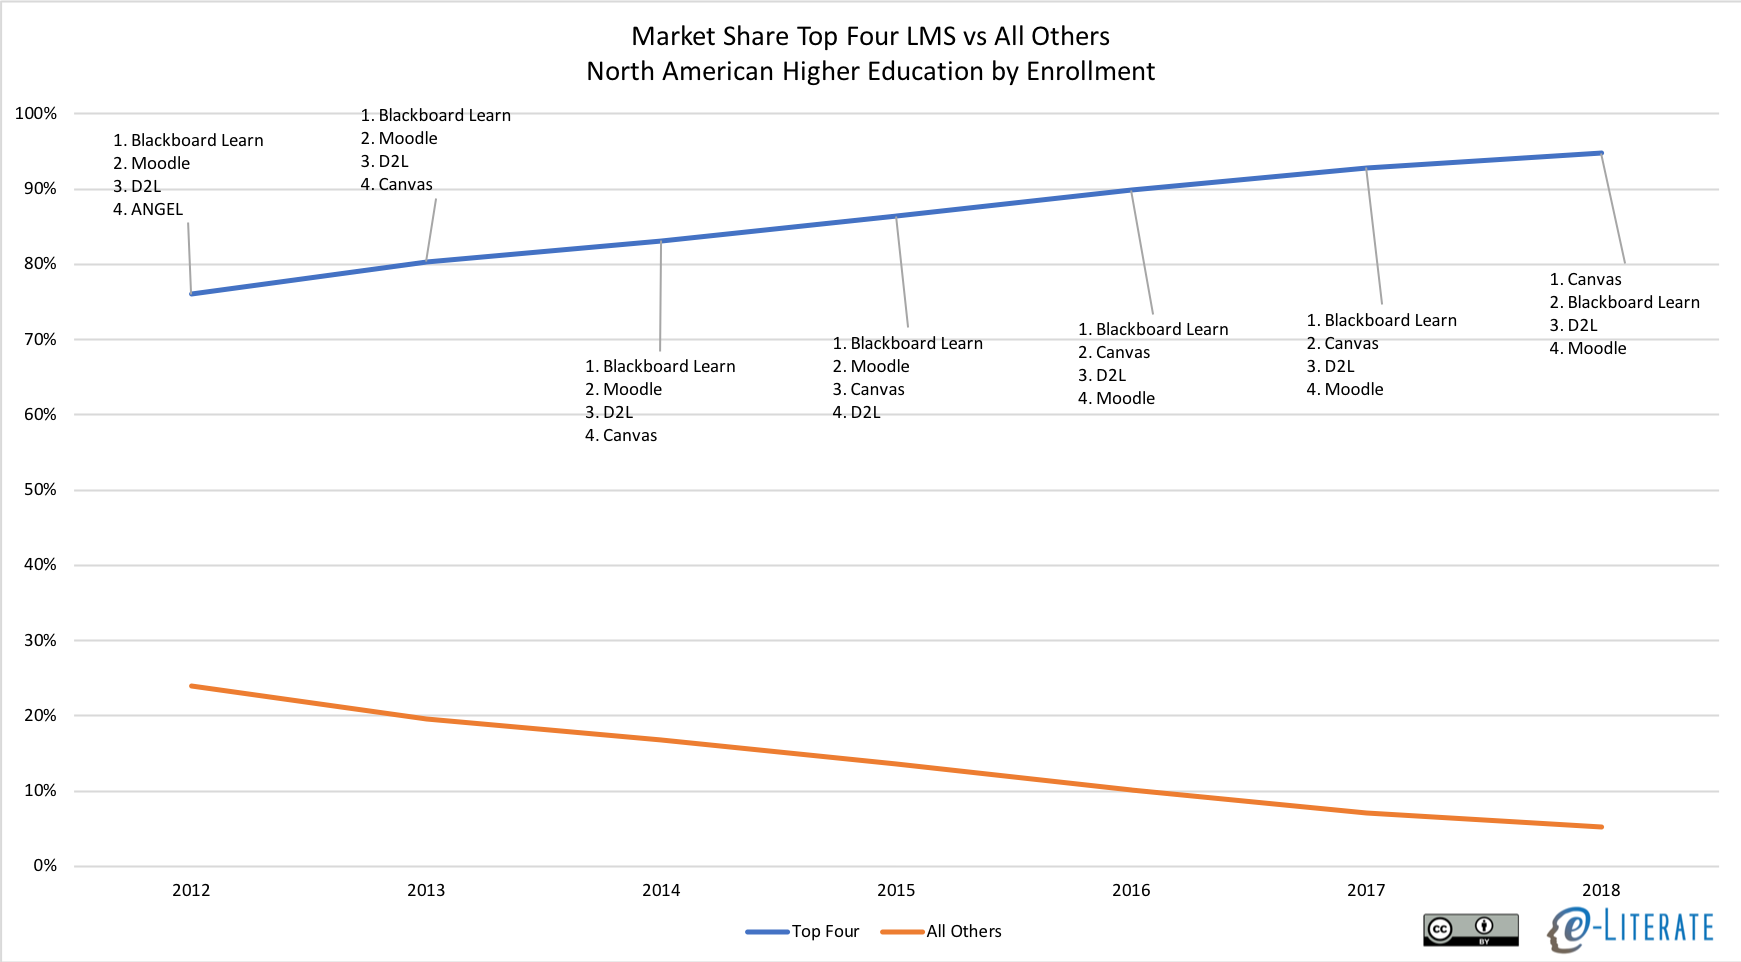
    • In the past five years, the LMS Market for North American higher ed has become increasingly dominated by “the Big Four” (Instructure Canvas, Blackboard Learn, D2L Brightspace, Moodle) for institution-wide adoptions; the aggregate market share of year’s top four systems moving from 80% to 95% in past five years.

    This last point deserves more analysis. There are other systems gaining new institutional clients (think Schoology here, or think CBE-specific platforms like Motivis), but they are mostly picking up either small schools or being adopted for specific programs and not for the entire institution.

    Consolidation of NA HE LMS Market

    Expect more coverage as we enter ed tech fall conference season.

    Update 8/3: Added sentence in third paragraph to clarify usage of total enrollment terminology.

  • Unizin Updates: A change in direction and a likely change in culture

    Unizin Updates: A change in direction and a likely change in culture

    After the resignation of Unizin’s CEO (Amin Qazi) and COO (Robin Littleworth) that we reported last week, we can confirm that the key issue was a change in direction for the consortium driven by the board of directors. Our information is based on on-the-record interviews with Qazi and Littleworth and additional interviews with Unizin staff, member institution staff, and outside sources. We believe this change in direction led to the resignations and will likely also lead to a change in emphasis on various Unizin initiatives.

    To recap what happened last week and add some details, there were two back-to-back board meetings for Unizin and Kuali held in Austin, TX. These meetings were not emergency meetings and were scheduled a long time ago, based on Unizin’s headquarters and Kuali’s users conference being held in that city. In an interview and follow-up discussion over the past few days, Amin Qazi described how he had not expected to resign going into the week. But in a meeting last Monday with the executive committee of Unizin, the board described a change in direction that they wanted to make, focusing on investments in initiatives with shorter-term visibility instead of those with a longer-term payoff such as the Open edX and Google partnerships. Qazi said that he was not the right person to lead the company in that direction, and after this meeting he resigned.

    I was told that Monday night Rob Lowden, Associate Vice President of Enterprise Systems at Indiana University, was asked to fly down to Austin based on this resignation. At the Tuesday Unizin board meeting, they approved his selection as interim executive director while the board searches for a new CEO. Robin Littleworth described that he was told somewhat conflicting information in his meeting with the board in that there was no change in direction.

    Coming out of the the board meeting, there was an all-hands meeting with Unizin staff, and board members told them of the changes. There was a question about rumors that Kuali.co might be acquiring Unizin, and the board members stated that this rumor was not true. Later in the meeting Littleworth gave an impassioned speech that the staff was the company, and that due to the changes and how they were handled the board had seriously harmed the company culture. He then announced his resignation. According to Littleworth, he hopes that his resignation and speech might alert the board that they didn’t think the situation all the way through and that they should reconsider how to support the company moving forward. Rob Lowden, for his part, still has his full-time job at Indiana University, but he told staff during this meeting that he would be commuting weekly to Austin for the next several months during the transition.

    I suspect that we’ll need to analyze the change in direction in more depth as details come out, but I believe that this situation is not based on finances or problems getting member institutions to recommit; rather it is a matter of emphasis on shorter-term versus longer-term initiatives.

    All Unizin member institutions that signed on in 2014 have re-signed to new three-year agreements, and according to Unizin Form 990 submissions, the consortium had $2 million in assets as of summer 2016 while running a surplus – meaning that this balance is should be even higher today. Furthermore, Littleworth stated that the Unizin management team was “not given any indication from our Board, let alone anything in writing, that we were at all underperforming or not meeting expectations”.

    What Qazi and Littleworth were pushing for were initiatives that directly addressed member institution needs even though they may take time to develop. One example is the recently-announced Open edX partnership. In an interview with Thomas Evans at The Ohio State University, he described that school’s desire to explore micro-credentials and to figure out how that would fit into an overall OSU strategy. Despite OSU’s partnership with Coursera, or actually because of it, the school did not want to figure this out with a platform company that would take a percentage of revenue. The Unizin / Open edX agreement is allowing OSU to pilot programs and figure out a strategy over the next few years.

    What we are likely to see with the Unizin change in direction is a stronger emphasis on partnerships and developments focused on near-term positioning of the consortium, include the BNED LoudCloud analytics partnership.

    The key intellectual property that Unizin has developed over the past few years is the Unizin Data Platform with its associated Unizin Common Data Model (UCDM). From a post on the UCDM:

    The UCDM rules map student, course, instruction, and learning activity information together. They solve the problem of “connecting the dots” between all of the data sources to create a single view of the student in the context of learning. As the data flows in from the SIS, LMS, and learning tools, the rules are applied to each data element, like a puzzle piece, to make sure that it is oriented to contribute to the whole picture.

    We at e-Literate have been critical of Unizin over the years for not having a clear value proposition. But from my conversations over the past two years with Unizin member institutions, the biggest value thus far from the consortium was this data platform and the hard work done to turn messy LMS and SIS data into usable formats. We have also heard from two outside sources recently that Unizin has had some real success using Engage to provide Inclusive Access digital content (course content available day one of term through institutional agreements) to several schools. And the OSU description of why they are using Open edX is compelling with its alignment with the stated Unizin mission.

    We don’t know all the details of the change in direction, but we believe this change is what triggered the management resignations last week. I will be quite interested to see if the changes affect the three initiatives mentioned above and pull the organization backwards in terms of creating value for its member institutions.

    Given the change, however, I believe there will also be a corresponding change in company culture that is inevitable at Unizin. Qazi and Littleworth (I have had many more interactions with the former but believe both to have been aligned) had an open, transparent, collegial style. Rather than ever getting defensive from questions we have asked or posts we have written at e-Literate, the two departing Unizin executives went out of their way to listen to criticism, engage us in conversations, and not try and control messaging but favor transparency instead.

    Qazi described how he was honored to have had the responsibility to guide Unizin through hard three years of launching the company, and he is proud of the team that Unizin has – they have a great deal of passion and dedication, and they have been asked to solve some very different problems from universities. Littleworth also expressed his primary pride in the Unizin staff and what they are accomplishing.

    By way of contrast, we have found the Unizin board to be quite focused on controlling the message. The board specifically asked both Qazi and Littleworth to not talk to me, but given their lack of employment agreements controlling who they talked to, both declined. I have asked to speak to board members for this story over the past few days with no response until they put out a press release today. The press release thanked Qazi for his service in a classy way and briefly noted Lowden’s new role while not mentioning Littleworth. But there is no information that I did not already have. After the press release came out I was invited, not by a board member but by a communications specialist, to submit questions for the board to address. I will do so for follow-up analysis.

    There is little doubt in my mind that the new Unizin leadership will be much more tightly controlled by the Unizin board, and they will take on much more of the board’s characteristics. This will likely lead to a change in company culture.

    Where does this leave Unizin? The consortium has money and three-year agreements in place. But there is a lot of work to be done before the consortium can deliver the value justifying $250k – $427k per year membership fees. As Littleworth described, the company is still in its infancy but now is changing direction while missing its critical leadership.

    While the following is not based on my interviews, I find the choice of Lowden as interim executive director to be quite interesting and a big part of the reason that I believe the ‘change in direction’ argument. If the board truly wanted to continue same direction despite Amin’s resignation, why not promote Steve Scott (CTO) or Robin Littleworth (COO), at least during transition? Remember that Littleworth did not resign until after Lowden was selected, and there was no discussion with the former COO about what to do next. Bringing in someone from outside so quickly seems to be significant. Furthermore, Lowden has a long history at Indiana University working for Unizin co-founder Brad Wheeler, and he was also involved early on at Sakai and then with the Kuali board – initiatives heavily influenced by Wheeler. Given his full-time job, the choice to use Lowden to replace full-time executive team for the next several months will lead to a challenging situation at a crucial time, to say the least, even though Qazi is staying on board through December to help with the transition. Was this choice partially worked out in advance, or did the board really react to Qazi’s resignation and find an interim replacement within 24 hours? What will Lowden be able to accomplish given his logistical challenges (Indianapolis vs. Austin and having multiple jobs). I will attempt to get answers from board on these questions.

    What I would watch over the next few months is whether Unizin loses additional staff due to the changes. And I would also watch the direction of the Unizin Data Platform in particular to understand the extent of changes to strategy.

  • Big Changes at Unizin: CEO and COO resign after board meeting

    Big Changes at Unizin: CEO and COO resign after board meeting

    Three and a half years after its formation, Unizin is facing its biggest challenge. Now that the consortium is dealing with contract renewals (membership based on three-year agreements), and now that it is a standalone organization and not wrapped under Internet2, Unizin will face the future without its top management.

    There’s a lot more here than just a change of one or two executives, and we plan to share more analysis next week here at e-Literate. We have also reached out to get comments from the various people involved. For now, however, here are the basics.

    This week there were two board meetings in Austin, TX – one for Unizin and one for Kuali – due to the logistics of having several people serving on both boards. We have confirmed based on multiple sources that after a meeting with the Unizin executive committee but before the board meeting, CEO Amin Qazi turned in his resignation. One day later, after the board approved a new interim CEO, COO Robin Littleworth turned in his resignation.

    The interim CEO is Rob Lowden, Associate VP Enterprise Systems at Indiana University and long-time active member of the Kuali community and prior to that in the Sakai community (including board positions in those two open source organizations). To the best of my knowledge, Lowden will remain in his job at IU while at the same time running Unizin until the board selects new executives.

    Expect more from us next week.

    Update: Clarified timing of resignation.

  • State of Higher Ed LMS Market for US and Canada: Fall 2017 Edition

    State of Higher Ed LMS Market for US and Canada: Fall 2017 Edition

    Now that we’re past the 2017 WCET conference and headed to the EDUCAUSE conference, let’s look at updates on the institutional LMS market for North America (US and Canada). Last year we started our LMS market analysis service, where we are working with LISTedTECH to provide market data and visualizations, and our fall report for subscribers will be released in about a month. Data for 2017 presented below goes through October 1 of this year.

    We present the data “by institutions”, with market share as a percentage of the total number of institutions using each LMS as a primary system, and “by enrollments”, where we scale the institutions by their total enrollment. The latter better captures the business of the LMS market, since most licensing deals are based the number of students. We have also included data from Fall 2016 by institutions for comparison purposes.

    Some notes on the market share as defined by percentage of institutions:

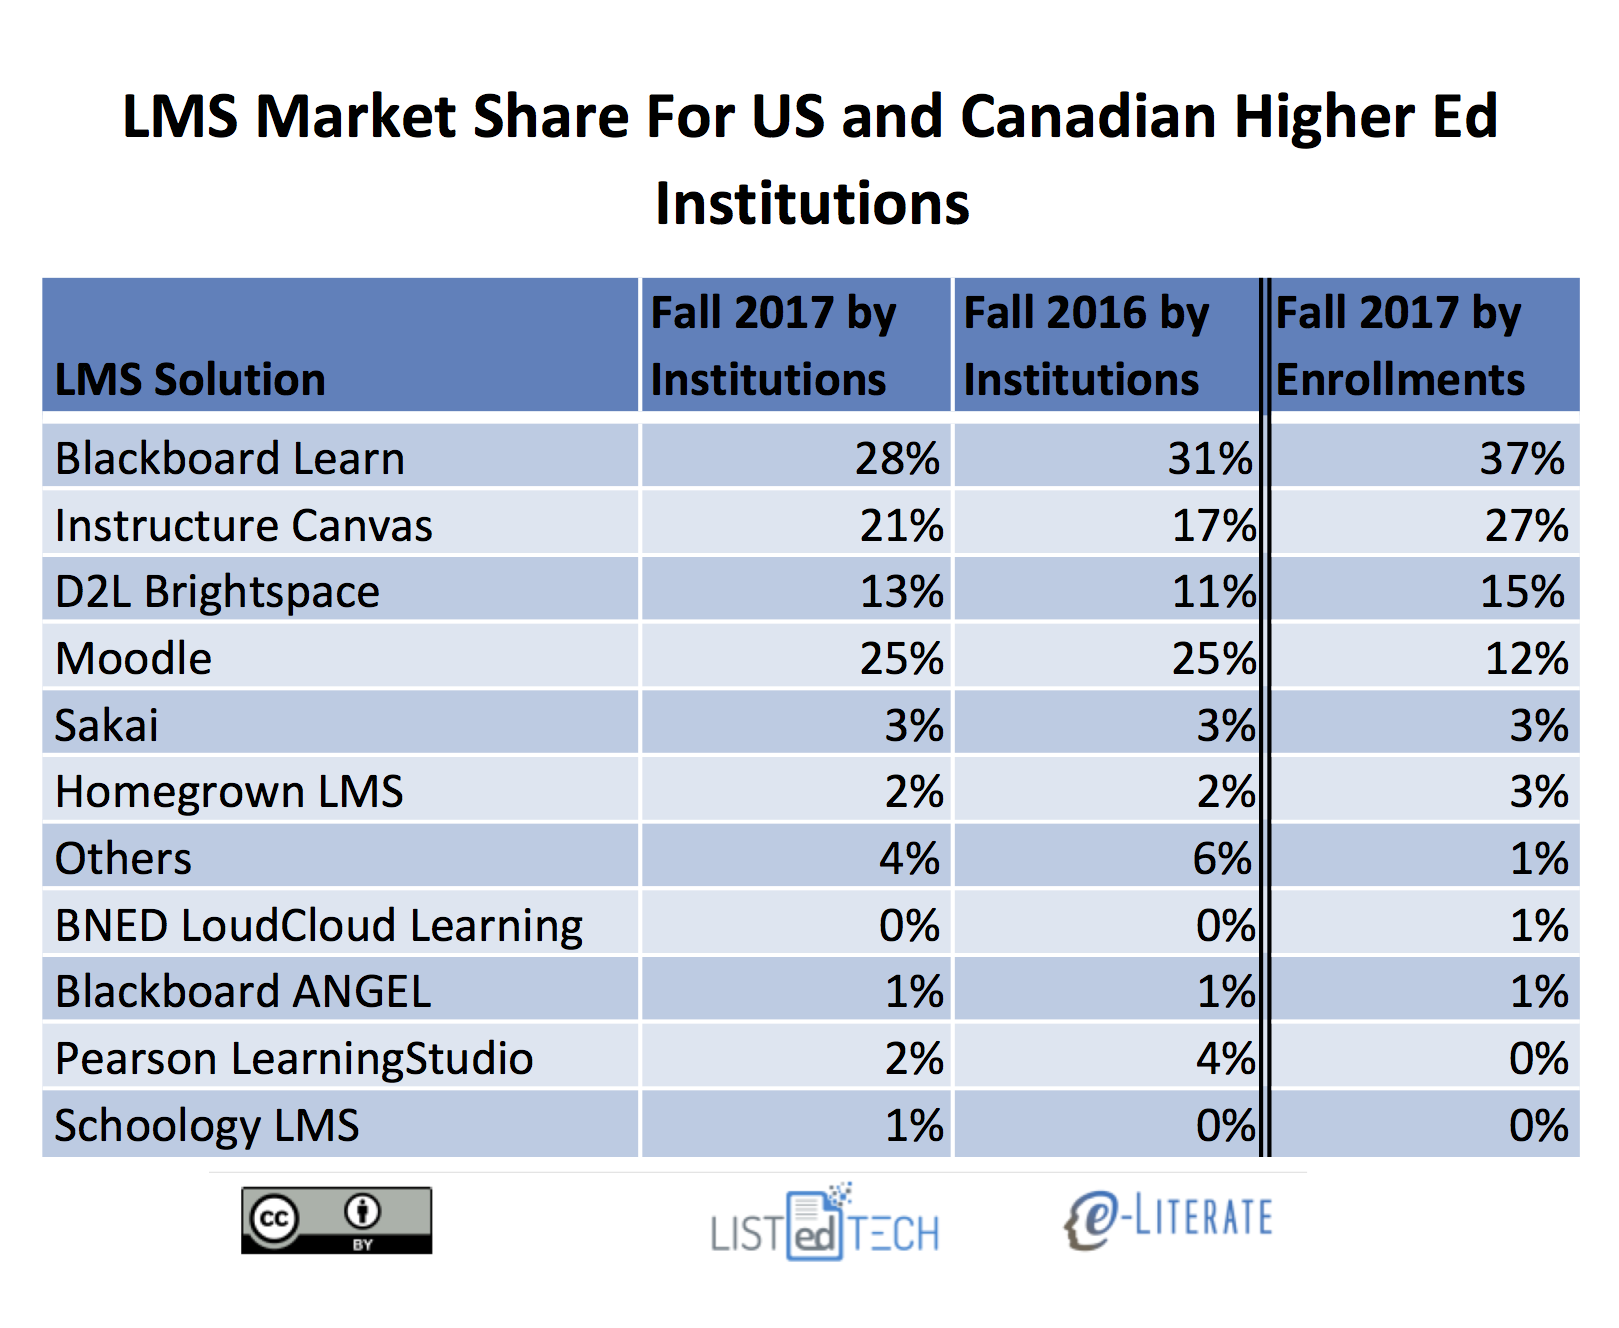
    • In terms of new selections the market continues to be a two-horse race recently with Canvas by Instructure and Brightspace by D2L as the only two solutions with material gains in market share. Canvas grew from 17% to 21% , and Brightspace from 11% to 13%, of the market.
    • Outside of the big four – Blackboard Learn, Canvas, D2L Brightspace, and Moodle – no other system has more than 3% of the market measured either by percentage of institutions or percentage of enrollments. Furthermore, the category of “Others”, capturing systems not listed above and having less than 1% market share, actually dropped from 4% to 2% of the market. This indicates that continued market consolidation.
    • Schoology and BNED LoudCloud grew slightly, but not nearly to the degree of the Canvas and Brightspace.
    • Blackboard Learn fell the farthest, from 31% to 28% of of the market. The second biggest drop was Pearson LearningStudio, from 4% to 2%, based on its end-of-life notice for December 2017.
    • Moodle and Sakai both lost market share of just under 1%, not enough to show up in the rounded numbers in the table but enough to show up in our underlying data.
    • The difference in Moodle’s market share by institutions at 25% and by enrollments at 12% really shows how concentrated their usage is for smaller schools.
    • When viewing market share as defined by percentage of enrollments, Blackboard and Canvas are the most-used systems, at 37% and 27% of the market, followed by D2L at 15% and Moodle at 12%.

    Stepping back from the immediate data, let’s look at an updated LMS market share graphic, commonly known as the squid graphic, for US and Canadian higher education. The original idea remains – to give a picture of the LMS market in one page, highlighting the story of the market over time. The key to the graphic is that the width of each band represents the percentage of institutions using a particular LMS as its primary system.

    Some additional notes:

    • Blackboard and Moodle have been the market leaders as number one and two in share as they have been for the past decade. However, Canvas is quickly approaching Moodle’s market share.

    We’ll share any updates we discover at the conference this week.

  • Academic LMS Market Share By Enrollments, Part Deux

    Academic LMS Market Share By Enrollments, Part Deux

    Based on our recent publication of market share data and graphics, we have had multiple requests to share similar data by enrollment. In Friday’s post I shared a non-traditional view of the LMS market based on the percentage of institutions within small, medium, and large enrollment bands for North America (US and Canada) and Europe. This view gave some interesting insights, particularly with large positive correlation (Canvas) and negative correlation (Moodle)  between enrollment bands and market share in North America. Meanwhile, there were other LMS solutions (D2L and Sakai in particular) that have fairly consistent distribution in market share.

    For this second view, instead of showing percentage of institutions within each enrollment band, the data is aggregated for all North American institutions and scaled by each institution’s official enrollment data (e.g. the US data is from IPEDS). The net result shows the percentage of enrollments across the region that have different LMS solutions as their primary system at their school. As always, the underlying data for these market share studies is provided by our partner LISTedTECH.

    Some Notes:

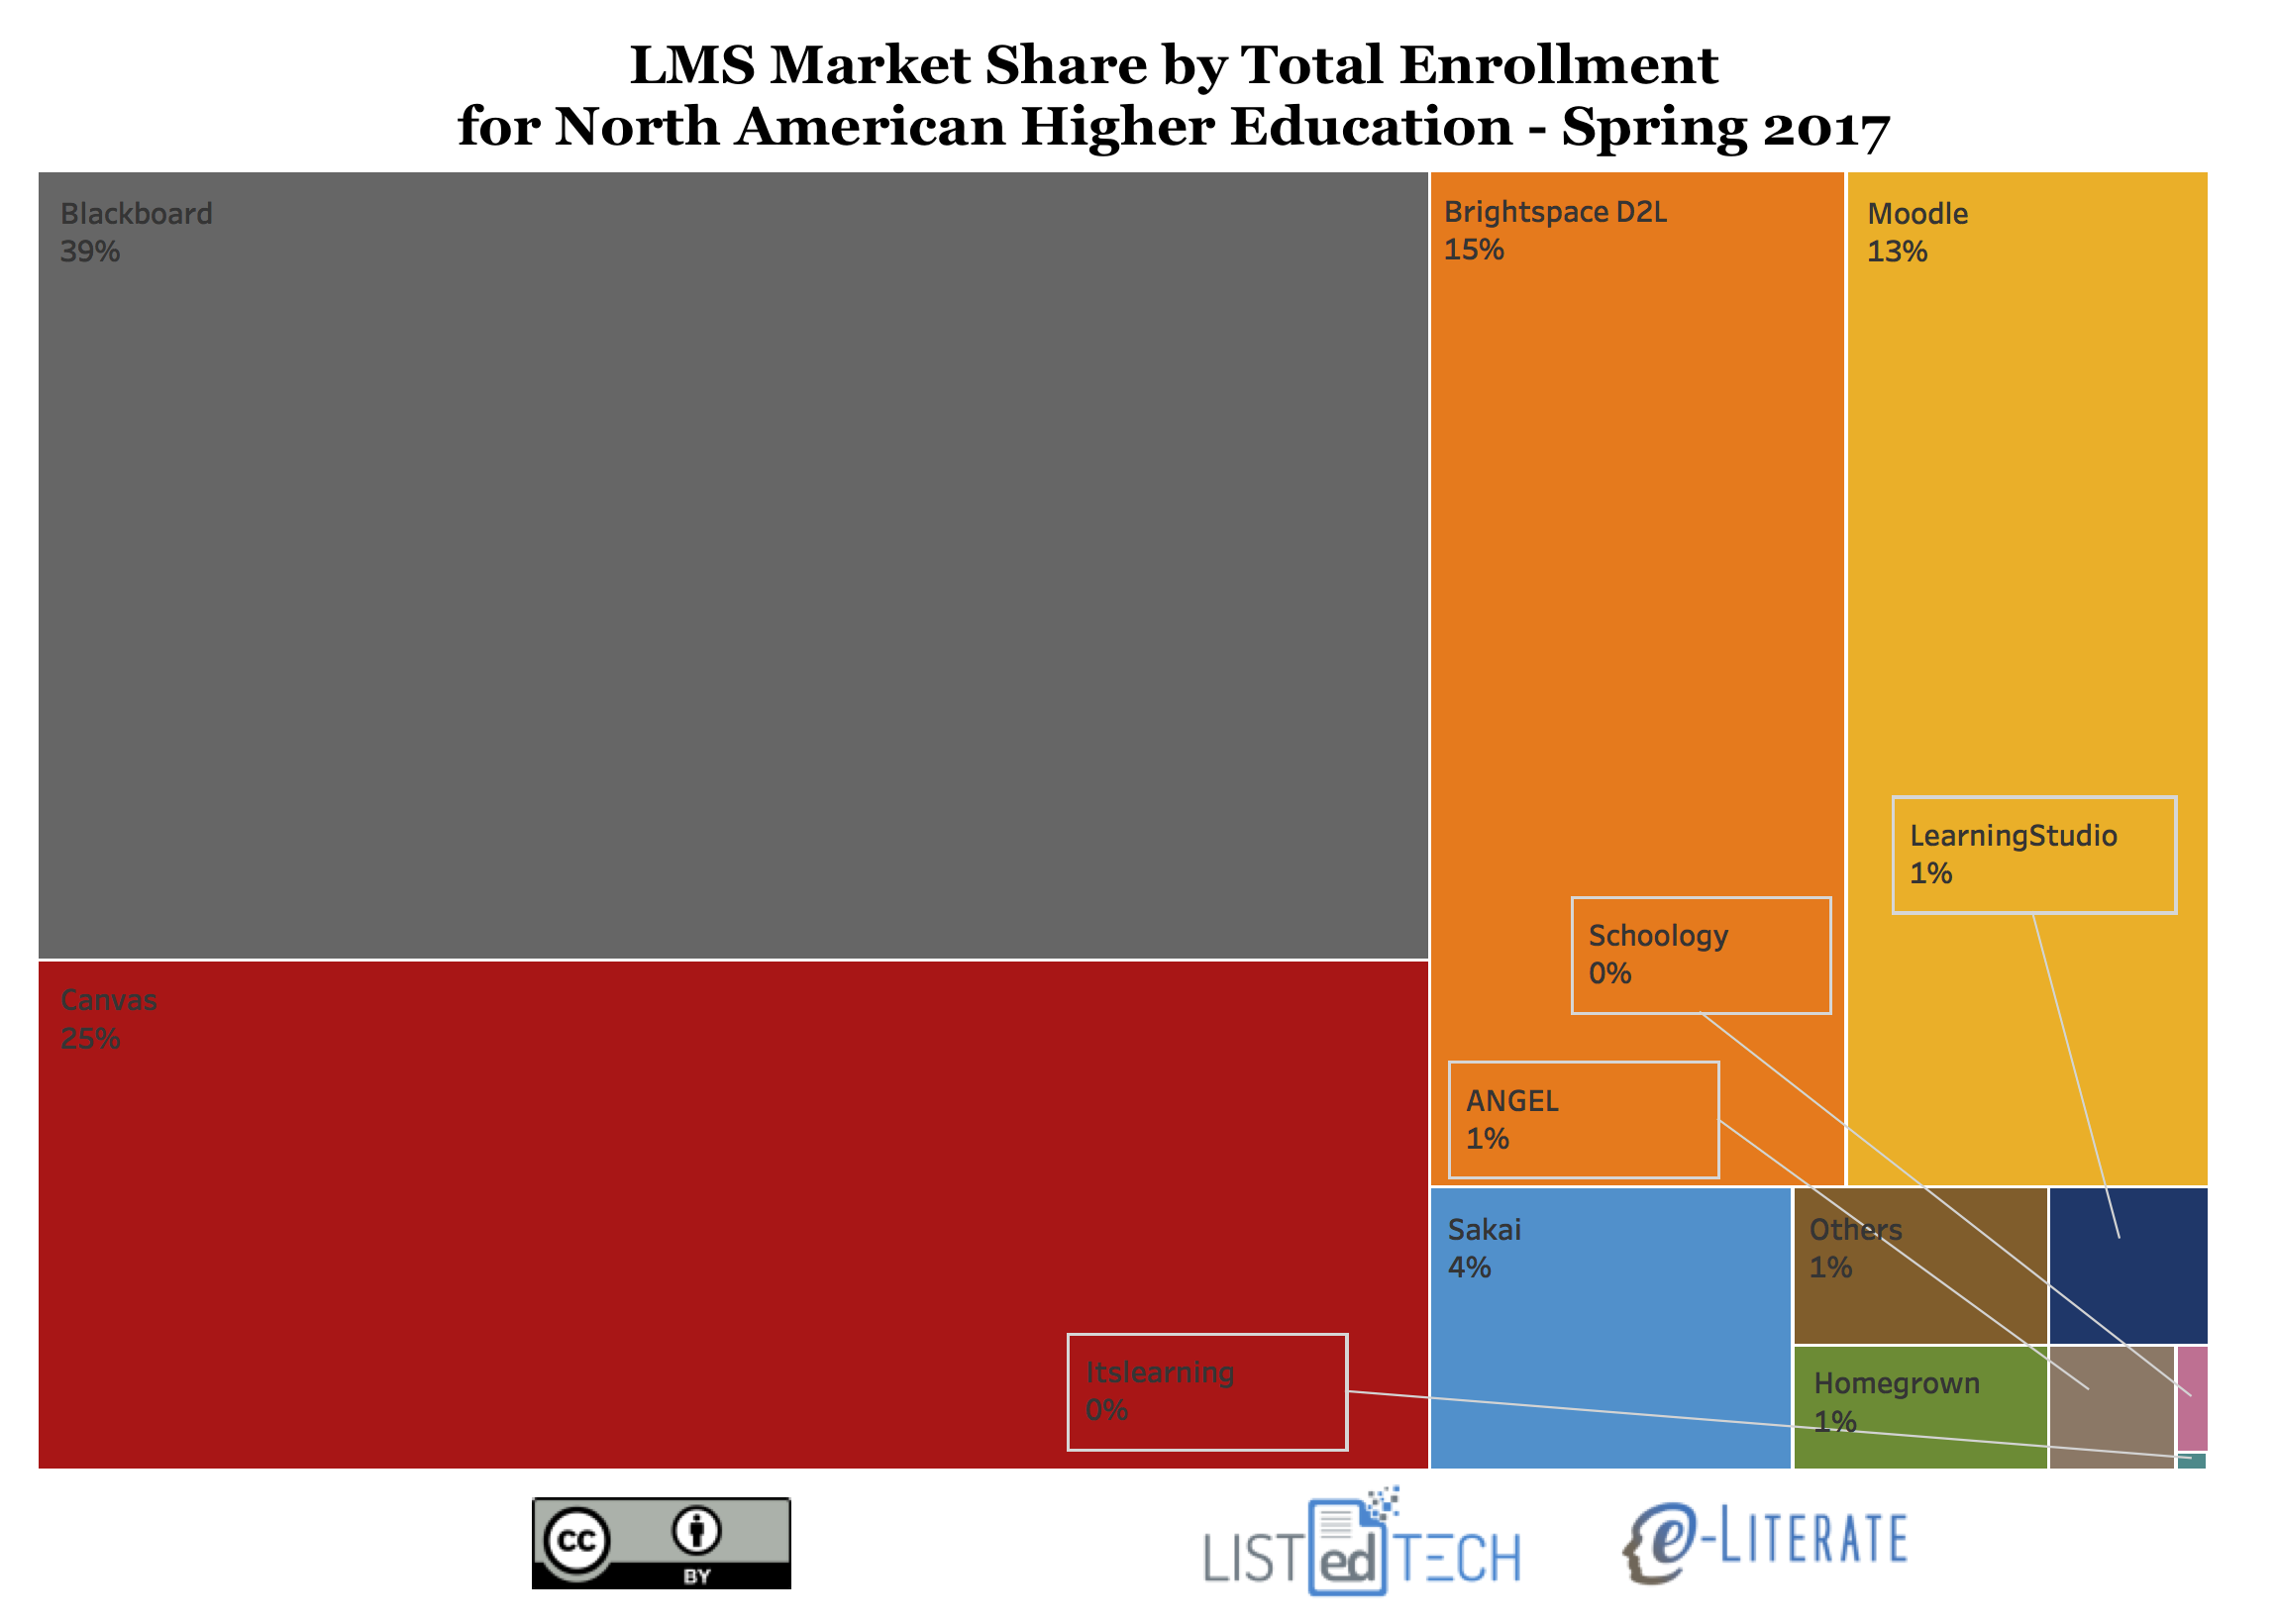
    • For North American Higher Education, Blackboard Learn at 39% is still in first place, Canvas is second at 25%, D2L Brightspace is third at 15%, Moodle is fourth at 13%, and Sakai is fifth at 4%.
    • It has been widely reported when just looking at percentages of institutions that Moodle has long been the second most-used system in North America, but in this view both Canvas and D2L Brightspace have a larger market share.

    It is useful to look at different views using institutional and enrollment metrics to get a deeper understanding of the academic LMS market dynamics.