e-Literate

Present is Prologue

Author: Phil Hill

  • LISTedTECH: New wiki site and great visualizations

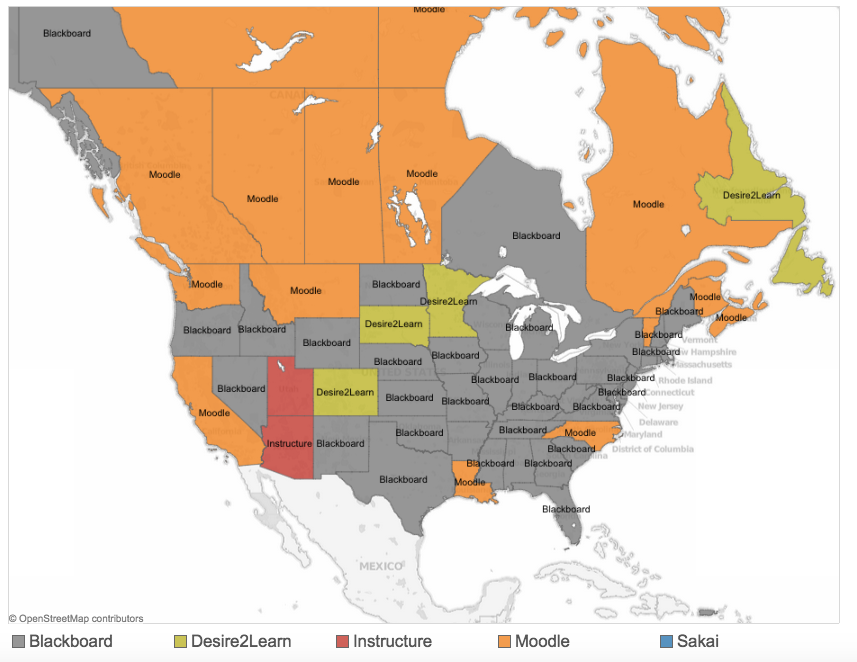
    Last year I wrote about a relatively new site offering very interesting data and visualizations in the ed tech world. LISTedTECH was created by Justin Menard, who is Business Intelligence Senior Analyst at University of Ottawa. First of all, the site is broader in scope than just the LMS – there is a rich source of data & visualizations on MOOCs, university rankings, and IPEDS data. Most of the visualizations are presented by Tableau and therefore interactive in nature, allowing the user to filter data, zoom in on geographic data, etc. Since e-Literate is not set up for full-page visualizations, I have included screen shots below, but clicking on the image will take you to the appropriate LISTedTECH page.

    Top_Learning_Management_System__LMS__by_State_or_Province_-_LISTedTECH

    (more…)

  • State of the US Higher Education LMS Market: 2014 Edition

    I shared the most recent graphic summarizing the LMS market in November 2013, and thanks to new data sources it’s time for an update. As with all previous versions, the 2005 – 2009 data points are based on the Campus Computing Project, and therefore is based on US adoption from non-profit institutions. This set of longitudinal data provides an anchor for the summary.

    The primary data source for 2013 – 2014 is Edutechnica, which not only does a more direct measurement of a larger number of schools (viewing all schools in IPEDS database with more than 800 FTE enrollments), but it also allows scaling based on enrollment per institution. This means that the latter years now more accurately represent how many students use a particular LMS.

    A few items to note:

    • Despite the addition of the new data source and its inclusion of enrollment measures, the basic shape and story of the graphic have not changed. My confidence has gone up in the past few years, but the heuristics were not far off.
    • The 2013 inclusion of Anglosphere (US, UK, Canada, Australia) numbers caused more confusion and questions than clarity, so this version goes back to being US only.
    • The Desire2Learn branding has been changed to Brightspace by D2L.
    • The eCollege branding has been changed to Pearson LearningStudio.
    • There is a growing area of “Alternative Learning Platforms” that includes University of Phoenix, Coursera, edX and OpenEdX, 2U, Helix and Motivis (the newly commercialized learning platform from College for America).
    • While the data is more solid than 2012 and prior years, keep in mind that you should treat the graphic as telling a story of the market rather than being a chart of exact data.

    LMS_MarketShare_20141107

    Some observations of the new data taken from the post on Edutechnica from September:

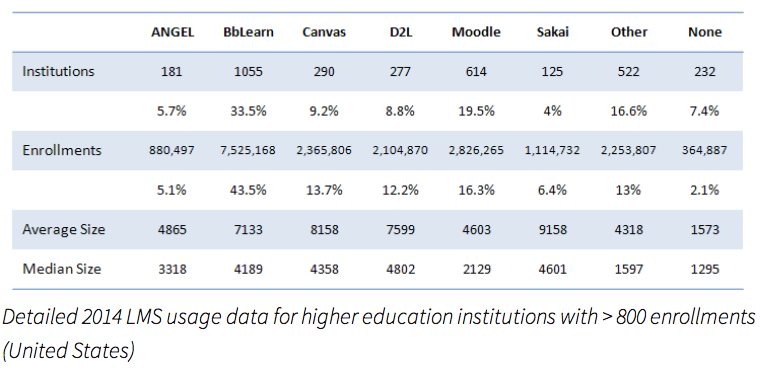
    • Blackboard’s BbLearn and ANGEL continue to lose market share in US -[1] Using the 2013 to 2014 tables (> 2000 enrollments), BbLearn has dropped from 848 to 817 institutions and ANGEL has dropped from 162 to 123. Using the revised methodology, Blackboard market share for > 800 enrollments now stands at 33.5% of institutions and 43.5% of total enrollments.
    • Moodle, D2L, and Sakai have no changes in US – Using the 2013 to 2014 tables (> 2000 enrollments), D2L has added only 2 schools, Moodle none, and Sakai 2 schools.
    • Canvas is the fasted growing LMS and has overtaken D2L – Using the 2013 to 2014 tables (> 2000 enrollments), Canvas grew ~40% in one year (from 166 to 232 institutions). For the first time, Canvas appears to have have larger US market share than D2L (13.7% to 12.2% of total enrollments using table above).
  • Competency-Based Education: Not just a drinking game

    Ray Henderson captured the changing trend of the past two EDUCAUSE conferences quite well.

    The drinking game: sure inebriation in 13 from vendor claims of “mooc” “cloud” or “disrupting edu”. In 2014: “competency based.”

    Two years ago, the best-known competency-based education (CBE) initiatives were at Western Governors University (WGU), Southern New Hampshire University’s College for America (CfA), and SUNY’s Excelsior College. In an article this past summer describing the US Department of Education’s focus on CBE, Paul Fain noted [emphasis added]:

    The U.S. Department of Education will give its blessing — and grant federal aid eligibility — to colleges’ experimentation with competency-based education and prior learning assessment.

    On Tuesday the department announced a new round of its “experimental sites” initiative, which waives certain rules for federal aid programs so institutions can test new approaches without losing their aid eligibility. Many colleges may ramp up their experiments with competency-based programs — and sources said more than 350 institutions currently offer or are seeking to create such degree tracks.

    One issue I’ve noticed, however, is that many schools are looking to duplicate the solution of CBE without understanding the the problems and context that allowed WGU, CfA and Excelsior to thrive. By looking at the three main CBE initiatives, it is important to note at least three lessons that are significant factors in their success to date, and these lessons are readily available but perhaps not well-understood.

    Lesson 1: CBE as means to address specific student population

    (more…)

  • Kuali Student Sunsetting $40 million project, moving to KualiCo

    The changes with Kuali are accelerating, and there are some big updates on the strategy.

    Earlier this week the Kuali Foundation distributed an Information Update obtained by e-Literate on many of the details of the transition to Kuali 2.0 and the addition of the for-profit KualiCo. Some of the key clarifications:

    • KualiCo will be an independent C Corporation with a board of directors. KualiCo will not be a subsidiary of Kuali Foundation. Capital structure, equity allocations, and business plans are confidential and will not be shared publicly for the same reasons these things are rarely shared by private companies. The board of directors will start out with three members and will move to five or seven over time. Directors will include the CEO and an equal number of educational administrators and outside directors. One of the educational administrators will be appointed by the Kuali Foundation. Outside directors will be compensated with equity. Educational administrators will not be compensated in any way and could only serve as a director with the explicit permission of their university administration with attention to all relevant institutional policies.
    • KualiCo’s only initial equity investor is the Kuali Foundation. The Kuali Foundation will invest up to $2M from the Foundation’s cash reserves. [snip] For its equity investment, the Kuali Foundation will have the right to designate a director on the KualiCo Board of Directors. The Kuali Foundation, through its director, will have an exceptional veto right to block the sale of the company, an IPO of the company or a change to the open source license. This helps ensure that KualiCo will stay focused on marketplace-winning products and services rather than on flipping the company on Wall Street.
    • The Kuali Foundation is not licensing the Kuali software code for Kuali products to KualiCo as Kuali software is already fully open source and could be used by anyone for any purpose — as is already being done today. No license transfer or grant is needed by KualiCo or anyone else.
    • The copyright for the AGPL3 software will be copyright KualiCo for the open source distribution that is available to everyone. It would very quickly become untenable to even try to manage multiple copyright lines as various sections of code evolve through the natural enhancement processes of an open source community.

    (more…)

  • Kuali Foundation: Clarification on future proprietary code

    Well that was an interesting session at Educause as described at Inside Higher Ed:

    It took the Kuali leadership 20 minutes to address the elephant in the conference center meeting room.

    “Change is ugly, and change is difficult, and the only difference here is you’re going to see all the ugliness as we go through the change because we’re completely transparent,” said John F. (Barry) Walsh, a strategic adviser for the Kuali Foundation. “We’re not going to hide any difficulty that we run into. That’s the way we operate. It’s definitely a rich environment for people who want to chuck hand grenades. Hey, have a shot — we’re wide open.” [snip]

    Walsh, who has been dubbed the “father of Kuali,” issued that proclamation after a back-and-forth with higher education consultant Phil Hill, who during an early morning session asked the Kuali leadership to clarify which parts of the company’s software would remain open source.

    While the article describes the communication and pushback issues with Kuali’s creation of a for-profit entity quite well (go read the whole article), I think it’s worth digging into what Carl generously describes as a “back-and-forth”. What happened was that there was a slide describing the relicensing of Kuali code as AGPL, and the last bullet caught my attention: (more…)

  • Investigation of IPEDS Distance Education Data Highlights System Not Ready for Modern Trends

    This article is cross-posted to the WCET blog.

    After billions of dollars spent on administrative computer systems and billions of dollars invested in ed tech companies, the U.S. higher education system is woefully out of date and unable to cope with major education trends such as online & hybrid education, flexible terms, and the expansion of continuing and extended education. Based on an investigation of the recently released distance education data for IPEDS, the primary national education database maintained by the National Center for Education Statistics (NCES), we have found significant confusion over basic definitions of terms, manual gathering of data outside of the computer systems designed to collect data, and, due to confusion over which students to include in IPEDS data, the systematic non-reporting of large numbers of degree-seeking students.

    In Fall 2012, the IPEDS (Integrated Postsecondary Education Data System) data collection for the first time included distance education – primarily for online courses and programs. This data is important for policy makers and institutional enrollment management as well as for the companies serving the higher education market.

    We first noticed the discrepancies based on feedback from analysis that we have both included at the e-Literate and WCET blogs. One of the most troubling calls came from a state university representative that said that the school has never reported any students who took their credit bearing courses through their self-supported, continuing education program.  Since they did not include the enrollments in reporting to the state, they did not report those enrollments to IPEDS. These were credits toward degrees and certificate programs offered by the university and therefore should have been included in IPEDS reporting based on the following instructions. (more…)

  • New LMS Market Data: Edutechnica provides one-year update

    In Fall 2013 we saw a rich source of LMS market data emerge.

    George Kroner, a former engineer at Blackboard who now works for University of Maryland University College (UMUC), has developed what may be the most thorough measurement of LMS adoption in higher education at Edutechnica (OK, he’s better at coding and analysis than site naming). This side project (not affiliated with UMUC) started two months ago based on George’s ambition to unite various learning communities with better data. He said that he was inspired by the Campus Computing Project (CCP) and that Edutechnica should be seen as complementary to the CCP.

    The project is based on a web crawler that checks against national databases as a starting point to identify the higher education institution, then goes out to the official school web site to find the official LMS (or multiple LMSs officially used). The initial data is all based on the Anglosphere (US, UK, Canada, Australia), but there is no reason this data could not expand.

    There is new data available in Edutechnica’s one-year update, with year-over-year comparisons available as well as improvements to the methodology. Note that the methodology has improved both in terms of setting the denominator and in terms of how many schools are included in the data collection.

    The Fall 2014 data which now includes all schools with more than 800 enrollments:

    (more…)