
e-Literate

Present is Prologue

Author: Phil Hill

  • Cal State Online: Public records shed light on what happened

    Last month I shared the system announcement that the Cal State Online (CSO) initiative is finished. Despite the phrasing of “re-visioning” and the retention of the name, the concept of a standalone unit to deliver and market online programs for the system is gone. Based on documents obtained by e-Literate through a public records request: ((CSU officials did not respond to requests to be interviewed for this story. The offer is still open if someone would like to comment.))

    • The original concept of “a standardized, centralized, comprehensive business, marketing and outreach support structure for all aspects of online program delivery for the Cal State University System” was defined in summer 2011, formally launched in Spring 2013, and ultimately abandoned in Fall 2013;
    • CSO was only able to enroll 130 full-time equivalent students (FTES) in CY2013 despite starting from pre-existing campus-based online programs and despite minimum thresholds of 16,700 FTES in the Pearson contract;
    • CSO was able to sign up only five undergraduate degree-completion programs and two master’s programs offered at four of the 23 Cal State campuses;
    • Faculty groups overtly supported investments in online education but did not feel included in the key decision processes;
    • Pearson’s contract as a full-service Online Service Provider was in place for less than one year before contract renegotiations began, ultimately leading to LMS services only; and
    • The ultimate trigger to abandon the original model was the $10 million state funding for online education to address bottleneck courses.

    That last one might seem counter-intuitive without the understanding that CSO did not even attempt to support matriculated Cal State students in state-funded programs.

    Terminology note: CSO measured course enrollments as “one student registered in one online course”, such that one student taking two courses would equal two course enrollments, etc. Internally CSO calculated 10 course enrollments = 1 FTES.

    Below is a narrative of the key milestones and decisions as described by the public documents. I’ll share more of my thoughts in a future post.
    2011

    (more…)

  • Kuali For-Profit: Change is an indicator of bigger issues

    On Friday the Kuali Foundation announced the creation of a new for-profit entity to be led by the former CTO of Instructure, Joel Dehlin. Jeff Young at the Chronicle described the change:

    Ten years ago, a group of universities started a collaborative software project touted as an alternative to commercial software companies, which were criticized as too costly. On Friday the project’s leaders made a surprising announcement: that it would essentially become a commercial entity. [snip]

    The Kuali Foundation will continue to exist as a non-profit, but it will be an investor in a new commercial entity to back the Kuali software development. Leaders insisted that they would maintain the values of the project despite creating the kind of organization that they once criticized. For one thing, the source software will remain free and open, but the company will sell services, like software hosting. On Friday the group issued an FAQ with details about the change.

    As Carl Straumsheim put it at Inside Higher Ed:

    The Kuali Foundation, after a decade of fighting commercial software vendors as a community source initiative, will launch a commercial company to better fight… commercial software vendors.

    Despite the positioning that this change is about innovating into the next decade, there is much more to this change than might be apparent on the surface. The creation of a for-profit entity to “lead the development and ongoing support” and to enable “an additional path for investment to accelerate existing and create new Kuali products“ fundamentally moves Kuali away from the community source model. Member institutions will no longer have voting rights for Kuali projects but will instead be able to “sit on customer councils and will give feedback about design and priority”. Given such a transformative change to the underlying model, there are some big questions to address.

    Financial Needs

    Kuali, being a non-profit foundation, has its financial records available online, and the tax reporting form 990s are easily obtained through sites such as GuideStar. Furthermore, instructional media + magic (im+m) has a public eLibrary where they have shared Kuali documentation over the years. ((Disclosure: Jim Farmer from im+m has been a guest blogger at e-Literate for many years.)) There does not appear to be a smoking gun found in the financials to directly explain the need for such a significant change, but there are hints of issues that provide some insight. (more…)

  • On ECAR data and ed tech purgatory

    Recently I wrote a post about many ed tech products being stuck in pilots without large-scale adoption.

    In our consulting work Michael and I often help survey institutions to discover what technologies are being used within courses, and typically the only technologies that are used by a majority of faculty members or in a majority of courses are the following:

    • AV presentation in the classroom;
    • PowerPoint usage in the classroom (obviously connected with the projectors);
    • Learning Management Systems (LMS);
    • Digital content at lower level than a full textbook (through open Internet, library, publishers, other faculty, or OER); and
    • File sharing applications. [snip]

    This stuck process ends up as an ed tech purgatory – with promises and potential of the heaven of full institutional adoption with meaningful results to follow, but also with the peril of either never getting out of purgatory or outright rejection over time.

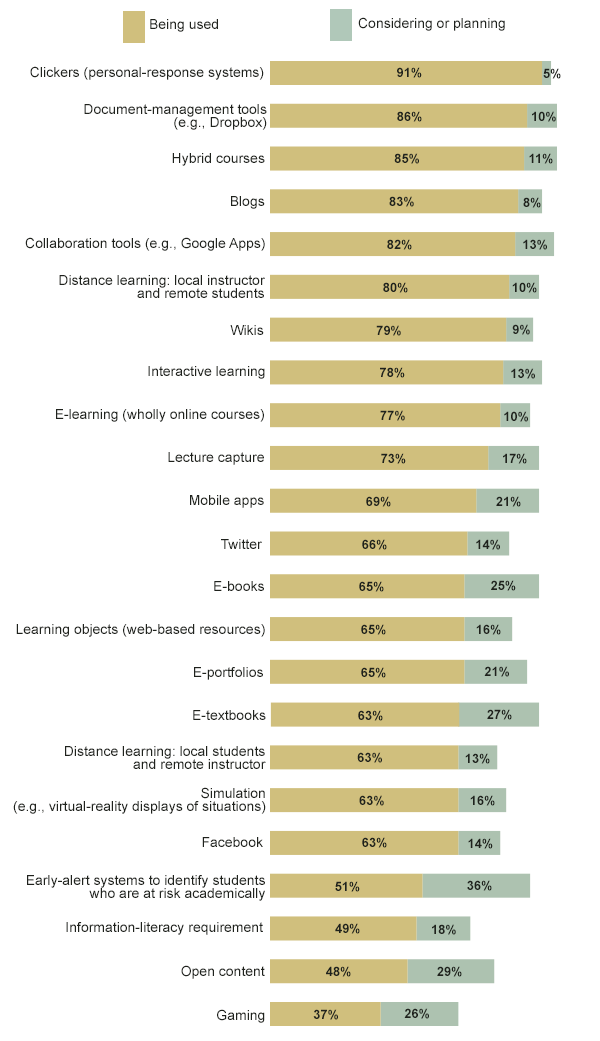
    With the Chronicle’s Almanac coming out this week, there is an interesting chart that on the surface might contradict the above information, showing ~20 technologies with above 50% adoption.

    Note: Data are drawn from responses by a subset of more than 500 of the nearly 800 institutions that participated in a survey conducted from June to October 2013. Reported statistics are either an estimated proportion of the population or an estimated median. Source: Educause Center for Analysis and Research
    Note: Data are drawn from responses by a subset of more than 500 of the nearly 800 institutions that participated in a survey conducted from June to October 2013. Reported statistics are either an estimated proportion of the population or an estimated median.
    Source: Educause Center for Analysis and Research [ECAR]
    The difference, however, is that ECAR (through The Chronicle) asked how many institutions have different ed tech products and our survey asked how many courses within an institution use different ed tech products.

    There are plenty of technologies being piloted but few hitting the mainstream, and adoption within an institution is one of the key indicators to watch.

  • D2L raises $85 million but growth claims defy logic

    Yesterday D2L announced a second round of investment, this time raising $85 million (a mix of debt and equity) to go with their $80 million round two years ago (see EDUKWEST for a useful roundup of news and article links). While raising $165 million is an impressive feat, does this funding give us new information on the LMS market?

    First, here are the claims by D2L as part of this round of financing, from EdSurge:

    The deal comes on the heels of what the company calls “a year of record growth in the higher education, K-12 and corporate markets.” John Baker, founder and CEO, says the company currently serves 1,100 institutions and 15 million learners–up from 850 and 10 million, respectively, at this time last year. The company also recently opened offices in Latin America, Asia Pacific and Europe.

    That’s a 29% growth in the number of institutions and a 50% growth in the number of learners in just one year. Quite impressive if accurate.

    Yet the company went through a significant round of layoffs in late 2013 that let go more than 7% of its workforce, and according to both LinkedIn data and company statements they have had no significant growth in number of employees over the past year.  (more…)

  • Pilots: Too many ed tech innovations stuck in purgatory

    Steve Kolowich wrote an article yesterday in the Chronicle that described the use of LectureTools, a student engagement and assessment application created by faculty member Perry Sampson at the University Michigan. These two paragraphs jumped out at me.

    The professor has had some success getting his colleagues to try using LectureTools in large introductory courses. In the spring, the software was being used in about 40 classrooms at Michigan, he says.

    Adoption elsewhere has been scattered. In 2012, Mr. Samson sold LectureTools to Echo360 ((Disclosure: Echo360 was a recent client of MindWires)), an education-technology company, which has started marketing it to professors at other universities. The program is being used in at least one classroom at 1,100 institutions, according to Mr. Samson, who has kept his title of chief executive of LectureTools. But only 80 are using the software in 10 or more courses.

    93% of LectureTools clients use the tool for less than 10 courses total, meaning that the vast majority of customers are running pilot projects almost two years after the company was acquired by a larger ed tech vendor.

    We are not running out of ideas in the ed tech market – there are plenty of new products being introduced each year. What we are not seeing, however, are ed tech innovations that go beyond a few pilots in each school. Inside Higher Ed captured this sentiment when quoting a Gallup representative after the GSV+ASU EdInnovations conference this year: (more…)

  • Federal Reserve Board backs up e-Literate in criticism of Brookings report on student debt

    I have been very critical of the Brookings Institution report on student debt, particularly in my post “To see how illogical the Brookings Institution report on student loans is, just read the executive summary”.

    D’oh! It turns out that real borrowers with real tax brackets paying off off real loans are having real problems. The percentage at least 90 days delinquent has more than doubled in just the past decade. In fact, based on another Federal Reserve report, the problem is much bigger for the future, “44% of borrowers are not yet in repayment, and excluding those, the effective 90+ delinquency rate rises to more than 30%”.

    More than 30% of borrowers who should be paying off their loans are at least 90 days delinquent? It seems someone didn’t tell them that their payment-to-income ratios (at least for their mythical average friends) are just fine and that they’re “no worse off”.

    Well now the Federal Reserve Board themselves weighs in on the subject with a new survey, at least as described by an article in The Huffington Post.  I have read the Fed report and concur with HP analysis – it does argue against the Brookings findings.

    Among the emerging risks spotlighted by the survey is the nation’s $1.3 trillion in unpaid student debt, suggesting that high levels of student debt are crimping the broader economy. Nearly half of Americans said they had to curb their spending last year in order to make payments on student loans, adding weight to the fear among federal financial regulators that the burden of student debt on households will depress economic growth for years to come.

    Some 35 percent of survey respondents who are paying back student loans said they had to reduce their spending by “a little” over the past year to keep up with their student debt payments. Another 11 percent said they had to cut back their spending by “a lot.”

    The Fed’s findings appear to challenge recent research by a pair of economists at the Brookings Institution, highlighted in The New York Times and cited by the White House, that argues that households with student debt are no worse off today than they were two decades ago.

    (more…)

  • Update on 2U: First full quarterly earnings and insight into model

    2U, the online service provider that went public in the spring, just released its financial report for the first full quarter of operations as a public company. The company beat estimates on total revenue and also lost less money than expected. Overall, it was a strong performance (see WSJ for basic summary or actual quarterly report for more details). The basics:

    • Revenue of $24.7 million for the quarter and $51.1 m for the past six months, which represents year-over-year increase of 32 and 35%;
    • EBITDA Losses of $7.1 m for the quarter and $10.9 m for the past six months, which represents year-over-year increase of -2% and 12%; and
    • Enrollment growth of 31 – 34% year-over-year.

    Per the WSJ coverage of the conference call:

    “I’m very pleased with our second quarter results, and that we have both the basis and the visibility to increase all of our guidance measures for 2014,” said Chip Paucek, 2U’s Chief Executive Officer and co-founder. “We’ve reached a turning point where, even with continued high investment for growth, our losses have stopped accelerating. At the midpoint of our new guidance range, we now expect our full year 2014 adjusted EBITDA loss to improve by 17% over 2013. Further, we’ve announced a schedule that meets our stated annual goal for new program launches through 2015.”

    The company went public in late March at $14 / share and is still at that range ($14.21 before the quarterly earnings release – it might go up tomorrow). As one of only three ed tech companies to have gone public in the US over the past five years, 2U remains worth watching both for its own news and as a bellwether of the IPO market for ed tech.

    Notes

    The financials provide more insight into the world of Online Service Providers (OSP, aka Online Program Management, School-as-a-Service, Online Enablers, the market with no name). On the conference call 2U’s CEO Chip Paucek reminded analysts that they typically invest (money spent – revenue) $4 – $9 million per program in the early years and do not start to break even until years 3 – 4. 2U might be on the high side of these numbers given their focus on small class sizes at big-name schools, but this helps explain why the OSP market typically focuses on long-term contracts of 10+ years. Without such a long-term revenue-sharing contract, it would difficult for an OSP to ever break even.

    (more…)