e-Literate

Present is Prologue

Author: Phil Hill

  • D2L Bets on The Cloud and Advances in User Experience

    D2L Bets on The Cloud and Advances in User Experience

    One of the arguments that we have made as part of our LMS Market Analysis service is that if you look beyond market share numbers, there has been a tectonic shift in the academic LMS market that started around 2012, moving from being Blackboard-centric to Canvas-centric. Meaning that the current market trends are largely driven by Canvas adoptions and market reactions to Canvas adoptions. This change has elevated the need for viable LMS solutions to have both a cloud-based deployment strategy as well as a more modern, intuitive user experience than what was acceptable just five years ago.

    Blackboard’s move to Learn SaaS (deployment) and Learn Ultra (new user experience) is a prime example of this market dynamic, and it has tended to get the lion’s share of analysis, including here at e-Literate. We have described that D2L has joined Canvas in “an emerging two-horse race for new implementations”, but we could do a better job of describing why we believe they are gaining in the market. ((Disclosure: D2L, Blackboard, and Instructure are subscribers in our LMS Market Analysis service and sponsoring participants in our Empirical Educator Project.))

    Short story – D2L has made fairly substantial bets on cloud deployment and a streamlined user experience, and the product design changes present the best explanation for the market gains.

    Head in the Cloud

    The data looking at new LMS implementations (changing from one system to another) in higher ed across the four global regions we cover in our market analysis shows a remarkable movement away from self hosting, or on-premises hosting, towards a combination of managed hosting by the LMS vendor or cloud hosting designed by the vendor but running on AWS, in particular. From 15% external hosting to 77% in just one decade. Within the external models, there is another major shift away from managed hosting and towards cloud hosting.
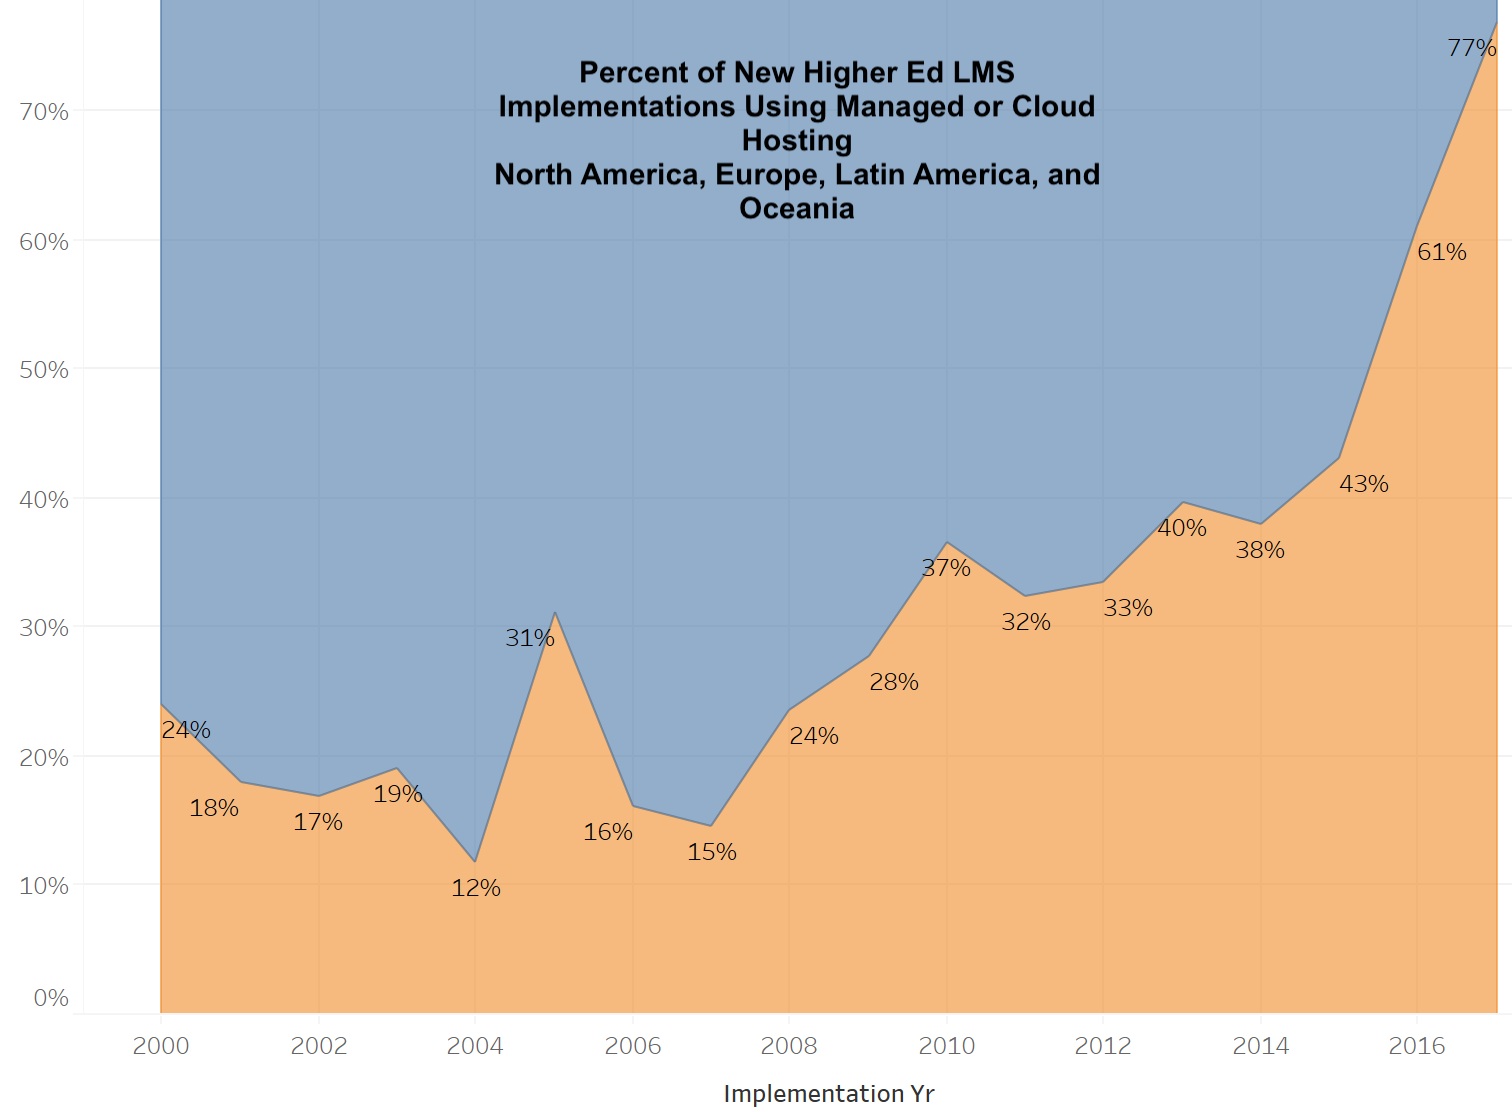
    Growth of LMS external hosting

    D2L has long worked on managed hosting options, but in late 2013 the company introduced Continuous Delivery where software releases are pushed to customers incrementally, such that customers would jointly run the latest versions of Brightspace, their LMS. This move is important, as one primary benefit of cloud deployment is to remove the explosion of software configurations and versions that make it expensive and difficult to diagnose and fix bugs and to release new features.

    Three years later in 2016 D2L announced their move to AWS for cloud deployment.

    AWS Data Centers for D2L

    While we heard grumblings from multiple clients during the transition – especially thru early 2017 – D2L clearly made some hard choices and and is aggressively moving to the cloud, not just as an option, but as their primary delivery model. According to David Koehn, VP of Product Management at D2L:

    • All new Brightspace implementations are on AWS cloud;
    • Virtually all current Brightspace implementations use Continuous Delivery; and
    • Approximately 50% of current customers are already on the AWS version of cloud deployment; and
    • By the end of 2018, a large majority of customers will be on cloud deployment.

    Contrast this move to the cloud with Blackboard’s where they plan to continue offering self hosting, managed hosting, and their own AWS-based cloud hosting options at the customer’s choice, while they believe SaaS and Ultra will lead on new sales. The primary constraint being that to go to Learn Ultra experience, you must first be on Learn SaaS, the cloud hosting option. But the key point is that Blackboard has tended to view the cloud as one deployment option among others, and the numbers show it. According to a company blog post this week from CEO Bill Ballhaus:

    As of today, more than 50 clients are running Ultra, with dozens more planning to start using the Ultra experience and courses in the second half of the year. Also, 361 clients around the globe have moved to SaaS deployment for Learn.

    Our data show more than 2,000 higher ed customers on Learn, but if you add in K-12 and corporate customers, this roughly equates to just over 10% on or moving to Learn SaaS and 2% on Learn Ultra. These are generous numbers, but more on that in a separate post.

    The point is that D2L is making a much more aggressive and focused bet on the cloud than is Blackboard, for better or worse. Canvas, of course, is designed natively for the cloud, and essentially 100% of their customers are on the AWS cloud.

    Run to Daylight

    David Koehn also pointed out that the real driver for the AWS cloud move by D2L is to enable a redesign of the user experience and to provide improved scalability and reliability. In other words, the cloud deployment is a means to the Daylight end.

    Daylight is the name for D2L’s redesign of the user experience and its streamlined user interface. When it was first announced just over a year ago, I was somewhat skeptical as the initial changes were evident in different fonts and cleaner look-and-feel, but not significant improvements in the workflow for faculty and students.

    As time goes on and I see more advanced demos, my view is changing. The Daylight Experience does have some real improvements not just in look-and-feel but in fewer and more intuitive clicks to get the same job done. A major focus on the release this summer (in time for D2L Fusion users conference) is more fully encouraging usage of the activity stream for higher ed clients (this feature was initially targeted at K-12 market but has been adapted for colleges and universities).
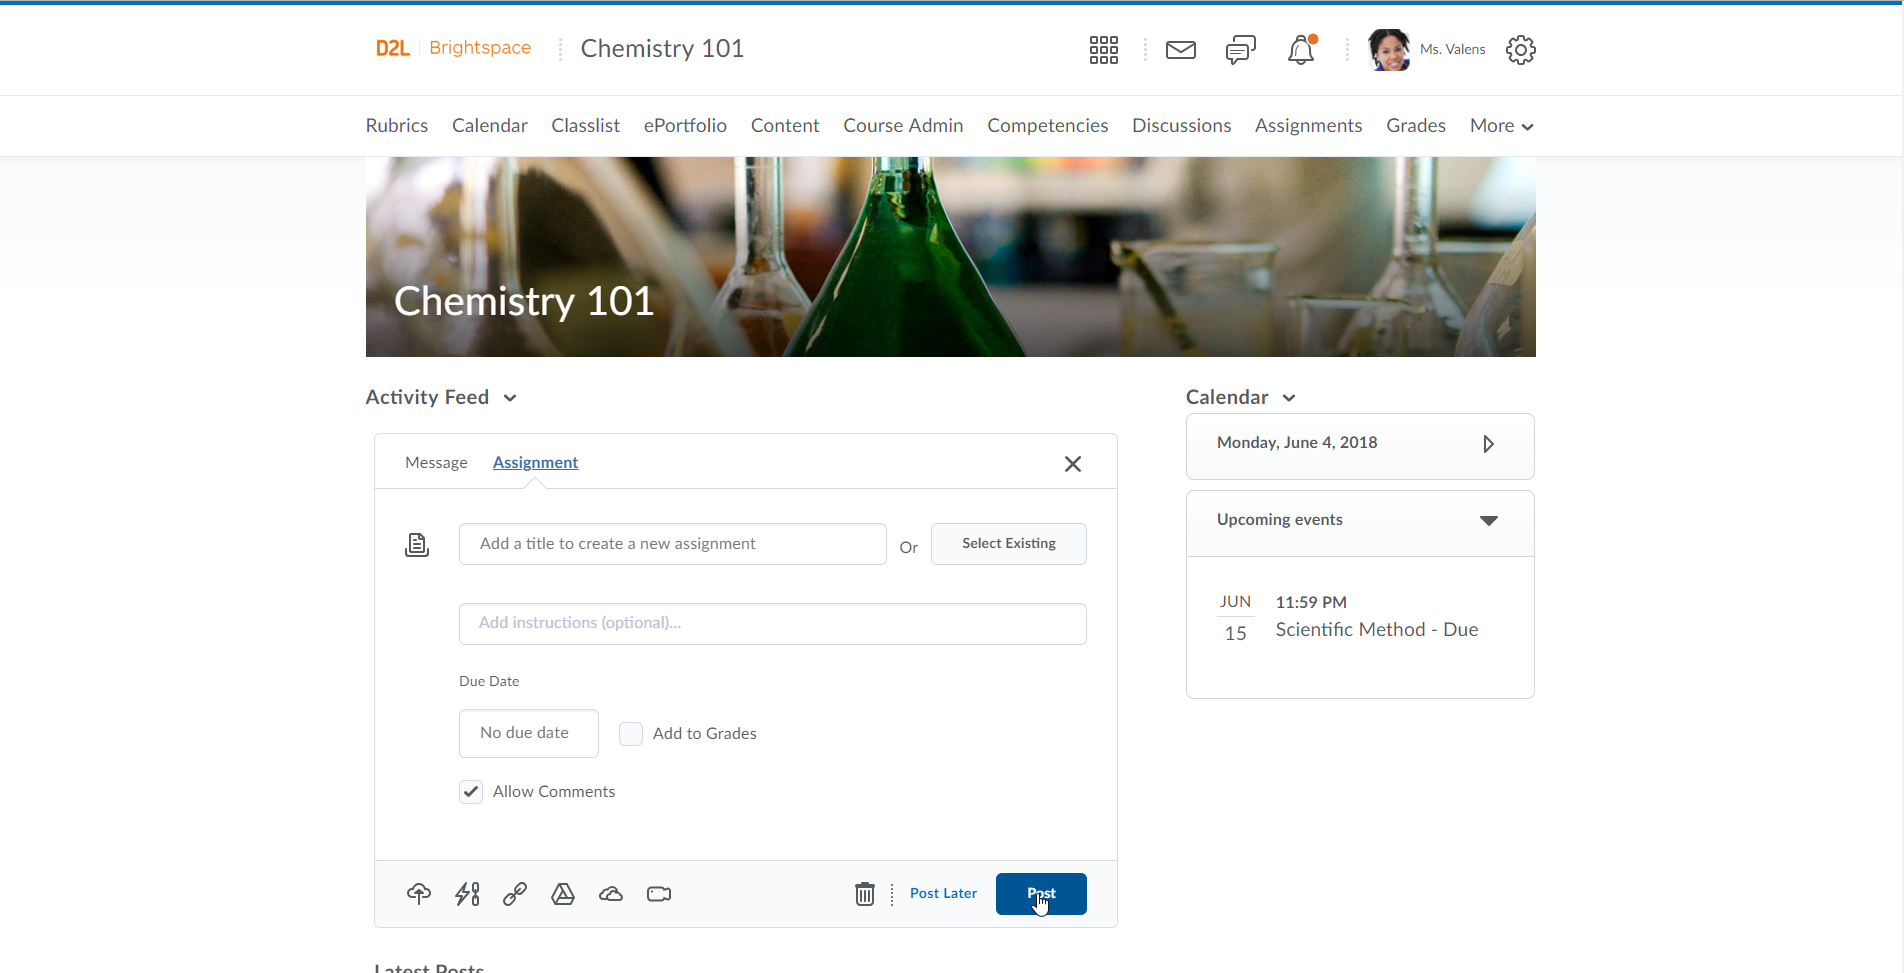
    Brightspace add assignment

    D2L has long played the Mutually Assured Destruction game of features, targeted at cumbersome procurement processes. D2L (along with Blackboard and Moodle) has a deep set of features which contrasts with Canvas and its streamlined set of features that rely on third-party integrations to solve some of the more specialized use cases. For D2L, it is important to maintain these features as a competitive differentiator with Canvas, and the design approach guiding them is Progressive Disclosure. This design technique relies on progressing from simple to complex, showing the user the information and options they need when they need it or request it and not before.

    Consider adding a multiple choice quiz, where the desire is to make this process very simple, but to then have a page or area that exposes more and more options as requested by user or in context of the quiz setup.
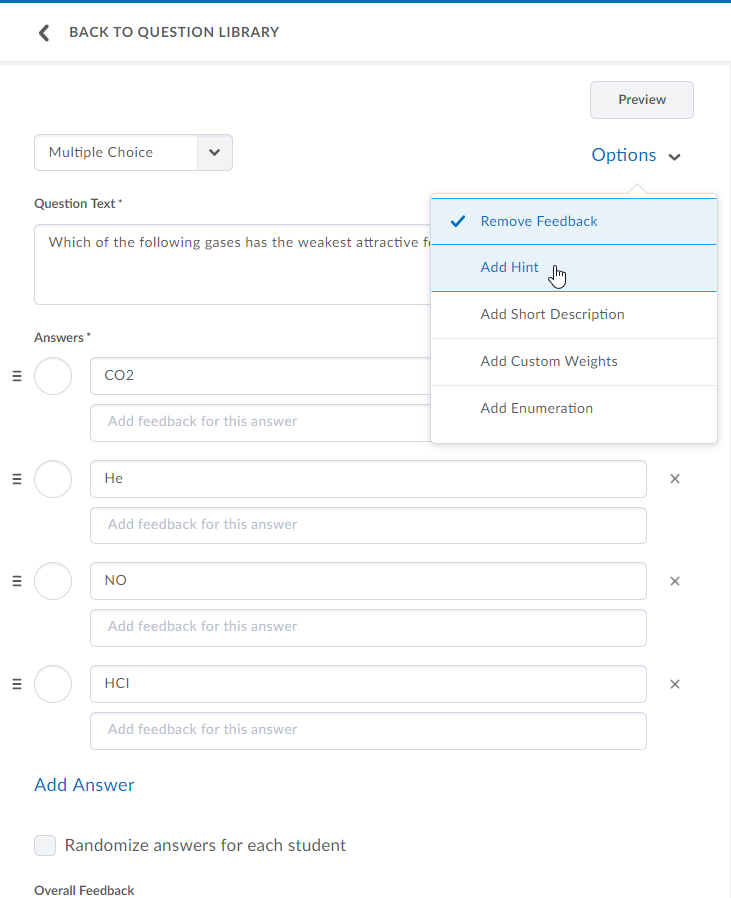
    Brightspace details on quiz

    As D2L further implements this design approach within the Daylight Experience, we are seeing a more modern and intuitive user experience for Brightspace customers, yet one that is showing real promise to also tap into deeper feature sets. And these changes are being used in production.

    Again by way of contrast, Blackboard’s user experience redesign for Learn Ultra has had a bumpy ride, with multi-year delays of getting any customers to use in production. They took more of a big bang approach to releasing Learn Ultra, and when customers pushed back saying that Ultra wasn’t ready, this led to additional delays and eventually a change in the design team. D2L’s Daylight has proven to be a more iterative release of their new user experience.

    What to Watch

    This year it is becoming difficult to separate LMS products from company finances. Instructure is trying to balance Canvas and Bridge growth to satisfy public markets along with a new executive team. Blackboard is dealing with corporate debt challenges while needing to fully release Learn Ultra. As mentioned in this post, D2L is moving strongly to the cloud with a new user experience while managing expenses. Schoology is trying to grow higher ed market under the radar. Moodle HQ took investment for the first time. There are a lot of open questions on the future of the academic LMS market, and we expect much to be revealed at the big summer (and fall) events.

    As for D2L Fusion, we plan to get a better read on how customers and prospects are reacting to the cloud deployment move and streamlined user experience. We are seeing real changes in the Brightspace design and deployment model, but do paying and prospective customers value these changes? Furthermore, will D2L be able to improve its customer service and delivery on promises made for new customers as well as it has improved its product design?

    As for Blackboard, Learn Ultra now has D2L’s Brightspace as a major user experience to compete with as well as Canvas. There is a lot more changing in the LMS market than what is obvious on the surface.

    Update: Clarified D2L numbers to be specifically for AWS cloud deployment. Also changed several instances of “cloud hosting” to be “cloud deployment” to make terminology more accurate.

  • Interview with CEO of Instructure on changes to executive team

    Interview with CEO of Instructure on changes to executive team

    Instructure is now a decade old as a company and faces a crucial test this year with recent changes to their executive management team and the need to scale both Canvas (academic LMS) and Bridge (corporate learning LMS). The long-time head of sales, Marc Maloy, and head of marketing, Misty Frost, left Instructure in the fall. The company eventually hired a new head of marketing, Bjorn Eriksson from the world of corporate HR, in January. After a months-long search, Instructure did not directly replace Marc with a new head of sales, but instead they hired a new president, Dan Goldsmith, who also has sales leaders reporting directly to him. With this move, Mitch Macfarlane, the long-time chief operating officer and former head of client services, will be leaving the company this summer. ((Disclosure: Instructure and D2L are subscribers to our LMS market analysis service and were sponsors at our recent Empirical Educator Project summit.))

    We’ve written about previous executive changes for Instructure – when their two founders left the company and when their CTO departed after just one year – but in each case the company managed the transitions and came out stronger in the end. As we have shared in our LMS Market Analysis service and on e-Literate, the Canvas track record is remarkable in terms of not losing customers and gaining new customers from most other LMS providers.

    But the executive changes over the past year come at a time when Instructure faces new challenges in product development and implementation support. At InstructureCon 2016, the company announced their next-generation quizzing platform, Quizzes.Next, stating that it would be “made available to you over the course of the next several months”. Last summer at InstructureCon 2017, Quizzes.Next entered a limited beta program, but the new set of tools is still not fully in production. To our knowledge, this might be the biggest product schedule miss in the company’s history, and it will be quite interesting to see what happens with this summer’s InstructureCon.

    In addition, we have had several people contact us privately, even before the most recent management change, telling us about a new level of frustration in implementation projects and product upgrades. None of the tales were extreme, but they were unusual for Canvas clients and in general spoke to distractions from staff and lack of clear answers and updates.

    The press release announcing the hiring of Dan Goldsmith included this description:

    With more than 20 years of experience in software and services, Goldsmith’s career is marked by directing high-performing global teams and achieving outstanding penetration and growth in challenging markets. Goldsmith spent the last eight years as a senior executive at Veeva Systems, a cloud-based software company, where he started and ran Veeva’s international business, led the company’s strategy in new markets and products, and most recently was responsible for Veeva’s global engagement and growth in strategic accounts.

    “It is an exciting time for Instructure. We are well positioned for success as we focus on the continued growth of Canvas, expansion of Bridge, and international execution,” said Josh Coates, CEO of Instructure. “Dan’s energy, creativity and proven track record in driving go-to-market strategies and rapidly scaling businesses make him a tremendous addition to Instructure at the perfect time to lead us through our next phase of growth.”

    Goldsmith was one of the first 50 employees at Veeva. He helped lead the company through a successful IPO and a growth path to a $10 billion market cap. Prior to Veeva, he worked in various executive positions at top companies, including Accenture, PwC and IBM. During his years in management consulting, Goldsmith led initiatives in global markets and developed new offerings. Goldsmith will have an immediate impact on Instructure’s strategy. His initial focus will be on market growth, with the sales leaders reporting directly to him.

    This was the setup for an interview that we had with Josh Coates, the CEO of Instructure, last week. Given our focus at e-Literate on education markets, we in particular wanted to ask about how the company is balancing the needs of Canvas and Bridge.

    Coates came prepared for the interview, and up front he made the point that the “vast majority of company resources” are allocated to the academic markets and that this is their foundational business. After we pointed out that the majority of discussions on quarterly earnings calls focus on Bridge, Coates noted that Wall Street is overly focused on corporate learning markets and unfortunately takes Canvas’ academic market performance for granted. He does not do so, but some of the investor community seems to.

    The primary selling points bringing Goldsmith to Instructure are that he helped Veeva grow into a $10 billion company, having joined as one of first ~40 employees, and that he specifically helped them grow international markets. According to Coates, Goldsmith spent his first three years opening up the Europe, Middle East, and Africa (EMEA) markets, and that yes, his international experience is a big reason for Instructure recruiting him.

    We have noted at e-Literate that Canvas really began international expansion just 3-4 years ago. According to our current data, Canvas leads in higher ed adoptions in Europe and Australia / New Zealand, but interestingly, D2L is beating Canvas in Latin America higher ed adoptions despite Instructure having a bigger investment in its regional office in São Paulo. At some point Canvas’ market share growth rate in North America will have to flatten out and international markets will naturally increase in importance for company finances. While market wins in Europe and Australia / New Zealand are impressive, Instructure will need more aggressive growth in other markets, and clearly Goldsmith is being tapped as a catalyst to increase sales overseas.

    We pointed out that Goldsmith had no education background and appears to be more closely aligned to corporate learning markets than higher ed or K-12 markets. Coates responded that Goldsmith has done quite well for himself at Veeva but is also passionate about education, as evidenced by his experience as the chair of the Montgomery School board of trustees. Coates acknowledged that this is not deep academic sector experience and that the company will need to give Goldsmith a big education on higher ed and K-12 markets. If we had a dollar for every time we heard of a rich dude who is passionate about education, well, we’d be rich dudes who are passionate about education. It is good to hear, however, the acknowledgement that the new executive brings rich software company scaling and international market growth experience but not domain knowledge of the academic markets for Canvas.

    We asked for an update on Quizzes.Next – when it will be generally available (GA) and whether the schedule challenges are related to the executive changes. Josh Coates assured me that no executives are working on the code, but Jared Stein, VP of higher ed product strategy, answered more directly.

    Quizzes.Next’s GA release is scheduled for Summer 2018. This is later than planned because we underestimated the complexity of building assessments entirely as a micro-service at the level of quality we set for ourselves and our users.

    The executive management team over the years has played a big role in establishing the company culture that is a large part of Instructure’s success. Now that the three M’s (Marc, Misty and Mitch) are out, the question is not whether the culture will change, but how. Coates’ acknowledges this reality and trusts that Instructure’s internal rudder is strong enough to keep the company on course.

    There are two company risks that stand out in trying to balance Canvas and Bridge. First is that complacency sets in not just with some in the investment community but with Instructure itself, and they begin to take their strong position in the academic market for granted. Second, and related, is that resources and talent end up flowing disproportionately to the corporate learning market given its increasing importance. These are risks to watch and not observations of actions, however, and Coates was emphatic that the academic market will always be the foundation of Instructure’s business. The corporate learning market is significantly larger than the academic market, however, and Coates estimated that in ten years or so, corporate will likely drive a larger portion of Instructure’s revenue.

    It should be noted that growth in corporate does not have to come at the expense of the academic market. It actually has the potential to strengthen product offerings in higher ed and K-12 as Instructure gains deeper insights into teaching and learning more broadly. There is also the potential for convergence, or at least cross-pollination, in these markets as the profile and needs of learners evolve.

    We’ll keep a close eye on academic LMS market trends in the coming months for signs of new developments. For the near term, at least, Instructure’s success is predicated on the continued success of Canvas in higher education and K-12 despite the quarterly investor calls skewing toward the corporate learning markets and new management hires with experience outside of the education sector.

  • Top Hat’s OER Announcement: Doubling down on faculty engagement

    Top Hat’s OER Announcement: Doubling down on faculty engagement

    Several months ago I wrote a post looking at the Top Hat’s push into digital curricular materials through their Textbook product and Marketplace for digital course content. Leading up to that post, I had been planning to cover the Open Educational Resources (OER) angle, as the Marketplace included a number of openly-licensed material, much of it from OpenStax, and Top Hat had already begun marketing itself as an OER provider. At the time, the OER strategy seemed a work in progress. In fact, I found that some of my questions for company staff about OER basics – the role of Creative Commons licenses, community dynamics exhibited at the OpenEd conference, etc – led to a lack of answers, and at the time there was no export capability to get OER out of the platform.

    To Fee or Not to Fee

    The situation has changed since January, and with last month’s announcement of Top Hat’s Open Content Initiative the company is taking a stand on whether it is appropriate to charge for platform access. The idea of hosting and modifying OER on a fee-based platform became a big topic last year. Lumen Learning pioneered the Red Hat type model in 2014, and last year there was a big movement with Cengage, Knewton, OpenStax, Macmillan, and Top Hat all offering OER within their platforms. In many cases, the OER content itself has been redesigned from traditional textbook-in-PDF format to learning objective-driven content with aligned assessments. ((Disclosure: Lumen is a client of MindWires, and I recently gave a paid keynote at a Top Hat user’s conference.))

    Top Hat has now removed the student platform fees and added an export-to-epub feature. As evidenced in a company blog post by CEO Mike Silagadze, they are not shy about it either.

    At Top Hat, we’ve been working on making education more effective and affordable since 2009. Now, we’re happy to make a move that delivers on both fronts. Beginning April 12, with the launch of our Open Content Initiative, we’re offering completely free access to thousands of textbooks and other Open Educational Resources (OER)—freely accessible and openly licensed learning materials—on the Top Hat Marketplace.

    It’s about time. Students have been forced to weigh the pros and cons of emptying their wallets and draining their financial aid to buy textbooks for far too long. [snip] Just as bad, digital publishing platforms and e-readers have been charging a toll to students—disguised as a platform fee—to access free, openly licensed OER.

    Enough is enough.

    I asked Silagadze about a point I noted when describing Cengage’s OpenNow product:

    For each course [VP of Content Strategy] Constantini estimates that the modifications take $50k – $100k of internal work, including verifying of licenses for embedded elements. I would note a certain irony here in that OpenStax produces more-or-less traditional digital textbooks requiring publishers or OER services companies like Lumen to break apart and realign to competencies or outcomes.

    Silagadze brushed off this description and stated that the modifications made by other providers were far smaller and easier to make than is being claimed. We now have a third variation in the OER market, with the provision of wrap-around platform and a clear argument that these platforms not only will be free on Top Hat, but that they should be free as a matter of principle.

    • Free content, not dependent on specific platform
    • Free and modified content, available on a paid platform, content available for export
    • Free and lightly modified content, available on a free platform, content available for export

    While this is a marketing position by one of the competitors in a new field, this move by Top Hat is a further sign of the OER movement breaking into different branches. From our perspective, the fractures in the OER community have been widening for the past several years, but to a degree this is a sign of success. Openly-licensed content usage is becoming more and more common in education, and even traditional publishers mostly accept the value of OER.

    Faculty Engagement

    Perhaps more significantly, at least in terms of understanding Top Hat as a company, is that the OER initiative doubles down on their bet on faculty engagement. A well-known issue with OER (and even with non-open content) is that few faculty end up taking advantage when given the ability to modify the course materials in any significant manner. In theory many people talk about open pedagogy in terms of faculty modification and collaboration on content, but in practice this rarely happens. Top Hat’s view is that the barrier has been flat content and cumbersome platforms, as best described in an eLearning Inside interview.

    “We think the promise of OER has fallen down,” said Nina Bilimoria Angelo, VP of product and customer marketing at Top Hat. The Toronto-based company has created a platform to house, customize, and share OER and other educational resources. It has been used by over 2.8 million students to date.

    “The promise was there’s a community that continues to build on open materials,” Angelo said. “But when those materials are trapped behind static PDFs, and then people are making changes to it on their own without a mechanism to share it back, that’s where things fall flat. We really wanted to create a system where things can be improved in real time, not over a 3 or 4 year cycle like with traditional publishers.”

    “Discoverability is a challenge with OER,” Angelo said. “Quality can be perceived as uneven which is probably why OER adoption has stalled at the 5-10% level for instructors. There’s a lot of skepticism amongst higher educators. We’re trying to make sure all the high quality material is available in the Marketplace. Once it’s adopted, it’s really customizable. But then those customizations – this is the magic – those customizations can be shared back with the author and the team so that they can improve upon what they’ve created.”

    This is the best way to interpret Top Hat’s OER move, in my opinion, and you can see more details in my January post about the Marketplace to better understand the customization and sharing capabilities of the platform.

    According to an internal Top Hat survey of users, 89% of adopters make changes to digital textbooks that they adopt, with 22% reporting “lots of customization”. If this internal data is representative, there may be some indicators that faculty can be more involved in modifying and sharing content. Top Hat is betting on faculty engaging with content, modifying it, sharing it, updating it. And they are betting that this model will drive faculty adoption decisions.

    There are a lot of unknowns about faculty adoption and modification of OER content through the Top Hat Open Content Initiative, but it is clear that the company is positioning itself differently than other providers. The transformation of digital curricular materials continues.

  • Postscript on Rio Salado Coverage: Clarity about different outcome types

    Postscript on Rio Salado Coverage: Clarity about different outcome types

    After my two posts two weeks ago calling into question whether Rio Salado College has demonstrated clear student outcomes that justify its usage as an exemplar institution, college officials have responded through the WCET blog and in an article from Paul Fain at Inside Higher Ed. I recommend reading the IHE article in particular to get an understanding of the challenging an nuanced question of what is “good enough” in terms of college completion, and for even more detail read Rio’s written response. Unfortunately, the lengthy explanations on graduation rates from Rio end up obscuring a critical distinction between awarding degrees versus certificates of completion. The reason this matters is that Rio appears to be doing a better than average job supporting student transfers to four-year degree programs, a worse than average job of helping students complete two-year degrees, and an unknown job of providing students with non-degree stand-alone certificates.

    Before dealing with this issue, I’d like to point out how useful this dialog has been and how open Rio has been in sharing internal metrics. One example that I wish other institutions used, and that can help us clarify how to understand completion data, is based on student goals.

    Rio Student Intentions

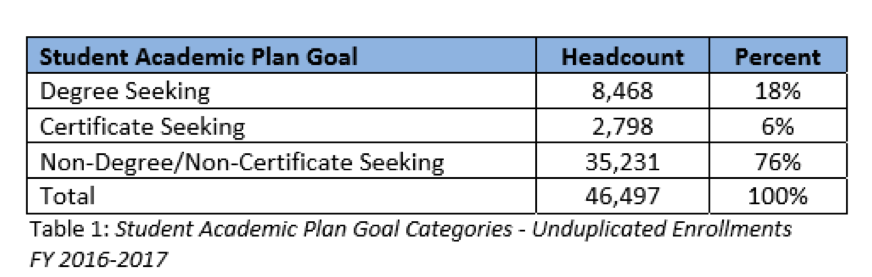
    Fully 76% of Rio students have no intention to get a degree or certificate, and of this group 33% (11,628) indicated earning transferable credit as the key reason to enroll. As Sally Johnstone said in the IHE article, “It’s a feeder school for Arizona State University”. This transfer of credit mission can be good or bad – it depends on how well these students perform in getting an ASU degree. In the written response, but not in WCET or IHE articles, Rio shares an interesting but incomplete metric.

    Additionally, as part of the work RSC does related to accountability, we track the success of our transfer students to the three public universities in Arizona (The 2010/11 – 2015/16 5 year trend shows a 77.10% increase in bachelor degrees awarded to students that had completed a minimum of 12 credit hours (up to 60 or more hours) at Rio Salado College).

    Increase to what and over what? It is not clear if this is comparing to Arizona university students who do not transfer any credits from Rio, or those who transfer less than 12, or those who transfer from other colleges. Nevertheless, this is an indicator of the college helping students obtain four-year degrees through credit transfers.

    Once you get beyond non-degree / non-certificate seeking students, the numbers are murkier, and this is the area that needs clarity. One out of four Rio students are there to get an award – how successful are they? Rio recommends we look at the Voluntary Framework for Accountability (VFA) measures, instead of IPEDS, with the following results.

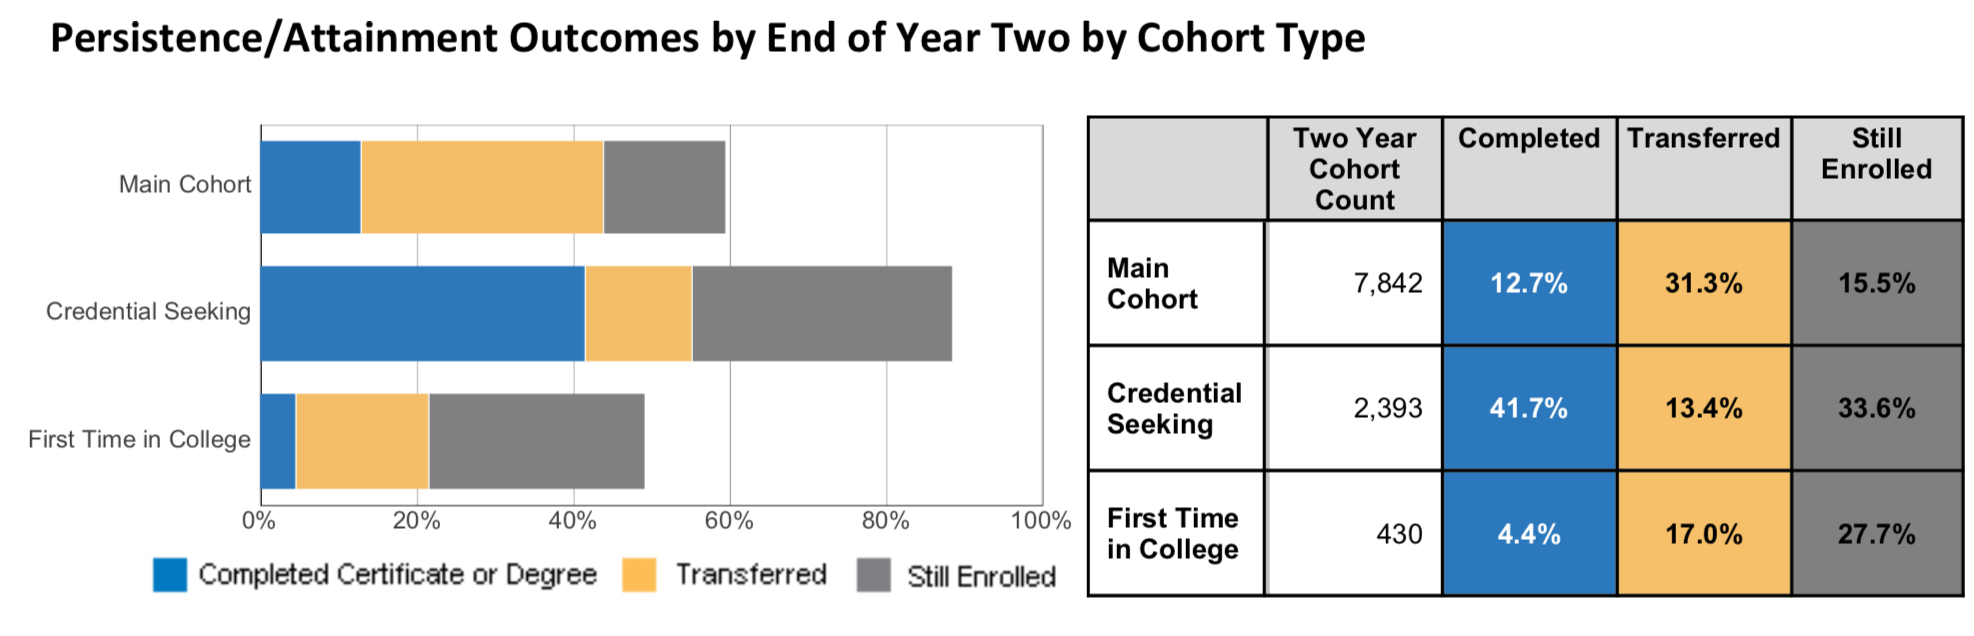
    • 2-year graduation rate is higher than peer institutions: Rio 13%; Peer Institutions 10%
    • 6-year graduation rate for credential-seeking cohort is 36.2%
    • The credential seeking cohort far outperformed sister institutions in completion: Rio 42%; Peer Institutions 16%

    I do not know why Rio uses the term graduation rate, as VFA instead describes Percent Students Completed a Formal Award, but from the numbers used we can see where the data comes from. The first and third bullets come from the VFA Two-Year Progress measures (blue column under Completed). ((The VFA definition of the cohorts: Main Cohort = fall entering, first time at reporting college; “all students”; Credential Seeking = earned 12 credits by end of year two.))

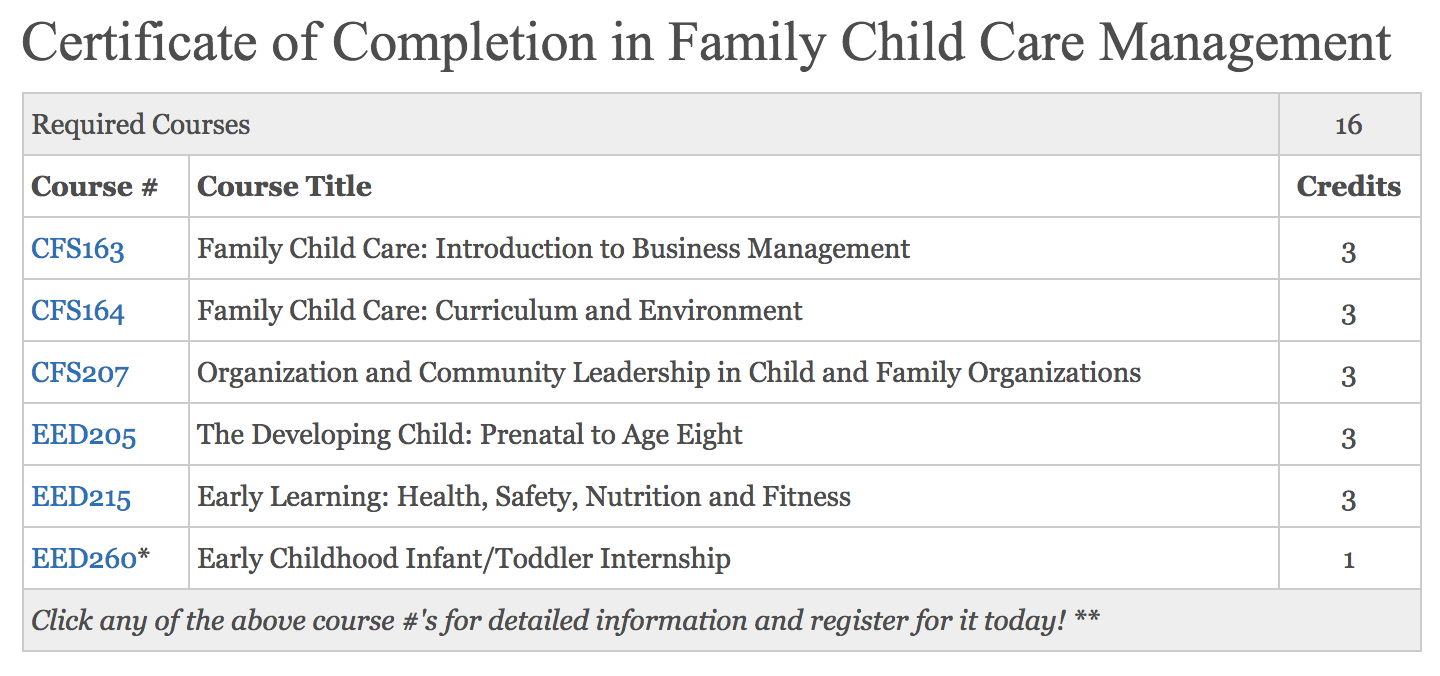
    What is key is that the Completed metric includes those who obtained an associate’s degree or official certificate. Unlike degrees, certificates of completion have no standards across schools, and their usage is very uneven. As an example of Rio’s usage:

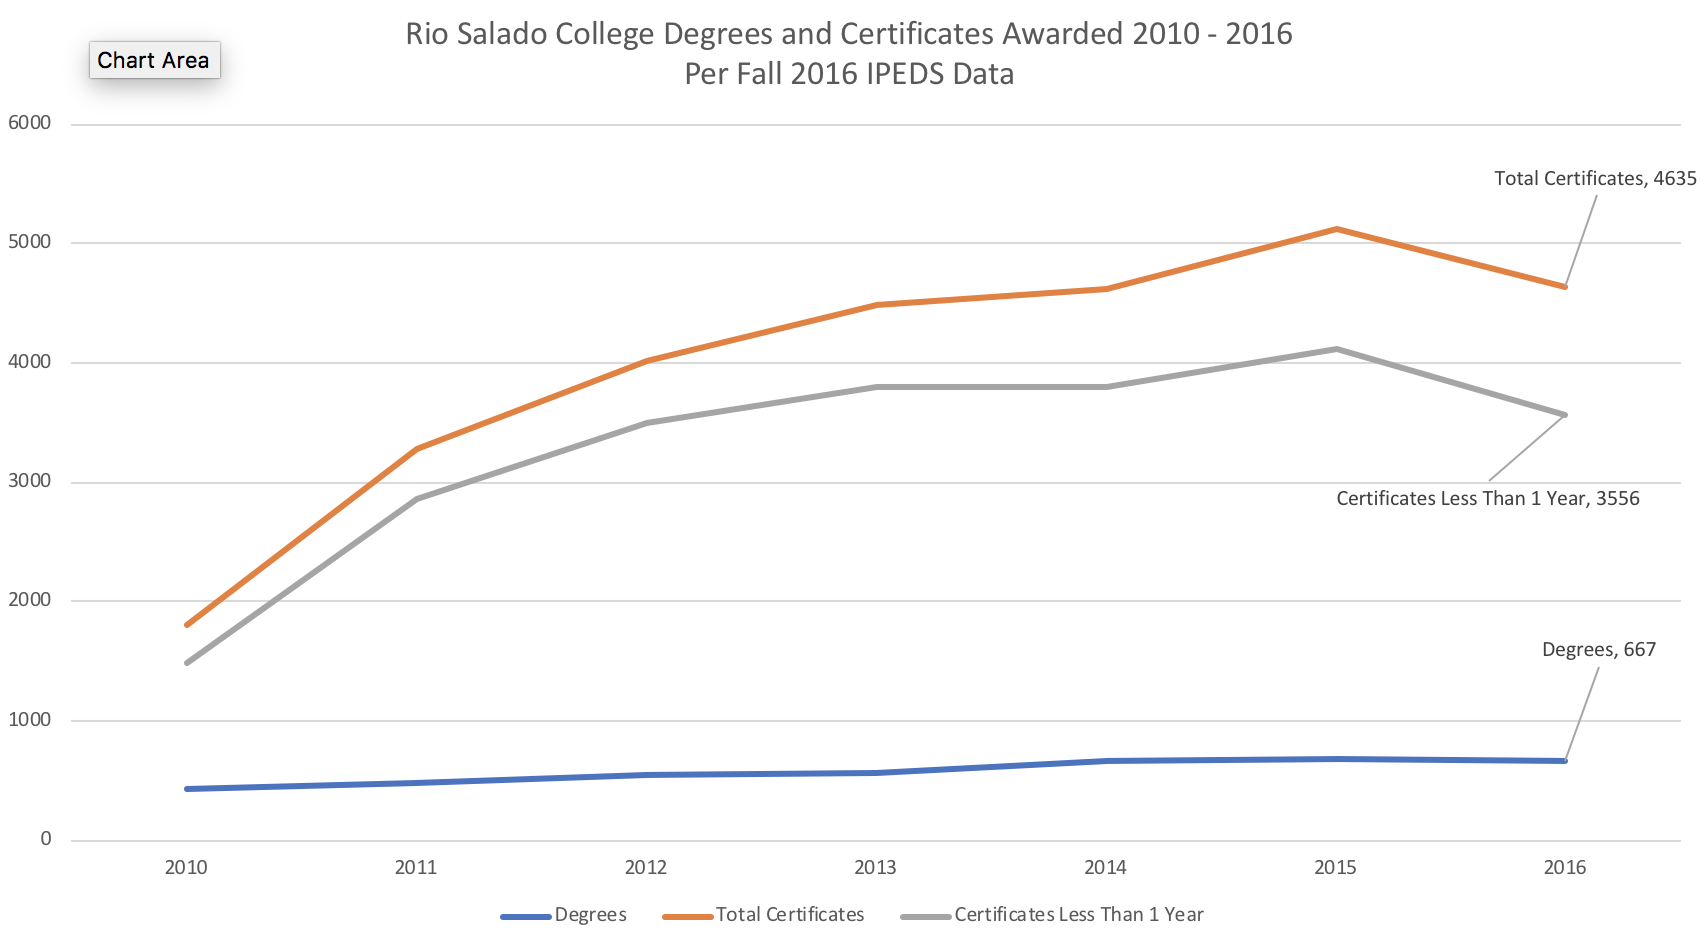
    Notably, since 2010 Rio has defined and awarded more and more of these <1 year certificates, based on IPEDS data.

    We can see is that the large majority of completions, which Rio labels under graduation rate, comes from the nonstandard certificates rather than degrees.

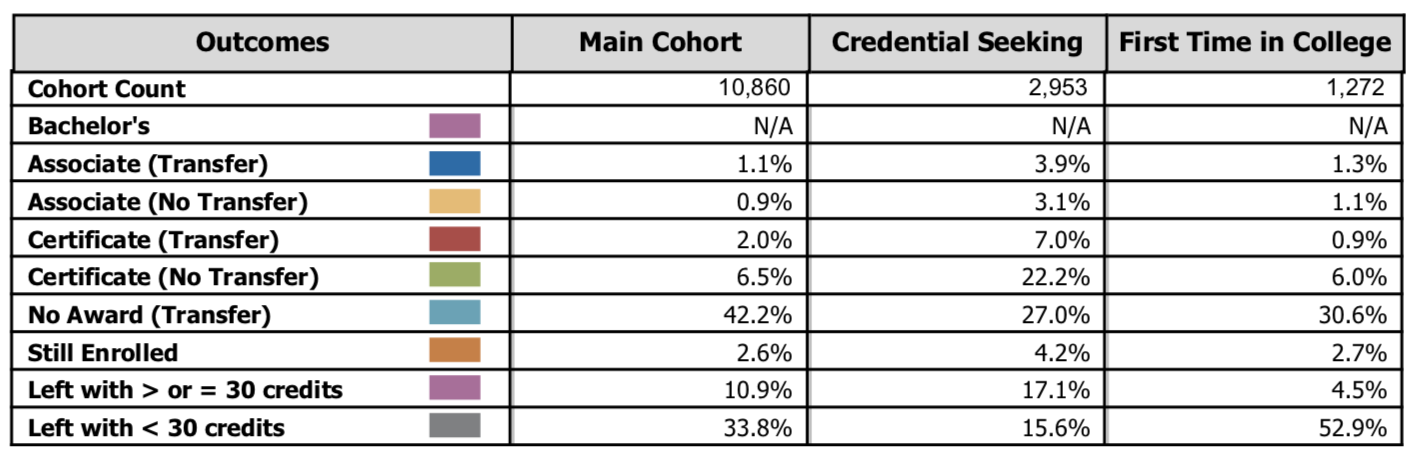
    One of the strengths of VFA is that under the Six-Year Outcomes measures, you can separate out the various types of award. Below is the data for Rio – pay attention to the Credential-Seeking Cohort, as it removes the majority of non-degree / non-certificate seeking students at Rio only looking to transfer a small number of credits. ((For degree or certificate-seeking cohorts, I prefer the Rio definition based on student self-reporting, but the VFA definitions get at the same idea.)) Also note that VFA outcomes are mutually-exclusive and hierarchical in the order shown. If a student gets a certificate and a degree, they are listed under the degree outcome.

    For the Credential-Seeking Cohort, 22% of Rio students get a certificate and do not transfer to a four-year school, 7% get a certificate and transfer, 3% get an associate’s degree and do not transfer, and 4% get an associate’s degree and transfer. A large majority of Rio Salado completions are for certificates, which is consistent with the IPEDS data.

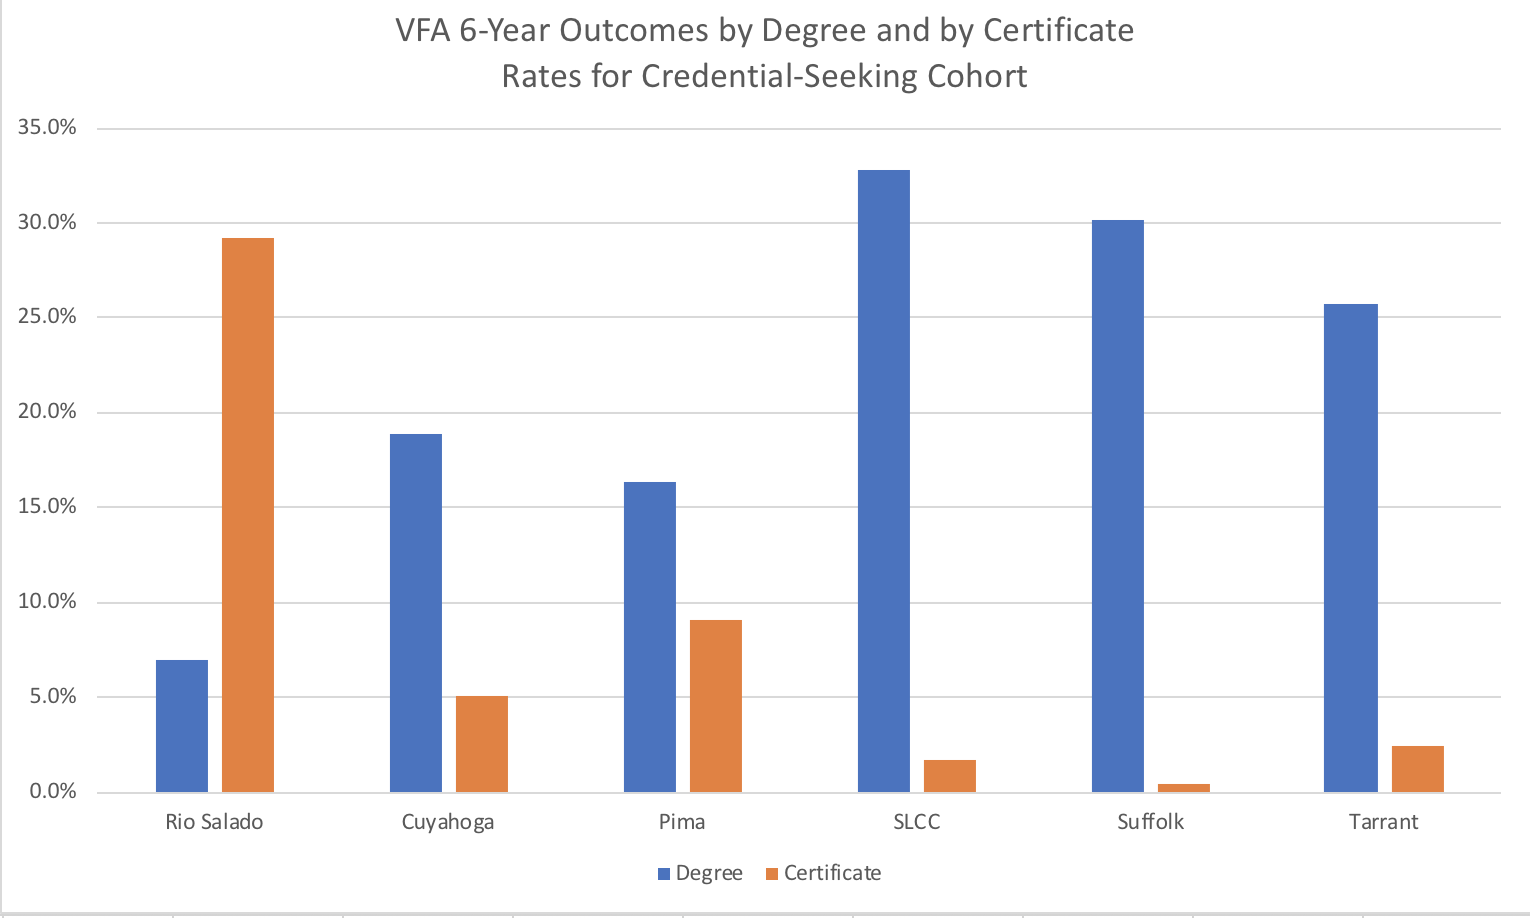
    How does Rio compare to other large community colleges? While we have not analyzed all 200+ colleges in VFA, spot checking with some peer schools indicates that Rio is well below others in awarding degrees but well above others in awarding certificates.

    The resulting data provide the basis of my comment in IHE:

    “This is not a bad situation, per se, as long as students are gaining value in the workplace for these official certificates,” he said via email. “But certificates are not useful in terms of comparing apples to apples, especially when one school uses them liberally, as does Rio, and most other schools do not.”

    Hill also noted that Rio Salado’s VFA completion rate for associate degree programs is a “troublesome” 7 percent.

    While I appreciate the valuable sharing of information from Rio Salado in this process, I’ll stick with my original conclusion:

    At best, this is a school with mixed results that should not simply be labeled a success without caveats or explanations.

    Rio has shown that they can cut costs and still be a successful transfer school, but not that they can be a successful degree school. This matters a great deal in terms of how transferrable the lessons are. It’s fine to focus on transfers when you’re right next door to ASU. But what if you’re Adirondack Community College? There are places where degree completion matter more or less than at Rio. And what about those students going to Rio who *are* seeking degrees? Does this model promote some educational outcomes at the expense of others? And if so, shouldn’t students know about that before enrolling?

  • OPM Market May Be Growing, But It’s Not Without Chaos

    OPM Market May Be Growing, But It’s Not Without Chaos

    There has been growing interest in the Online Program Management (OPM) market, as more schools try to develop a strategy and revenue model for online programs (particularly for master’s level), and as 2U continues its rapid rise in the stock market (with a nearly $4.8 billion market cap). Typically the description of this market is that the total annual revenue is somewhere between $1.5 – $2.5 billion and that it is growing. The implications are that we have a land grab as companies get rich off the new programs.

    The reality, however, is more complicated. The OPM market may be growing, but it is chaotic and messy. Consider the following problems within the market:

    • This is not an easy market, as many programs take millions of dollars of investment by the OPM provider before an account becomes profitable, often 3 – 5 years down the road.
    • 2U’s Semester Online initiative, targeted at the undergrad market as a consortium, shut down in 2014 due to the departure of several founding member institutions and due to low enrollment.
    • Later that same year Cal State Online shut down in all but name, along with its usage of Pearson as its OPM partner.
    • In 2015 Synergis Education pulled out of its work with USC’s Master of Integrated Design, Business and Technology program, to be eventually replaced by 2U.
    • In 2016 the University of Florida Online (UF Online) canceled its contract with Pearson and pivoted to a new approach not using an OPM partner.
    • After raising $230 million from Bertelsmann in 2015, HotChalk has failed to bring in any new clients of the scale of Concordia University, and in 2016 the company paid a $1 million settlement (though not admitted any fault) based on a federal investigation and lawsuit.
    • Sometime in 2016/17, the nonprofit OPM Educators Serving Educators from Excelsior College shut down.
    • In 2017 after a management shake-up, DeVry Education Group (now Adtalem) pulled out of the OPM market and got rid of its Integrated Education Solutions group.
    • In late 2017 the Eastern Michigan University’s chapter of the American Association of University Professors filed a complaint against EMU’s contract with Academic Partnerships, although an arbitrator sided with the school earlier this year.
    • Also in late 2017 Greenwood Hall – a call center-based fee-for-service OPM provider – collapsed in dramatic fashion, with AnswerNet eventually buying the remaining assets.
    • There has been growing pushback on the mainline revenue-sharing model, where full-service OPM providers make 50% or even more of tuition dollars from online programs. This has led to the rise of unbundled, fee-for-service category of OPM providers.

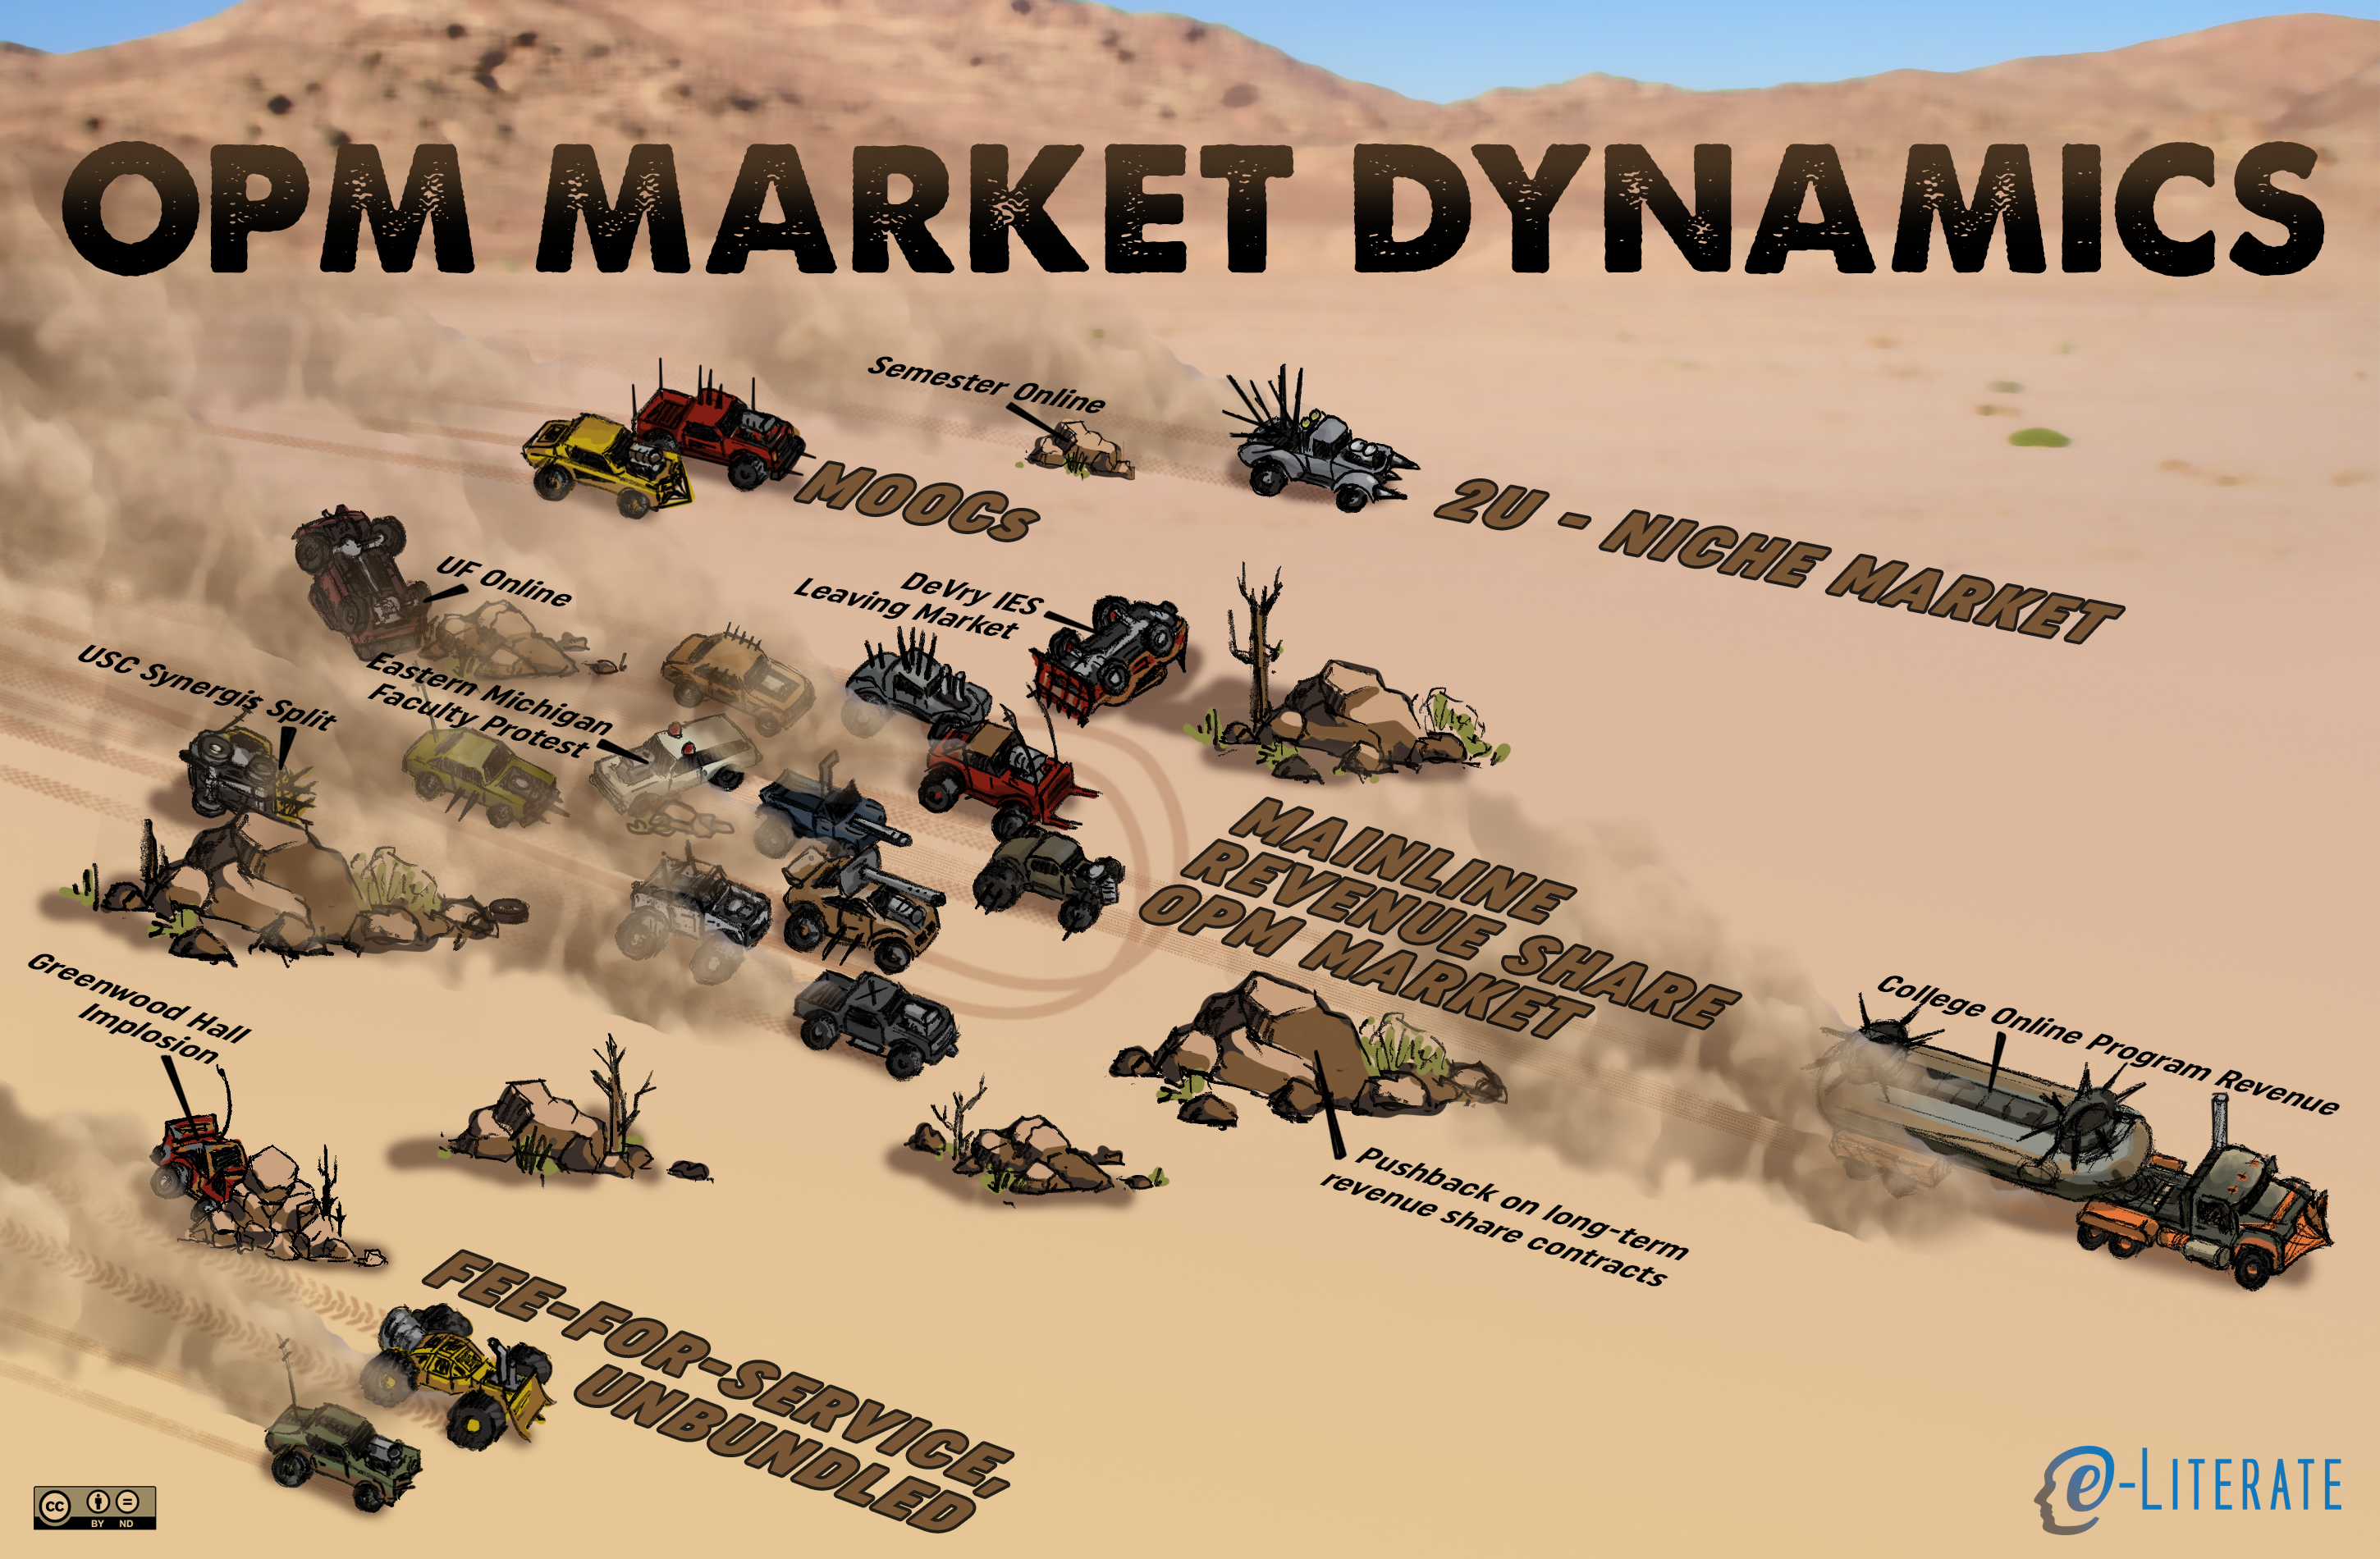
    The picture one gets is of a chaotic market that is not for the faint of heart, and one that will likely see further consolidations and category changes. 2U, for its part, has been successful partially due to a niche strategy where they go after elite master’s programs and mostly avoid direct competition or engagement with the rest of the market. And recently we have started to see the MOOC providers become OPM providers – where the primary revenue for Coursera and FutureLearn are based on revenue sharing with online programs, albeit with lower sharing rates and with very different marketing approaches. In other words, there seems to be several efforts to enter into the same OPM race, but if possible to avoid being in the mainline rev-share OPM market. The Toecutter would feel right at home.

    The Mad Max view of OPM market dynamics

    Not even represented here is the movement of former for-profit institutions (e.g. Grand Canyon University, the parent company of Kaplan University) becoming OPM providers.

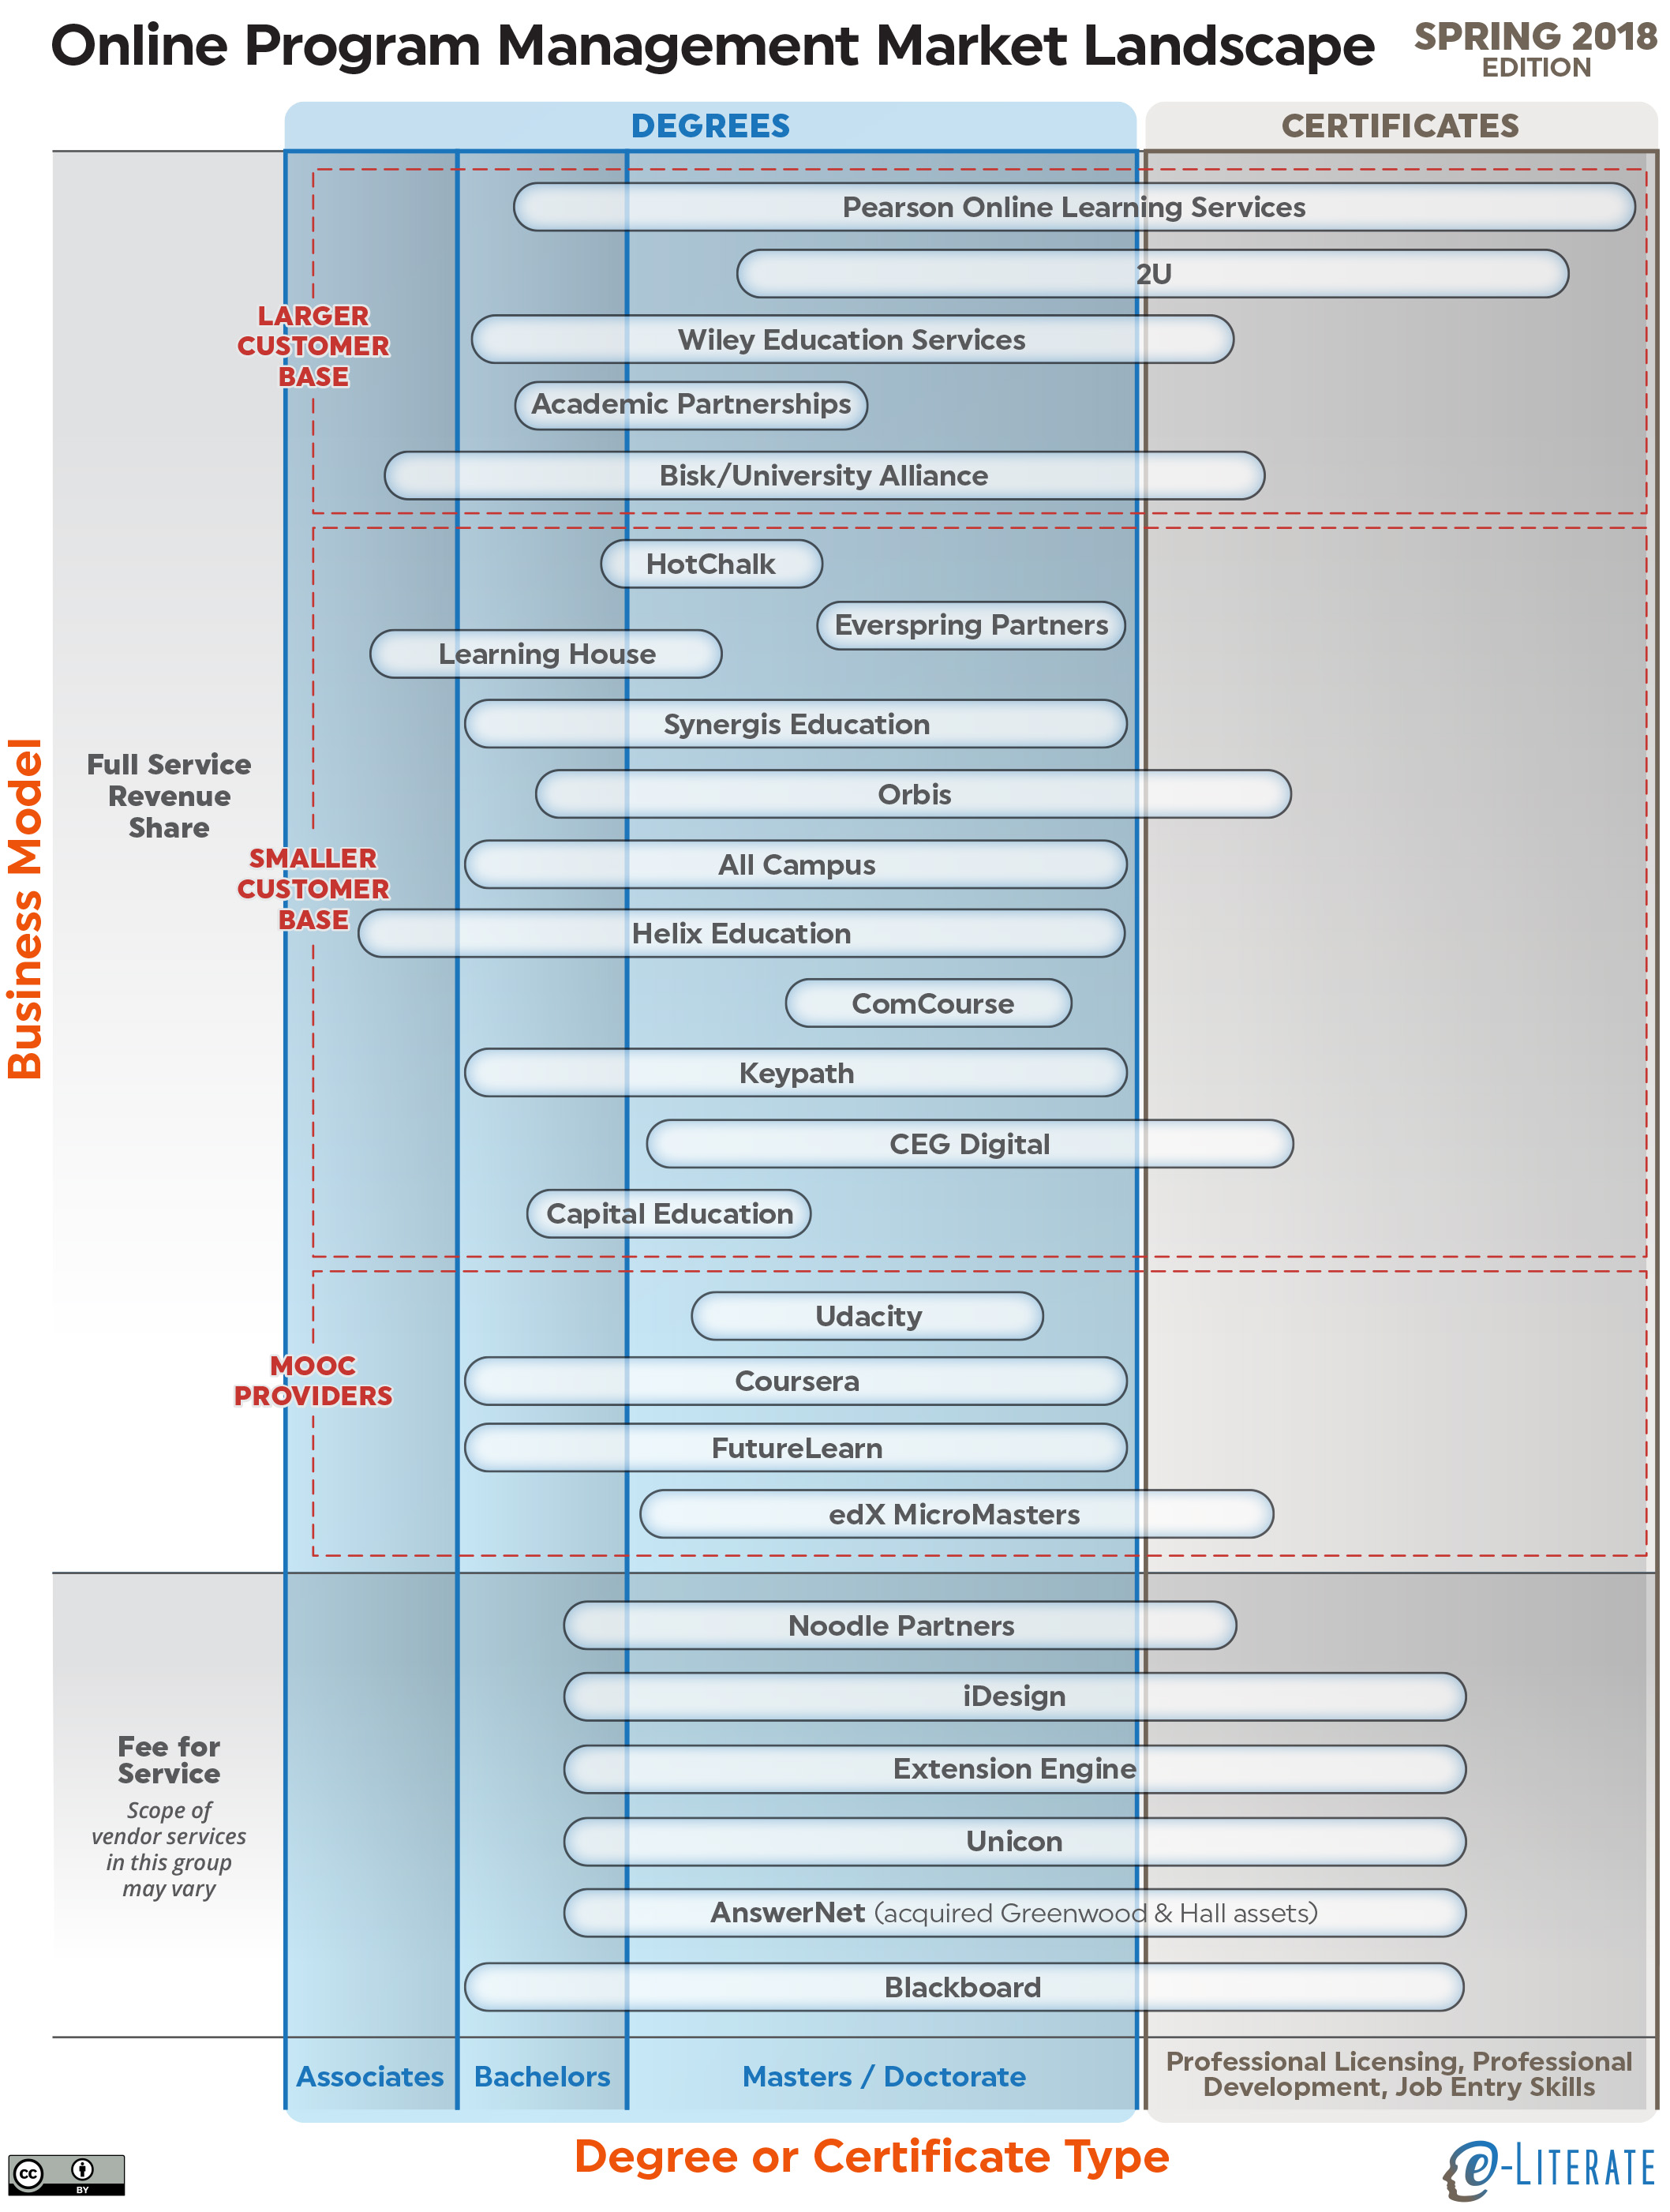
    This means that our landscape view of the market is temporal in nature – expect more shake ups and category changes as the OPM market continues to grow in new ways.

    Market landscape of OPM vendors

  • Rio Salado College As Exemplar: A critical external view

    In yesterday’s post I described how a review of two courses at Rio Salado College indicated reasons to question the use of this school in the ASU / BCG case study report on Digital Learning ((Disclosure: Our e-Literate TV series was funded in part by the Bill & Melinda Gates Foundation who also funded the ASU / BCG study.)). The report, titled “Making Digital Learning Work: Success Strategies From Six Leading Universities and Community Colleges”, has the following description [emphasis added]:

    How can the use of digital technologies in postsecondary education impact students’ access to education, student outcomes, and the return on investment for students and institutions? What are the biggest challenges for an institution seeking to implement high-quality digital learning opportunities? What promising practices enable an institution to achieve impact at a larger scale? [snip]

    The answers, at least in part, lie in case studies of six colleges and universities: Arizona State University, the University of Central Florida, Georgia State University, Houston Community College, Kentucky Community and Technical College System, and Rio Salado Community College. The first three institutions in this list are public research universities, representing different geographic populations and access missions. The other three institutions include two community colleges and a state-wide community college system.

    These six institutions have a strong track record of using digital learning to serve large, socioeconomically diverse student populations, and each has been a pioneer in innovating to expand access to postsecondary education, improve student outcomes, and provide higher education at an affordable cost.

    Let’s look at the track record of Rio Salado College in terms of aggregate academic student outcomes to see how appropriate it is to include them as an exemplar in such a case study-based report. For much of my analysis, I looked at the 862 public 2-year colleges fully reporting data in the Fall 2016 IPEDS data set.

    Reduced Expenditures

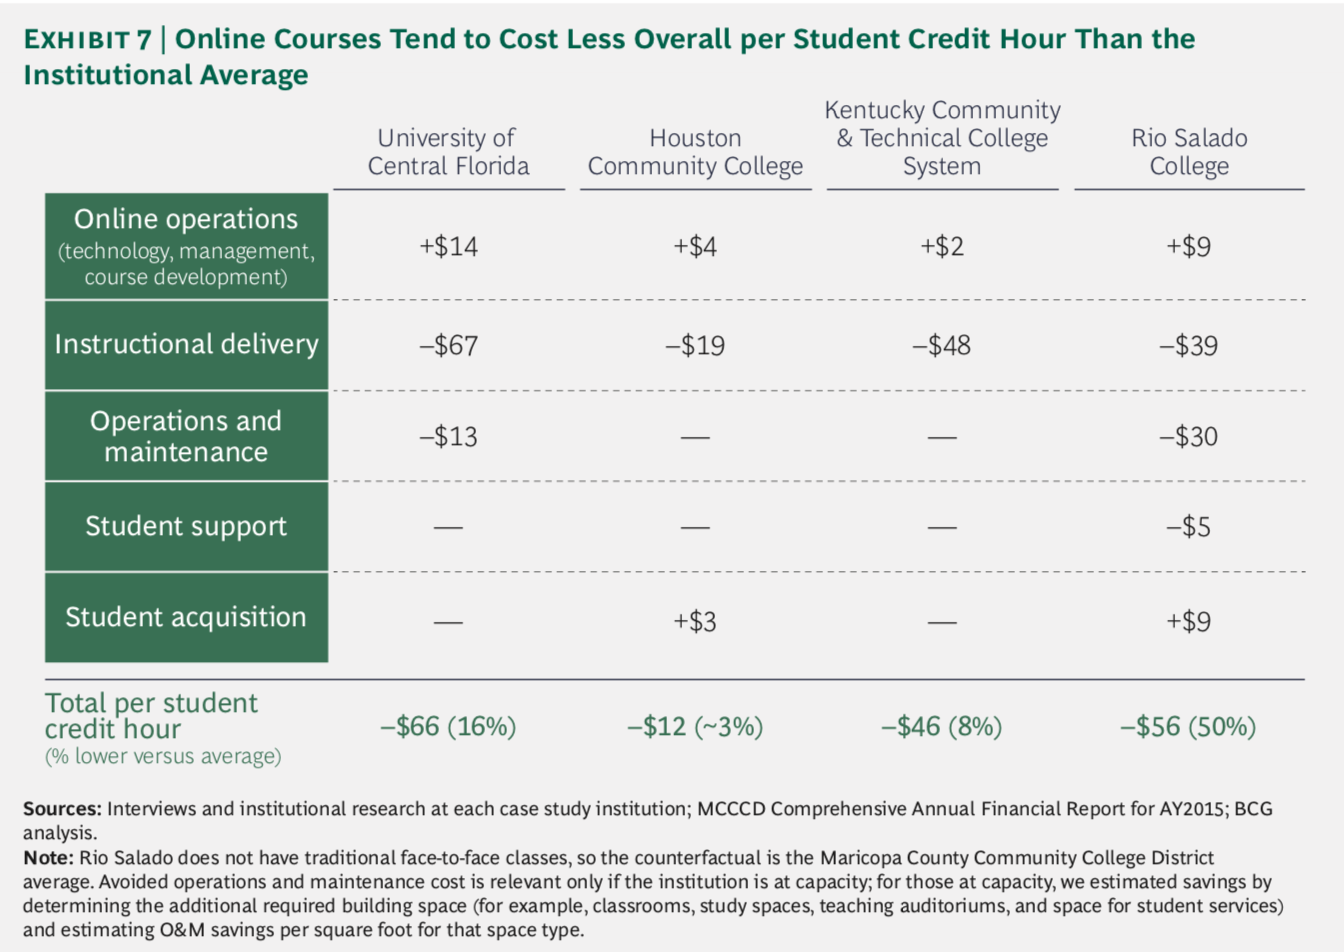
    The primary claim made in the ASU / BCG report is that Rio Salado is has reduced costs.

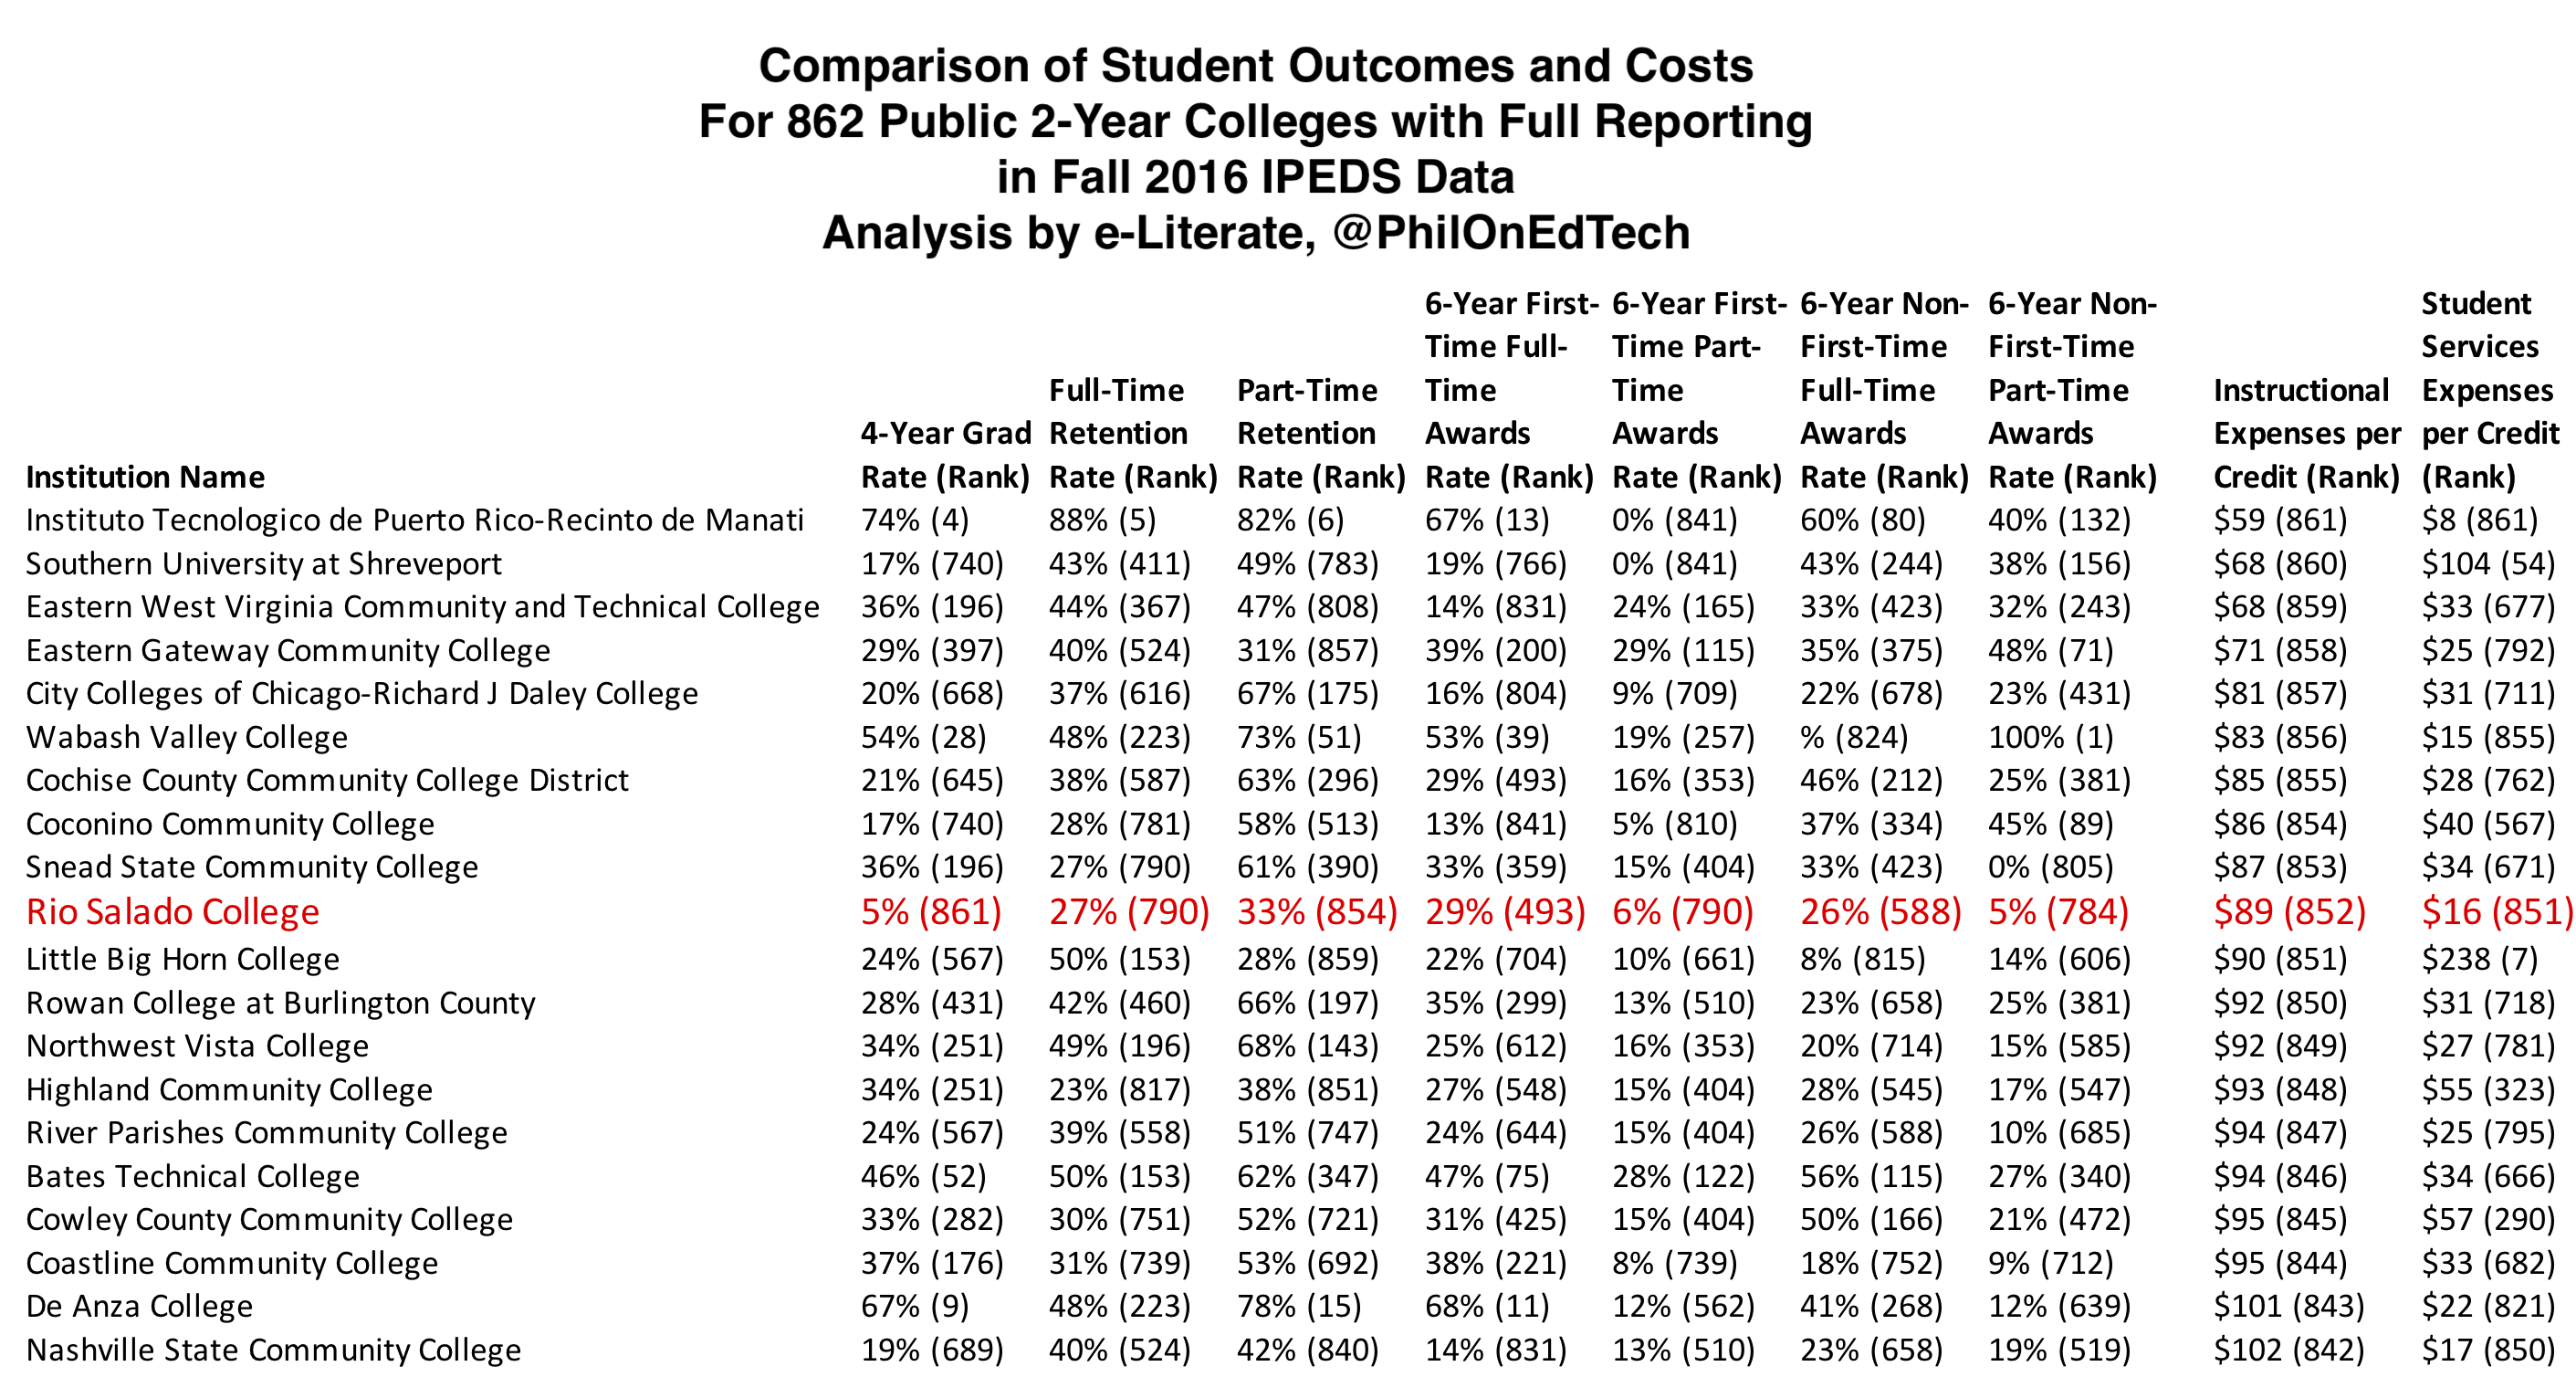
    This claim does hold up to scrutiny, as Rio’s $89 of instructional delivery costs per student credit hour and $16 of student services costs are 10th and 9th lowest in the country for the 862 colleges I reviewed.

    The primary outcomes claims made in the case study quickly brush off the standard metrics for Rio.

    Rio Salado’s success is not defined solely by improvements in graduation and retention rates. In particular, the college has a high transfer-out rate (32% compared to an average of 19% for other MCCCD colleges [ed. – the other schools in the Maricopa County Community College District]), and the students who transfer to Arizona universities from Rio Salado have a 74% four-year graduation rate—3 percentage points higher than the average for other MCCCD transfer students. At Rio Salado itself, students’ course-level success rates have slowly been improving over time, to about 64% in 2016.

    Graduation and Retention Rates

    It is all well and good to point out the importance of transfer students, but we should not ignore graduation and retention rates. And we should explore whether the data supports the phrase “improvements in graduation and retention rates”.

    The report describes Rio’s investment in a suite of advising tools.

    Obtaining these advisory tools required an initial investment of $1 million, but the tools pay for themselves by increasing Rio Salado’s term-to-term retention by 7%, increasing ROI through improved student progress and the additional tuition dollars that the institution receives from retained students.

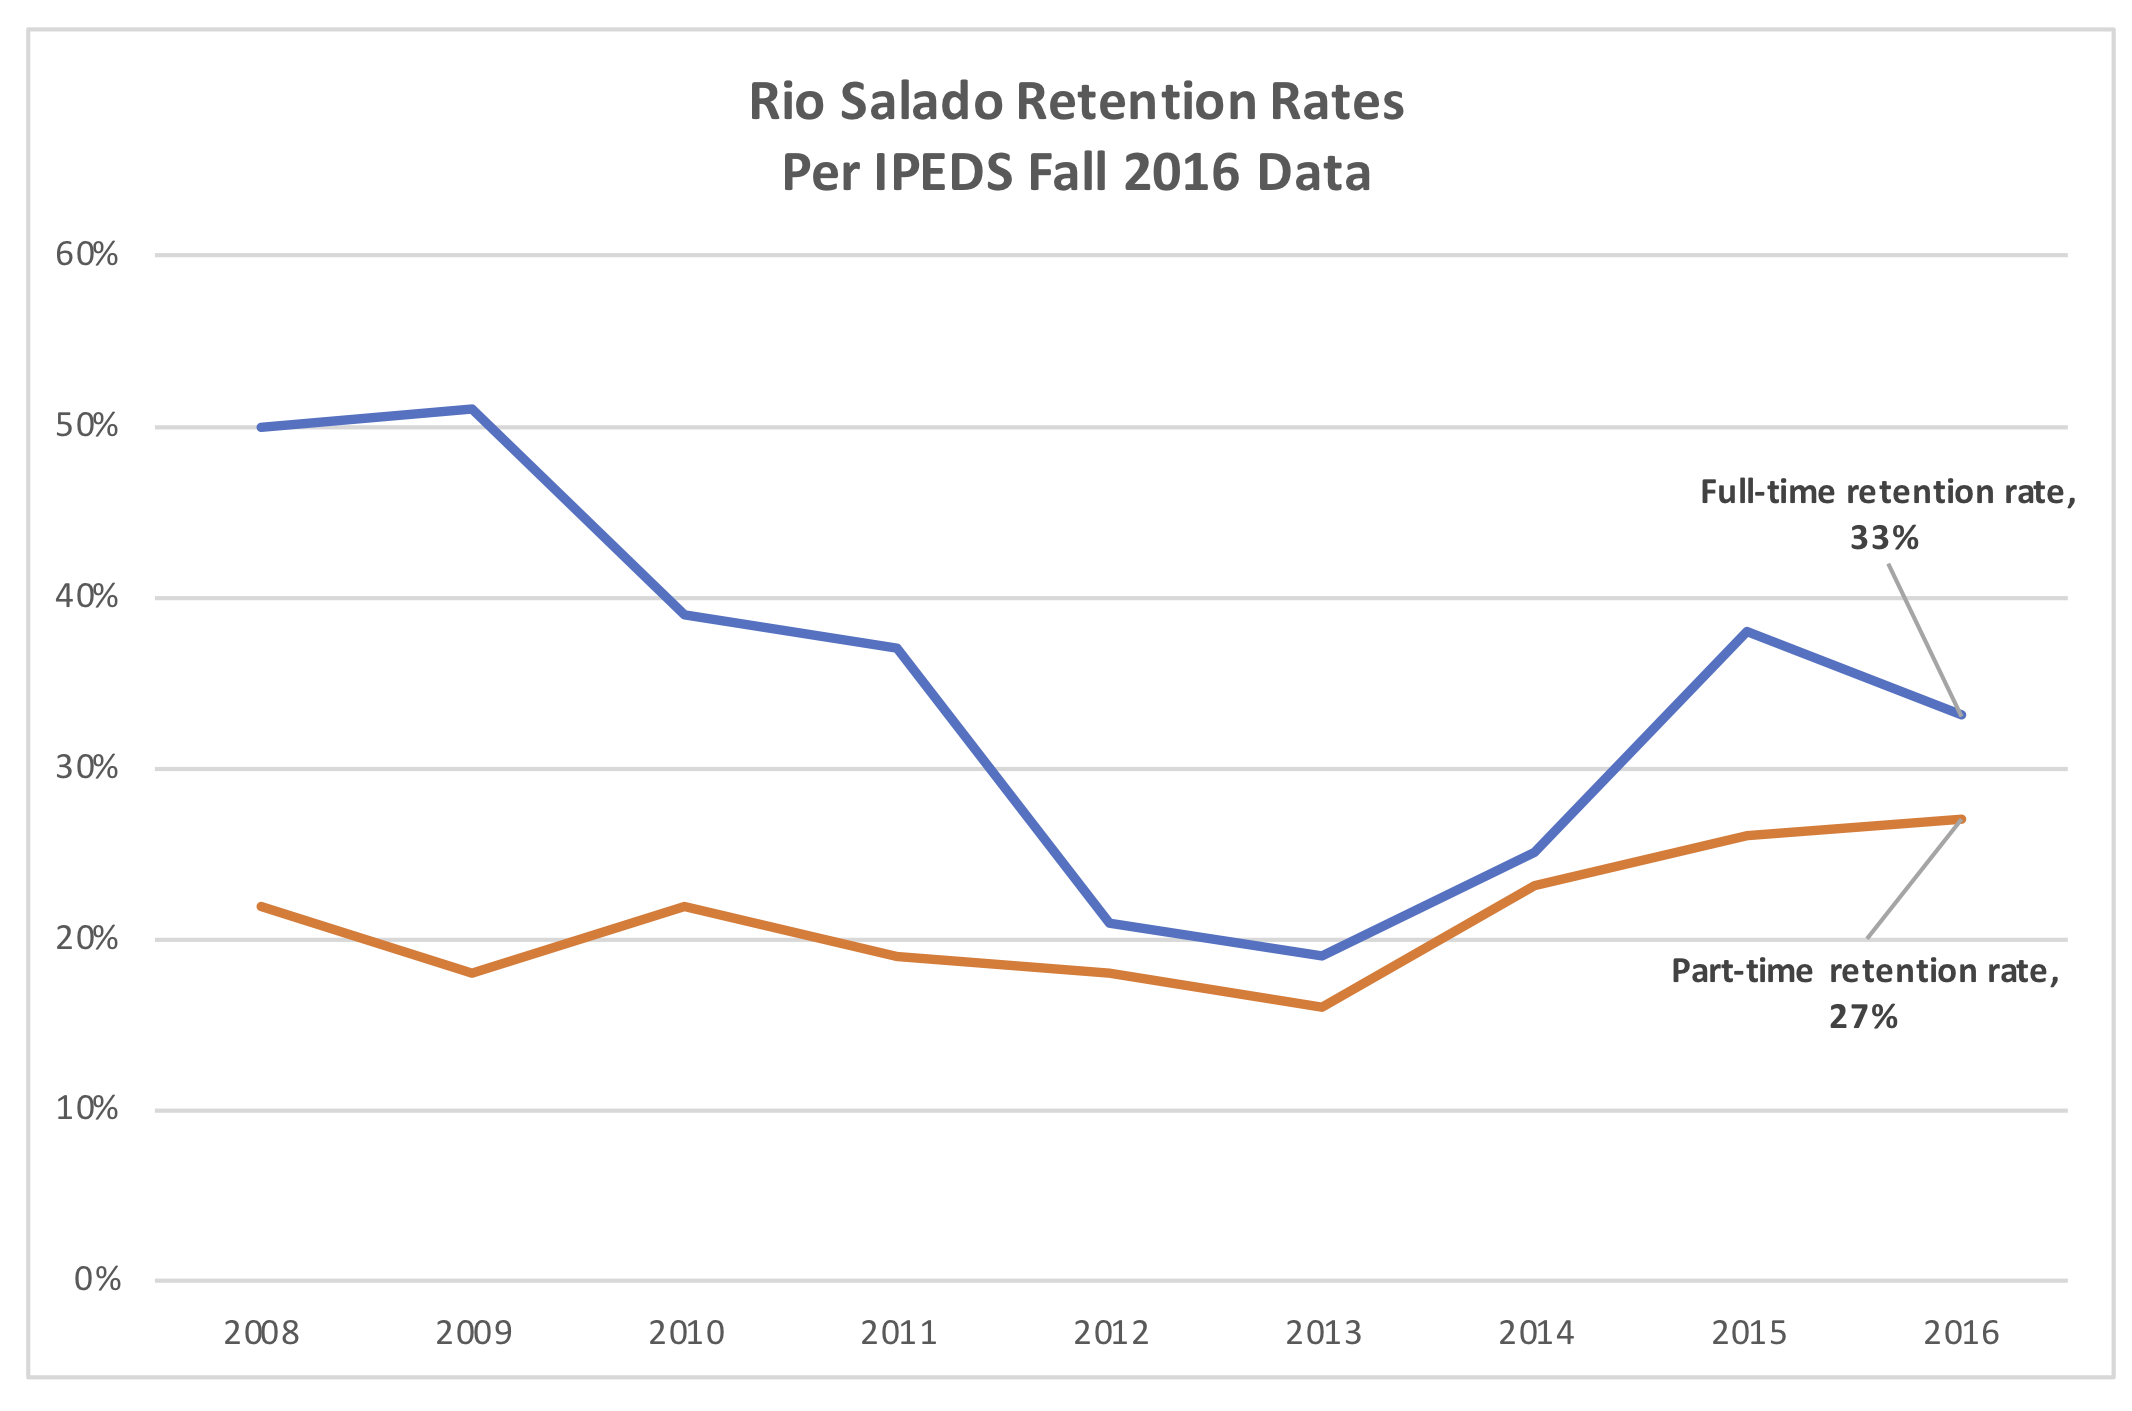
    Looking at IPEDS data, we can see Year 1 to Year 2 retention rates (not quite the same as term-to-term), and it shows improvement since 2013. Unfortunately, Rio’s retention rates for full-time and part-time students are both in the bottom 10% of all community colleges at 33% and 27%, respectively. And the full-time rate is lower than it was prior to 2011.

    Rio Salado Year 2 Retention Rates

    While the ASU / BCG report does not mention graduation rates directly, there have been several claims made about Rio’s numbers in other publications.

    The problem is that Rio Salado’s 4-year graduation rate for first-time full-time students as reported in IPEDS is 5% – the second lowest of any public 2-year college in the nation. How can we resolve this discrepancy?

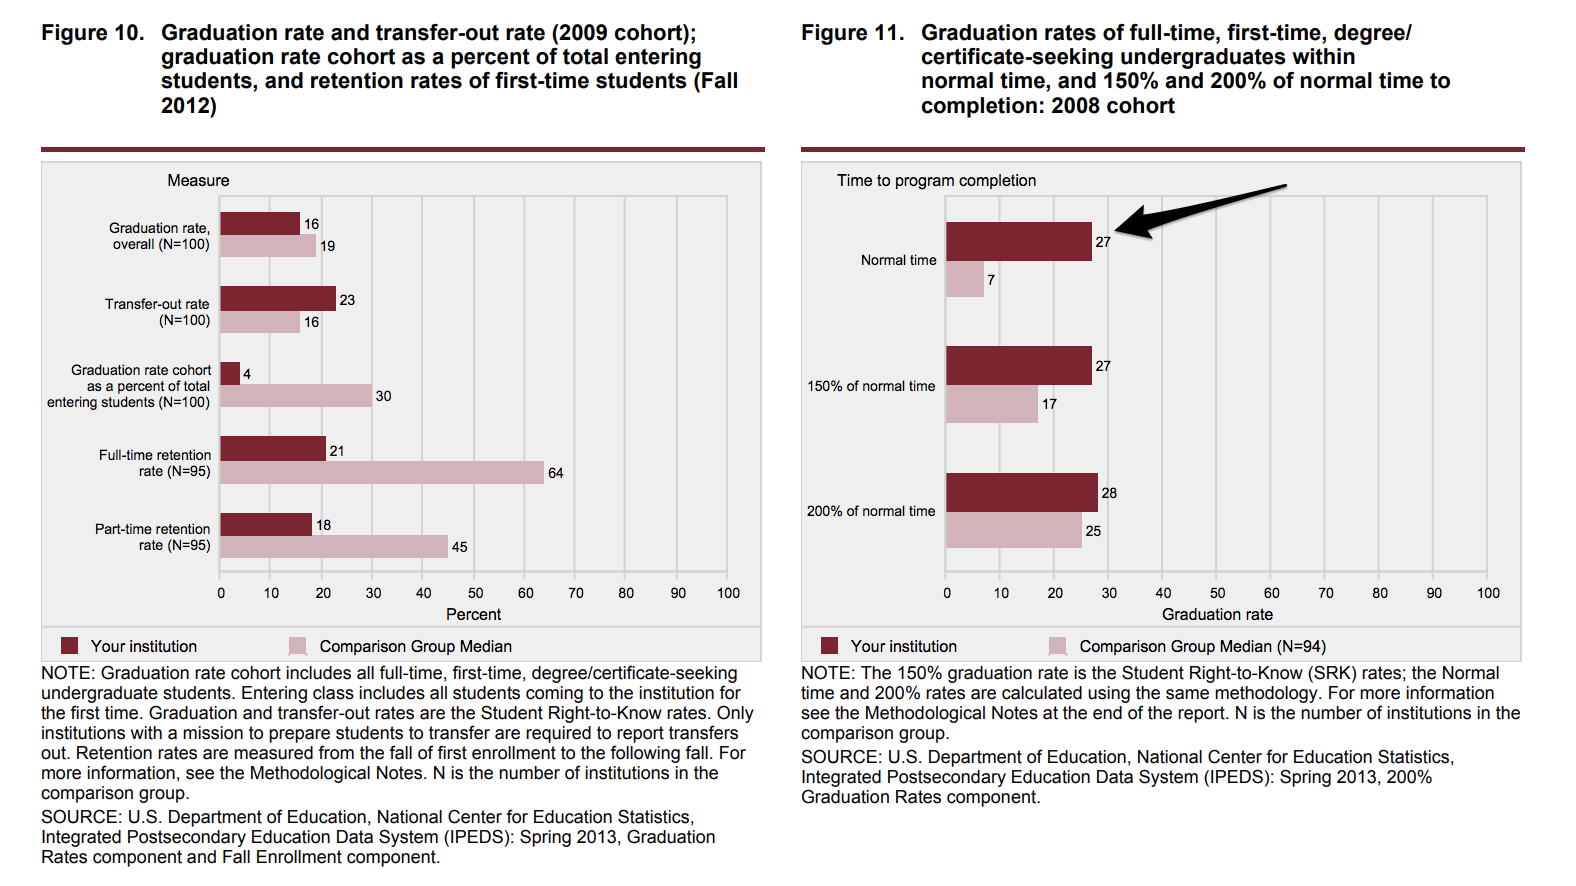
    The key to understanding the claims in these four articles is to follow the two links, which both point to a customized IPEDS Feedback Report from 2013 for Rio against their selection of 100 peer institutions.

    Figures 10 and 11 from IPEDS report

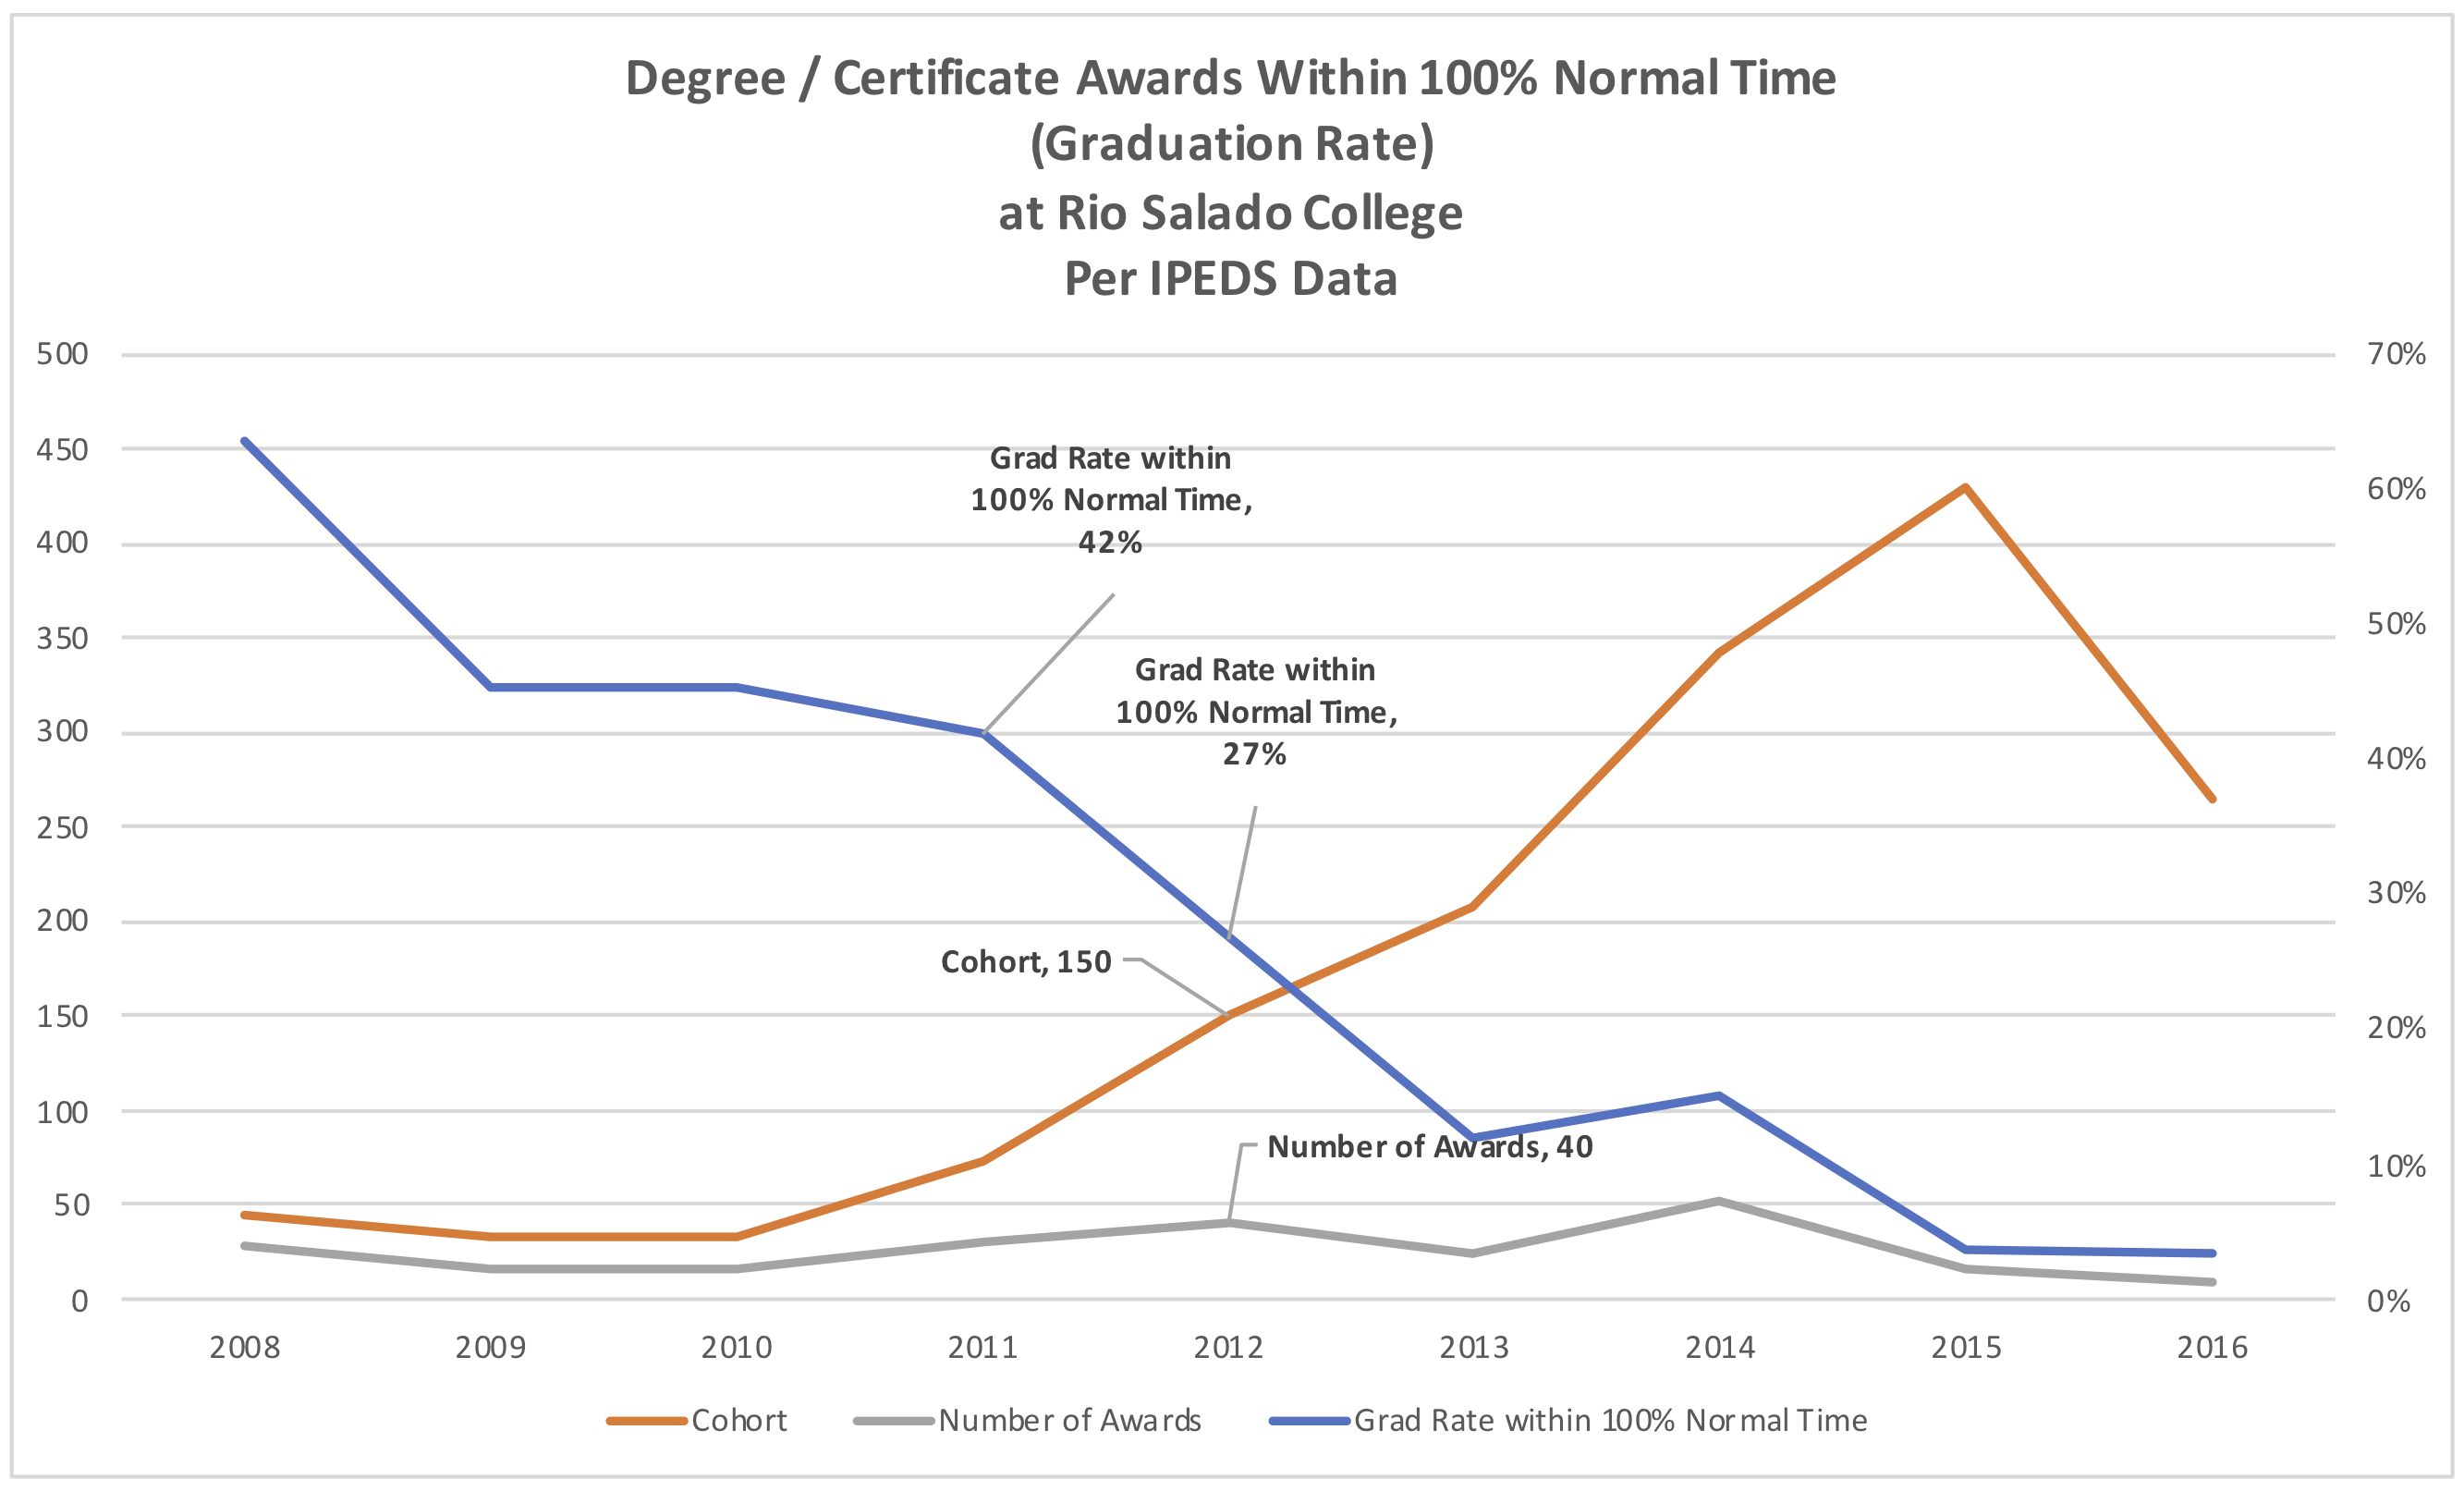
    This measure captures any award – degree or certificate – for a small cohort of entering full-time students at Rio from 2009. If you trace that data through IPEDS, you see that this measure is for a 150-student cohort (in 2012) out of the 45,000+ students at Rio.

    Using this specific metric, you can find the 42% graduation rate in 2011, and the “four times greater” rate of 27% in 2012, both as the rate plummets from 64% in 2008 to 3% in 2016.

    Using broader, up-to-date metrics for graduation and retention rates as well as the new IPEDS outcomes measures (which allows comparison outside of just full-time first-time cohorts), we see that Rio Salado College has some of the lowest student outcomes measures in the country.

    For all but two measures (6-year First-Time Full-Time Awards and 6-year Non-First-Time Full-Time Awards), the performance is in the bottom 10% of all colleges in the study. For those two awards measures, the performance is in the bottom half of the country and represents just 11% of the student body.

    Transfer Rates

    What we are left with are reports about high transfer rates and subsequent success rates 3% higher than other transfers out of the same district. The IPEDS data set now includes transfer rates in its new Outcomes Measures section, and it is true that Rio Salado College does transfer out a significant portion of students. For all cohorts defined below, Rio is in top 20% of public 2-year institutions.

    • First-Time Full-Time Students: 39% transfer rate, Rank 170 out of 862
    • First-Time Part-Time Students: 47% transfer rate, Rank 112 out of 862
    • Non-First-Time Full-Time Students: 46% transfer rate, Rank 196 out of 862
    • Non-First-Time Part-Time Students: 59% transfer rate, Rank 121 out of 862

    Note that this data indicates that students transferred to another institution and are still enrolled there. This data does not indicate what portion of the transfers were planned versus students deciding to move on for other reasons. Nevertheless, for a community college, especially one with very close ties to ASU (I have been told that a large percentage of Rio students are ASU students trying to fill out their schedule based on saving money and more convenient schedules), this is a favorable metric.

    I cannot provide independent confirmation on the subsequent success rates, so we’ll accept that claim at face value.

    Case Study Questions

    I should note that Rio Salado College does provide accurate information on the metrics mentioned in this post, both through IPEDS reporting and through their Research & Planning section of the web site. The picture that emerges from the aggregate outcomes data is of a large school that:

    • transfers out greater than average percentage of students;
    • is just below average for awarding certificates for full-time students;
    • is among the poorest performing in the country for retaining students;
    • is among the poorest performing in the country for awarding degrees; and
    • is among the poorest performing in the country for awarding certificates for part-time students.

    At best, this is a school with mixed results that should not simply be labeled a success without caveats or explanations.

    One question we should ask is whether it is appropriate to hold up a school with some of the lowest student outcomes measures in the country as an exemplar. Yes, Rio Salado has found a way to spend as little as possible on instruction and student support services, and yes, a lot of students transfer out, but that is not enough. We need greater evidence of student success if we are to use them as a case study for others to emulate. And we also need a more robust genre of a case study that looks across, at a minimum, a relatively standard set of publicly-available information, and deeper dives where appropriate, to understand educational practices and their impacts on students. These case studies should present information in context – the good and the bad – since education is complex and challenging, and a clear focus on evidence will benefit all parties in the end.

  • Rio Salado College As Exemplar: A critical internal view

    Rio Salado College As Exemplar: A critical internal view

    10 days ago Arizona State University (ASU) and the Boston Consulting Group (BCG) released a report, supported by the Bill & Melinda Gates Foundation (BMGF) ((Disclosure: Our e-Literate TV series was funded in part by the Bill & Melinda Gates Foundation.)), titled “Making Digital Learning Work: Success Strategies From Six Leading Universities and Community Colleges”. The basic idea [emphasis added]:

    How can the use of digital technologies in postsecondary education impact students’ access to education, student outcomes, and the return on investment for students and institutions? What are the biggest challenges for an institution seeking to implement high-quality digital learning opportunities? What promising practices enable an institution to achieve impact at a larger scale? [snip]

    The answers, at least in part, lie in case studies of six colleges and universities: Arizona State University, the University of Central Florida, Georgia State University, Houston Community College, Kentucky Community and Technical College System, and Rio Salado Community College. The first three institutions in this list are public research universities, representing different geographic populations and access missions. The other three institutions include two community colleges and a state-wide community college system.

    These six institutions have a strong track record of using digital learning to serve large, socioeconomically diverse student populations, and each has been a pioneer in innovating to expand access to postsecondary education, improve student outcomes, and provide higher education at an affordable cost.

    The methodology is a case study of each school, and the report then takes a stance on what other institutions should do.

    Now is the time for leaders to champion the potential of digital learning to open the doors of higher education wider and to improve student outcomes, while operating more efficiently and at lower cost. The journey of each college or university will be unique, but the set of promising practices described in this report may serve as a useful guide for all institutions.

    There are multiple methods to evaluating a school; it turns out that some are more meaningful than others, and it is always helpful to start with what students experience in actual courses. The ASU / BCG report provides useful context on course design.

    At Rio Salado, 22 full-time faculty chairs develop courses with the support of a central team that includes subject-matter experts, instructional designers, media support staff, and production staff. About 1,500 adjunct faculty members teach the courses, which they can personalize by adding an introductory message or video for each module.

    It turns out that I have access to two courses – ENG102 (First Year Composition) and EED200 (Foundations of Early Childhood Education) – and this gives an opportunity to better understand the student experience. What these courses indicate, however, is a troubling lack of meaningful interaction between faculty and students.

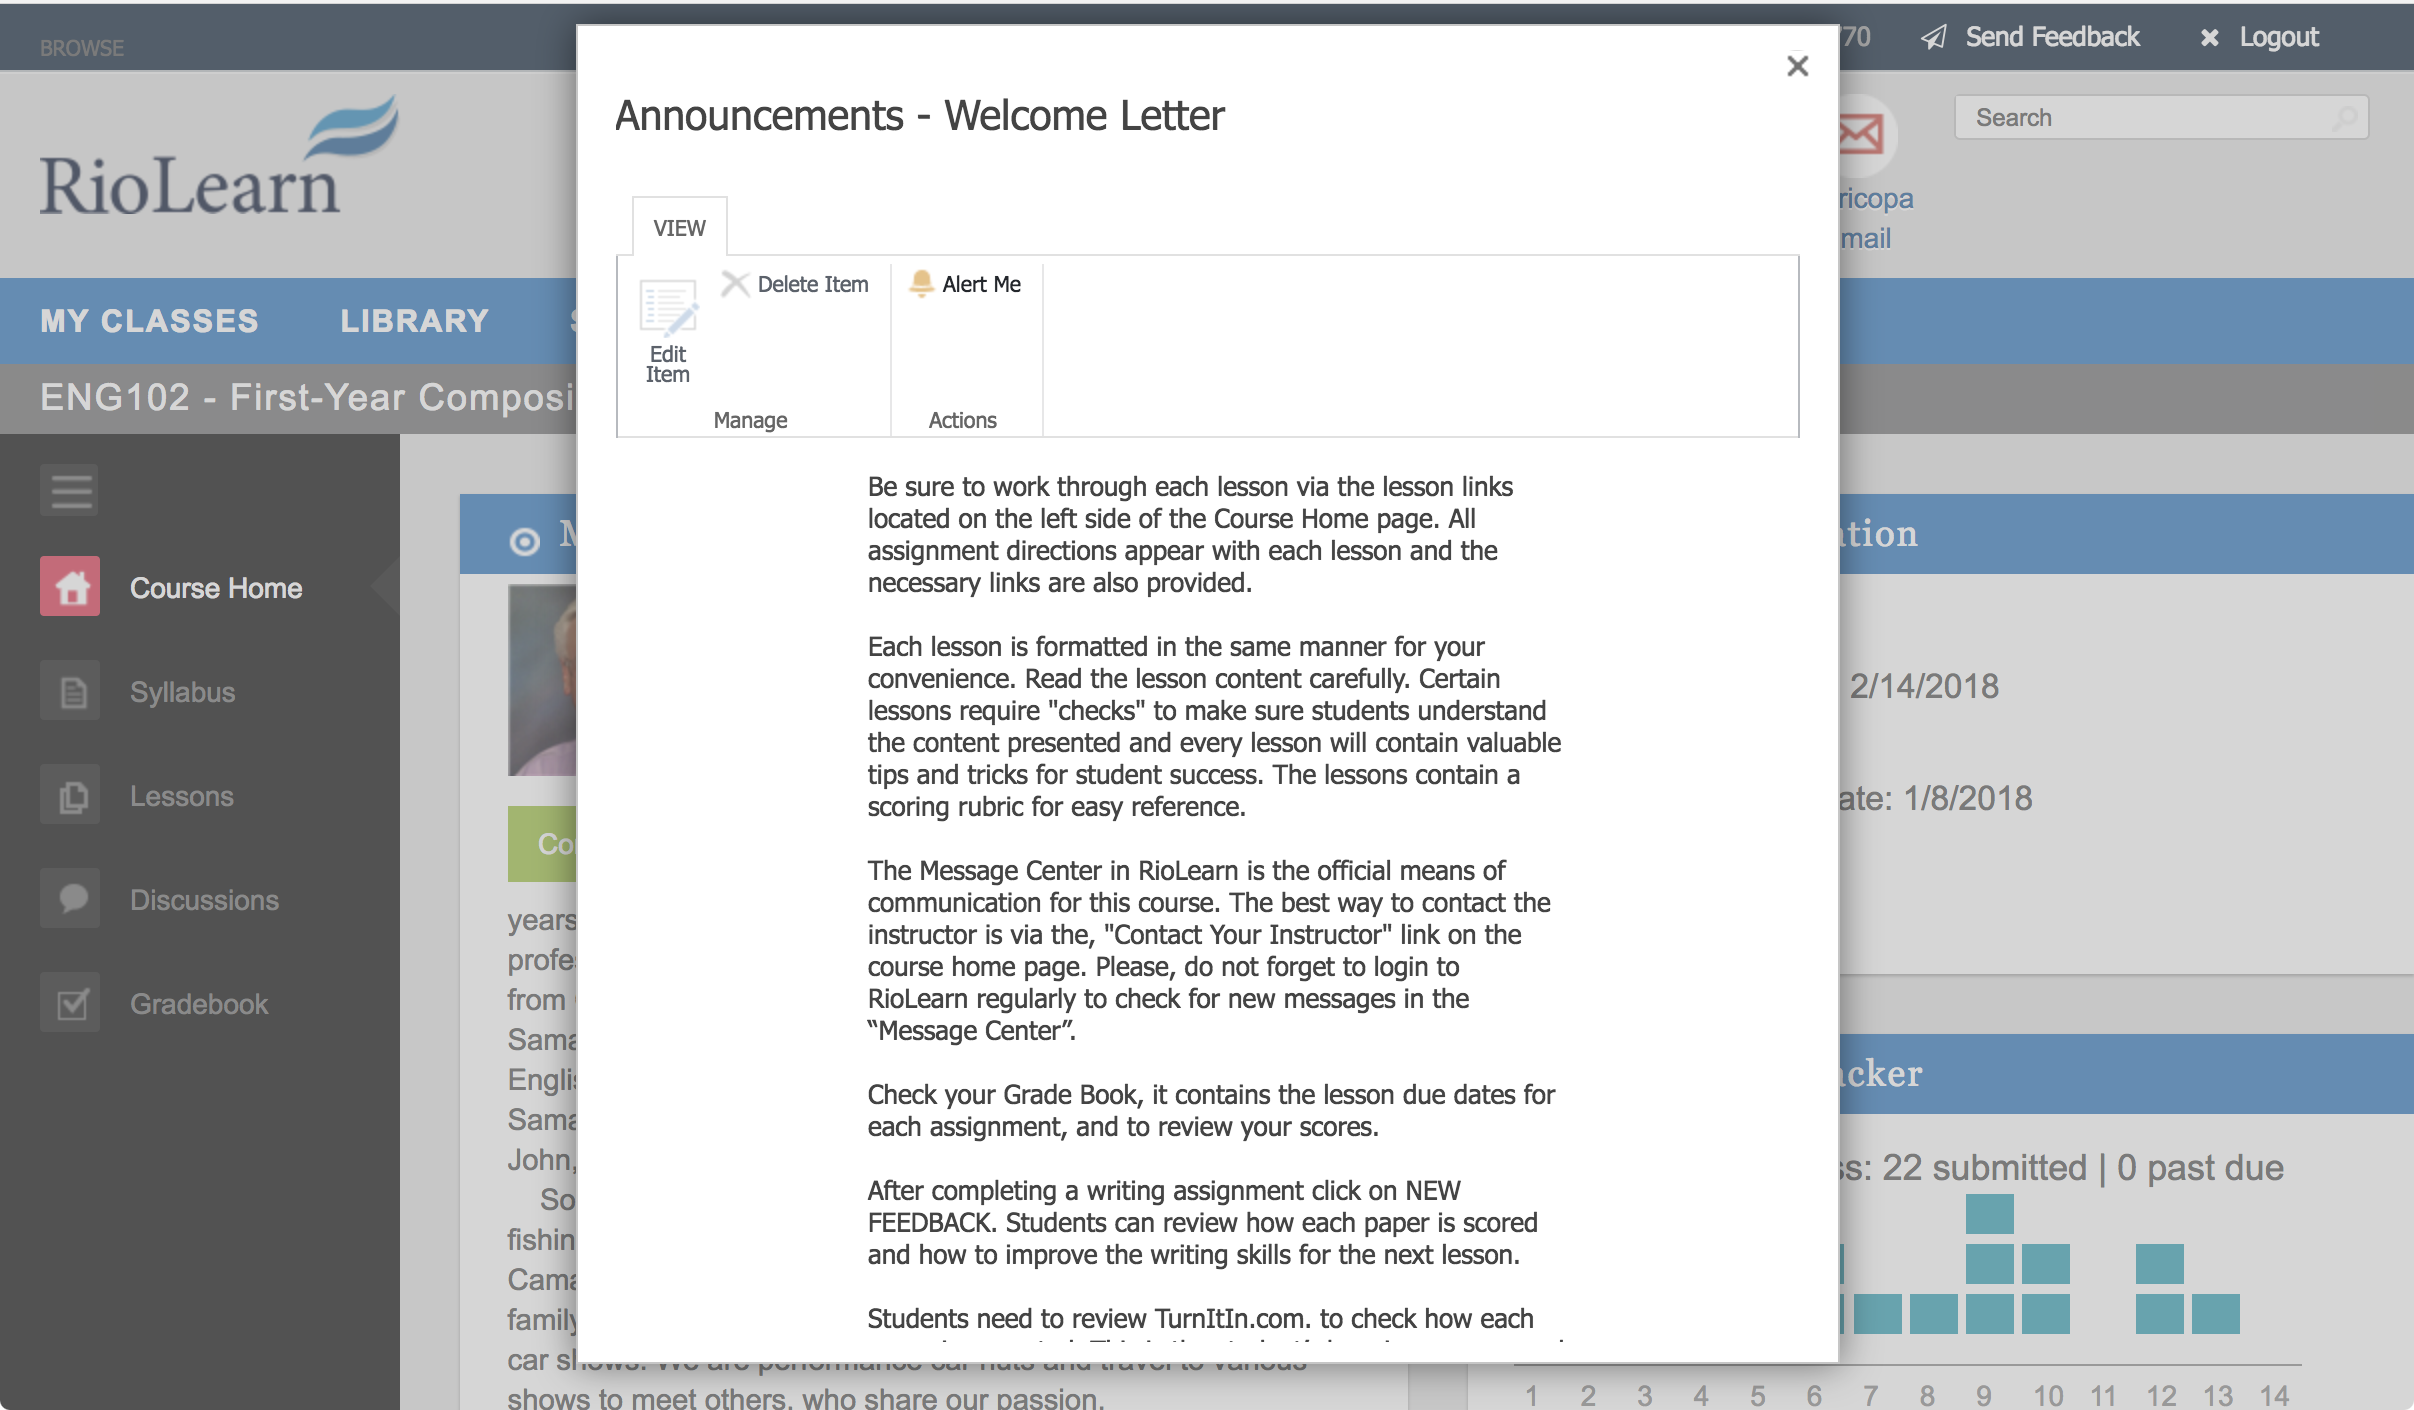
    Looking at ENG102, the course materials is Rio Salado developed courseware embedded in their custom course management system, RioLearn. The materials appear to be quite extensive, and all materials are available at the start of the term in 14 lessons. To find actual due dates, students have to go to the gradebook, as no specific dates are included in the courseware.

    Course Welcome Message

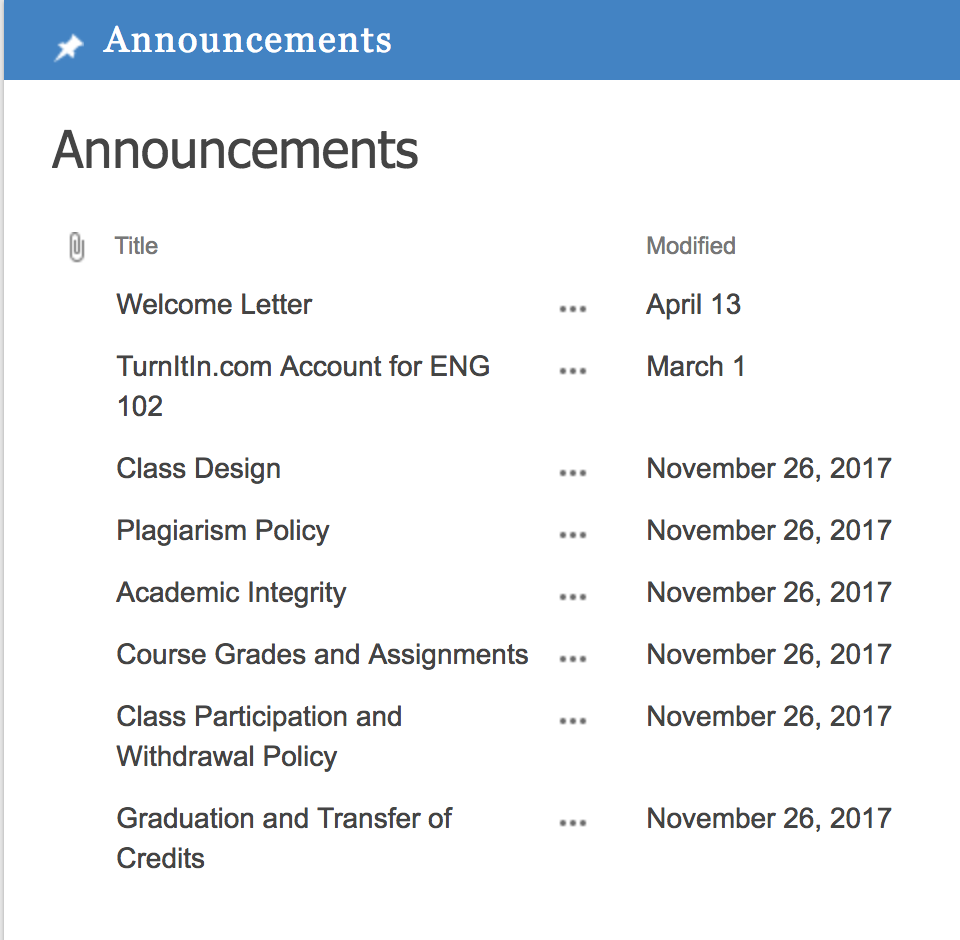
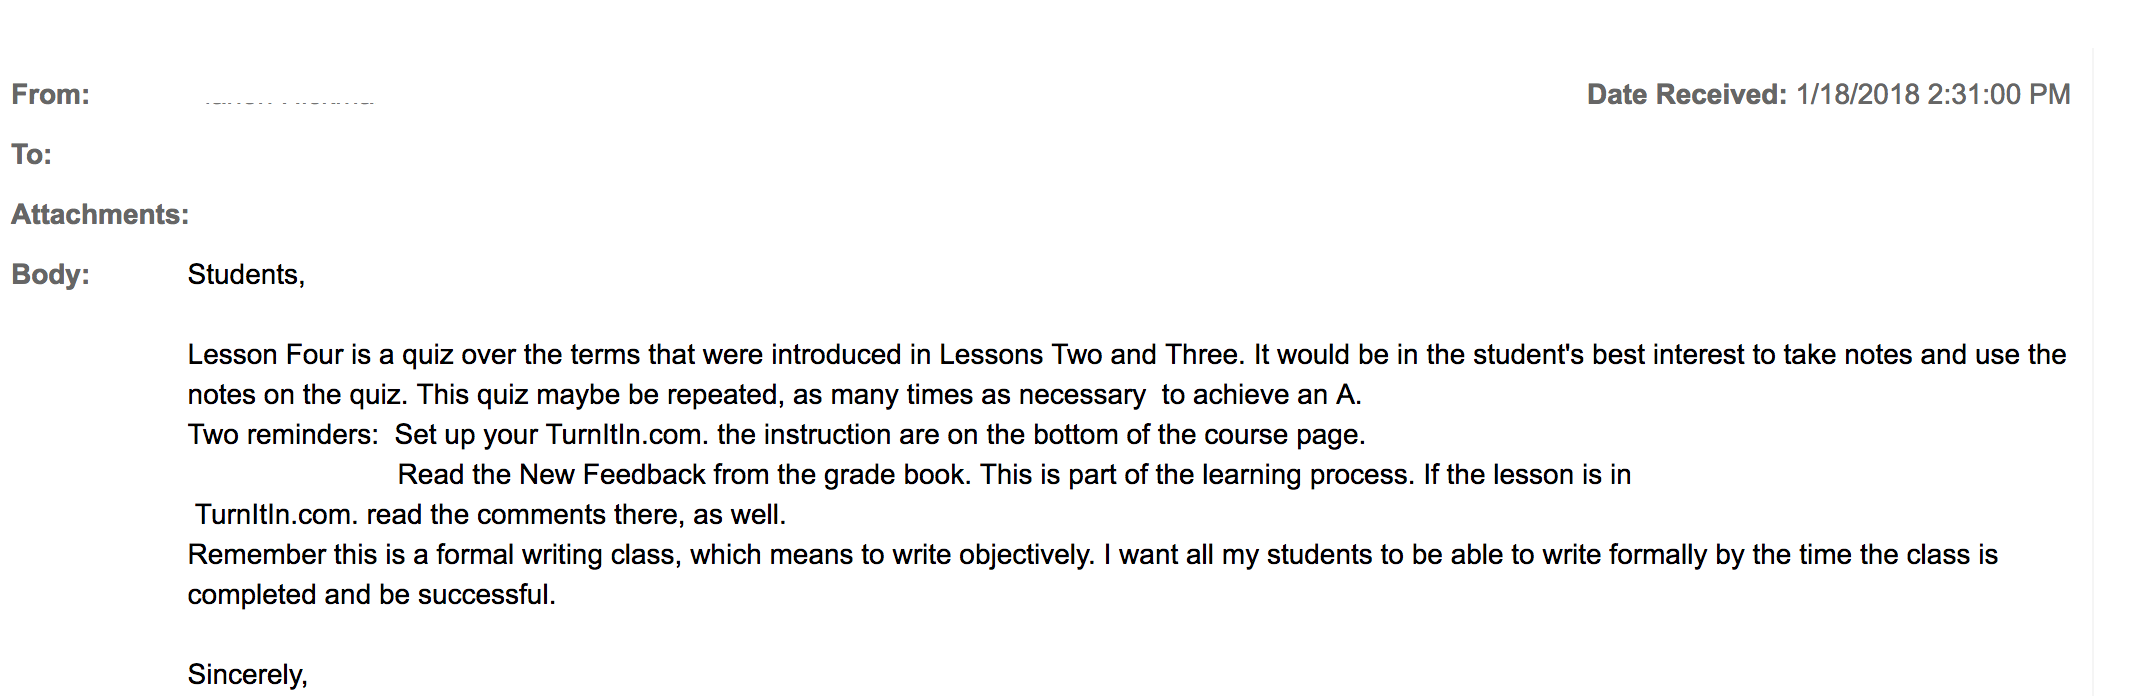
    The instructor sent out several announcements at the beginning of class, a welcome letter, and then one reminder or update message at the beginning of each month. That’s it for instructor-initiated interactions.

    Course announcements

    Sample Message

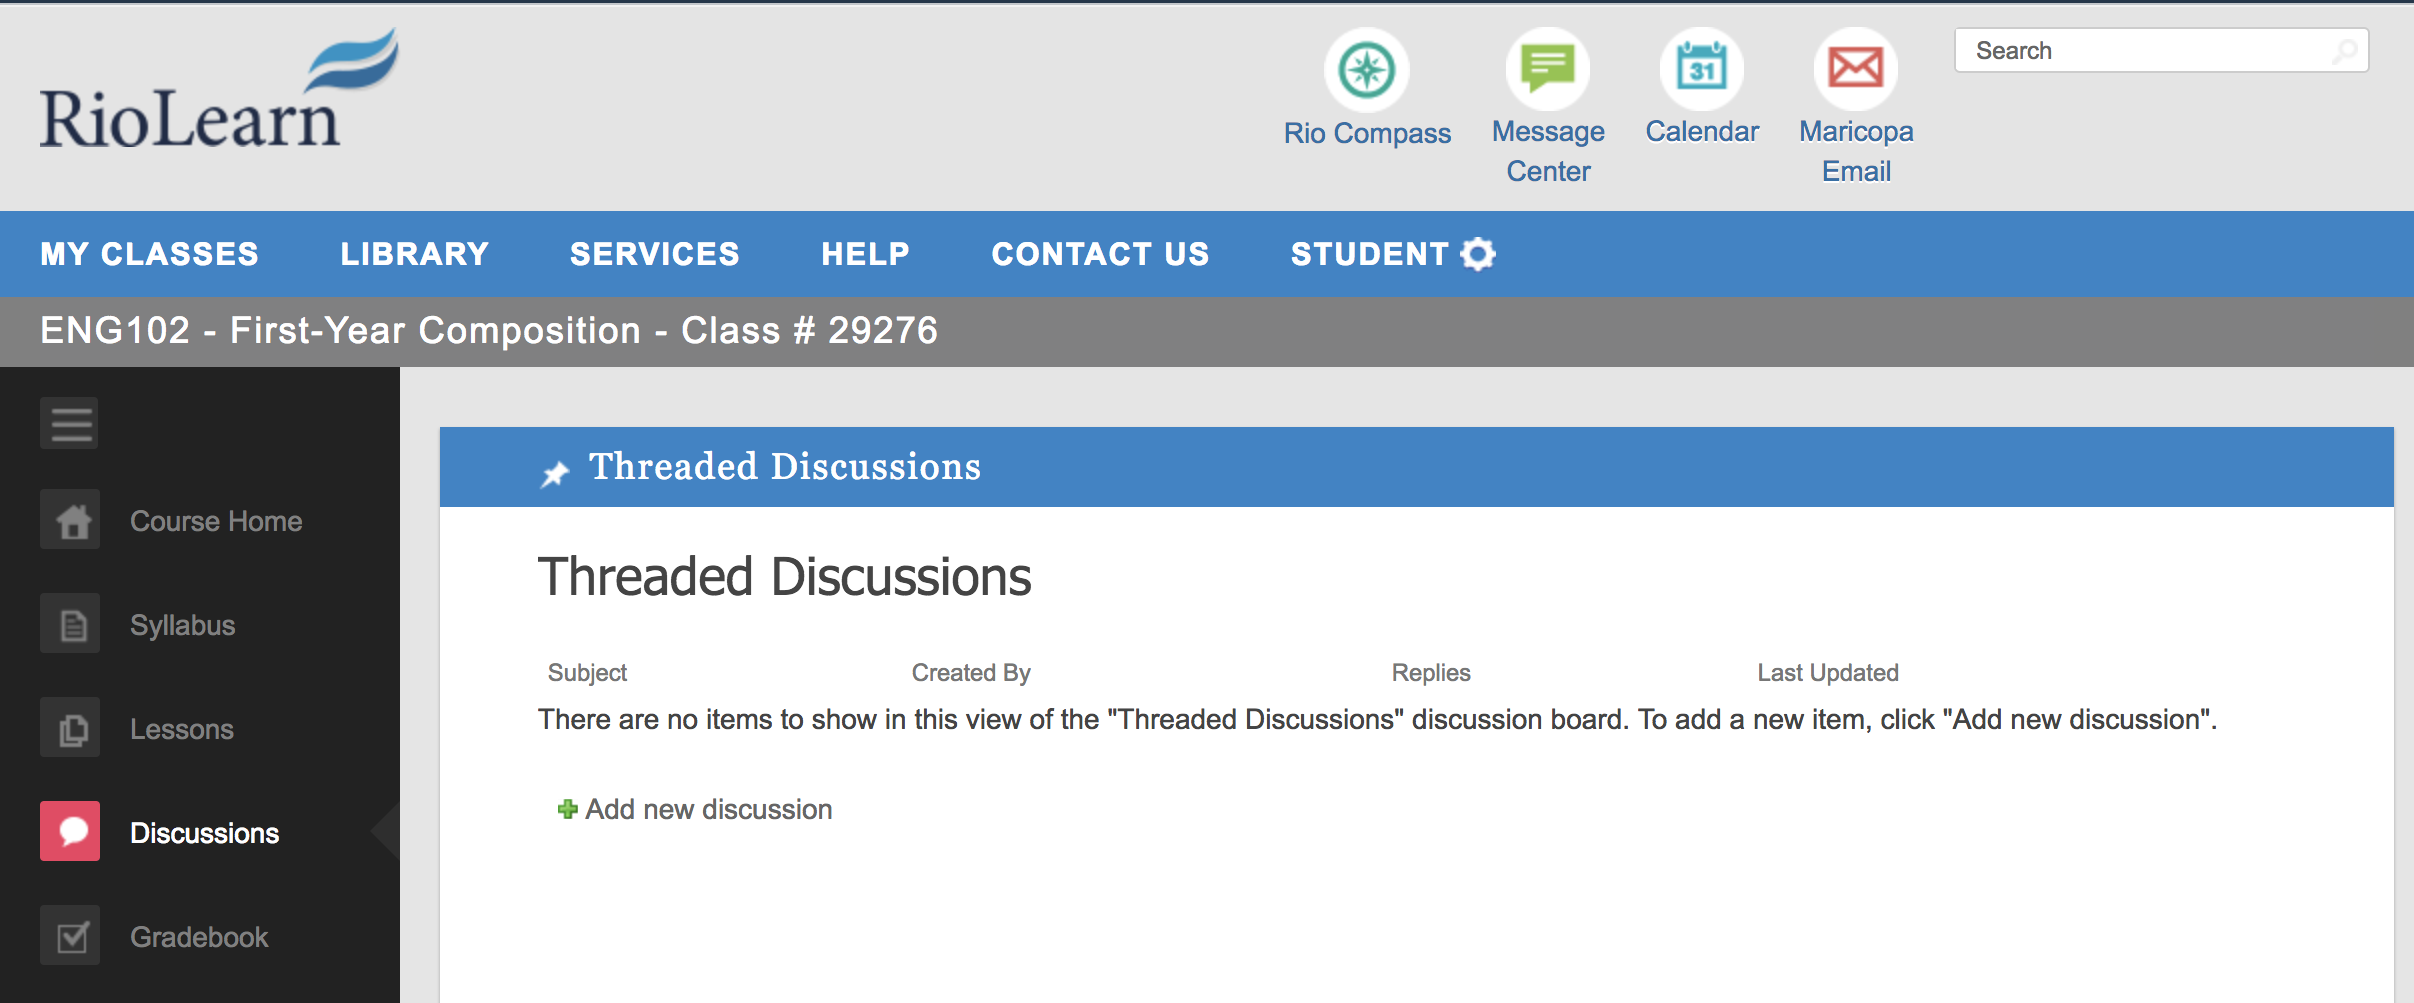
    There were no student-to-student discussions, as the discussion board was unused for the course. There was one peer-review activity, but otherwise no interactions between students. I have been a frequent critic of threaded discussion boards, but it is certainly better to have something instead of nothing.

    Discussion Tool

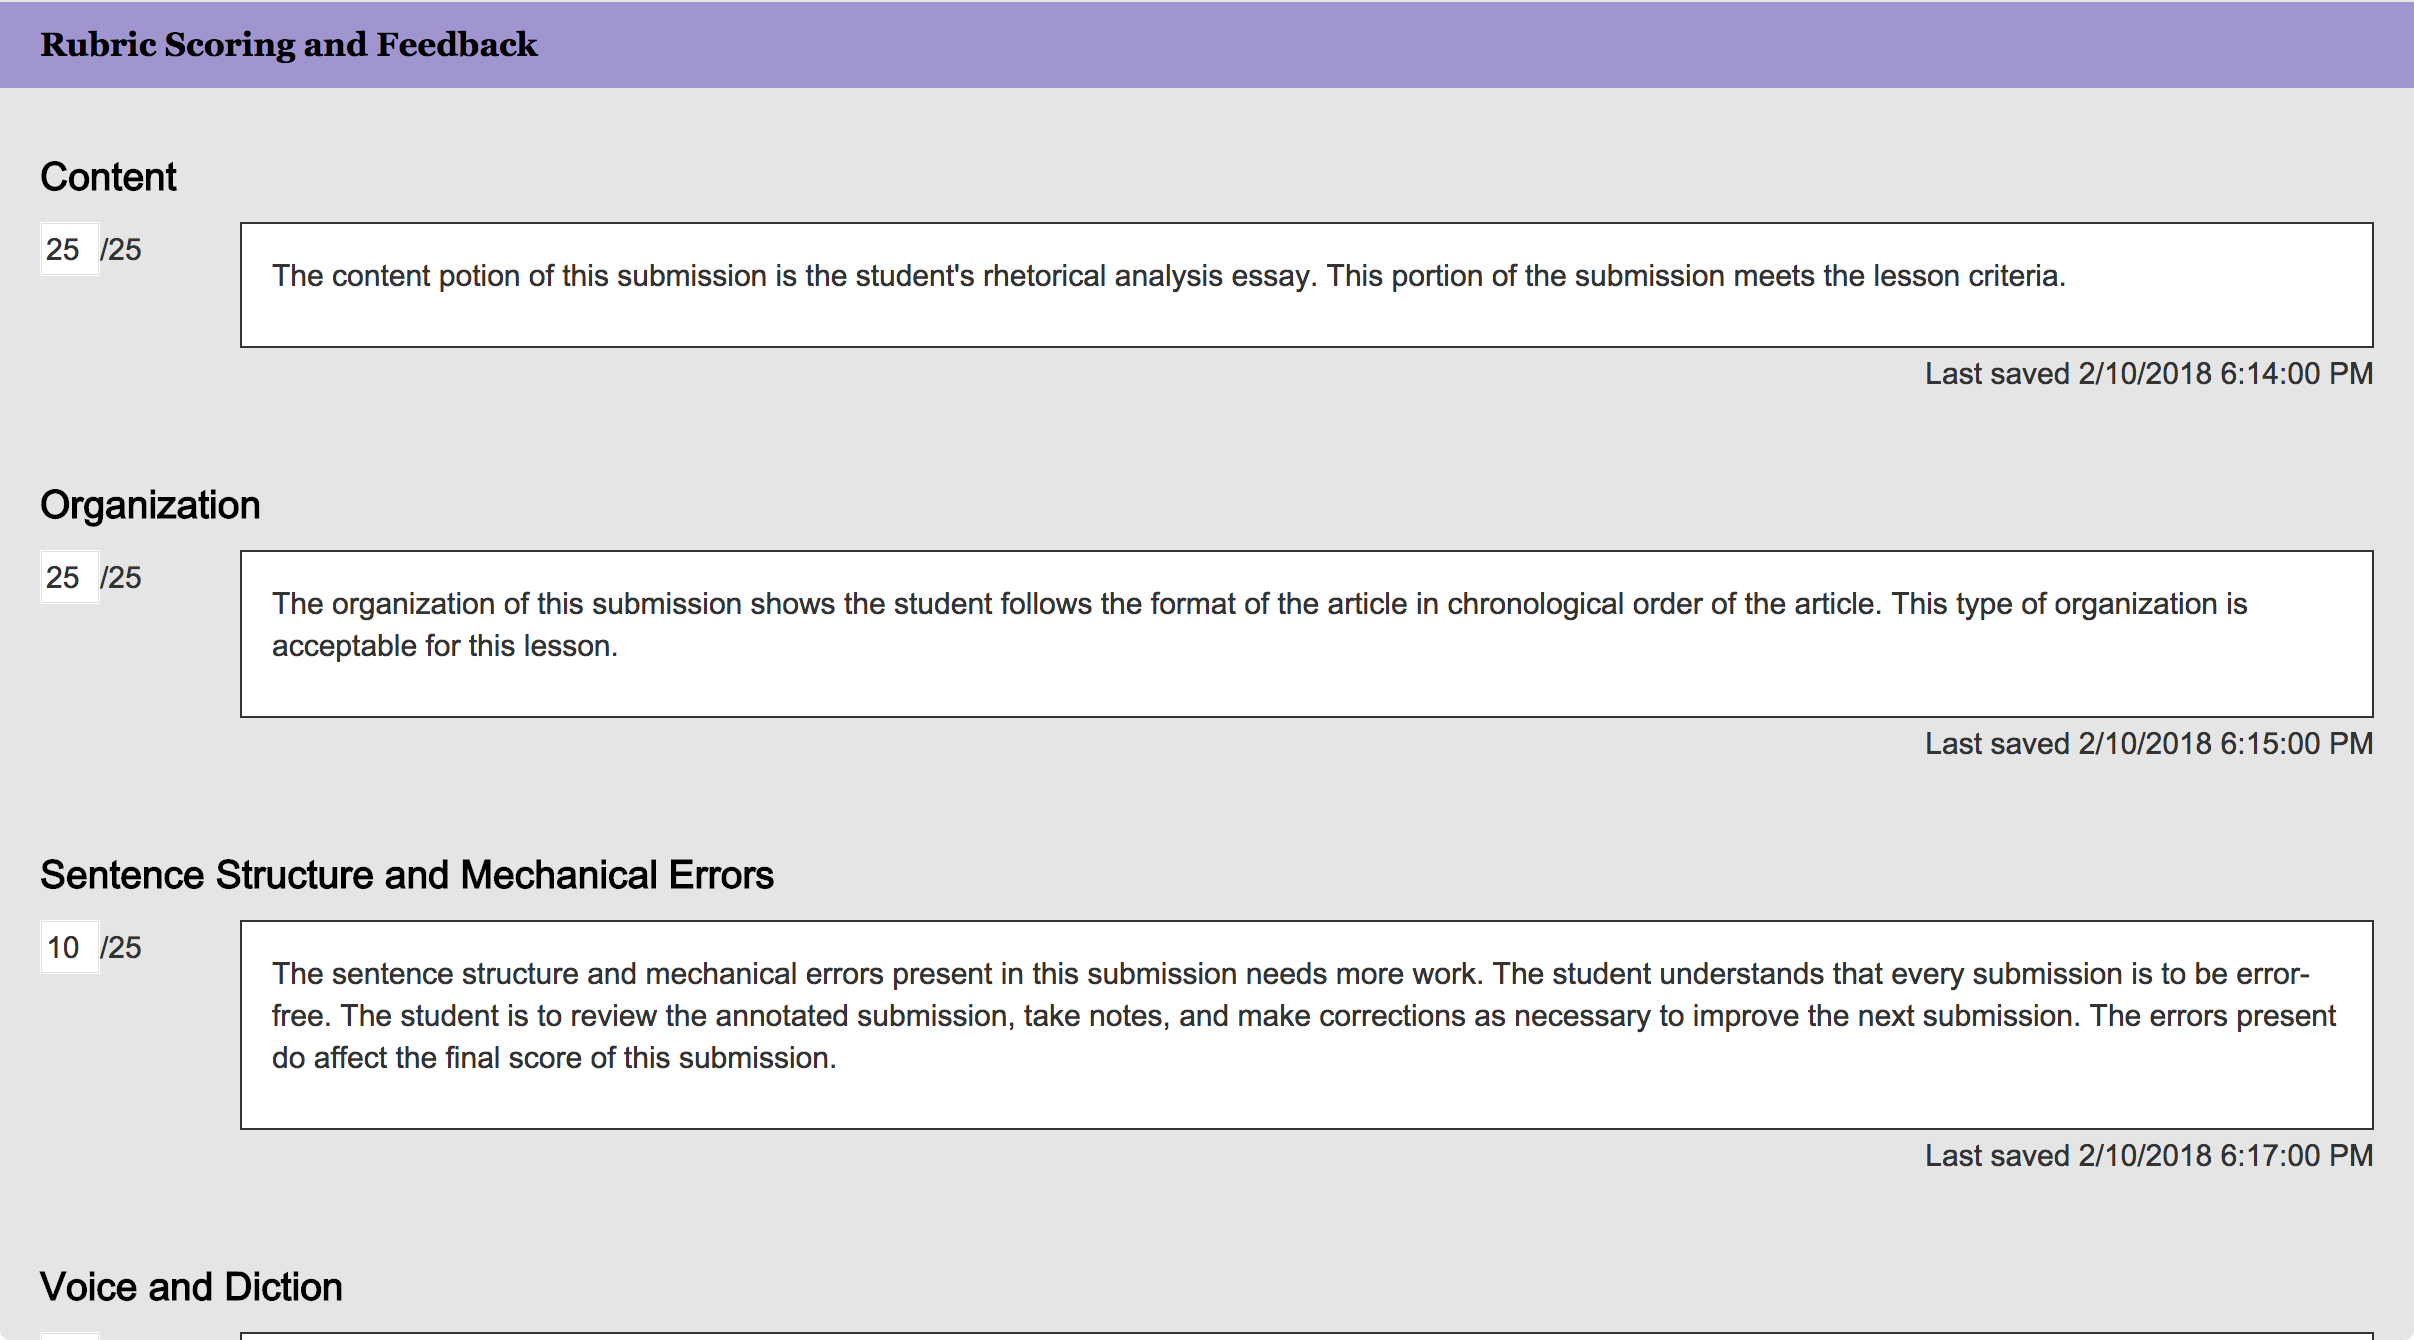
    The rest of the interactions came in two categories: grading of assignments and responses to student-initiated messages. The primary feedback method in these two courses was faculty usage of the custom-developed Feedback Tool, which uses rubrics to grade assignments.

    Lesson Feedback

    There were several assignments that included annotated mark-ups of the submitted papers, which appear to be the most useful feedback from instructors.

    A review of EED200 shows the same course structure – few instructor-initiated interactions, use of rubric grading as feedback on assignments, and specific responses when students send questions in through the Message Center.

    For both courses, the instructors typically responded to student messages within a day or two.

    This approach is troubling, as both courses appear to not meet the “regular and substantive interaction” regulation for credit-bearing online courses. I have been critical about the vague standards and the egregious application by the Department of Education’s Office of Inspector General audit of Western Governors University, but these complaints do not mean that the regulation has no point. The idea is that course design and facilitation should be implemented to ensure that students are not left to figure out static course materials and to be responsible for initiating most forms of interaction. As stated in a 2014 Dear Colleague Letter on the subject of regular and substantive interaction based on competency-based education (CBE) approaches [emphasis added]:

    We do not consider interaction that is wholly optional or initiated primarily by the student to be regular and substantive interaction between students and instructors. Interaction that occurs only upon the request of the student (either electronically or otherwise) would not be considered regular and substantive interaction.

    Some institutions design their CBE programs using a faculty model where no single faculty member is responsible for all aspects of a given course or competency. In these models, different instructors might perform different roles: for example, some working with students to develop and implement an academic action plan, others evaluating assessments and providing substantive feedback (merely grading a test or paper would not be substantive interaction), and still others responding to content questions.

    The problem with case studies is that the selection of cases to study may not be representative or appropriate to prove one’s thesis. It is possible that I happened to look in detail at two courses that are aberrations. But even so, this view is troubling, as these are centrally-developed courses (not subject to the whim of individual instructors), and both courses have little meaningful provisions for faculty-student or student-student interactions. The instructors were responsive to messages, but that is not enough to back up claims of high-quality courses. The dissonance between these two courses and what is described in the ASU / BCG report led me to take a critical look at the data.

    For the next post, I’ll take the external view and look at aggregate public data on Rio Salado College on academic outcomes.