e-Literate

Present is Prologue

Author: Phil Hill

  • Visibility As A Benefit: Ole Miss and UCF share their stories on courseware usage

    Visibility As A Benefit: Ole Miss and UCF share their stories on courseware usage

    In an article Michael and I wrote for EDUCAUSE Review in 2016, we described our view of personalized learning as “a family of teaching practices that are intended to help reach students in the metaphorical back row”. One of the key practices focused on gaining increased visibility into student coursework.

    These same automated homework tools can also give teachers an easy view into how their students are doing and create opportunities to engage with those students. “Analytics” in these tools are roughly analogous to your ability to scan the classroom visually and see, at a glance, who is paying attention, who looks confused, who has a question.

    With the usage of digital courseware to provide the homework tools, this focus on visibility into the learning process can apply across the entire course. What are different schools learning in this area?

    As part of our e-Literate TV series of video case studies, we had a chance this fall to interview several institutions that are focusing on the benefit of increased visibility into student learning by usage of digital courseware based on interviews at the Realizeit users conference. ((This post is not meant to endorse Realizeit’s platform over other companies’ platforms. We are focusing on institutional perspectives and lessons to be learned.))

    In the first episode we explored the challenge of going beyond pilots and deploying systems at scale. In this second episode I interview representatives from the University of Mississippi and the University of Central Florida, asking them to describe their experiences and focus on the issue of increased visibility.

    (source: https://www.youtube.com/watch?v=_FuIQgtvO-k)

    We’ll share one more set of interviews from this conference in the coming weeks.

    This post is part of our e-Literate TV series, which is funded in part by the Bill & Melinda Gates Foundation. The findings and conclusions (or views) contained within are those of the authors and do not necessarily reflect positions or policies of the Bill & Melinda Gates Foundation.

  • An Alternative to the Engineering Model of Personalized Learning

    An Alternative to the Engineering Model of Personalized Learning

    There is an article in EdWeek that quotes Larry Berger, CEO of Amplify, in his “confession” about personalized learning. The focus is on K-12 education but applies directly to higher ed as well.

    Until a few years ago, I was a great believer in what might be called the “engineering” model of personalized learning, which is still what most people mean by personalized learning. The model works as follows:

    You start with a map of all the things that kids need to learn.

    Then you measure the kids so that you can place each kid on the map in just the spot where they know everything behind them, and in front of them is what they should learn next.

    Then you assemble a vast library of learning objects and ask an algorithm to sort through it to find the optimal learning object for each kid at that particular moment.

    Then you make each kid use the learning object.

    Then you measure the kids again. If they have learned what you wanted them to learn, you move them to the next place on the map. If they didn’t learn it, you try something simpler.

    If the map, the assessments, and the library were used by millions of kids, then the algorithms would get smarter and smarter, and make better, more personalized choices about which things to put in front of which kids.

    I spent a decade believing in this model—the map, the measure, and the library, all powered by big data algorithms.

    Here’s the problem: The map doesn’t exist, the measurement is impossible, and we have, collectively, built only 5% of the library. [snip]

    So we need to move beyond this engineering model. Once we do, we find that many more compelling and more realistic frontiers of personalized learning opening up.

    Larry is exactly right that there is a fundamental problem with the assumptions behind what he calls the engineering model of personalized learning. But there are alternate models that offer “more compelling and more realistic frontiers”. We have described this contrast in models at e-Literate, most directly in Michael’s post The Battle for “Personalized Learning”.

    Phil and I have decided to claim this prime piece of linguistic real estate. We are asserting squatters’ rights.

    We hereby decree, by the power vested in us by nobody at all, that “personalized learning” shall henceforth refer to a family of teaching practices that are intended to help reach students in the metaphorical back row. The ones who are bored, or confused, or tuned out, or feeling stupid. Personalized learning practices are almost always ones that teachers have been using for a very long time but that digital tools can support or enhance. Here are a few that we have identified so far:

    Move content broadcast out of the classroom: In many disciplines, the ideal teaching format is a seminar, in which students spend class time engaged in conversation with a professor. In others, it is a lab. Both models have students actively engaged in academic practice during class time, when the professor, as the expert practitioner, is present to coach them. Every class spent lecturing is a wasted coaching opportunity.

    Many disciplines have traditionally used assigned readings to move content broadcast out of the classroom, and some still do. But it is not always possible to find readings that capture what you want to cover, and in any case, it is becoming harder to persuade students to read. Luckily, there are tools that can help with this problem. You can record and post your lectures as videos, which students can watch as many times as they need to absorb what you’re trying to tell them. You can assign podcasts that they can listen to on the go, or find interactive content that keeps them more engaged.

    Make homework time contact time: Good teachers help students see the direct connection between the work they do at home and the overall purpose of the class. They do this in a variety of ways. Sometimes they mark up and comment on the student work. Sometimes they ask the students questions in class that require them to build on the work they did at home. For a variety of reasons, which often boil down to professors’ having less available time per student, this has become harder to do. The great crutch that is now being used to limp along without actually solving this problem is robo-graded homework assignments. By itself, automated practice might help some students drag themselves through to the end of the semester. But it doesn’t often inspire them to think that maybe they are not destined to be the student in the back row forever. (There are important exceptions to this rule, which I address below.)

    On the other hand, these same automated homework tools can also give teachers an easy view into how their students are doing and create opportunities to engage with those students. “Analytics” in these tools are roughly analogous to your ability to scan the classroom visually and see, at a glance, who is paying attention, who looks confused, who has a question. Nor are these the only tools available for making homework time feel less isolated and pointless. Any homework activity that is done electronically can be socially connected. Group work done on a discussion board can be read over by the professor when she has time. Highlights and margin notes on readings can be shared and discussed in class. This sort of effort on the professor’s part doesn’t have to be exhaustive (or exhausting). Sometimes a small gesture to show a student that you see her is all it takes.

    Hire a tutor: You know what tutors are typically good for in your particular discipline. You also know that there generally aren’t enough good ones available, and that even when there are, it’s tough to get students to come into the tutoring center. One of the best uses of machine-graded homework systems, especially when they are “adaptive,” is to treat them as personal tutors that are available to students whenever they need them and wherever they are. They aren’t perfect, but what tutors are? Sometimes getting students out of the back row means helping them to believe that they are capable of learning. And sometimes students are willing to pose a question to a computer that they would be embarrassed to ask in person. In those cases, a little extra practice and feedback on the basics, without judgment, can make all the difference — even if the feedback comes from a machine. And if adaptive learning robo-tutors don’t fit the needs of your students and your discipline, technology also makes it possible to connect students with actual human tutors, who are available online to help them get through the rough spots.

    We wrote more extensively about this description of personalized learning at EDUCAUSE Review in 2016 at “Personalized Learning: What It Really Is and Why It Really Matters”.

    There is a battle for personalized learning, and the description of the engineering model is useful for understanding one approach (unfortunately the one most often used in marketing and by ed reformers). But there is an alternative and it is more compelling.

  • Hawai’i Senate OER Bill Update: Amended language saves the day

    Hawai’i Senate OER Bill Update: Amended language saves the day

    On Friday I reported about SB2328, a bill that passed (with amendments) the Hawai’i Senate Committee on Higher Education and would have mandated open educational resources (OER) for all courses at all 10 University of Hawai’i campuses. And if there were no adequate OER materials for a course? “. . . the faculty member or lecturer responsible with providing instruction for the course shall create the instructional materials and offer those materials free of charge to students through open educational resources.”

    This bill was a disaster in the making. Not only would it have been unworkable in terms of funding and intellectual property ownership, it would also have set back the OER movement by associating OER with unfunded faculty mandates and reduction of academic freedom. All this from good intentions but apparently shallow understanding.

    As mentioned in an update to Friday’s posts, the amendments that resulted from committee hearings removed the mandates. We now have the amended language, and it is a completely different bill.

    Updated language:

    The purpose of this Act is to:

    (1) Establish the University of Hawai‘i open educational resources task force to conduct a comprehensive analysis and evaluation on all general education courses and high attendance courses taught at the University of Hawai‘i system to identify open educational resources for those courses;

    (2) Establish and appropriate funds for an open educational resources pilot project grant program to incentivize faculty that adopt, develop, and implement open educational resources; and

    (3) Require the University of Hawai‘i open educational resources task force to report its findings and recommendation initiatives for supporting and expanding the use of open educational resources at the University of Hawai‘i to the Legislature prior to the Regular Session of 2019.

    During the hearings there were several dozen testimonies shared, and all but two opposed the bill (and one of those two changed positions to oppose). Leading the opposition was the University of Hawai’i Professional Assembly, the local faculty union.

    In short, the bill amendments removed mandates, creates a task force charged with a one-year evaluation of high-enrollment and general ed courses, and creates a $50,000 grant fund to incentivize faculty adoption.

    It is not clear whether the bill will make it through remaining hurdles to become state law, but if it does, we will have a fairly significant move in the state dealing with the costs of curricular materials and OER adoption.

    Billy Meinke, OER Technologist and UH Manoa and a key player within the system (let’s call him Kane OER), was unaware of SB2328 before it came out. This gets to the heart of the problem – the original bill appears to have been written without any input from the people already working on OER adoption within the University of Hawai’i.

    I still have a problem with the preamble of the bill that uses the misleading claim that the “average cost for books and supplies for the same academic year at public colleges averaged $1,250.” Students actually pay about half this amount, and this false setup will lead to erroneous estimates of how much any such bill could save for its students. But for now, crisis averted.

  • Hawai’i Senate Bill: Would mandate OER material for all U Hawai’i system courses

    Hawai’i Senate Bill: Would mandate OER material for all U Hawai’i system courses

    Thanks for update from Brent Auernheimer, I found out that the Hawai’i Senate Committee on Higher Education recently debated a bill regarding Open Educational Resources (OER) usage at the University of Hawai’i system of 10 campuses. Introduced on January 19th, SB2328 states:

    Beginning with the 2020-2021 school year, all courses at all campuses within the University of Hawai‘i system that require the use of instructional materials, including textbooks, shall use instructional materials from the open educational resources at the University of Hawai‘i; provided that the use of instructional materials, including textbooks, that requires a student to purchase or pay a subscription for the materials shall be prohibited; provided further that if open educational resources does not have relevant instructional materials available for a course, the faculty member or lecturer responsible with providing instruction for the course shall create the instructional materials and offer those materials free of charge to students through open educational resources.

    Read that carefully – OER for all courses, no commercial services around OER allowed, and if appropriate OER does not exist, the faculty member must create the material themselves, all mandated from the state legislature.

    When I first saw this news, I assumed it was a either a misguided effort that would quietly be killed in committee or a political statement. Predictably, and appropriately, the University of Hawai’i Professional Assembly actively opposed this bill, calling it “legislative overreach” and “infringement on academic judgement”, while also calling out the costs and support needed for faculty to create such materials.

    On January 30 hearings, the vast majority of testimony – much of it from faculty members – opposed the measure with only two statements supporting. Yet on February 6, the Senate Committee unanimously passed the bill on to the full Senate.

    The committee(s) on HRE recommend(s) that the measure be PASSED, WITH AMENDMENTS. The votes in HRE were as follows: 5 Aye(s): Senator(s) K. Kahele, Kim, S. Chang, Keith-Agaran, Kidani; Aye(s) with reservations: none ; 0 No(es): none; and 0 Excused: none.

    I have not been able to determine what the amendments are for the bill (or if that refers to future amendments coming from floor debate), and I also do not know how likely it is to pass the full senate or to become state law. I’ll keep looking for more information.

    Unless I’m missing something, this could be a jump-the-shark moment for portions of the OER movement. Comments appreciated.

    Update: From Twitter stream (sounds like some good changes):

    https://twitter.com/billymeinke/status/962127447171907584

  • Digital Courseware at Scale: APUS and Bay Path University share their stories

    Digital Courseware at Scale: APUS and Bay Path University share their stories

    Several years ago I wrote a post titled “Pilots: Too many ed tech innovations stuck in purgatory”, where I used Everett Rogers’ Diffusion of Innovations framework to explore why we have plenty of pilots but not very many large-scale adoptions of ed tech innovations.

    What we are seeing in ed tech in most cases, I would argue, is that for institutions the new ideas (applications, products, services) are stuck the Persuasion stage. There is knowledge and application amongst some early adopters in small-scale pilots, but majority of faculty members either have no knowledge of the pilot or are not persuaded that the idea is to their advantage, and there is little support or structure to get the organization at large (i.e. the majority of faculty for a traditional institution, or perhaps for central academic technology organization) to make a considered decision. It’s important to note that in many cases, the innovation should not be spread to the majority, either due to being a poor solution or even due to organizational dynamics based on how the innovation is introduced.

    This stuck process ends up as an ed tech purgatory – with promises and potential of the heaven of full institutional adoption with meaningful results to follow, but also with the peril of either never getting out of purgatory or outright rejection over time.

    Accordingly, we have more information about institutions with quite a few pilots around digital courseware, but there is not much information about colleges or universities implementing at scale. What are the problems to be solved for large-scale adoption, and what lessons can be learned (both positive and negative)?

    As part of our e-Literate TV series of video case studies, we had a chance this fall to interview several institutions that are dealing with this challenge – deploying courseware at scale – based on interviews at the Realizeit users conference. ((This post is not meant to endorse Realizeit’s platform over other companies’ platforms. We are focusing on institutional perspectives and lessons to be learned.)) In a future episode we’ll describe more directly what Realizeit’s platform is and is not, but to start, let’s get a sense of the institutional perspective.

    In this first episode I interview representatives from American Public University System (APUS) and Bay Path University, asking them to describe their programs. APUS has redesigned more than 1,600 courses based on active learning, as well as new competency-based programs, and Bay Path is applying courseware broadly across the entire institution.

    (Video source: https://youtu.be/hUySDzoz_gE)

    We’ll share additional interviews from this conference in the coming weeks.

    This post is part of our e-Literate TV series, which is funded in part by the Bill & Melinda Gates Foundation. The findings and conclusions (or views) contained within are those of the authors and do not necessarily reflect positions or policies of the Bill & Melinda Gates Foundation.

  • Preliminary Data on K-12 LMS Market

    Preliminary Data on K-12 LMS Market

    Over the past several months, we have worked with our partners at LISTedTECH as they ramp up their efforts to collect data on LMS usage in the K-12 market in the United States. This is a massive effort as the market includes more than 130,000 individual public and private schools, and more than 13,600 school districts, according to recent NCES documentation. We are aware of several private data sources with estimates on the K-12 LMS market, but there are no public sources.

    Part of the challenge is that the K-12 market is messier than higher education’s and its roughly 7,200 institutions. One reason is that the general IT infrastructure in K-12 is less mature than in higher ed, and for smaller schools there are a lot of ad hoc implementations running on a local server not even in a data center. Another reason is the availability of free options such as Google Classroom, or freemium options such as that offered by Schoology and Canvas for individual faculty.

    As we build up the data and improve our methods, we believe we are starting to see some interesting trends in the data worth sharing.

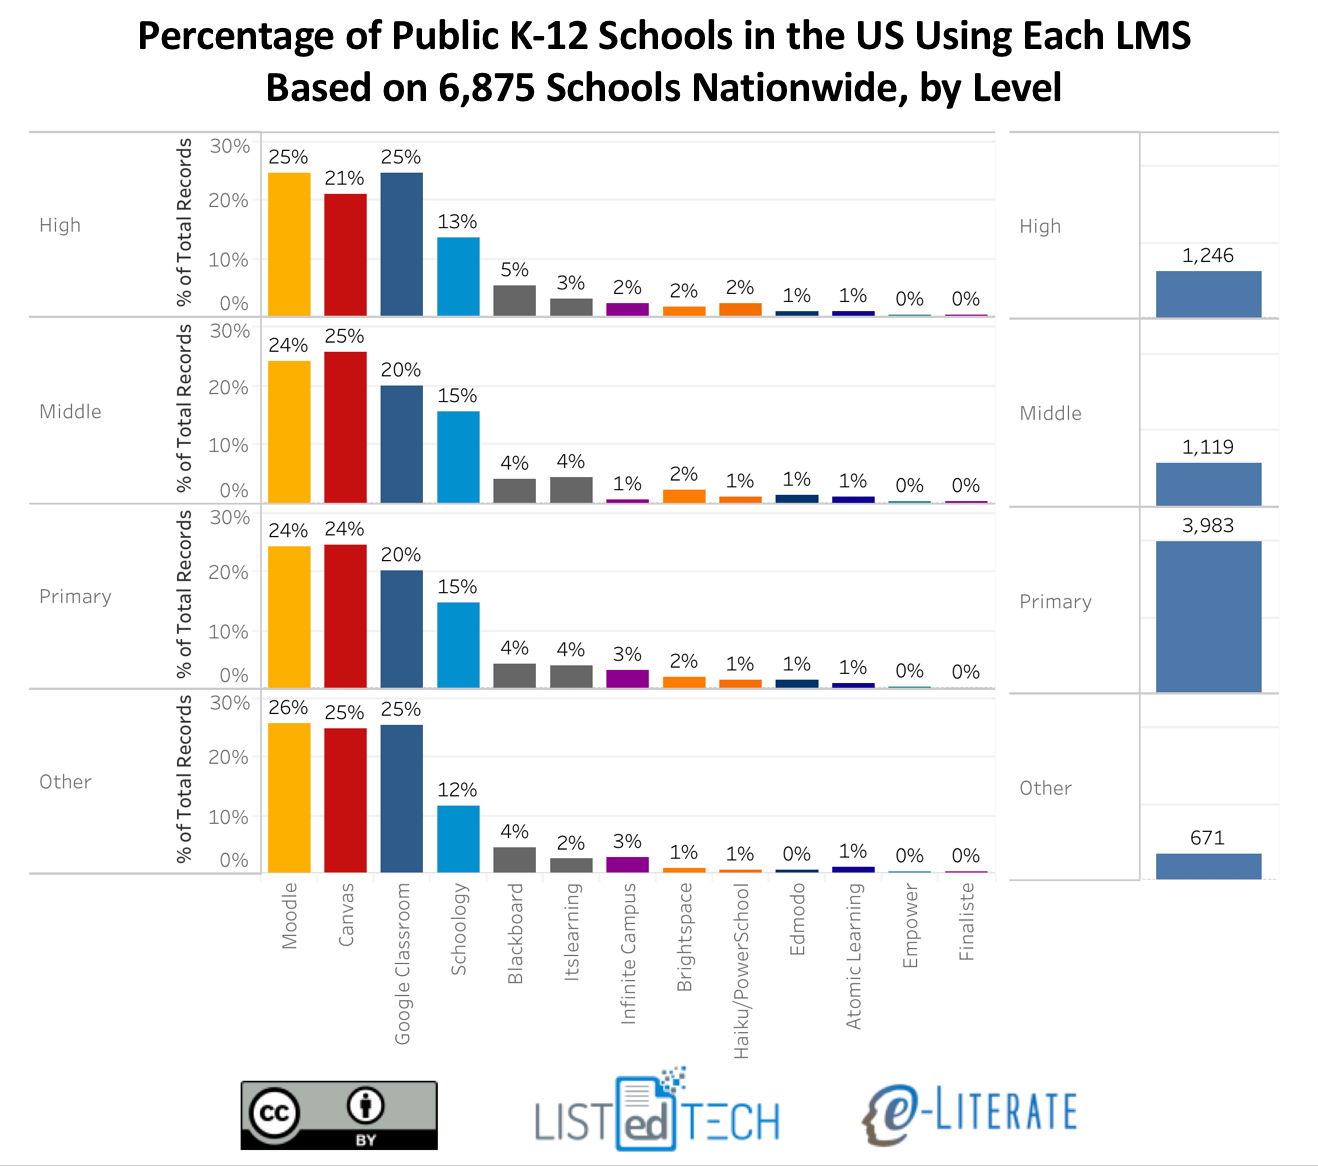
    Our initial sample looks at 6,875 public schools from across the country in the NCES-designated primary, middle, high and other (special ed, vocational or alternative) categories. These results were analyzed over several data collection methods along with manual evaluation of that data. That said, we expect to see movement in the numbers as we collect and verify additional data, including LMS usage at private schools.

    As in our analysis of the higher ed market, we are focusing on school-wide implementations of LMS platforms. At many K-12 schools, in the absence of a school-wide implementation, individual teachers opt to use an LMS for their particular classroom, often for free. We do not consider this case a school-wide adoption and therefore do not include those use cases in our data. This methodology does not fully analyze total usage of a platform like Schoology that has a freemium model, including a free option for individual teachers and an enterprise solution which is a school-wide adoption based on a fee per student model. A platform like Google Classroom likewise has usage by individual teachers as well as school-wide implementations.

    Before we share the preliminary data, some caveats are in order to hopefully avoid anyone misrepresenting this information:

    • This is preliminary data that will likely change as we learn more. While we believe there are some broad trends already emerging, there will be refinements as we increase our coverage over time. We expect the changes to be in small adjustments to specific numbers but not in big changes to market shape.
    • This view is based on number of schools that have implemented an LMS, which is a different metric than district-wide implementations (where many or most of the purchasing decisions occur) or implementations scaled by student enrollments. We will add these views in the future.
    • This view is based on installed base (which represents total estimated deployments), which is different than new implementations in a given time period (which would measure market momentum). Again, we will add these views over time, just as we have done for the higher ed LMS market.
    • Due in particular to the free options available in K-12, there will be schools that have more than one LMS available at the institutional level. Google Classroom in particular is often available as an option at a school even when there is another LMS.
    • As is our practice at e-Literate, we’ll describe the caveats and present the data as is. As we learn more, if the relative percentages change significantly, we will share updates.
    • For more information on our data methods, see this post.

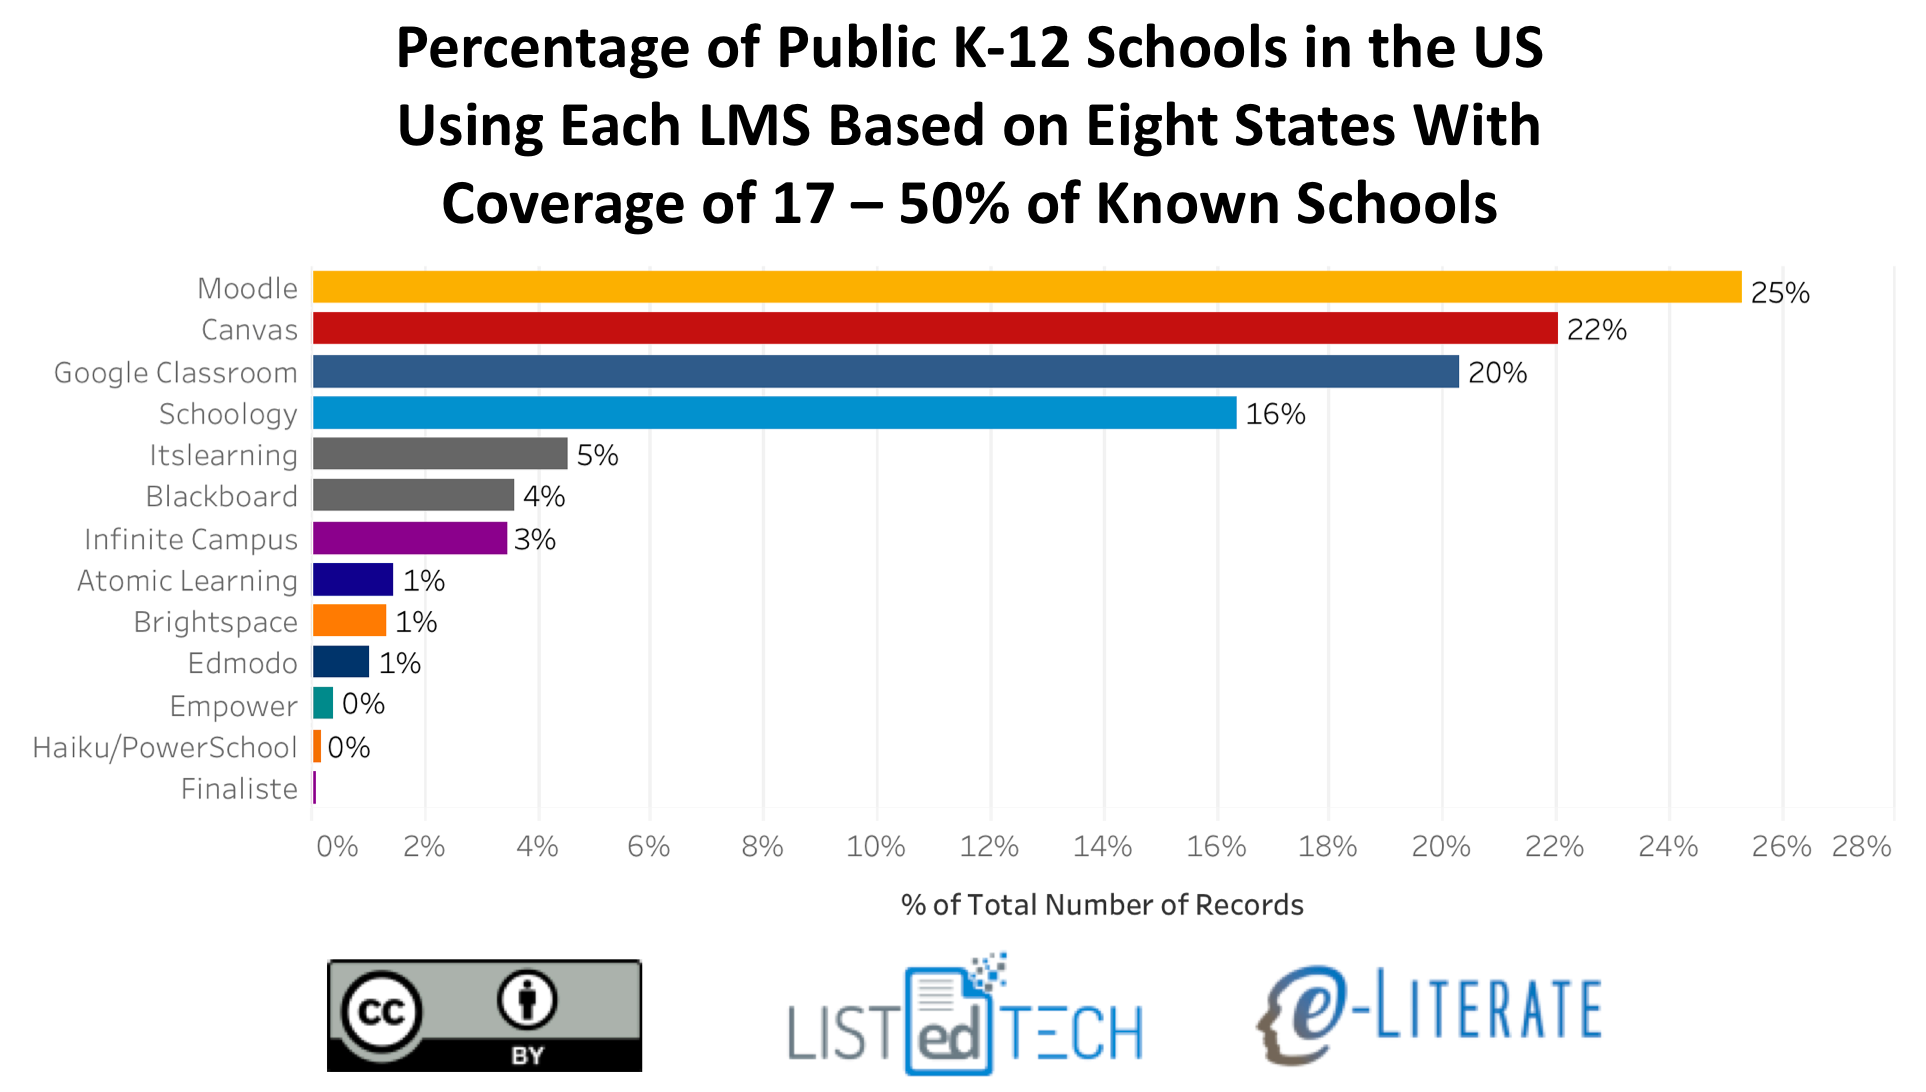
    The first graph presents a view of K-12 school-wide LMS implementations in the United States for the 8 states (and DC) where we have at least 17% coverage of known schools (Alaska, Delaware, District of Columbia, Florida, Massachusetts, Minnesota, Texas, Wisconsin).
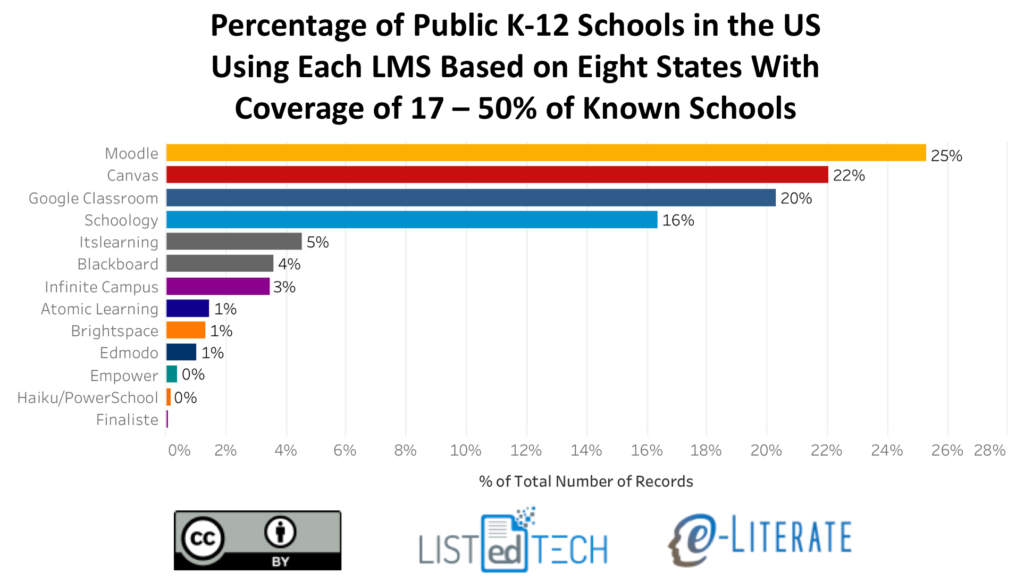
    LMS Market Share for K-12 in US, 8 States

    To get a sense of how representative this initial market share is, we made the same calculations across all 6,875 schools from 50 states and DC that in our data thus far. The data for each LMS matched within ~2% for each LMS (e.g. Canvas went from 22% to 24%, Moodle went from 25% to 24%) between the two views.

    As in the higher education market, there appears to be four top contenders in K-12 – Moodle, Canvas, Google Classroom, and Schoology – with all others having 5% or less of market share. Moodle and Canvas are both present in the Big Four for both higher education and K-12, but in K-12 Google Classroom and Schoology are the other big players. We believe that this is the first data set showing just how widely Google Classroom has been adopted. ((Disclosure: Instructure, Schoology, Blackboard, and D2L are subscribers to our LMS Market Analysis service; Instructure and Blackboard also are sponsors for an upcoming event we are organizing.))

    The general distribution is somewhat consistent across school levels – primary, middle, high school, and others – with some interesting smaller variations. The following view also gives a sense of our relative data coverage by level. In this case we are using all our data across the 6,875 schools. Note that totals are higher than this number due to multiple systems being available at some schools.
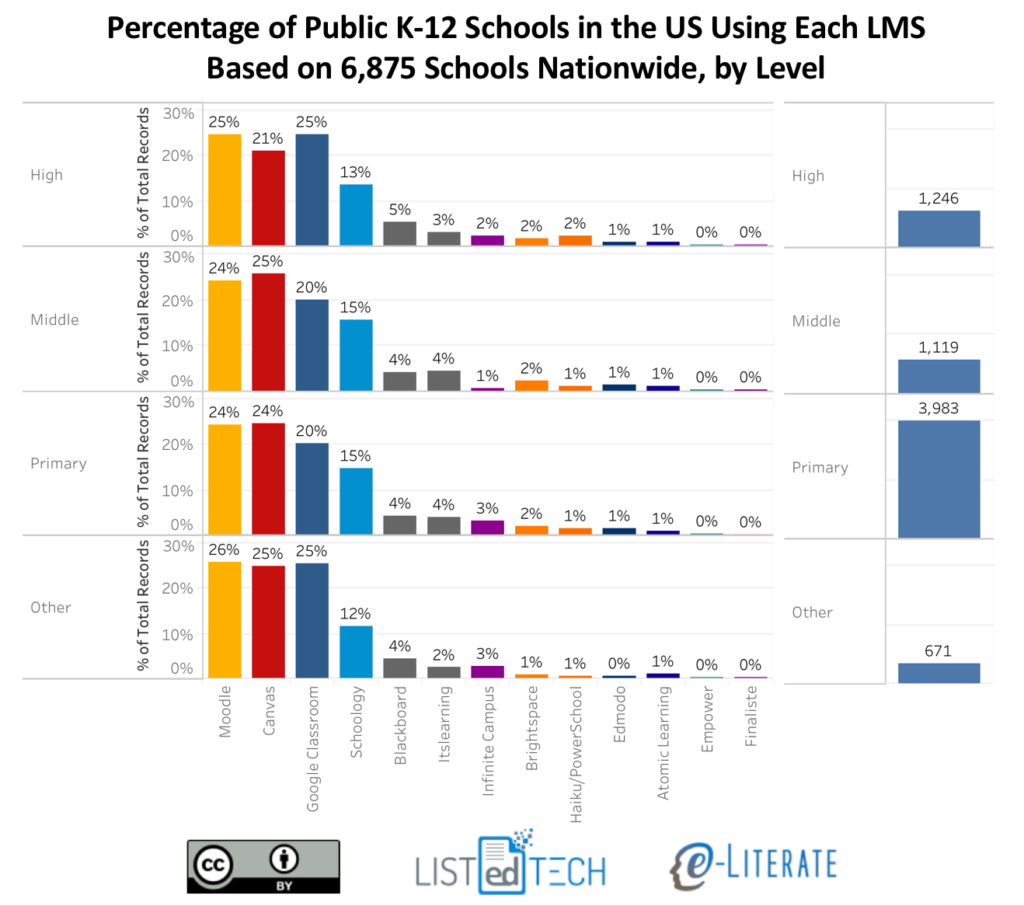
    LMS Market Share for US K-12, By Level

    We hope this new data provides a broader view of the academic LMS market. We’d love to hear your feedback and questions.

  • Postscript on College Rankings Revisited: Description of methods

    Postscript on College Rankings Revisited: Description of methods

    There has been a lot of interest in Tuesday’s guest post by Steve Lattanzio from MetaMetrics on an alternate approach to college rankings that relies on algorithmic analysis of thousands of variables from the College Scorecard instead of typical cherry-picking of variables and subjective analysis. There have been some good questions posted on social media and blog comments asking for more information on the algorithms or assumptions behind the algorithms.

    While we linked to a corresponding article with more results and more detail on the methodology, we should have made that link more obvious. That article gives a much deeper description of the assumptions and methods used, including references to assumptions behind the theory and underpinnings of the approach. We have updated the Tuesday post with a direct link and include links in this postscript.

    The article “A New School of Thought for Our Thoughts on Schools” describes the challenge:

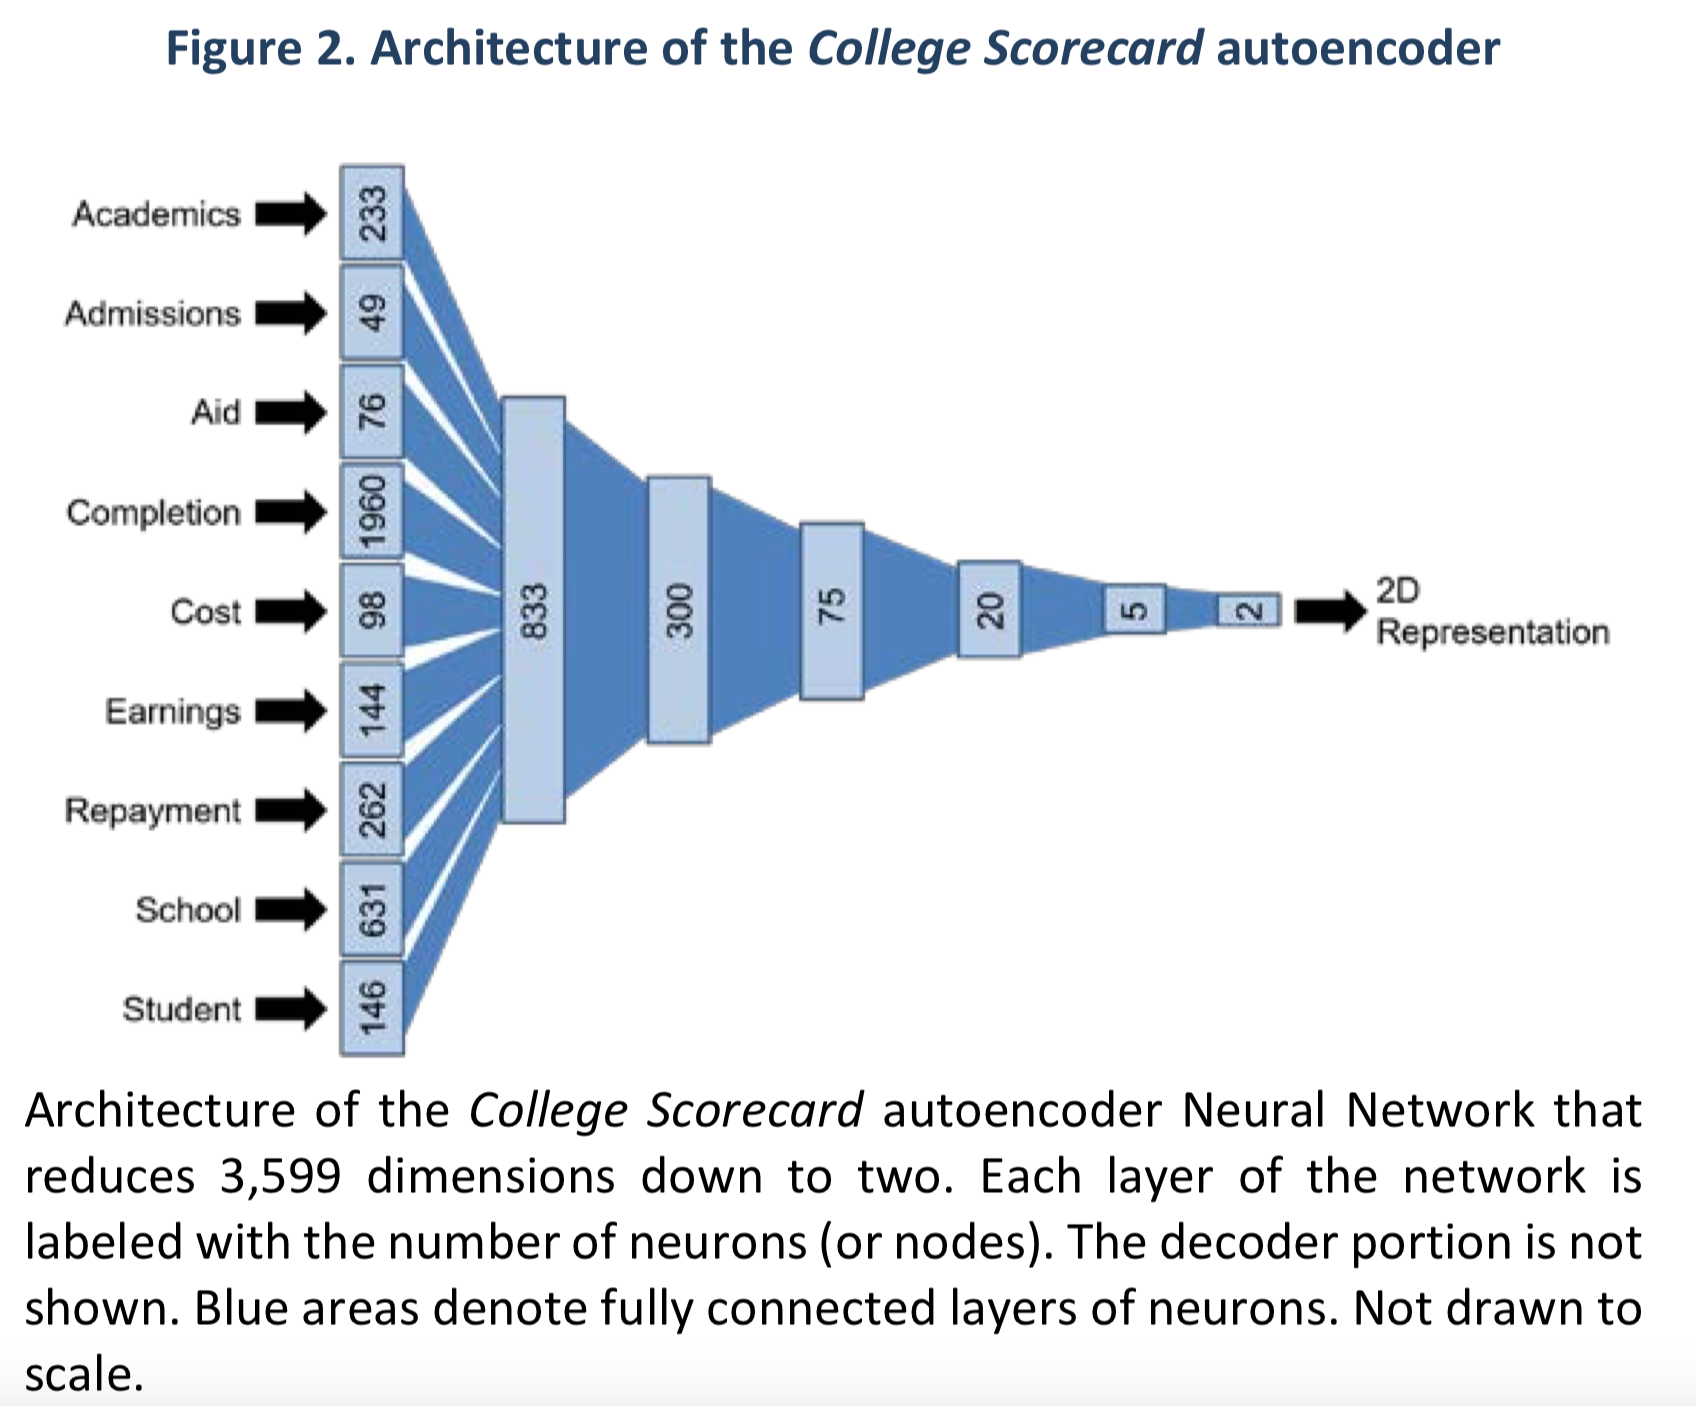
    The solution that we propose is to use neural networks to perform representational learning on the data. In other words, instead of manually going through the dataset and engineering a handful of features, we propose to use neural networks to automatically encode (autoencode) the information, including information about where data are missing, in a smaller dimensional space. Similar to principal components analysis (PCA), auto-encoding via neural networks is a dimension-reducing technique, but is more apt at handling variables that are nonlinearly related. In fact, it could be thought of as a more generalized version of PCA. Of course, such compression is lossy, but much of the information lost will be uninteresting noise and redundancies.

    The approach breaks up the 3,599 variables into a discrete number of categories, which then goes through successive layers of the neural network to generate a 2D representation.

    I won’t pretend to answer all questions by this summary, but instead I want to point out the source for describing this additional detail.

    Through all of this discussion, I want to remind readers that Steve in the original post was quite deliberate about what is not being claimed by this research.

    Out of an abundance of concern that the results of this experiment would be misrepresented, we’ll immediately point out that we make no claim that the rankings in this piece are the proper method for ranking these institutions, and we caution anyone from thinking of them as such.

    The real goal is further described in the New School article’s concluding paragraph:

    The methodology described in this paper and the pedagogical use-cases provide a rich framework for advanced analytics of post-secondary education—something that the consequence of the industry and the unwieldiness of the data demands. It is our hope that a future proliferation of similar work will promote further transparency in the post-secondary school market, more holistic approaches to data use, and ultimately more complete, fairer, and objective metrics that empower students to make the best decisions.