
e-Literate

Present is Prologue

Category: Academics & Academia

The “Academics and Academia” category covers topics related the ways in which colleges and universities function that are relevant to technology-supported education. One key aspect covered here is pedagogy—how people teach—and how technology impacts teaching and learning.

But this category also includes more institutional aspects that are relevant to technology-supported education, such as how campus leadership supports (or doesn’t support) new initiatives, politics and bureaucracy that impact these efforts, and so on.

Finally, “Academics and Academia” covers commercial and non-profit services that provide support for technology-supported education initiatives, such as Online Program Management (OPM) companies.


  • Content as an Instrument of Inquiry

    If you’re not writing clearly, then you’re not thinking clearly.

    Mrs. Galligani (My high school English teacher)

    In response to the posts so far in the series, John P. Mayer, Executive Director of the Center for Computer-Assisted Legal Instruction (CALI) tweeted,

    “This article mirrors what @caliorg Lessons are about – and have been for almost 40 years.”

    In the first post of the series, I explained the basic logic of the content design pattern to which John is referring:

    1. Start by articulating what you are trying to help students to learn as clearly as you can.
    2. Then figure out how you are going to be able to tell (or “assess”) whether the students students have, in fact, learned what you are trying to help them learn. Again, be as clear and explicit as you can in this.
    3. After you have taken the first two steps, then design learning activities—reading, watching, discussing, experimenting, and so on—that you believe will help the students to learn what you are trying to help them learn.
    4. As you design these activities and the content that makes it possible (e.g., readings for the reading activity), be sure to embed little low-stakes exercises throughout so that you and the students can track their progress toward learning whatever it is that you are trying to help them to learn. And, if necessary, to adjust the teaching or learning strategies.

    It’s not exactly rocket science.

    In the second post, I showed that we could derive pedagogical benefit when we formalize this content design pattern in digital curricular materials. If every bit of content and every assessment item is labeled with a particular learning objective (or learning goal), then we can track various kinds of student progress toward that learning objective. Have they started any activities related to that learning objective yet? Have they finished them? How well are they scoring on the assessment measures for that particular learning goal? How are they progressing through the stack of learning objectives that make up a larger curricular unit? Are any students stuck on one particular goal? Is the whole class stuck? We can get clearer answers to these questions, for ourselves and for our students by creating well-crafted curricular materials in the design pattern that I described above and creating very simple software capabilities for showing how students are performing on the assessments. Call this much “analytics” is a stretch. Statistical algorithms are optional and often superfluous to get us this far. We’re really just colating and visualizing the student activities and assessment results in ways that the content design enables us to do. In tech speak, we would call these “dashboards” and “visualizations” for the “data.” But your paper grade book (if you still use one) is a dashboard for the same data in a somewhat similar way. Honestly, once you throw in grading on curves, different point schemes, dropping the lowest score, and so on, some instructor grade books are algorithmically more complex than many of the courseware affordances I showed in my last post.

    The value of having many examples

    So far, I have been writing about the content design pattern as a tool for getting the most out of self-study curricular materials. That is still a good frame of reference for thinking about courseware or courseware-like content as static tools for teaching. But this content design pattern also has great value—in the long run, perhaps greater value—as a tool of inquiry for educators who want to improve their teaching craft.

    And this is the moment where I reveal my not-so-hidden agenda.

    My altar ego, Montgomery Burns

    If you thought this series was about courseware, then you were (mostly) wrong. If you thought this post was going to be about machine learning and algorithms and adaptive learning, then you were also (mostly) wrong. I will touch on those topics, but they are means to an end.

    And that end is to talk about increasing literacy and fluency among faculty in evidence based, digitally-enabled pedagogy. Just as the proliferation of commercial courseware provides us with a wide range of examples of professionally designed content which we can study to learn more about trends in curricular materials designs, the proliferation of analytics and adaptive learning provides us with an increasingly wide range of examples of professionally constructed analysis and inference techniques which we can study to learn more about current trends in such techniques.

    We have an ever-growing library of implementations—good, bad, and ugly—which educators could be studying and learning from if only the pedagogical design and function were not either opaque or invisible to them. Forget about the products as products for a minute. Set aside your feelings about the vendors for a moment too. We have digitally-enabled or enhanced teaching design patterns that have been evolving for at least 40 years. We are now are at a point where those patterns have reached critical mass, are proliferating at a rapid rate, and are being employed by academic and commercial course designers alike.

    Somebody should tell the faculty, don’t you think?

    The Empirical Educator Project (EEP) is going to undertake a major literacy effort to help increase awareness, literacy, and fluency in this design pattern, aided by some of the tools that Carnegie Mellon University has made available as part of OpenSimon and by the efforts of the wonderful people and organizations in the EEP network. I’ll have more to say about these efforts in the coming weeks. but for now, I am using this series to explain why I believe this is a fruitful area for educator literacy efforts.

    And it ain’t just about building a better textbook.

    Pedagogy as hypothesis

    Have you ever had one of those days where your carefully crafted lesson doesn’t go the way you thought you did? If you haven’t, then either you haven’t taught much or you’re doing it wrong. Because, given sufficient time in the classroom, every self-aware educator is going to have this experience. Something that you thought would be easy for the students turns out to be hard. An explanation that you thought was crystal clear confuses them. You thought the students were following along great until they bombed the unit test.

    In the classroom, most educators experience these problems and make adjustments as needed. They may not test for these problems programmatically. They may not conduct formal experiments to fix problem spots in their courses. But many, many educators do this in some form to some degree. Whether consciously or unconsciously, deliberately or instinctively, they are teaching by hypothesis. They think something will work, test it, and if they are wrong, they will try something else. Teaching isn’t assembly line work. It’s knowledge work. Done right, it requires an endless amount of creating problem-solving and tinkering.

    In the days of analog textbooks, it was a lot harder to do this kind of tinkering with student self-study work because educators were mostly blind. They couldn’t see what students were doing and they often didn’t even get to directly observe the results. They almost never got a chance to create a rapid feedback cycle with individual students to try a few different things and see what works. That changes with digital—if you have the right content design.

    As with the last post, I’m going to show some examples from Empirical Educator Project sponsors to show this content design pattern makes new teaching insights possible in a digital environment.

    Is your content working?

    Suppose you want to find out if the content in your digital curricular materials is actually helping students to learn what you are trying to help them learn. You could look at page views and other Google Analytics-style information to see what content students are spending time on. And you could look at the assessment scores. Take a moment and think about what you could learn from those two pieces of information.

    Eh, not much.

    Now suppose your curricular materials were created using backward design. For each content item, you know which assessment questions it is designed to prepare students for and which learning objective it is ultimately designed to teach.
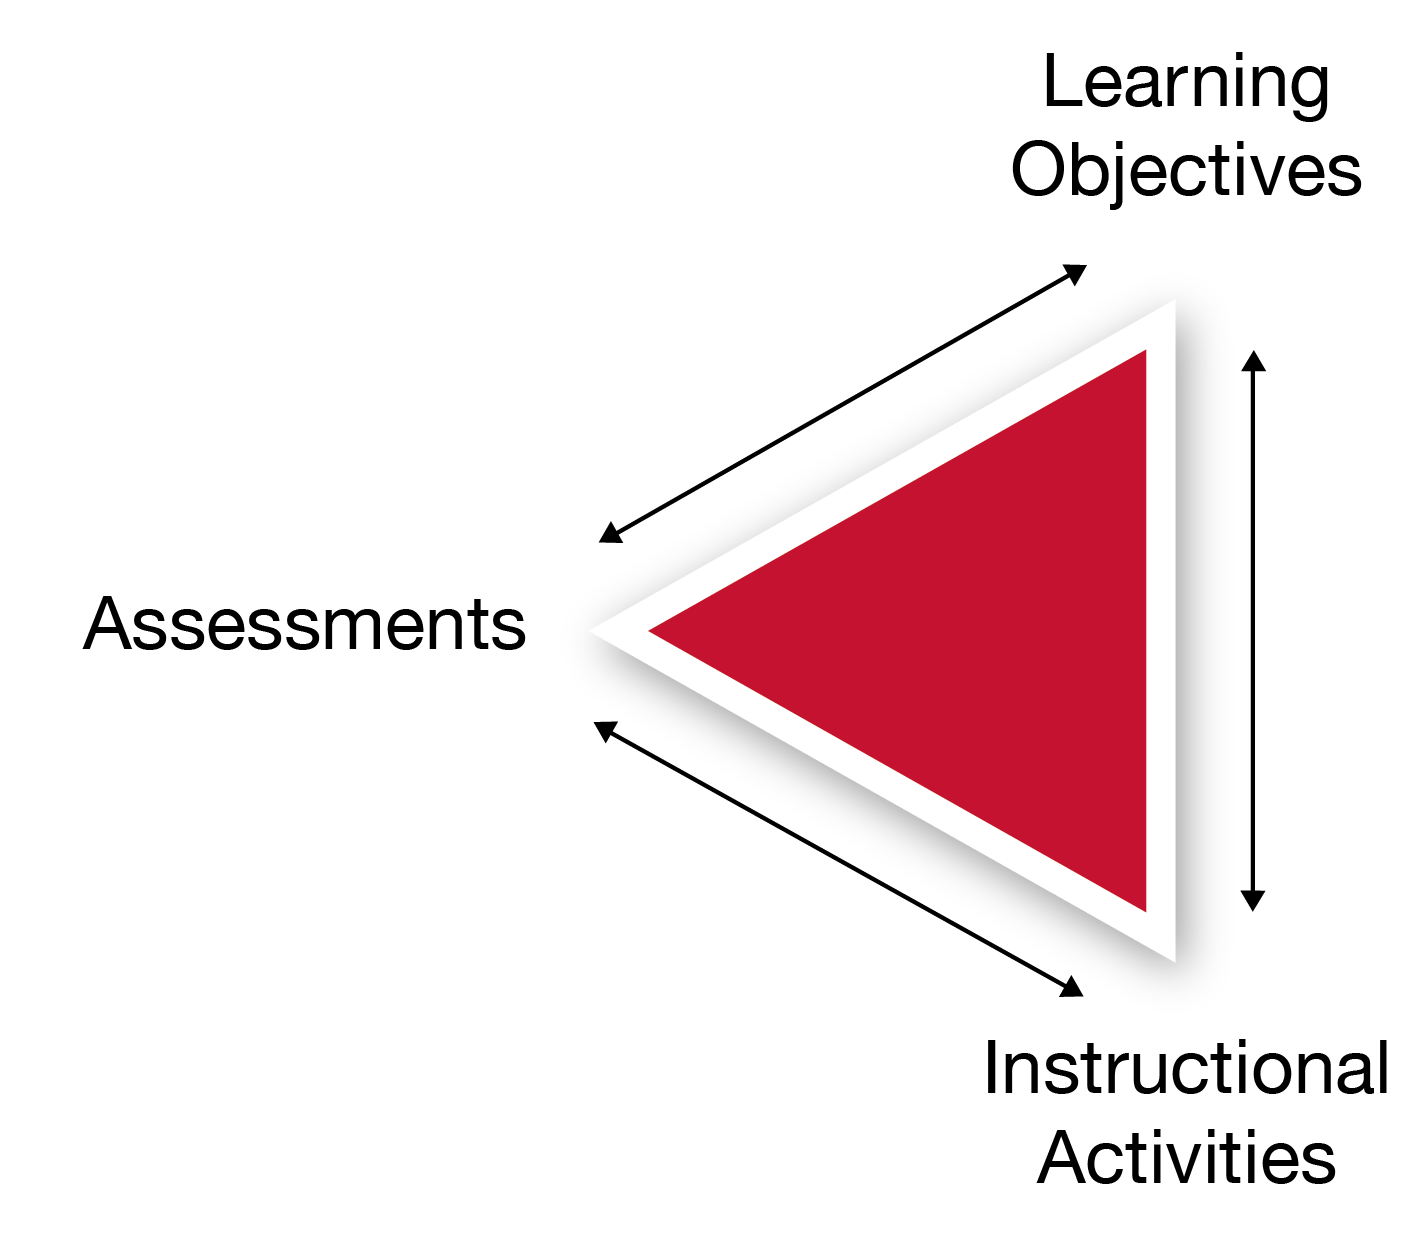
    The golden triangle of instructional design

    You now have the ability to link page views to assessment data (and both to learning goals). Did your students spend a lot of time on a piece of content and still perform poorly on the associated assessments? Then something probably wrong with your design. Did they score well on the assessments while skipping over the associated content? Again, there’s a potential opportunity for improvement.

    What I’ve just described to you is the essence of the RISE framework, which was developed by Lumen Learning. As I described in a previous post, Lumen worked with Carnegie Mellon University to integrate RISE into one of CMU’s open source learning engineering tools. Now, anyone using any platform that can export data about page views and assessment items that are associated with a particular learning objective can generate a simple graph with page views on one axis and assessment performance on the other. It’s a simple and intuitive tool that any educator could use to get insights into whether their curricular materials are as effective as they could be. At last spring’s Empirical Educator Project (EEP) summit, Lumen and CMU demonstrated this process working using content from D2L Brightspace.

    Here’s a panel discussion we had about RISE and CMU’s OpenSimon LearnSphere at the EEP summit:

    RISE and Shine panel at the 2019 Empirical Educator Project summit

    Note that the content doesn’t fix itself through the magic of machine learning. Rather, RISE helps educators focus their attention on areas of potential improvement so that the humans can apply their expertise to the problem. This is true even in the most sophisticated commercial products. However fancy the algorithms may be, behind the scenes, experts are using the data to identify problems that still require humans to solve.

    Publishers that really understand the digital transformation have subject-matter experts who are pouring over the data and making changes on a regular basis. When Pearson announced that they would be moving to a digital-first model so that they could update their products more frequently I wrote,

    [I]n the digital world, there are legitimate reasons for product updates that don’t exist with a print textbook. First, you can actually get good data about whether your content is working so that you can make non-arbitrary improvements. I’m not talking about the sort of fancy machine learning algorithms that seem to be making some folks nervous these days. I’m talking about basic psychometric assessment measures that have been used since before digital but are really hard to gather data on at scale for an analog textbook—how hard are my test questions, and are any of the distractors obviously wrong?—and page analytics on the level that’s not much more sophisticated that I use for this blog—is anybody even reading that lesson? Lumen Learning’s RISE framework is a good, easy-to-understand example of the level of analysis that can be used to continuously improve content in a ho-hum, non-creepy, completely uncontroversial way.

    It would be irresponsible for curricular materials developers not to update their content when they identify a problem area. It would be like continuing to give a lesson in class when you know that lesson never works. But the main point here is that the software helps the human experts perform better. It doesn’t replace them.

    Are your assessments working?

    Just because students are looking at a piece of content and still scoring poorly on the related assessment items doesn’t necessarily mean that the problem is with the content. What if the assessment questions are bad?

    Psychometricians developed statistical methods for evaluating the quality of assessments many decades before the advent of digital courseware. The term of art for the most widely used collection of methods is “item analysis.” Item analysis tools have been built into most mainstream LMSs for quite some time. (If I recall correctly, ANGEL was the first platform to do so.) Here’s an example of an item analysis graph from Brightspace:
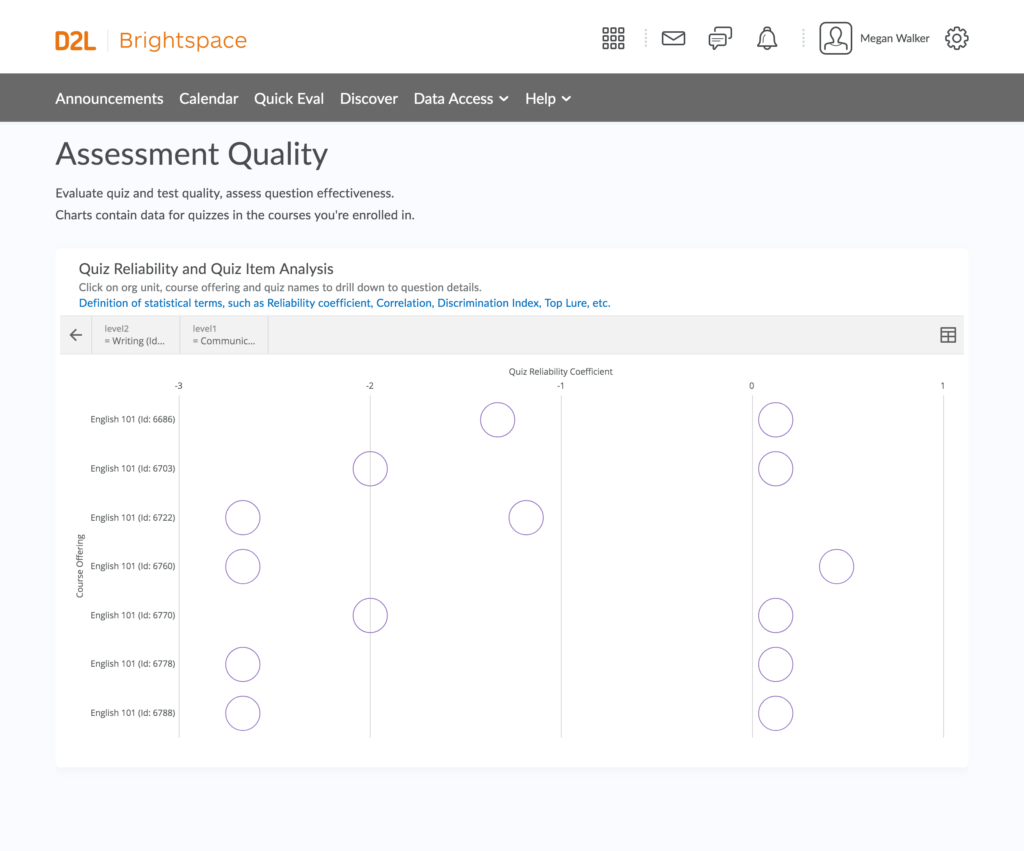
    Brightspace item reliability visualization

    This particular visualization is showing the results of something called a “reliability coefficient.” It tells you how consistent the student answers are to questions within an assessment. I’ll ask you again to think for a moment about how useful that measure would be by itself.

    Now think about how useful it would be to see how consistent student answers are to questions about one particular learning objective. The more interrelated questions are within a group of questions being evaluated this way, the more consistent the student responses should be. If all of the questions assess mastery the same learning objective, then performance across those questions should have a fairly high degree of internal consistency. Yes, some questions may be harder than others. But there should be an overall pattern of consistency among the student answers to questions assessing the same learning goal. If there isn’t, then there may well be something wrong with the assessment.

    And speaking of difficulty, item analysis does provide the ability to assess the difficulty of questions relative to each other. When you design questions to assess a learning goal, you may deliberately write some questions that you believe will be trickier than others. But you may not always be right about that. Sometimes students can get tripped up by the design of question, making it more difficult than you anticipated. Or maybe you unintentionally gave a clue to the answer in the design of your question. Or maybe there’s nothing wrong with your individual questions per se, but the overall difficulty of them for one learning objective is higher than it is for the others in the unit. Or lower. Wouldn’t you like to know those things? Well, you can. Your LMS probably has the tools to help you learn these things about assessments within the LMS. But those tools are a lot more useful if you have grouped your assessment questions by learning objective.

    Are your learning objectives working?

    Maybe the reason that the students are struggling isn’t because your content is confusing, or because your assessments are poorly designed, but because the learning goal you’re assessing isn’t as well defined as it could be. Sometimes you discover that what you think of as one skill actually contains a second skill or knowledge component that you take for granted but that is tripping students up. Here’s how Carnegie Mellon University professor Ken Koedinger puts it:

    Ken Koedinger on hidden prerequisites

    If you have that problem, then there should be evidence in the assessment data. Students who are taking well-designed assessments that cleanly assess one learning goal should show improved performance on assessment questions over time as they progress toward mastery. Here’s an example of what Carnegie Mellon University calls a “learning curve,” showing exactly that trend in student performance in their OLI platform:
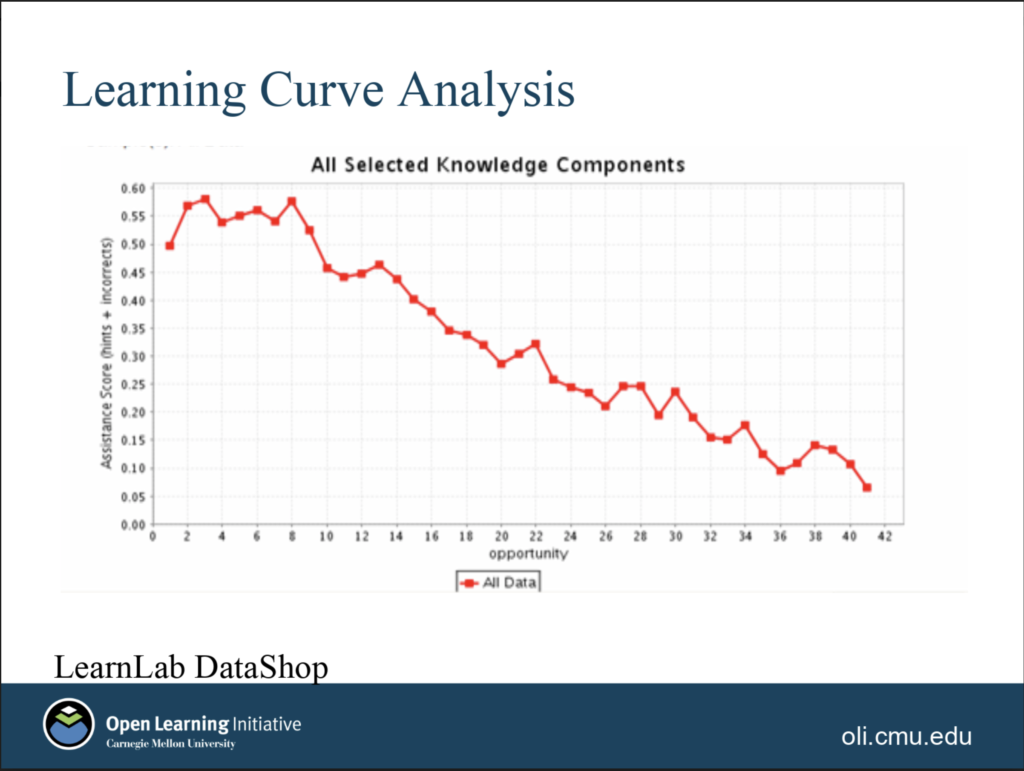
    OLI learning curve

    But what if your learning curve looks like one of these?
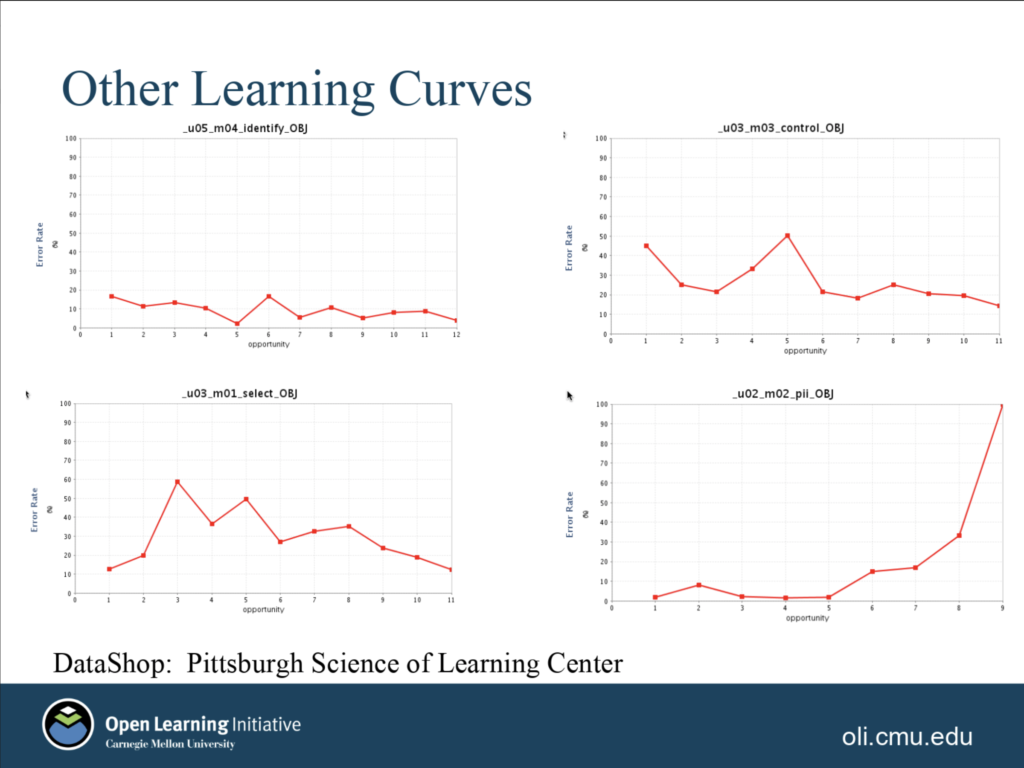
    Anomalous learning curves

    See the blip in the graph on the top right? That could suggest that one or more questions snuck in that test something other than just the intended learning objective. (Or they could have been poorly written questions.) The graph on the top left, on the other hand, may show that students have already mastered a learning objective, or that the questions are two easy. If you take some time to look at each of these graphs, they may suggest different questions to you about your curricular materials design. All of this is possible because assessment questions have been linked to learning objectives in the content design. And again, the solution when one of these anomalies appears is generally to have a human expert figure out what is going on and improve the content design.

    Are your scope and sequence working?

    Implicit in that last section is the notion that it’s possible for even good, experienced educators can miss prerequisite skills in their course designs from time to time. Very often, the algorithms behind skills-based adaptive learning platforms are testing for missing prerequisites. In the marketing, the emphasis is placed on the software’s ability to identify prerequisite skills that individual students may have missed along the way. But it’s important to understand what’s going on under the hood here and how it affects the content design and revision of these products by the human experts. One of the things that this type of adaptive software is really doing is finding correlations between students doing poorly on one skill and them doing poorly on prerequisite skills. In some cases, the prerequisites are well known by the content designers. In those situations, the software is checking to see if the student is struggling on a lesson because she needs to review a previous lesson. In these cases, the “adaptive” part of adaptive learning means that the system automatically provides students with opportunities to review the prerequisite lessons that they need to brush up on. ((This is not the only way that adaptive learning products can work, but it is a common approach.))

    But sometimes the software identifies a correlation between a skill and a previous skill that either the content designers weren’t fully aware was a prerequisite or did not realize how important of a prerequisite it is. The analysis shows that students who struggle to learn Skill F, perhaps surprisingly, often didn’t do so well with Skill B.

    Unfortunately I don’t have any screen shots illustrating this—maybe somebody reading this will send me one—but it’s an easy enough idea to grasp. And once again, the algorithms that drive this analysis only work when content is designed such that assessment questions are tied to specific learning objectives.

    Is your classroom pedagogy working?

    Now I’m going to explore a theoretical affordance made possible by this content design pattern. It’s not one that I’ve seen implemented anywhere. But we can get the outlines of it by looking at Pearson’s efficacy report and educator guide for their Revel psychology product. (Reminder: Pearson has paid me to consult for them on how to make their efficacy reports, including this one, as useful as possible.)

    One of the main efficacy measures in Pearson’s study was, essentially, the size of the improvement students showed from their formative assessments to their summative assessments. This was measured in a class where a professor was implementing specific pedagogical practices that are often lumped together under the heading “flipped classroom.” Teasing this out, we would expect students to experience some benefit from the formative assessments and the curricular materials themselves, and some benefit from the professor’s teaching practices that helped students take maximum advantage of what they could learn about their progress from their formative assessment performance that the courseware was giving them.

    Let’s think about the performance improvement measured in this study as a kind of a benchmark. It shows how much of benefit a class could experience given a particular set of teaching practices and students that tend to take that sort of class in that sort of university using that particular curricular materials product. What you might want to do, as an educator who is interested in active learning and flipped classroom techniques, is evaluate how much of an influence your classroom practices have on the benefit that students can extract from the formative assessments of the product.

    If both the formative and summative assessments are tagged with the same learning objective, then it should be possible to give every instructor with a gauge like the one that Pearson had to create in order to measure the impact of their product under close-to-ideal conditions. But we’d be flipping the analysis on its head. Rather than controlling for the teaching methods to measure the impact of the content, we’d be controlling for the content in order to measure the impact of different teaching methods. Instructors could try different strategies and see if they increase the benefit that students can get from the formative assessments.

    Yet again, this possibility for creating innovative “learning analytics” is becomes apparent once you do some hard thinking about the simple content design pattern and all the different kinds of insights that you can extract from implementing it.

    For the techies reading this, the lesson is that the value of educational metadata generated by human experts for the purpose of supporting their own thinking will exponentially increase the potential for your machine learning algorithms to generate useful educational insights. By itself, even the most sophisticated machine learning techniques will have sharply delimited applicability and severely limited value in a semantically impoverished environment. My favorite high school English teacher used to admonish, “If you’re not writing clearly, then you’re not thinking clearly.” Something like the inverse could be said for learning analytics. Clear writing is not evidence of clear thinking but rather the prerequisite for it. If the content authors do not provide the algorithms with indications of pedagogical intent, then the algorithms will not have the cues they need to make useful inferences. If content is infrastructure, then content metadata is architecture. It is a blueprint.

    For the educators in the audience, I hope it’s clear by now that this design pattern, which is ubiquitous in commercial digital curricular materials and quite possible to implement in platforms like LMSs, is something that educators need to be aware of and understand. We have a literacy challenge and a fluency opportunity.

    The opportunity before us

    In the coming days and weeks, I will be sharing details of several major initiatives from the Empirical Educator Project related to this challenge and opportunity. I haven’t even shared them with the EEP network yet because I am in the process of nailing down a few final details right now. But I am very close to nailing down those details. So close, in fact, that I expect to be able to share some of them with the public in the final installment to this series.

    Stay tuned.

    But also, y’all don’t have to wait for me or EEP. Many of you have deep expertise in this content design pattern and what can be done with it already. I’ve found that my biggest challenge in trying to talk to experts about this challenge is that they so take for granted the concepts I’ve been outlining in these last three posts that it’s hard for them to even think about them as something to be discussed and explored. I hope that this series has clarified the need for and value in talking about the content design explicitly. When we talk about the value of digital content in terms of algorithms and data and functionality and other digital terms, it is easy for educators lose the thread. But when those conversations are grounded in the design of content and courses and pedagogy, then the digital accoutrements become embodiments of teaching strategies that make sense to them and that they can think about critically as experts.

    More of that, please.
  • The Content Revolution

    Content is infrastructure.

    David Wiley

    An unbelievable number of words have been written about the technology affordances of courseware—progress indicators, nudges, analytics, adaptive algorithms, and so on. But what seems to have gone completely unnoticed in all this analysis is that the quiet revolution in the design of educational content that makes all of these affordances possible. It is invisible to professional course designers because it is like the air they breathe. They take it for granted, and nobody outside of their domain asks them what they’re doing or why. It’s invisible to everybody else because nobody talks about it. We are distracted by the technology bells and whistle. But make no mistake: There would be no fancy courseware technology without this change in content design. It is the key to everything. Once you understand it, suddenly the technology possibilities and limitations become much clearer.

    For those familiar with course design lingo, the design pattern I am talking about can be summed up as backward design coupled with programmatic formative assessment. This post is the first in a series in which I will explain this design pattern, it’s possibilities and limitations, and the ways in which it makes possible a whole range of educational technology affordances.

    Backward Design

    “Backward Design” is a term that comes from a larger framework called “Understanding by Design,” (UbD) developed by Grant Wiggins and Jay McTighe and articulated in a book by the same name. While it was developed as K12 curriculum design approach, it has been widely embraced by curriculum and course content designers at all levels. Because the backward design practice as applied in courseware authoring necessarily requires what some might perceive as a “dumbing down” of the approach (for reasons I will get into later in this post), it’s important to understand the philosophical roots of UbD. On one hand, this is an approach that is grounded in the political reality of a K12 world that is driven by curriculum standards. Wiggins and McTighe are unapologetic about having defined curricular goals for students. On the other, UbD is intended to work against the tendency to memorization of facts and rote applications of lower-order skills, fostering critical thinking and knowledge transfer across domains. Three of the seven tenets of UbD (as articulated in this crisply written white paper by Wiggins) are as follows:

    • The UbD framework helps focus curriculum and teaching on the develop- ment and deepening of student understanding and transfer of learning (i.e., the ability to effectively use content knowledge and skill).
    • Understanding is revealed when students autonomously make sense of and transfer their learning through authentic performance. Six facets of under- standing—the capacity to explain, interpret, apply, shift perspective, empa- thize, and self-assess—can serve as indicators of understanding.
    • Teachers are coaches of understanding, not mere purveyors of content knowl- edge, skill, or activity. They focus on ensuring that learning happens, not just teaching (and assuming that what was taught was learned); they always aim and check for successful meaning making and transfer by the learner.

    UbD is explicitly not a paint-by-numbers approach to education. It is, however, a design-intensive approach to teaching that emphasizes the value of preparation and goal-oriented thinking as a key to unlocking teachable moments. This 10-minute video of Wiggins explaining the philosophy is well worth your time and provides a philosophical guide star to keep in sight as we navigate backwards design in general and its application to courseware design in particular:

    Grant Wiggins – Understanding by Design

    The upshot of his message here is that teachers and student continually need to be asking the question, both individually and together—what are the larger learning goals here?

    Backwards Design, at its most basic, is the idea that educators should be asking that question from the moment they start planning their course. Rather than starting with a collection of content and activities and putting it into a sequence, educators should start by articulating the end goals for the students (where an end goal is broad enough to encompass high-level and non-cognitive goals such as “a love of reading”). The three-step process of backward design is as follows:

    1. Identify desired results
    2. Determine acceptable evidence
    3. Plan learning experiences and instruction

    All content and activity choices flow from identifying the desired results and determining acceptable evidence of achievement of those results. This approach is “backwards” from the typical approach of starting with content that needs to be covered.

    Backward Design in courseware development

    Modern courseware, and many of the most highly touted technology affordances that come with it, flow from the Backward Design technique. But there are two additional constraints that are imposed by the medium. First, the activities in the courseware can only be activities that can be facilitated in an online medium—and, since courseware is modeled after the textbook, these are usually (but not always) solo activities by students that look like digital extensions of the kinds of exercises that you would expect from textbooks. Second, since key technological affordances of courseware come from its ability to auto-assess student progress, “acceptable evidence” generally must be machine-gradable evidence.

    Since this is Backward Design, these changes have implications up the chain to the first step in the process. Rather than “identifying desired results,” courseware designers have to think in terms of “learning objectives” that are realistic to achieve and measure given the limitations of the medium. The University of Central Florida (UCF) has posted a learning objective builder tool which, while not limited to the application of courseware design, begins to convey how courseware designers need to think about learning objectives in order to design content that will work in the courseware medium. The learning objective structure in the UCF example has four components:

    1. Condition, e.g., “Given a blank map of the United States…”
    2. Audience, e.g., “…the student…”
    3. Behavior, e.g., “…will identify all 50 states and capitals…”
    4. Degree, e.g., “…with 90% accuracy.”

    In comparison to Wiggins’ framing of UbD, this may feel starkly reductive to you. It’s important to keep in mind that the example was undoubtedly written for clarity rather than to illustrate how creative an educator can be while still staying within the bounds of the format. That said, there is no question that the format is limiting.

    And this, I think, is where a lot of unilluminating argument over the value of courseware originates. On the one hand, if the idea is that courseware will largely replace human instruction, then we have to recognize the gap between the learning objectives which the courseware can assess and the desired educational results which a human teacher can address and assess. On the other hand, it’s very hard to talk about that gap meaningfully and specifically when the entire course hasn’t been backward designed in the first place. If a course has clearly defined desired outcomes and clearly defined acceptable evidence of those outcomes, then it is a straightforward exercise to identify the subset of goals and evidence that courseware can address. But in absence of that larger course blueprint, educators who want to argue that courseware is too reductive start to get hand-wavy pretty quickly. We shouldn’t be surprised that interactive curricular materials are not complete substitutes for a classroom experience, but we should be able to clearly articulate what the gap is and how classroom interactions address that gap in ways that courseware can’t on on a course-by-course basis.

    The atomic unit of courseware content design

    Once we’ve translated the principles of Backward Design to fit the constraints of courseware, we end up with a tightly constructed content design:

    The content triangle of learning objectives, assessments, and instructional activities

    Again, this structure is not limited to courseware; it’s a good distillation of the results of backward design in general, using language that also translates well into courseware design. But when building modern courseware, this design is formal and structural. Every instructional activity (which, in the case of courseware, means interactive or non-interactive content items) and every assessment activity is tagged to correspond with a specific learning objective. As far as the software is concerned, this collection of items and metadata is a formal and atomic unit of instruction. McGraw-Hill Education even went so far as to name this collection a “compound learning object (CLO)“.

    As we will see in detail in the next post in this series, many of the technology affordances of modern courseware depend utterly on this formal structure. And once you understand the design pattern, you can see it everywhere in most curricular materials products and in an increasing number of courses designed on campuses with the help of professional instructional designers. I would go so far as to say that the formalization of this content structure, and not any fancy technology capabilities like adaptive learning algorithms or learning analytics dashboards, is the defining innovation in curricular materials over the last decade. It is the key to everything.

    Programmatic formative assessment

    There is one other defining content feature that is worth talking about before we explore implementation examples in the next post. A key educational affordance of courseware products that is often touted is instantaneous feedback. Since there is strong evidence that timely feedback is critical to the learning process, this is a key benefit (assuming that the feedback is meaningful). But instantaneous feedback on summative assessments—on assessments at the end that measure how much the student has learned before moving on to the next lesson—is not as helpful to students as it might be because…well…they’re moving on to the next lesson. They may or may not take the time to reflect on their incorrect answers. In contrast, feedback on low-stakes assessments, particularly when it is supported by feedback and support from the educator, can be very useful. In fact, I have long argued that this ability to have students practice their skills and test themselves—yes, before they take a summative assessment, but more importantly, before they walk into a class discussion—is a key value proposition for modern courseware. Class preparation.

    This is often billed as a technology affordance, but once again it is utterly dependent on the content design. Their analog…er…analogue is back-of-the-chapter homework problems. Practice problems that are linked to a skill or a bit of knowledge that will ultimately be assessed for a grade is not a new idea. The technology simply improves on the kinds of practice and feedback that were possible with flat textbooks. It can be given more often, in more interactive formats, with more timely feedback.

    Circling back to the Grant Wiggins video at the top of this post, students and educators alike need to constantly be asking the question “Why am I doing this now?” Whatever we are learning—or teaching—we should always also be studying whether our activities are aligned with our goals. Good educators are continually assessing their students in a variety of ways, starting with looking at their faces to see if they look like they are following, bored, confused, etc. They adjust according to what they see. Likewise, students need to be assessing their learning strategies and progress in order to get better at achieving their learning goals. One defining characteristic of modern courseware content design is creating as close to a continuous assessment feedback loop as possible.

    Content as infrastructure

    As I’ve stressed throughout this post, I don’t think it’s possible to overstate the role of this content design pattern—Backward Design plus programmatic formative assessment—in most of the recent innovations in digital curricular materials. In the next posts in this series, I will show concrete examples of how this design pattern makes various technological affordances possible as well as how it opens up new possibilities for tuning both courseware content and teaching strategies for continuous improvement. In the last installation, I will write about the need for and benefits of having content interchange and analytics interoperability standards that are tuned to this ubiquitous yet invisible content design pattern.

  • EEP 2019: The Invisible Miracle of Learning

    Today I am sharing the first video out of the Empirical Educator Project (EEP) 2019 summit, and with it, a central concerns of the project. Much of the basic machinery our learning processes work so naturally and automatically so much of the time that they are invisible to us. So pervasively invisible, in fact, that most of us are barely aware that it even exists. And that’s a problem. If you believe that the job of education is to work within what psychologist Lev Vygotski called the “zone of proximal development”—the kind of learning challenge that would be too hard for a student to learn on her own but not so hard that she can’t learn it at all—then we have to have a very finely tuned understanding of that learning machinery, to the point where we can accurately find each student’s zone of proximal development with a high level of consistency.

    We fail to do this all the time. Some students are bored while others struggle. The more heterogeneous the student population is, the bigger a problem this is. As higher education as a sector becomes more committed to serving post-traditional students, first-generation students, and students with 40-year educational relationships to the school rather than 4-year relationships, then this need to be able to see and understand these invisible learning processes becomes more acute. For this reason among others, fostering academic literacy around the mental machinery of learning—making the invisible visible—is one of the central goals of EEP. I therefore wanted to start the 2019 EEP summit by highlighting this challenge. So I invited three Carnegie Mellon University (CMU) professors with complementary areas of expertise to participate in a panel that could highlight several dimensions of the problem.

    This wasn’t the first time I had interviewed these three particular academics. I had been fortunate enough to be invited to a CMU press fellowship three years earlier. I brought my video camera along and happened to be able to get some air time with these very three people, two of whom I had never met before. The interviews turned out to be formative for me, particularly with regard to my thinking about EEP. I’m going to write a little about the complimentary insights that these three academics gave to me and then share both the interview video from the summit and the original interview videos from two years ago.

    Expert blind spots

    As we get old and forgetful, we like to joke that our minds have to make room for the new information by clearing out old information. It turns out that there’s truth behind this joke in multiple ways. First, we have different kinds of memory. If I asked you to list the steps required to tie your shoe, those steps would probably not come tripping off your tongue. Does that mean that you don’t know how to tie your shoe? No, it doesn’t. It means that you’ve moved that knowledge to a more efficient memory space in your brain. One that’s quick and efficient enough that you can easily bend down and tie your shoes while performing other, more demanding cognitive tasks. But that knowledge is not accessible to your conscious mind. It is “tacit” knowledge. Your brain is very efficient at shunting information that it needs to access but does not need to consciously examine into a different compartment than the one it was in when you were learning a skill.

    There was a time when you could list the steps in tying your shoe, because that was how you first learned those steps. Your brain put that information into a box once it no longer needed conscious access to it. Chances are good that you don’t remember that time well and that you don’t remember the experience of those steps fading from your conscious memory. I tried to recreate this experience recently for myself. I am learning to swim. In the first weeks, I was thinking about about very basic aspects of moving my arms and, separately, moving my legs. That period was about nine months ago. I decided to try a little experiment with memory encoding in the process. Every two weeks, I would try to remember the steps that I learned in my first lesson. I didn’t try to memorize those steps. That would be triggering a different memory process and would invalidate the experiment. I just tried to reconstruct the steps in my mind. Meanwhile, I spent most of my time at the pool learning to be a better swimmer.

    As the weeks went on, I found myself thinking less about what my arms and legs were doing separately and more about what my whole body was doing. I also found it harder and harder to remember what the original steps were that I learned in my first lesson. Nine months in, I barely remember anything about how I first thought about what I was doing. If I had to teach somebody to swim from scratch, I couldn’t just reproduce the lesson that was taught to me. I’d have to make something up. Nor could I reproduce the learning steps I took—many of which I made on my own, without my instructor—to get from my beginner’s understanding to the level of expertise I have achieved as of today. I might be able to draw on some of my knowledge and experience, but I would have to invent more of my teaching moves than most teachers like to admit, through trial and error, by working with students.

    So our brains do, in fact, make room for new information by boxing up old information and putting into storage. In addition to the memory changes, we also process information differently as our domain knowledge gets more sophisticated. When you’re learning math, or cooking, or yoga, or any other discipline with integrated skills that build on each other, at first, you’re learning each skill separately. Over time, your mind integrates steps and makes general rules. As novice cooks become expert cooks, their way of thinking about cooking looks less like meticulously following one out of hundreds of completely separate recipes and more like following some generalized principles that they’ve drawn from their experience of making so many recipes. They stop thinking algorithmically and start thinking heuristically.

    We don’t generally notice these changes in our cognition as we move from novices to experts in a topic. They’re not directly observable and not usually consciously experienced. They just happen. This is a problem for teaching because professors, as experts, have undergone all of these changes in their learning processes. They no longer think they way their students do. They don’t think about cooking as following individual recipes. Further, because their evolution as thinkers was largely silent, and because most professors have no professional development in these processes, it’s not always obvious to them the extent to which their brains process information in fundamentally different ways than those of their students. Ironically, it is their very expertise that causes them to struggle sometimes to understand how their students think about their subjects or how to work with them in that zone of proximal development. CMU Professor Ken Koedinger, Director of LearnLab at the Pittsburg Science of Learning Center, is an expert in this conundrum.

    Expert teaching blind spots

    There’s a related phenomenon that I’ll call an expert teaching blind spot, even though I don’t think that’s an official term of art. Just as it is possible to not consciously know what you know in any domain of knowledge, it’s possible to have tacit knowledge specifically in teaching. In addition to the reasons above, I’ll add another one: Interpersonal skills, including teaching skills, are somewhere in the middle of learning spectrum between things that we are hardwired to learn without anyone specifically teaching us (like spoken language as young children), and something that is an intellectual creation which must be consciously learned (like political science). Many educators have what we colloquially refer to as teaching “instincts,” and that word is not far from the truth. We have tacit interpersonal knowledge, sometimes including tacit knowledge about learning processes of our students. We know some things about how to teach in a very real sense, but that knowledge is not fully consciously accessible to us.

    As a result, it can be very difficult to talk to even highly skilled teachers about what they do, because in many cases they’ve never even tried to put what they do into language. They just do what seems right and obvious to them. And if they do verbalize what they’re doing, they usually aren’t using terms of art because they usually haven’t been taught any. Their insights seem personal because nobody has talked to them that beyond the personal and phenomenological there could be a sharable, learnable, teachable body of knowledge that their instincts are tapping into. CMU’s Marsha Lovett, Director of Eberly Center for Teaching Excellence & Educational Innovation is an expert in this problem domain.

    If we don’t have a coherent answer, then we make one up

    If you put all of this together, it adds up to a very significant challenge to serious educators. They don’t have easy ways of knowing how they think differently than their students or easy access to their own cognitive journeys that got them from novice learners to expert learners. And yet, most of us have vivid memories of our formative experiences as students. On top of that, teachers teach, and students learn. It happens all the time. Humans are such incredible learning machines, and the machinery is so well hidden from us, that many people tend to assume that there really isn’t much to it (when nothing could be further from the truth). Most professors are good at academic learning. That’s how they ended up as professors.

    And they usually had at least one experience that really inspired them to learn about their chosen field. That association is often all it takes for educators to attribute causality. “Well, I had an amazing experience in Professor Smith’s class, and Professor Smith did X, so X must be a great way to teach.” Given that most professors diligently worked through five to seven years of graduate school without being exposed to the tiniest hint of any of the above and then were expected to somehow magically know how to teach well, what tends to happen is that professors make up their own stories about what effective teaching is based on their own personal experiences—which is the only data they have, really—and they go on that. And they don’t change their minds about it very much or very easily. CMU anthropologist and Simon Research Faculty Lauren Herckis has conducted some fascinating research in this area.

    We have a literacy problem

    If you put all of this together, it’s clear that we’re not going to make substantial progress on improving education until educators are taught to see that which is currently invisible. We have to develop a common cultural understanding that learning involves a complex set of cognitive processes, that being an expert in a knowledge domain is not sufficient to be a good teacher of novices, that good teaching instincts are often based on tacit knowledge which we can make explicit and therefore more sharable and useful. Only by doing this together, as a sector, can we make substantial progress on improving student success. One of the main goals of Empirical Educator Project is to begin fostering the cultural infrastructure that we need in order to do that.

    Here are the three original video interviews I conducted of Marsha, Ken, and Lauren two years ago:

    e-Literate TV CMU Interviews

    I got lucky with those interviews. The coherence in the interviews is a product of the coherent body of work at CMU’s Simon Initiative as represented by the three people who happened to be available to interview rather than through some master plan of mine.

    At the summit, I chose to frame up both the discussion and the event more consciously. In addition to their work, I asked the three to reflect on their personal journeys as educators to embrace views about teaching and learning that may have seemed surprising or even counter-intuitive to them:

    EEP Summit 2019: Empirical Education 1.0 beta Panel

    The journeys that these experts describe are emblematic of the bigger picture that EEP is all about. And not just in classroom work specifically, but in every aspect of serving students.

    I have said before that academia needs to move from a philosophical commitment to student success toward operational excellence at supporting student success. The implied gap is knowhow. It will show up differently in the classroom than it will in, say, advising, but the pattern is going to be the same, and I think academics will be most comfortable thinking about it as starting with a literacy problem. There is some discipline, either new or existing, that they must learn to some degree of competence in order to serve their students well. They might not have to be expert in it—they don’t have to have PhDs in cognitive psychology, for example—but they do need to be literate in it.

  • EEP 2019 Will Be Live Audiostreamed

    Interest in the Empirical Educator Summit (EEP) has been off the charts. We want and intend to include everybody, but only when we can include people in a way that is useful to them. So we are being intentional about the pace and ways in which we are growing.

    That said, we know a lot of people are very interested. We had already planned to release video of much of the summit after the fact. We’ve decided that we’re going to try to live stream the audio as well. (My experience with live-streaming video is that there isn’t much value in the visuals unless your setup is better than we will be able to manage, so we’d rather focus on trying to get you a solid audio stream.)

    We have a placeholder page set up at http://empiricaleducators.net/2019-eep-summit/. Between now and Monday, we will be posting an agenda of the summit and putting up a widget for the audio streaming on that page. Check there periodically for updates. For planning purposes, I can tell you now that the audio streaming will be from 9 AM to 3:30 PM EST on Monday, May 6th and from 9 AM to 12 PM EST on Tuesday, May 7th. Again, the agenda will be posted on the EEP summit page soon. This is a last-minute addition driven by demand, so we’re winging it a bit.

    We also invite you to discuss the summit on Twitter as it is streamed. We will not have the luxury of a dedicated social media person to monitor and respond to the conversation live, but we will be encouraging the on-site community to participate and will definitely be looking at what you have to say afterward to see what we can learn from your input. The hashtag for the event is #EEP2019.

    We’re adding two more hashtags for more specific input, since EEP is ultimately about doing things together. If you use these, please be sure to catch the early sessions on Monday that explain the goals of EEP so that your input is on point. The first hashtag, #EEP2019ideas, is for suggestions about how EEP members—both current and prospective—can work together to accomplish the goals of the network. The second, #EEP2019challenges, is for obstacles you want us to be aware of as we think about how to build out the collaborative network.

    To prepare you for the streaming of the event, I’m going to assign you some homework. The main reading is very short. I just published a piece in Forbes about Carnegie Mellon’s contribution. It’s not what you’re used to reading from me in that Forbes required the piece to be only about 800 words and strictly enforced a requirement that readers shouldn’t need to have any knowledge of higher education or software whatsoever in order to understand the article. The downside of these requirements is that I had to flatten and truncate some details and nuances that e-Literate readers are used to getting from me. (One example that I particularly want to get off my chest is that I briefly described the fruits of Lumen Learning’s collaboration with Carnegie Mellon but wasn’t able to give them proper credit.) But there were some benefits to those restrictions too. I think the piece captures something of the sense of professional identity and culture that both Carnegie Mellon and EEP seek to foster. Also, did I mention that it’s probably the shortest piece by me that you will ever see? Go read it.

    Beyond that, if you want to get a deeper sense of the train of thought behind the effort, take a dip into the archive of EEP-related blog posts here at e-Literate.

  • Carnegie Mellon and Lumen Learning Announce EEP-Relevant Collaboration

    Late last week, Carnegie Mellon University (CMU) and Lumen Learning jointly issued a press release announcing their collaboration on an effort to integrate the Lumen-developed RISE analytical framework for curricular materials improvement analysis into the toolkit that Carnegie Mellon announced it will be contributing via open licenses (and unveiling at the Empirical Educator Project (EEP) summit that they are hosting in May).

    To be clear, Lumen and Carnegie Mellon are long-time collaborators, and this particular project probably would have happened without either EEP or CMU’s decision to contribute the software that they are now openly licensing. But it is worth talking about in this context for two reasons. First, it provides a great, simple, easy-to-understand example of a subset of the kinds of collaborations we hope to catalyze. And second, it illustrates how CMU’s contribution and the growth of the EEP network can amplify the value of such contributions.

    RISE

    The RISE framework is pretty easy to understand. RISE stands for Resource Inspection, Selection, and Enhancement. Their focus is on using it to improve Open Educational Resources (OER) because that’s what they do, but there’s nothing about RISE that only works with OER. As long as you have the right to modify the curricular materials you are working with—even if that means removing something proprietary and replacing it with something of your own making—then the RISE framework is potentially useful.

    From the paper:

    In order to continuously improve open educational resources, an automated process and framework is needed to make course content improvement practical, inexpensive, and efficient. One way that resources could be programmatically identified is to use a metric combining resource use and student grade on the corresponding outcome to identify whether the resource was similar to or different than other resources. Resources that were significantly different than others can be flagged for examination by instructional designers to determine why the resource was more or less effective than other resources. To achieve this, we propose the Resource Inspection, Selection, and Enhancement (RISE) Framework as a simple framework for using learning analytics to identify open educational resources that are good candidates for improvement efforts.


    The framework assumes that both OER content and assessment items have been explicitly aligned with learning outcomes, allowing designers or evaluators to connect OER to the specific assessments whose success they are designed to facilitate. In other words, learning outcome alignment of both content and assessment is critical to enabling the proposed framework. Our framework is flexible regarding the number of resources aligned with a single outcome and the number of items assessing a single outcome.


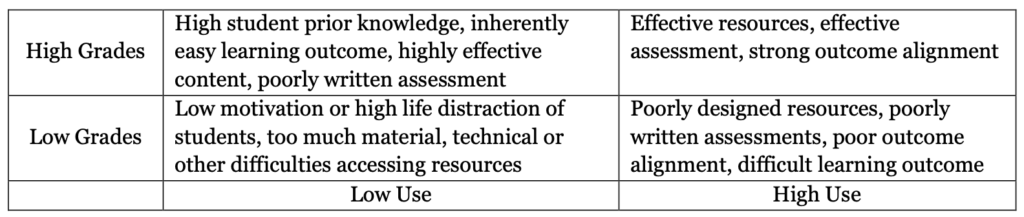
    The framework is composed of a 2 x 2 matrix. Student grade on assessment is on the y-axis. The x-axis is more flexible, and can include resource usage metrics such as pageviewstime spent, or content page ratings. Each resource can be classified as either high or low on each axis by splitting resources into categories based on the median value. By locating each resource within this matrix, we can examine the relationship between resource usage and student performance on related assessments. In Figure 2, we have identified possible reasons that may cause a resource to be categorized in a particular quadrant using resource use (x-axis) and grades (y-axis).

    Figure 2. A partial list of reasons OER might receive a particular classification within the RISE framework.

    By utilizing this framework, designers can identify resources in their courses that are good candidates for additional improvement efforts. For instance, if a resource is in the High Use, High Grades quadrant, it may act as a model for other resources in the class. If a resource falls into the Low Use, Low Grades quadrant, it may warrant further evaluation by the designers to understand why students are ignoring it or why it is not contributing to student success. The goal of the framework is not to make specific design recommendations, but to provide a means of identifying resources that should be evaluated and improved.

    Let’s break this down.

    RISE is designed to work with a certain type of common course design, where content and assessment items are both aligned to learning objectives. This design paradigm doesn’t work for every course, but it works for many courses. The work of aligning the course content and assessment questions with specific learning objectives is intended to pay dividends in terms of helping the course designers and instructors gain added visibility into whether their course design is accomplishing what it was intended to accomplish. The 2×2 matrix in the RISE paper captures this value rather intuitively. Let’s look at it again:

    Each box captures potential explanations that would be fairly obvious candidates to most instructors. For example, if students are spending a lot of time looking at the content but still scoring poorly on related test questions, some possible explanations are that (1) the teaching content is poorly designed, (2) assessment questions are poorly written, or (3) the concept is hard for students to learn. There may be other explanations as well. But just seeing the correlation that students are spending a lot of time on particular content are still doing poorly on particular related assessment learning questions leads the instructor and the content designer (who may or may not be the same person) to ask useful questions. And then there is some craft at the end about thinking through how to deal with the content that has been identified as potentially problematic.

    This isn’t magic. It’s not a robot tutor in the sky. In fact, it’s almost the antithesis. It’s so sensible that it verges on boring. It’s hygiene. Everybody who teaches with this kind of course design should regularly tune those courses in this way, as should everybody who builds courses that are designed this way. But that’s like saying everybody should brush their teeth at least twice a day. It’s not sexy.

    Also, easy to understand and easy to do are two different things. Even assuming that your curricular materials are designed this way and that you have sufficient rights to modify them, different courses live in different platforms. While you don’t need to get a lot of sophisticated data to do this analysis—just basic Google Analytics-style page usage and item-level assessment data—it will take a little bit of technical know-how, and the details will be different on each platform. Once you have the data, you will then need to be able to do a little statistical analysis. There isn’t much math in this paper and what little there is isn’t very complicated, but it is still math. Not everybody will feel comfortable with it.

    The typical way the sector has handled this problem has been to put pressure on vendors as consumers to add this capability as a feature to their products. But that process is slow and uncertain. Worse, each vendor will likely implement the feature slightly differently and non-transparently, which creates a greater challenge for the last point of friction. Features like this require a little bit of literacy to use well. Everybody knows the mantra “correlation is not causation,” but it is better thought of as the closest thing that Western scientific thinking can get to Zen koan. ((Outside of quantum mechanics, at least.)) If you think you’ve plumbed the depths of meaning of that phrase, then you probably haven’t. If we want educators to understand both the value and the limitations of working with data, then they need to have absolute clarity and consistency regarding what those analytics widgets are telling them. Having ten widgets in different platforms telling them almost but not quite the same things in ways that are hard to differentiate will do more harm than good.

    And this is where we fail.

    While the world is off chasing robot tutors and self-driving cars, we are leaving many, many tools like RISE just lying on the floor, unused and largely unusable, for the simple reason that we have not taken the extra steps necessary to make them easy enough and intuitive enough for non-technical faculty to adopt. And by tools, I mean methods. This isn’t about technology. It’s about literacy. Why should we expect academics, of all people, to trust analytical methods that nobody has bothered to explain to them? They don’t need to understand how to do the math, but they do need to understand what the math is doing. And they need to trust that somebody that they trust is verifying that the math is doing what they think it is doing. They need to know that peer review is at work, even if they are not active participants in it.

    Making RISE shine

    This is where CMU’s contribution and EEP can help. LearnSphere is the particular portion of the CMU contribution into which RISE will be integrated. I use the word “portion” because LearnSphere itself is a composite project consisting of a few different components that CMU collectively describes as “a community data infrastructure to support learning improvement online.” I might alternatively describe it as a cloud-based educational research collaboration platform. It is probably best known for its DataShop component, which is designed to share research learning research data sets.

    One of the more recent but extremely interesting additions to LearnSphere is called Tigris, which provides a separate research workflow layer. Suppose that you wanted to run a RISE analysis on your course data, in whatever platform it happens to be in. Lumen Learning is contributing the statistical programming package for RISE that will be imported into Tigris. If you happen to be statistically fluent, you can open up that package and inspect it. If you aren’t technical, don’t worry. You’ll be able to grab the workflow using drag-and-drop, import your data, and see the results.

    Again, this kind of contribution was possible before CMU decided to make its open source contribution and before EEP existed. They have been cloud hosting LearnSphere for collaborative research use for some time now.

    But now they also have an ecosystem.

    By contributing so much under open license, along with the major accompanying effort to make that contribution ready for public consumption, CMU is making massive declaration to the world about their seriousness regarding research collaboration. It is a magnet. Now Lumen Learning’s contribution isn’t simply an isolated event. It is an early leader with more to come. Expect more vendors to contribute algorithms and to announce data export compatibility. Expect universities to begin adopting LearnSphere, either via CMU’s hosted instance or their own instance, made possible the full stack being released under an open source license. This will start with the group that will gather at the EEP summit at CMU on May 6th and 7th, because one has to start somewhere. That is the pilot group. But it will grow. (And LearnSphere is only part of CMU’s total contribution.)

    With this kind of an ecosystem, we can create an environment in which practically useful innovations can spread much more quickly (and cheaply) which vendors regardless of size or marketing budget can be rewarded in the marketplace based on their willingness to make practical contributions of educational tools and methods that can be useful to customers and non-customers alike. Lumen Learning has made a contribution with the RISE research. They now want to make a further contribution to make that research more practically useful to customers and non-customers alike. CMU’s contributed infrastructure and the EEP network will give us an opportunity reward that kind of behavior with credit and attention.

    That is the kind of world I want to live in.

  • EEP, EDwhy, and Seeds

    So the news broke today about the Empirical Educator Project’s (EEP’s) year two experimental design, which we’re calling EDwhy. The “ED” stands for Educational Design,” so the full name means, basically, “Why is your educational design the way that it is?” It invites educators to interrogate their own designs and aspires to give them the tools to do so. Here is the press release.

    We have some good coverage to start you off from Inside Higher Ed and EdSurge. At IHE, Lindsay McKenzie goes broad. She starts with some good shoe leather work at Carnegie Mellon with some interviews. Pay close attention to the interview with Ken Koedinger, as he talks about (but does not name) a research finding called the doer effect, which I’m going to use as an example later in this blog post. She also provides a good refresher of the open source versus proprietary question that universities often face with substantial software intellectual property that they develop, and then touches lightly on EEP’s role with the EDwhy announcement at the end (although with a clutch statement from Duke’s Matthew Rascoff, who always seems to say the right thing with a lot of intellectual and moral clarity in very few words). If you’re looking to find a way into this story from the beginning in a compact way, Linday’s story one good route in.

    Meanwhile, Jeff Young at EdSurge has dug a little deeper into significance behind the EDwhy idea and mechanics. I think the question that is on everyone’s minds is, “OK, $100 million dollars, lots of software, cool learning science-y things, but really, how is this going to be made useful?” Jeff begins to explore that question, and I’m going to take a deeper dive in this post. He also has some commentary from me about why we chose the name we did. You’ll have to go read it on EdSurge to get those details, but I’ll say this much here: On e-Literate, where one of our major roles is to critique hype and protect against the dangers of  bad actors, we have an ethical obligation to throw some sharp elbows. With EEP, where we are not watching from the sidelines but actually entering the fray, we are mindful that our obligation shifts as our role shifts. We take the e-Literate lessons to heart while also attempting to be humble both about the accomplishments of those before us and how easy it is for us to fall into the same traps that very smart people before us have fallen victim to.

    But I don’t want to write about the naming decision too much here. Instead, I want to write about how we are going to attempt to live up to the humbling confidence that Carnegie Mellon expressed in us when they chose us as a partner in their grand project. Obviously, when they offered to make their enormous contribution through our fledgling organization, it both forced and empowered us to rethink how we would go about the project in Year 2. We had always planned to stop, evaluate, and iterate on the design after the first year, but this opportunity demanded a pretty dramatic rethink in approach which, to be honest, is still ongoing. We have an idea that I’m going to share with you now that I believe makes sense in concept but does not yet have a fine-grained implementation plan. We are working hard with our Carnegie Mellon friends to have a foundation in place by the time of the summit. We will also workshop the idea at the summit with the cohort to refine our approach. This is going to be a year-long project. So we expect to spend some time after the summit continuing to put pieces in place and fine-tuning as we go. At the end of the year, we will do a progress check, evaluate, and iterate.

    The Hackathon

    I am always mindful about appropriating terms from Silicon Valley culture because I think it tends to be reflexively idealized. That said, there is a lot to like about the educational value of a hackathon. It is a social, time-bounded, self-organizing, problem-based learning exercise. A group of people will get together to solve a defined problem over a period of time. That group is often cross-functional. They might have software engineers, user experience designers, end users, and so on. Hackathons have a tangible and several intangible goals. The tangible goal in the canonical case is a piece of software, but we can think of it more broadly as an artifact that has been tested and demonstrated to solve the problem that was the goal set out at the beginning of the exercise. The intangible goals often include learning how to work in a cross-functional team, learning how to solve difficult problems with unexpected wrinkles, and learning particular craft-related skills necessary to solve the problem (e.g., programming tricks or software testing techniques).

    This is a good model for the kind of culture building that EEP has always aspired to achieve and, I believe that inspired Carnegie Mellon to see us as a good fit for their own ambitions. While I want to be clear that I do not speak for them, my understanding of their goals from our conversations thus far is that it would be a mistake to interpret their primary goal to be broader adoption of their software and other tools. Sure, they want to see that happen. But my read is that they see that as a second-order effect, or maybe as means to an end. What I hear from them in our conversations is that they really want to make their approach to improving education broadly accessible and meaningfully useful. They call that approach “learning engineering,” which they seem comfortable with me characterizing as one flavor or methodology within a broader developing family that we call “empirical education.” The hackathon works to support this goal because it creates an environment in which people habitually self-organize in cross-functional groups to improve educational design in ways that empower greater student success. It brings together the right people around the right kinds of goals and conversations. If we can then empower them with the right tools and methods, we are on your way to promoting learning engineering. If we can achieve that,  we can unlock the real power of the big release, which is to help democratize the science of education.

    While I said I didn’t want to dwell on our name choice here, it’s probably worth spending a little time on the word “design” in the way we are using it in EDwhy. A number of different overlapping but distinct stakeholder groups in academia tend to compete for mindshare around this word—Design Thinking practitioners, Instructional Designers, Learning Designers, User Experience Designers, and others. Making sense of how these all connect yet are distinct from each other is non-obvious even before we get to culturally local differences in usage. To give one example, Herb Simon, in addition to being the father of Learning Engineering, is considered by some to be the grandfather of Design Thinking. These are two compatible but distinct and non-interchangeable disciplines. In most places outside of Carnegie Mellon, their practitioners tend to be either completely ignorant of each other or find themselves cast as rivals in educational solution design.

    “Design” in the EDwhy context is a holistic and colloquial term meaning, simply, the way you decided to put something together. A cross-functional EDwhy hackathon team might include people with knowledge of Design Thinking, Instructional Design, Learning Design, User Experience Design, and/or Learning Engineering. Who is at the table will depend on the specific nature of the challenge being tackled and the kinds of expertise needed to take it on.

    At any rate, as we started thinking about how to help our network digest Carnegie Mellon’s $100 million contribution—never mind the sum of all possible contributions from all current and future EEP participants—we started thinking about both the digestive process and coming up with a form that is digestible. Verbs and nouns.

    The hackathon is the verb. Theoretically, the hackathon is flexible enough to allow for projects of different sizes and ambitions, whether inter- or intra-institutional. We still very much want to encourage inter-institutional collaboration, but one lesson we learned last year is that inter-institutional collaboration is incredibly hard, even with a lot of work done by third parties to lower barriers. We have to build a gentle slope toward that level of collaboration. The hackathon is a form that lets people start small and grow in ambition. At some point, they will outgrow the form and need to form something more like a traditional project with more formal management structures.

    We aspire to reach the point where we have that problem. For now, we are focused on culture-building, and we hypothesize that the hackathon is a good ritual for accomplishing that while also delivering immediate educational utility.

    The Seeds

    The hackathon idea is simple enough to grasp in the abstract. The hard part is putting it together with the right packages that help people identify and solve new problems using the contributions from Carnegie Mellon or other participants. For this, we’ve developed the concept of an EDwhy “seed.” This is one of the pieces I will want to workshop with the EEP cohort, but there’s enough here conceptually that the general idea should be clear.

    We start with a general area of interest where some research has been done but where there are more questions to be answered. For example (and as I mentioned earlier, Ken Koedinger and his CMU colleagues have done some research into something called “the doer effect.” It means pretty much what it sounds like. The researchers were able to demonstrate, using solid, quantitative methods that learning by doing is, for example, about six times more effective than learning by watching a video.

    (Side note for all you liberal arts folks out there who are suspicious of this data stuff: This study more or less just made the case for constructivism. Using numbers and computers and statistics and stuff.)

    That’s an interesting finding, if not a shocking one, but it also highlights a lot that we don’t know. For example, is doing always better than watching a video (or reading) for learning? Should we throw out all books and videos? If not, then how much watching or reading is good? In what order? Does the subject matter make a difference? The expertise of the learner? Other characteristics of the learner? Other characteristics of the overall course design? Or course goals?

    Let’s make this more concrete. One of my favorite course designs is Habitable Worlds by ASU’s Ariel Anbar. There is a lot of learning by doing in that problem-based course, but also liberal use of video. It would be interesting to do some testing and experimentation to find out how to make the most out of the doer effect and find the optimal balance of the course elements.

    As it turns out, Carnegie Mellon’s contributions include the software that was used to conduct the original doer effect research. (The IHE article mentions LearnSphere. Spend a little time exploring that site if you’re curious.) That software includes a data repository with access to (appropriately anonymized) data that could be used to replicate the results (or try to run different analyses on the data), a visual workflow that makes the study easily repeatable with different data, and access to the underlying R packages (for those who can understand them) to make the research methods completely transparent. If you put together the original studies, the software, the workflows, the data to practice reproducing the results, the transparency of the methods, and wrap in some documentation, some training, and a number of suggested starter questions for investigation, you have a seed. A self-organizing community could take up that seed and develop a hackathon project. If there were also a community forum where the hackathon group could ask questions of statisticians, cognitive psychologists, and psychometricians, as well as some technical support folks, as well as share lessons learned with each other, then you could really have something.

    I’m guessing the net result might turn out to be what would call an “intermediate” seed. Not every team would have the capability to self-organize around something this complex. We’d like to develop beginner, intermediate, and advanced level seeds, where beginner seeds are approachable by non-technical groups, intermediate seeds might require some technical skill and some knowledge of experimental design, and advanced seeds are really for folks who have some serious specialist expertise in their groups. The I’ll defer on the final difficulty ratings of each seed, including the one I just described, to the creators and the early adopters. One skill set we will be learning in the EDwhy experiment is how to package up a seed to make it accessible and useful to different sorts of audiences. Eventually, we may develop profiles of hackathon teams that are richer than just beginner/intermediate/advanced.

    At any rate, our goal for the year is to prove out and refine the approach through some pilot seeds and hackathons. We don’t imagine that we will be able to address the entire surface area of Carnegie Mellon’s $100 Million contribution in the one-year time frame, but we do aspire to prove out a novel and sustainable support and diffusion mechanism, not only for the software but for the methods and the culture. And during this time, we will also invite other EEP members to develop and contribute their own seeds, some of which will be less technical or tackle entirely different types of educational problems than Carnegie Mellon’s seeds will. This is a general mechanism we will be trying out. Interestingly, another arrow that CMU has in its quiver is the Open Learning Initiative (OLI) authoring and delivery platforms. So we may very well find their contributions to seed development goes well beyond the open source software code, which I think is the way in which people are naturally tending to think about the contribution at this early stage in the process.

    Both learning and science—or any path to enlightenment, really—starts with a simple admission: “There is so much that I don’t know, and so much that I would like to understand better.” Big announcements like this generally run against the grain of that admission. We have an ingrained cultural notion that, after spending a $100 million, you are supposed know all the answers. After spending 7 years in graduate school, you are supposed to know all the answers. After getting all the press and all the buzz, you are supposed to know all the answers.

    Nope. Sorry. It doesn’t work that way.

    There is so much that we don’t know, and so much that we would like to understand better. If you keep repeating that mantra to yourself every time you hear something new about Carnegie Mellon’s contribution or about EEP or the EDwhy initiative, each new piece of information will make a lot more sense to you.

  • Carnegie Mellon’s $100 Million Announcement

    This is going to be a short post, in part because I’m traveling, but I need to call your attention to a developing story, both because it’s huge in its own right and for its importance to the Empirical Educator Project (which, by the way, has a new website).

    Carnegie Mellon has announced a $100 million contribution in tools, software, and content that “that is intended to catalyze a new era of progress in educational effectiveness that is equal to the challenge of rapid change and growth in 21st century educational needs. The suite of tools is the product of over $100 million of research and development from a wide variety of funders.”

    The suite of tools will be released in stages over the next year and represents a major departure from the “silver bullet” or “moon shot” efforts to revolutionize education with technology in recent years. Instead, the contribution is intended to democratize the science of learning and empower educators across the world to become citizen scientists. Carnegie Mellon’s goal is to provide knowledge of how to conduct applied educational research that classroom educators, researchers and educational technology companies can learn, apply, extend and share with the global educational community.

    “We live in a moment when our educational institutions are in danger of a catastrophic failure that we cannot afford. College and university closures are becoming regular occurrences, even as tuition and student debt rise to record levels,” said Norman Bier, executive director of the Simon Initiative.

    “This is happening at the same time that even highly educated people need to continue learning in order to keep their skills up-to-date, and when people all over the globe need increasing access to high quality educational opportunities through technology. In the face of these institutional and structural challenges, demonstrably improving outcomes and learning for students must be our foremost concern,” Bier said.

    I have lots of good things to say about this approach, but for a preview, you can go back and review my post about ed tech hype being in remission. This announcement is a little hard to parse because it’s just a down payment on a complex story, and because it’s a big price tag thing from a big engineering school, but trust me: this is not the same old thing.

    The full list of what is being released has yet to be announced, but I’ve seen it, and it is mind-blowing. The breadth and depth are pretty astonishing. In fact, one of Carnegie Mellon’s  biggest challenges will be explaining all of what’s in it. This isn’t a tool or a platform. It’s a collection that’s in the process of being knitted together into an ecosystem. And the way that people inhabit that ecosystem is what will really matter.

    There will be a lot more to say on that in the near future. The university is going to be revealing a lot of the details of their contribution at our second annual Empirical Educator Project summit, which they are graciously hosting on May 6th and 7th. We will have some announcements between now and then, likely a flurry of announcements (from us and from other parties) around the time of the summit itself, and will be releasing video of many of the talks after the summit afterward. There are also some reporters working this story, so I will keep running updates of those stories as they come out over at the new Empirical Educator Project site and periodically collect them in my updates here as well.

    Watch this space.