e-Literate

Present is Prologue

Category: Academics & Academia

The “Academics and Academia” category covers topics related the ways in which colleges and universities function that are relevant to technology-supported education. One key aspect covered here is pedagogy—how people teach—and how technology impacts teaching and learning.

But this category also includes more institutional aspects that are relevant to technology-supported education, such as how campus leadership supports (or doesn’t support) new initiatives, politics and bureaucracy that impact these efforts, and so on.

Finally, “Academics and Academia” covers commercial and non-profit services that provide support for technology-supported education initiatives, such as Online Program Management (OPM) companies.


  • Online Course Design Rubrics, Part 3: Now what?

    Online Course Design Rubrics, Part 3: Now what?

    Part 3 of 3: NOW WHAT?

    In Part 1 of this series we looked at and compared seven online course design rubrics as they are today. In Part 2 we looked at why these rubrics have become more important to individuals, programs, institutions, and higher education systems. In this segment, Part 3, I’ll review what’s missing from the rubrics, what’s next, and how various stakeholders are going, or should go, beyond what the current course design rubrics assess.

    Ease of use (product)

    Most of the rubrics have been shared with a Creative Commons license, making it easy to use or adapt them as a part of your institution’s online course redesign or professional development efforts. However, many of the rubrics also pose some challenges, two of which I’ll cover here: barreling and organization.

    Criterion Barreling: Possibly to reduce the number of criteria and/or to shorten their length, some of the rubrics use criteria that evaluate more than one aspect of a course. This issue, known as barreling, can make it difficult to use the rubric accurately to review a course, since a course may meet one part of a criterion, but not another. The Blackboard Exemplary Course Program Rubric addresses this challenge by assigning higher scores “for courses that are strong across all items in [a given] subcategory.” In their next round of revisions, rubric providers should investigate ways to decouple barreled criteria or move to holistic rubrics that ask reviewers to count the number of checkboxes checked in a certain category.

    Categorical Organization: As discussed when comparing the rubrics in Part 1 (WHAT?), each rubric provider organizes their course design criteria differently and has a different number of categories. This makes it difficult to go back and find what you need to fix. For example, most of the rubrics put criteria about clear instructions and links to relevant campus policies at the beginning, but Blackboard puts them at the end in its Learner Support category. Ultimately, the categories should be seen as a messy Venn diagram rather than a linear list.

    To increase meaning and motivation among online teachers and instructional designers, rubric providers should provide online versions of the rubrics to allow people to sort the criteria in different ways. For example, instructors and course designers could follow the backward design process as they build or redesign an online course. They would start with the objectives or outcomes, then confirm they ask students to demonstrate achievement of those objectives (assessment), then make sure they provide opportunities to practice (activities, interactivity, and assignments), then create and find course materials to support reaching the outcomes (content).

    Ease of use (process)

    Time for course review: Based on conversations with one of the CCC system’s trained faculty peer reviewers, the course review process involves a) going through an entire online course, b) scoring the rubric, and c) providing useful and actionable written feedback. This takes her an average of ten hours per course, which is analogous to what I have experienced myself–if you are going through an entire course, it’s going to take time. Like the CCC, institutions should train and compensate peer reviewers for the considerable time it takes to support their colleagues.

    Tools for course review: Earlier I mentioned that online course design rubrics a) take time to use, and b) do not make it easy to link from document-based rubrics and feedback to elements within an online course. LMS vendors should support online course review by repurposing existing LMS rubric tools and allowing reviewers to share feedback with online instructors. This would involve creating a rubric that sits above a course to review the course as a whole, as opposed to rubrics that sit within a course to review assignments. Reviewers should also be able to tag specific course materials, activities, and assessments in reference to the rubric scores and/or written feedback. If we can annotate PDF documents, images, and video clips (e.g., Classroom Salon, Timelinely), we should be able to do the same with an online course.

    Time for course revision: The course revision process takes time—several initiatives tied to the rubrics ask faculty to go through the review and redesign process over an entire academic term or summer break, before implementing the changes. Unless they are given release time, faculty complete this work in addition to their typical full load. For itinerant lecturers, this workload is spread across multiple institutions. Stipends can incentivize or motivate people to do the work, but release time actually may be more valuable to reaching the desired redesign goals quickly.

    Tools for course revision: Most of the organizations that have created these rubrics also offer related professional development and/or course redesign support—Quality Matters, SUNY, the CCC system’s @ONE unit, the CSU system’s Quality Assurance project, and UW LaCrosse all offer some level of training and support for people redesigning online courses. Systems like the CCC have moved to local Peer Online Course Review processes to address the bottleneck effect of one central organization having to support everyone.

    Exemplars

    Only one of the rubrics—the Cal State system’s QLT rubric—has a criterion related to showcasing samples of exemplary student work so students know what their work should look like. However, all of the online course design rubric providers should showcase what meeting and exceeding each rubric criterion looks like. By providing exemplars—courses, modules, materials, assessments, and activities—to novice and veteran online faculty alike, these initiatives would make it easier for those faculty to design or redesign their courses. For example, SUNY’s OSCQR initiative devotes a section of its website to Explanations, Evidence & Examples–there are links to examples for some (but not all) of the 50 criteria and a call for visitors to share their own examples through the OSCQR Examples Contribution Form. Other rubric providers may fold examples into their professional development workshops and/or resources, but public libraries of examples would allow a larger number of faculty to benefit.

    Engagement

    In the Limitations and Strengths section in Part 1, I mentioned that the majority of the online course design rubric criteria focus on reviewing a course before any student activity begins. Even criteria related to interaction and collaboration measure whether or not participation requirements are explained clearly or collaboration structures have been set up. However, when my program at SF State completed an accreditation application to create a fully online Master’s degree, one application reviewer made this comment and request: “Substantive faculty initiated interaction is required by the Federal government for all distance modalities. Please specifically describe how interaction is monitored and by whom.” Some institutions have created tools to estimate the time that will be devoted to student engagement:

    If both the research literature and the accreditation bodies state that interaction, community, and the like are critical to online student persistence and success, then the online course design rubric providers should provide more criteria for and guidance about reviewing faculty-student and student-student interaction after the course has begun.

    Further still, LMS providers need to make it possible for instructors to see an average feedback response time. The research shows that timely feedback is critical, but instructors do not have a dashboard that lets them see how long they take to rate or reply to students’ discussion posts, or post grades for assignments.

    Empowerment

    For the most part, the rubrics and related course redesign efforts focus on the instructor’s side of the equation. However, some research shows that online learners benefit from online readiness orientations (e.g., Cintrón & Lang, 2012; Lorenzi, MacKeogh & Fox, 2004; Lynch, 2001), and need higher levels of self-directed learning skills to succeed (e.g., Azevedo, Cromley, & Seibert, 2004). Therefore, rubric providers should add more criteria related to things like online learner preparation, scaffolding to increase self-direction, and online learner support.

    Equity

    While eliminating online achievement gaps is a goal for several state-wide initiatives, none of the rubrics compared in this article address equity specifically and/or comprehensively. In a future post I will outline how Peralta Community College District (Oakland, CA) developed the Peralta Equity Rubric in response to this void. As part of the CCC system, the Peralta team has already begun working with the CVC-OEI’s core team ((Disclosure: OEI is a client of MindWires, and I have been working directly with Peralta CCD.)) and its newest cohort that is focused on equity. If we keep seeing the highly positive (and thankful) reactions the Peralta team receives as it shares the rubric via conference presentations and virtual events, expect to see more institutions add equity to their rubrics in the near future.

    Efficacy

    As stated in the Evidence of impact section in Part 2, more rubric providers need to go beyond what got us to this point—i.e., “research supports these rubric criteria”—and validate these instruments further. It also would help the entire field for existing research to be made more visible. Reports like the Quality Matters updates to “What We’re Learning” (Shattuck, 2015) are a start. Now we need to see more research at higher levels of the Kirkpatrick scale, as well as more granular studies of how course improvements impact different sets of students (e.g., first-generation, Latinx, African-American, academically underprepared). Here is a list of impact research efforts to watch in the near future:

    • The CCC’s newly branded California Virtual Campus-Online Education Initiative plans to conduct more research in its second funding period (2018-2023), which just began last fall.
    • Fourteen CSU campuses are participating in the SQuAIR project—Student Quality Assurance Impact Research—to determine “the impact of QA professional development and course certification on teaching performance and student success in 2018-19 courses.” The SQuAIR project will analyze course completion, pass rates, and grade distribution data, along with student and faculty survey results.

    Enforcement

    Colleges and universities, community college districts, and state-wide higher education systems should review these rubrics (if they do not already use one) and kick off adoption initiatives that include training for faculty and staff alike. (Kudos if you are already doing this!) These efforts take time, money, and institution-level buy-in, but if online course enrollments continue to increase at the current rate, then institutions must invest in increasing student success across the board, not just with early adopters and interested online teachers.

    I’m not sure why all of the NOW WHAT? elements above begin with E, but I am sure that this list is not exhaustive. Further, while I primarily have focused on the rubrics themselves to maintain a reasonable scope for a blog post series, these rubrics are rarely used in a vacuum–the rubric providers and the institutions that adopt them have built robust professional development efforts that use the rubrics in different ways to increase student success. Keep an eye on the MindWires blog for more installments related to online course quality and supporting online student success.

    References for citations in this three-part series

  • Online Course Design Rubrics, Part 2: So what?

    Online Course Design Rubrics, Part 2: So what?

    Part 2 of 3: SO WHAT?

    Overview

    In Part 1 of this series, I compared seven online course design rubrics that are used by multiple institutions to improve the quality, accessibility, and consistency of individual courses. The institutions do this with an eye toward offering online degree programs, credentials, and certificates. Rubric comparisons are all well and good, but why is this an important topic now?

    Demand > Persistence > Success

    First, it’s about the numbers. By now, most people watching distance education have heard the statistics—while overall college enrollment is static or declining, enrollment in online courses and programs is growing dramatically. In Fall 2015, 5.95 million students—almost a third (29.8%) of higher education students in the United States—enrolled in at least one distance education course (NCES, 2018).

    Similarly, enrollment in online courses at a CCC district I work with doubled in five years, from roughly 9% to 18%. However, that increase in enrollment is offset by rates of student retention (roughly 75% complete a course) and student success (roughly 67% pass a course). Until the district can improve those rates (e.g., through improving course quality and supporting online learners), it is reluctant to add more online course offerings.

    In that Feb 12 article referenced in part 1, Phil Hill noted that improving online student success rates throughout the CCC system can be only partially attributed to the Online Education Initiative. If we look at that data further, success rates increased by 13% over a ten-year span. With only two in three students passing online courses, though, there is room for more improvement. (The fact that face-to-face success rates did not change over those ten years is a topic for another blog post.)

    Student Success = $

    It’s also (or soon going to be) about the money. As more students choose online courses and higher education funding models begin to stress successful completion as much as or more than enrollment, institutions cannot just leave it up to chance that online learners will persist and succeed on their own. If one in five course enrollments is online, and one in three students will take online courses, and the numbers keep growing, the rubrics and related efforts will play an even larger role.

    Moreover, while the rubrics focus at the course level, successful completion of online courses contributes to completion of degrees. The CSU system’s Graduation Initiative 2025, the CCC system’s Vision for Success, and the SUNY Completion agenda all point toward system-wide efforts to increase degree completion and eliminate equity and achievement gaps. It should be no surprise, then, that all three of these systems—three of the largest higher education systems in the country—have launched online course quality projects featuring rubrics.

    Course design rubrics and related professional development are becoming as important to the institutions themselves as to the students they serve, and the large-scale initiatives that support them all still have work to do. The Public Policy Institute of California summed up the situation fairly well:

    Our research suggests that a more data-driven, integrated, and systematic approach is needed to improve online learning. It is critical to move away from the isolated, faculty-driven model toward a more systematic approach that supports faculty with course development and course delivery. A systematic approach better ensures quality by creating teams of experts with a range of skills that a single instructor is unlikely to have completely. (Johnson, Cuellar Mejia, & Cook, 2015, p. 3)

    Multiple achievement gaps exist

    As colleges and universities address rapidly increasing distance education enrollments, they must also address two achievement gaps that often appear in the research:

    • Overall, online learners have lower retention and success rates than learners in face-to-face courses (Xu & Jaggars, 2014).
    • Achievement gaps are larger for some subpopulations of online learners—e.g., students who are male, who are academically underprepared, or who belong to specific ethnicity groups (Jaggars, 2014)

    Evidence of scale

    This comparison has become important for another reason: scale. Quality Matters and Blackboard serve international networks of systems and individual institutions with their rubrics, related professional development, and awards. Meanwhile, the California Community College (CCC) system, the California State University (CSU) system, the State University of New York (SUNY) system, and the Illinois Online Network (ION) all have led far-reaching efforts with their own, internally created rubrics and professional development training. Within the CCC system alone, the Online Education Initiative’s Consortium serves 56 campuses ((Disclosure: OEI is a client of MindWires.)), all of which have committed to reviewing and redesigning—with the rubric—20% of their online course offerings over two years.

    Evidence of impact (and the need for much more)

    A number of the rubric providers have made an effort to evaluate their respective rubrics’ impact. Currently, Quality Matters publishes “What We’re Learning” reports to synthesize the research about the impact of its rubric (e.g., Shattuck, 2015). Quality Matters also shares the largest number of studies focused on its impact—through the Quality Matters Research Library that can be searched by standard or keyword and a set of Curated Resources. Of these 25 curated studies, four studies appear to look at the highest level of Kirkpatrick’s Four Levels of Evaluation—i.e., those four studies look at the end results, or to what extent redesigning a course based on the rubric affects students completing and/or passing a course. An equal number of studies investigate Kirkpatrick’s third level, or changes in faculty behavior as a result of training and exposure to the rubric. The largest subset of these curated studies focuses on learner or teacher perceptions, motivation, and satisfaction, but I have not reviewed the entire library!

    In its 2018 grant proposal, the Foothill De Anza CCD team stated that “the OEI courses that are aligned to the [OEI Course Design] rubric, checked for accessibility and fully resourced have an average student success rate of 67.4%, which is 4.9 percentage points higher than the statewide average online success rate of 62.5%” (Nguyen, as cited in Foothill De Anza CCD, 2018, p. 4). Anecdotally, interviews with executive CCC stakeholders have identified that some online faculty also improved the quality of their face-to-face courses based on what they learned from the rubric.

    That said, the evaluation of OEI’s impact on student success is just a start. While that evaluation showed that rubric-reviewed and redesigned courses had better success rates compared to other online courses, the study did not identify a) which learners performed well or b) what aspects of the course design and/or facilitation helped specific subgroups of students who do not persist or succeed as much in online courses.

    Overall, however, we still know very little about the impact of these rubrics. With access to learner analytics capabilities in online learning environments, institutions, programs, and individual instructors should be able to track online course activity and results in real-time. In a recent email exchange with a colleague who works with big data, I proposed tags for learner analytics data within a learning management system. Here are three sets of tags that correlate to three of the rubric comparison categories with the most criteria—Instructional Design & Course Materials (Content), Collaboration and Interaction (Interactivity), and Assessment:

    • find/create/share/review/reflect on content
      • content + access: student downloads files, accesses online media via links, visits an LMS content page
      • content + share: student shares a new, unique, external resource related to course topics–e.g., via discussion post or common page (Google doc)–that he or she has found or created
      • content + review: student plays media–e.g., while you cannot guarantee the student is actually watching a video, you can tell that it has played for X minutes and/or it has been played Y times
      • content + engage: student has used digital tools to highlight, annotate, leave questions about text or media
    • engage in an individual activity or interactivity
      • activity + engage: student starts an individual learning activity
      • activity + complete: student completes an individual learning activity, such as a simulation
      • activity + share: student shares a new, unique, external learning activity related to course topics
      • interactivity + initiate: a) student initiates contact with other students–e.g., student sends a message to a group or posts a new discussion thread in a group space (or a general forum for the entire class)–and/or b) student creates an activity or environment for working with other students–e.g., creates a Facebook group, creates a group homepage in Canvas
      • interactivity + support: student helps a peer who has identified a personal obstacle or challenge
      • interactivity + contribute: student completes a task as part of a whole-class activity, group activity, or group project–e.g., reply to a peer in a discussion, submit a file in a group area for others to review
      • interactivity + summarize: student creates a summary of a group discussion, virtual meeting, or project
    • complete assessment (or self-assessment) activities
      • assessment + self: student completes a prescribed self-assessment activity (e.g., practice quiz)
      • assessment + complete: student completes a low-stakes assessment–e.g., quiz–or high stakes assessment–e.g., essay
      • assessment + peer: student provides feedback to another student–e.g., Turnitin peermark assignment
      • assessment + course: student submits feedback about the course–e.g., completes a mid-semester evaluation survey or student evaluation of teaching effectiveness survey, posts feedback for instructor in a general forum
      • assessment + reflect: student submits a reflection in an assessment context–e.g., posts a reflection with an ePortfolio artifact

    Of course, using LMS analytics data is not the only way to evaluate the effectiveness of rubric-guided course redesign (and universal design) efforts, but it’s an avenue that holds promise—especially if we can determine what leads to student success for individual students and different student subpopulations. In my own online class, I emailed a student who earned an A the semester after failing the course to congratulate him for his efforts. He told me one of the biggest factors in his success the second time around was how I redesigned the instructions for everything—it had made everything so much clearer to him. It turns out that in between the two semesters I had redone ALL of my content review prompts, and discussion and assignment instructions after learning about the Transparent Assignment Template by Mary-Ann Winkelmes from University of Nevada Las Vegas. It made me wonder—how many times do those types of changes make an impact without the instructor knowing? It’s time we started finding out.

    In Part 3 of this three-part series, NOW WHAT?, I point out some new or upcoming research, as well as call for much, much more evidence about the impact of these rubrics and their individual criteria a) at the highest levels of Kirkpatrick’s model, b) over time, and c) on specific populations of students.


    References for citations in this three-part series

  • Online Course Design Rubrics, Part 1: What are they?

    Over the past few years, the team at e-Literate has reported on online course quality and common challenges online learners face. In late 2016, Phil Hill described and shared “explainer videos” that outlined how system-wide online course exchanges and their shared social infrastructure can help increase access and improve quality. Almost a year ago Phil conducted an informal, internal review of two online courses at Rio Salado College, in which he reviewed online course quality in light of the Making Digital Learning Work report by Arizona State University and the Boston Consulting Group. In a more recent (February 12) article, Phil discussed online education challenges and potential solutions—specifically, 1) community college students face a number of challenges in online course environments and 2) institutions address some of those challenges through online course design efforts at scale.

    Currently, the primary method to scale online course quality is through the use of rubrics that inform online course (re)design. Understanding the rubric field is critical for educational institutions that a) want to offer quality online programs, credentials, and/or certificates, and b) want to increase online student success rates.  To support these institutions—especially those that do not yet use a rubric at scale—as well as the rubric providers themselves, I conducted a review of the most widely used online course design rubrics, which I have turned into a three-part series:

    • Part 1: WHAT? A comparison of the seven most widely used online course design rubrics, along with their collective strengths and limitations
    • Part 2: SO WHAT? A discussion of why using these rubrics has become so important, and some early evidence of impact
    • Part 3: NOW WHAT? Recommendations for what the rubric providers and adopters should do next to increase online student success further

    Part 1 of 3: WHAT?

    Overview

    My investigation of online course design rubrics began with exposure to two rubrics at the same time:

    I also knew about Quality Matters and wanted to explore the full range of rubrics used to support quality at scale. Curiosity did not kill any cats, but it led to search results listing several online course design rubrics*, each of which is used by multiple institutions (see Table 1).

    TABLE 1. Online course design rubrics used by multiple institutions

    Rubric Last Revised Rubric license Rubric provider Rubric provider type
    Online Education Initiative – Course Design Rubric (OEI CDR) 2018 CC BY CCC California Virtual Campus-Online Education Initiative Higher ed institution
    Blackboard Exemplary Course Program Rubric (Bb ECPR) 2017 CC BY-NC-SA Blackboard Commercial
    Open SUNY Course Quality Review Rubric (SUNY OSCQR) 2016 CC BY Open SUNY (State University of New York) Higher ed institution
    California State University – Quality Learning & Teaching Rubric (CSU QLT) 2016 CC BY-NC-SA California State University system Higher ed institution
    Quality Matters – Higher Ed Course Design Rubric (QM HE CDR) 2018 Subscription fee Quality Matters Non-profit org
    Illinois Online Network – Quality Online Course Initiative Rubric (ION – QOCI) 2018 CC BY-NC-SA Illinois Online Network Higher ed institution
    UW-La Crosse Online Course Evaluation Guidelines (UWL OCE) 2014 License not stated University of Wisconsin -La Crosse Higher ed institution

    * NOTE: New Mexico State University also created a rubric that at one time was referenced by other schools but has since switched to Quality Matters.

    Speed of change

    While some of these online course design rubrics date back twenty years, their promotion and use at different levels—institution, district and system—really has ramped up in the last five years. To emphasize this point, consider the following. Baldwin, Ching and Hsu (2018) compared six of the seven rubrics listed in Table 1 above. Five of those six rubrics have been updated since those authors completed their study in July 2017. [NOTE: Ironically, the rubric comparison study did not appear in any of my search results. I only found it as a link from the OSCQR Resources.]

    Depending on what milestone you choose as a starting point, people have been completing online courses for thirty years or so. For those of you wondering why we have not gotten online course quality figured out by now, keep in mind that face-to-face courses in higher education began over 1000 years ago and to date do not undergo as much evaluation.

    Influences

    Most of the seven rubric providers cite the Rubric for Online Instruction (created by California State University, Chico) and some credit the Quality Matters framework as influences used to create their own rubrics. Some also cite Universal Design for Learning principles, the Community of Inquiry framework, and the National Survey of Student Engagement. Interestingly, more than one rubric cites as an influence the Seven Principles for Good Practice in Undergraduate Education outlined by Chickering and Gamson (1987), which was published just before the first online courses launched. Almost thirty years later, Crews, Wilkinson, and Neill (2015) applied these seven principles to online courses.

    What the rubrics evaluate

    Each rubric is broken into broad categories—ranging from three to ten, depending on the rubric. Across all seven rubrics there are fourteen categories in all, one of which I have created. For this comparison, I reorganized each rubric to put comparable criteria in the same categories for consistency, and repeated criteria that measure more than one aspect of an online course. Table 2 shows how many criteria each rubric includes in each comparison category. (Bold numbers signify a rubric has 7 or more criteria in that category; italicized numbers signify a rubric has 2 or fewer criteria in that category.)

    TABLE 2. Number of criteria each rubric includes per comparison category  

    Rubric Comparison Category OEI CDR Bb ECPR SUNY OSCQR CSU QLT QM HE CDR ION QOCI UWL OCE
    Course Overview and Information 5 8 10 9 9 10 4
    Learning Objectives 4 3 1 1 5 2 2
    Instructional Design & Course Materials 4 9 5 7 6 12 10
    Individual Learning Activities 1 2 2 0 0 1 0
    Collaboration and Interaction 3 10 4 6 4 13 7
    Facilitation 1 0 0 7 0 0 12
    Assessment 9 12 9 7 7 23 7
    Learner Support 3 1 1 5 3 3 2
    Accessibility, Usability, Universal Design, & Inclusivity 17 9 13 6 6 6 5
    Course Summary 0 1 0 3 0 0 4
    Course Evaluation 0 0 0 0 0 0 3
    Course Technology 2 6 4 4 4 7 4
    Web Design or Course Layout 0 0 4 0 0 7 1
    Mobile Platform Readiness 0 0 0 4 0 0 0

    Quantitatively, this allows us to see what aspects of online teaching each rubric emphasizes, which categories are well covered by every rubric, and which categories are not emphasized enough overall. For example, all seven rubrics have several criteria related to assessment, but only two rubrics—QLT by the CSU system and OCE by UW LaCrosse—address an online instructor’s facilitation strategies. Similarly, all seven rubrics have several criteria related to accessibility, but on the whole they pay little attention to individualized learning activities.

    To what extent does research support rubric criteria?

    Beyond how many criteria each rubric offers in a specific category, though, how well does learning design research and learning science support usage of these rubrics? Since MindWires leads the Empirical Educator Project—an effort to promote broader adoption of evidence-based teaching practices—I went through a number of research articles and research literature reviews. My goal was to identify correlations between a) the aggregate set of rubric criteria and b) online course design factors (or online teaching techniques) that have increased student engagement, motivation, persistence, success, etc. Below is a representative sample of what I found.

    • The CCC Chancellor’s Office (2013, p. 23) identified factors that affect student persistence in online courses, which I have ranked according to the amount of instructor influence to facilitate (from most influence to least influence):
      • Increased communication with instructor
      • Sense of belonging to learning community
      • Student satisfaction with online learning
      • Time management skills
      • Peer/family support
    • A number of research articles (CCCCO, 2013; Crews, Wilkinson, & Neill, 2015; Hart, 2012; Nash, 2009; Orso & Doolittle, 2012; Ragan, n.d.; Savery, 2005) show that the online instructor plays one of the biggest roles in student retention and/or success. Two examples include:
      • The CCC Chancellor’s Office (2013) identified faculty-student interaction and increased communication with the instructor as key factors in student success.
      • Communication/availability rated as the top characteristic of an outstanding online teacher, followed by compassion, organization and feedback (Orso & Doolittle, 2012).
    • In addition to interaction/communication with the online instructor, Lister (2014) shared the results of a comprehensive literature review identifying key factors that affect online learner success:
      • Course organization and structure
      • Content presentation
      • Opportunities for collaboration and interaction
      • Timely and effective instructor feedback

    In Table 3 below, I’ve started the process of aligning research articles with rubric criteria in common rubric categories. While the research supports the concepts, though, not every rubric actually addresses them to the extent that the research dictates. For example, four of the seven rubrics have a criterion related to timely instructor feedback, but two of the four stop short at simply sharing expectations for timely feedback. Those rubrics do not measure whether or not faculty actually give timely feedback.

    TABLE 3. Research literature supporting rubric criteria 

    Common rubric categories Research literature supporting rubric criteria in those categories
    Instructional Design & Course Materials Ragan, Orso & Doolittle, 8 studies cited by Lister
    Interaction & Collaboration CCCCO, Crews et al., 9 studies cited by Lister
    Assessment Feedback: CCCCO, Lister, Crews et al., Orso & Doolittle, Hart, & more
    Learner support CCCCO, Crawley, & more

    Some rubric providers also allude to or directly reference other literature that supports the inclusion of rubric criteria. For example:

    On the flip side, the research identifies practices that the rubrics do not address much or at all. For example, several studies show increased success when institutions require students to participate in a course-level orientation or module-based introduction to online learning (Cintrón & Lang, 2012; Lorenzi, MacKeogh & Fox, 2004; Lynch, 2001). However, there are very few criteria across the rubrics that address helping students assess and address their online learning readiness.

    Limitations and strengths

    As far as limitations go, all of the rubrics focus heavily on reviewing courses before they begin—i.e., before the students show up. While all seven rubrics also have criteria related to interaction, those criteria largely address activity set up, clarity of activity instructions, and other factors that can be reviewed without the students being in the course. Only two of the seven rubrics—CSU QLT and UWL OCE—really look at instructor facilitation.

    Given these limitations, the rubrics do provide great value. Ultimately, these rubrics represent the current thinking about improving the quality of online courses. Some of the rubrics have evolved over twenty years and will continue to do so. The rubrics’ strengths manifest at different levels—for individual instructors, a rubric acts as a course design guide; for institutions and systems, a rubric creates a common vocabulary, an aspirational worldview, a mechanism for consistency and accountability, and the basis for a social infrastructure that runs parallel to the technological infrastructure.

    In Part 2 of this series, SO WHAT?, I will look at why these rubrics are important for improving online course quality at scale, and how well rubric providers have evaluated the effectiveness of their instruments.


    03/20/2019 UPDATE – Table 1: Changed Rubric Provider Type for Quality Matters to Non-profit organization.

    References for citations in this three-part series

  • Flawed AEI Report on Online Education: The good, the bad, and the ugly

    Flawed AEI Report on Online Education: The good, the bad, and the ugly

    To paraphrase the intro paragraph from January’s post on the George Mason University report, another year month and another deeply flawed report about online education in US higher education, this time by Di Xu (assistant professor of educational policy and social context at the University of California
    Irvine and a visiting fellow at AEI) and Ying Xu (Ph.D. candidate at the School of Education at the University of California Irvine). The report is titled “The promises and limits of online higher education: Understanding how distance education affects access, cost, and quality”.

    AEI Report Cover

    While the supply and demand for online higher education is rapidly expanding, questions remain regarding its potential impact on increasing access, reducing costs, and improving student outcomes. Does online education enhance access to higher education among students who would not otherwise enroll in college? Can online courses create savings for students by reducing funding constraints on postsecondary institutions? Will technological innovations improve the quality of online education?

    This report finds that, to varying degrees, online education can benefit some student populations. However, important caveats and trade-offs remain.

    In many ways this report takes a similar approach to the GMU report and a prior one by Caroline Hoxby from Stanford University, which was subsequently withdrawn, in asking important questions but providing flawed analysis to support conclusions. The problems with the American Enterprise Institute (AEI) report lie in its description of the history of online education and the 50 percent rule, the usage of data to describe the “supply side” of online, and some misinterpretations of IPEDS data. The flaws are hard to overlook, which is a shame, in that much of the qualitative discussion on online education provides a nuanced set of answers to the questions posed above.

    The Good

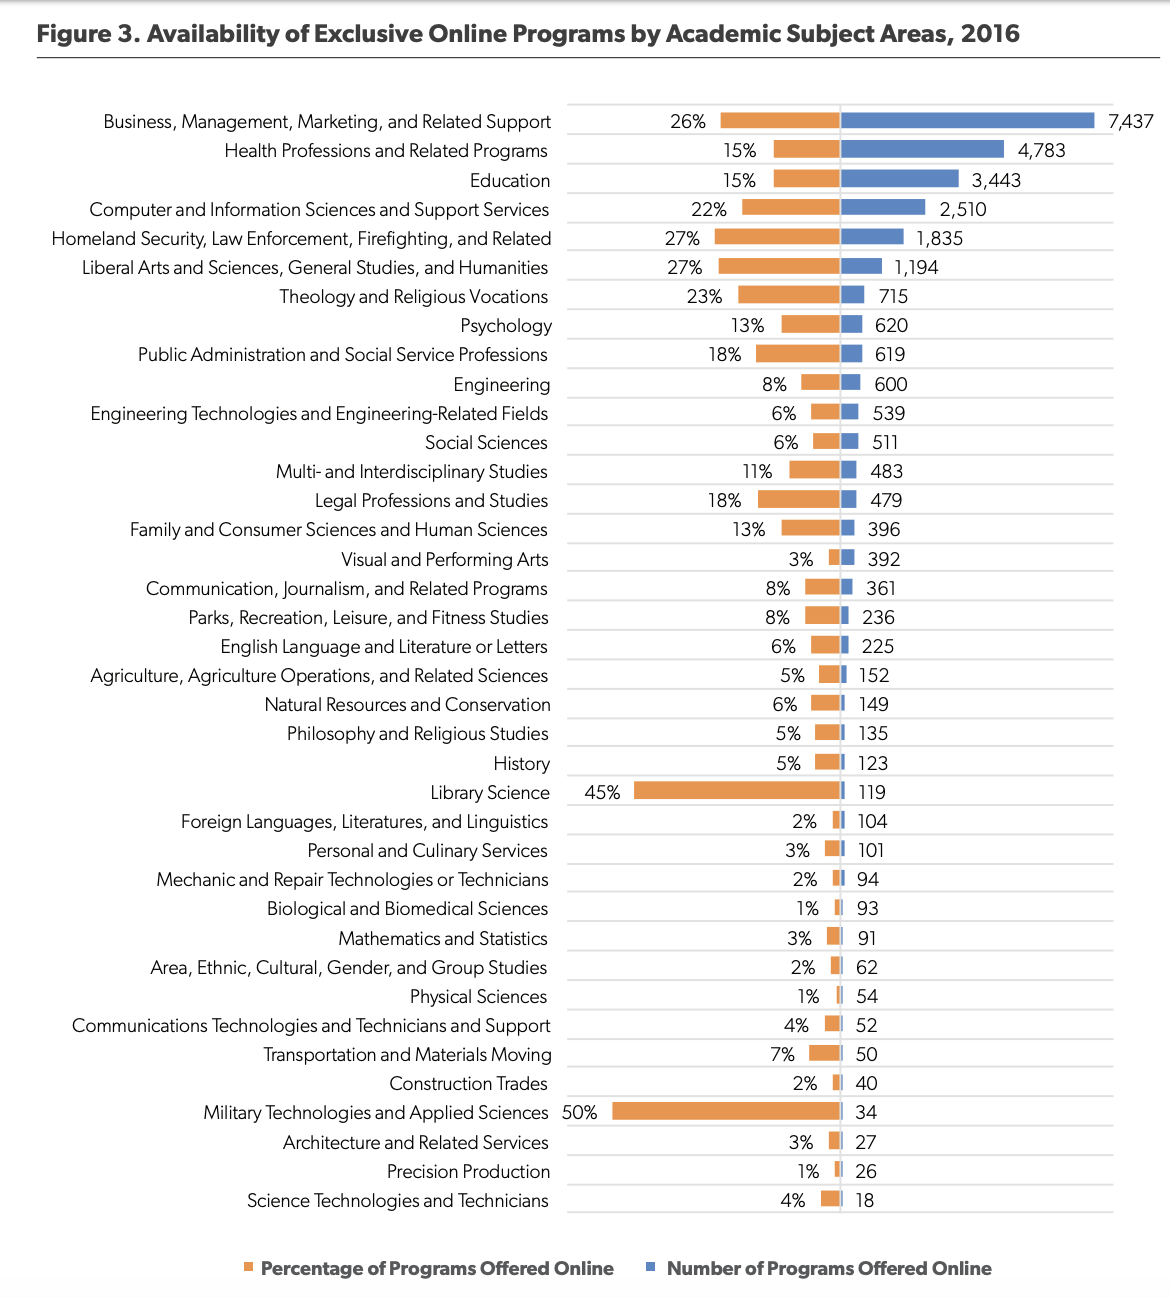
    The AEI report takes a look at a little-used portion of the IPEDS data set – The Completions survey and its program-level data on whether an institution offers certain programs at all and whether they are offered as a fully online (distance education) offering. This data has its flaws, which we’ll get to below, but it was quite interesting to get a summary view at the program level.

    program-level AEI summary of IPEDS data for online

    After a relatively solid discussion of research findings on Online Education and Student Outcomes, which summarizes positive and negative results along with the context and limitations of the relevant research, the report presents its discussion of known strategies to improve online education. This is a welcome relief, as many studies view online as a conclusion to be made about online vs. face-to-face, while this one summarizes known methods to continue improvements of a necessary modality.

    Based on the growing knowledge regarding the specific challenges of online learning and possible course design features that could better support students, several potential strategies have emerged to promote student learning in semester-long online courses. The teaching and learning literature has a much longer list of recommended instructional practices. However, research on improving online learning focuses on practices that are particularly relevant in virtual learning environments. These include strategic course offering, student counseling, interpersonal interaction, warning and monitoring, and the professional development of faculty.

    The Bad

    The introduction relies heavily on the “50 percent rule” and 1998 and 2006 changes to this rule as key points in the expansion of online education. This regulation did have an effect, but so did a number of other factors not mentioned in the report. To make matters worse, the wording of the rule conflates students and institutions. For example, in an email conversation with Russ Poulin from WCET, he noted how the following is inaccurate:

    Sim­ilarly, the HEA also denied access to certain types of federal financial aid and loans for students who took more than half their courses through distance courses.

    yet this statement is accurate:

    …the rule dictated that institutions that offered more than 50 percent of their courses through distance edu­cation or enrolled more than half of their students in distance education courses would not be eligible for federal student aid programs.

    The regulation applied to institutions and in no way measured this usage at the student level. I find that this article from New America does a much better job describing this regulation’s history and impact.

    Update 3/8: Poulin also noted (see comment below):

    After talking to you Phil, the oddity of the 50% discussion being front and center hit me even more. The lifting of the 50% rule had an impact on only a small number of institutions. Several for-profits and a small number of non-profit and public universities. The vast growth in distance learning has primarily been in institutions that get nowhere near the 50% mark, so the change in that rule was not a direct influence in their decision to enter the distance education market. To place it front and center seemed odd to me and not a real reflection of the motivations for most college leaders.

    The report also confuses institutional vs. student level data in looking at per-state online statistics.

    Finally, considering that state-level policies may shape online learning in unique ways, Figure 13 shows online enrollment by state in the 2016–17 school year. Unsurprisingly, the most populated states, such as California, Florida, and Texas, also had the largest number of online course takers. Once accounting for between-state differences in overall higher education enrollment, four states have the largest share of students who enrolled in at least one online course in 2016: Arizona (61 percent), Idaho (52 percent), New Hampshire (58 percent), and West Virginia
    57 percent).

    This might be nitpicking, but the IPEDS data referenced is for institutions located in each state, not students located in each state. But a report trying to make sense of a complex subject should get this information correct and not add to the confusion.

    The Ugly

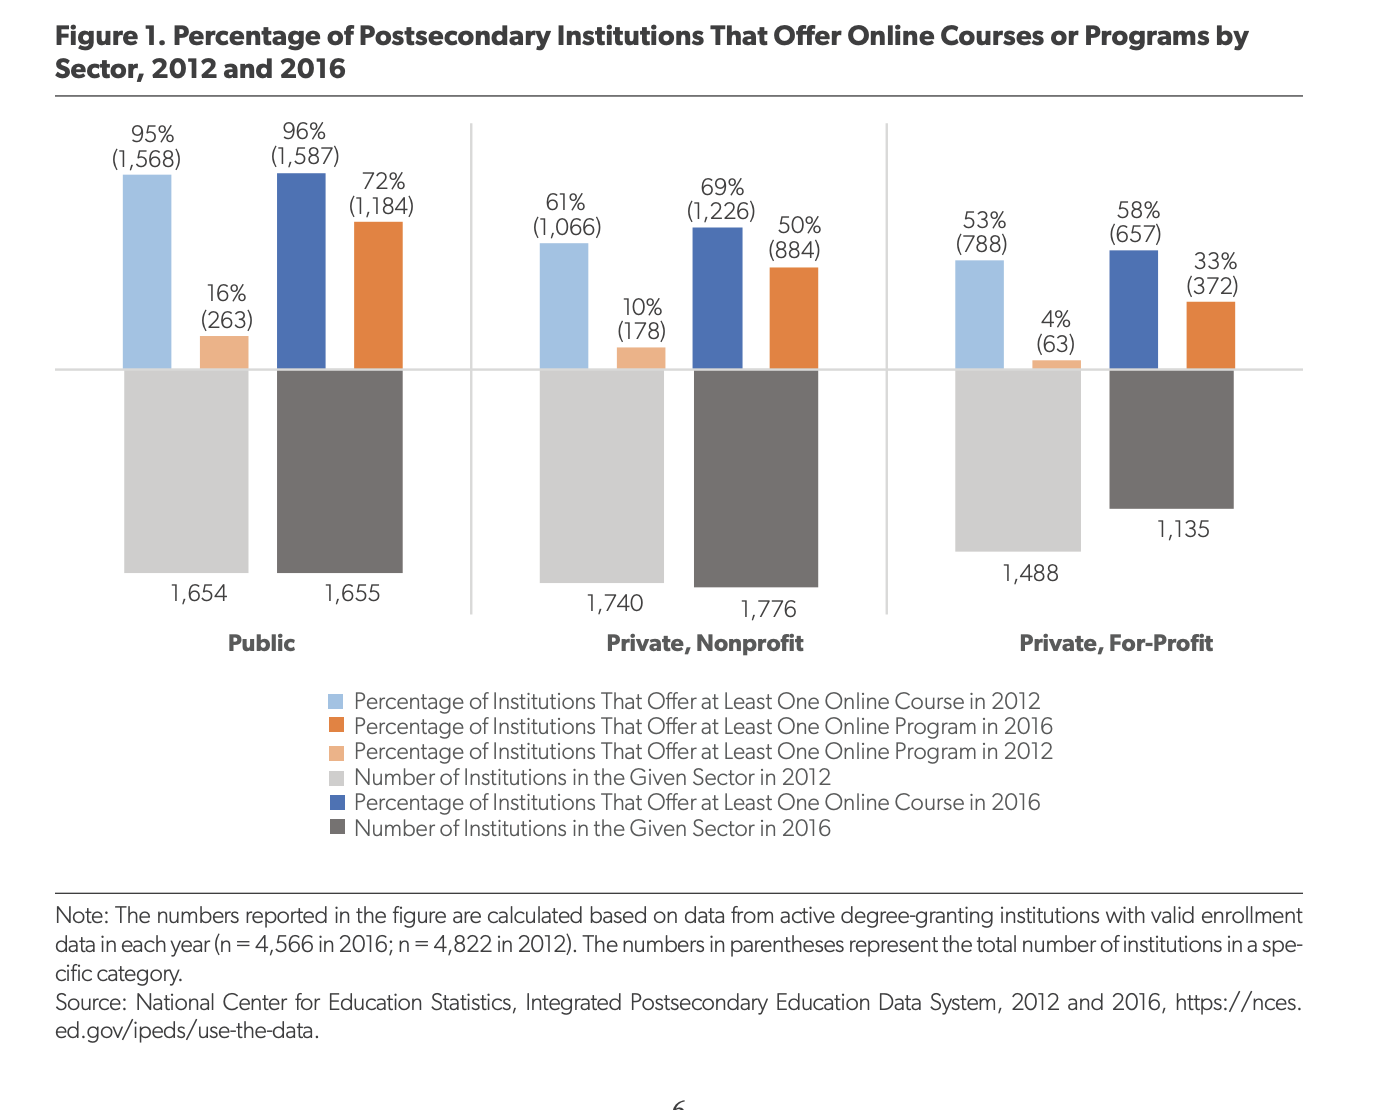
    The worst aspects of the report can be seen in figure 1 and an attempt to summarize changes in the supply side of online education. The authors chose to define the supply side as number of institutions offering at least one online course or one online program, using the aforementioned Completions / program-level data.

    AEI analysis of IPEDS dataI’ll wait while you take the necessary 5 minutes to decipher the worst color-legend usage in a chart that I’ve seen in years . . . Not yet? . . .

    When I shared this image on Twitter, Kevin Carey pointed out some results that seems non-sensical.

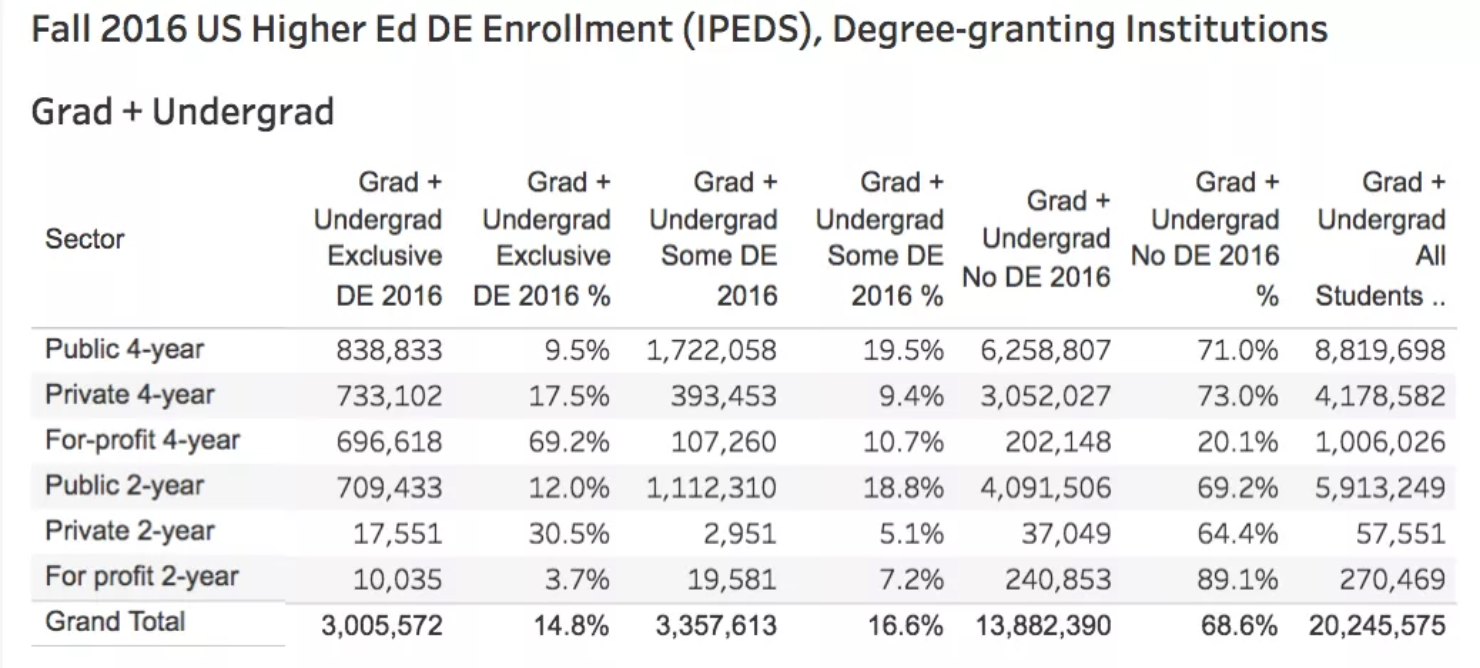
    The GMU report and the Stanford / Hoxby report made the more common mistake of essentially conflating online education with the for-profit sector, but this data makes little sense on the surface – implying that the for-profit sector offers relatively few online programs compared to public and private institutions. Looking at our 2016 IPEDS profile, you can see that 4-year for-profits by far have the greatest percentage of students in fully online programs (69%). How does AEI measure for-profits as much lower in offering fully-online programs?

    IPEDS 2016 data

    It took a while to figure out, but I think the authors made two mistakes. One is that they combined all for-profits together (2-year and 4-year), which is confusing since 2-year for-profits have the lowest usage of online education and a bunch of really small schools. This combination cuts the for-profit numbers dramatically. Look at the 2012 summary data below, where I show data for each sector and then combining 2-year and 4-year sectors together for public, private, and for-profit.

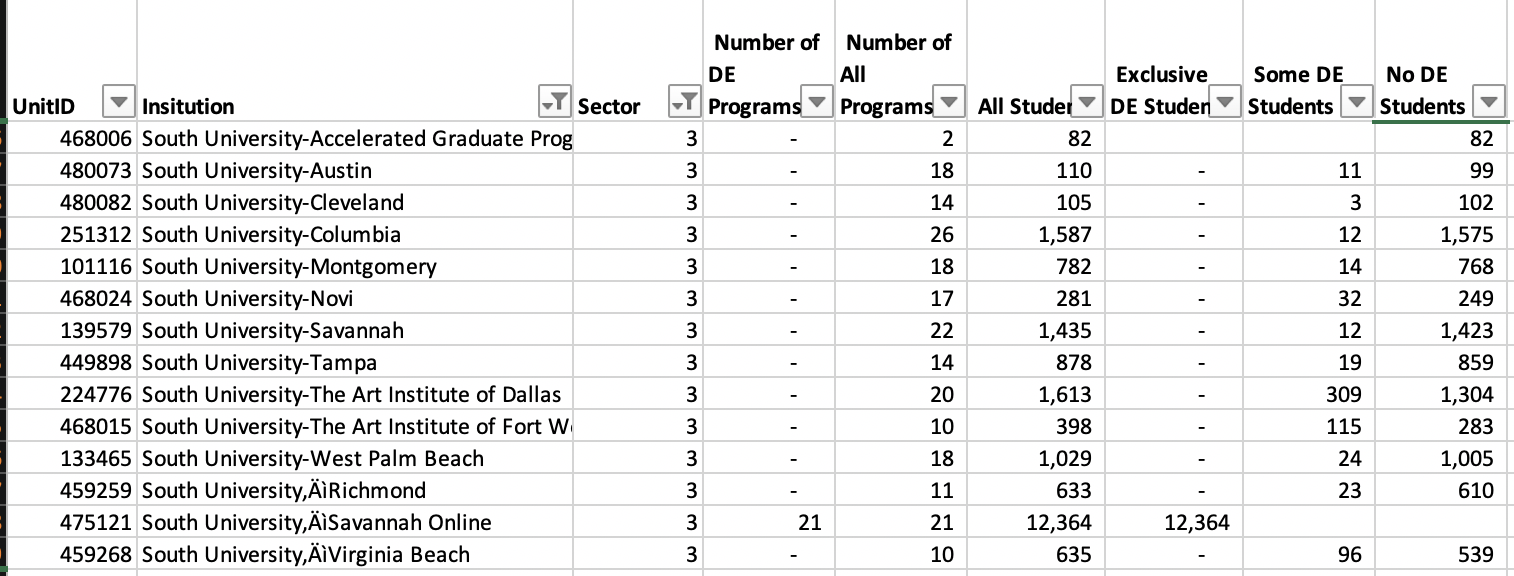
    The second issue is that simply measuring for-profits by institution using Completions program-level data is an unreliable approach to understanding online education supply, particularly for the for-profit sectors. Most for-profit systems own a number of smaller campuses, each with their own IPEDS code, yet the online programs are offered centrally by the system. And the Completions survey DE data has major holes in it. Consider South University (part of EDMC as of the 2012 data shown below):

    All 21 online programs are offered through the online campus, with over 12,364 taking exclusively DE courses and 8,898 taking no DE courses. Using the AEI methodology, 13 of the 14 institutions have no online courses or programs – almost no supply of online education in their language.

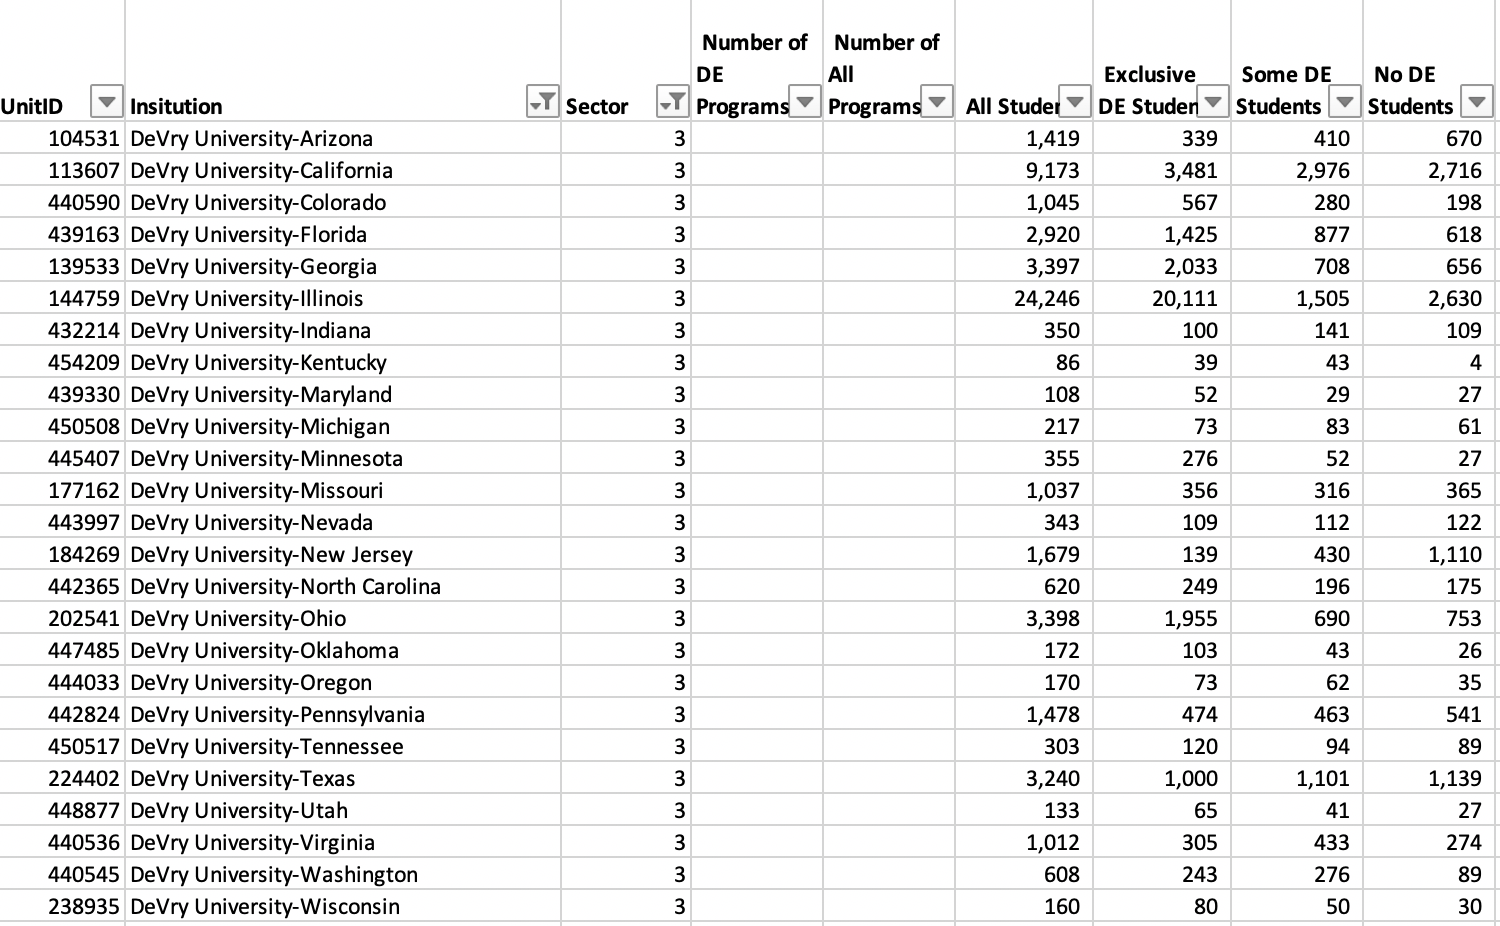
    Also consider DeVry University, which does not list a centralized online campus yet has significant online presence. For whatever reason, they report the student enrollment data per campus, but they did not fill out the Completions program-level data at all. Zero supply of online education in AEI’s approach.

    My therapists jumped in at this point and convinced me to not fully duplicate the AEI findings (serenity now!!!). What’s important here is that the basis of AEI’s description of online education supply, using institutional metrics that are dubious and ignore how the for-profit sector works, is flawed and misleading. Technically they used data in IPEDS, but they misunderstood its usage and limitations.

    Yes, there are valuable parts of this report. But like the GMU and Stanford reports, the flaws in analysis make it very difficult to separate the good from the bad and the ugly. This type of report from well-funded organizations aimed at policy-makers should inform, not confuse, but yet again we are faced with some serious flaws. We need better.

  • I’m Giving a Live-streamed Talk on Thursday at SUNY

    I’ll be giving a talk at the OpenSUNY conference tomorrow (Thursday) at 4:00 PM. The title of the talk is “Everything Old is New Again: What You Taught the OPM Companies.” But it’s about a lot more than that. SUNY was my first gig in higher education, after doing stints in K12 and corporate e-Learning, so it’s going to be a bit of a homecoming for me. I’ll be sharing some lessons learned over the intervening 14 years—for me and for them.

    The streaming URL is at http://opensunysummit2019.edublogs.org/mediasite/. I believe the video will also be available afterward for those who can’t catch the talk live.

  • Moodle Workplace: A new product and change in open source deployment

    Moodle Workplace: A new product and change in open source deployment

    Moodle unveiled its new product, Moodle Workplace, at the the Learning Technologies conference in London three weeks ago. While the open source Moodle LMS has been used by companies and organizations for employee training for years (approximately 40% of Moodle implementations worldwide according to this 2015 interview), Workplace represents a new approach for Moodle’s usage of open source deployment.

    Moodle Workplace

    Based on an email interview with Moodle Pty Ltd (aka Moodle HQ) CEO and founder Martin Dougiamas, Moodle Workplace is a “a series of well-written plugins that sit cleanly on top of the standard core distribution” and is being released under an open source GPL license. The plugins add functionality to:

    • Create training paths;
    • Create departmental structures and reporting;
    • Automate enrollment, certificates and other back end processes; and
    • Customize reporting and report delivery.

    From first reading, the Workplace functionality is a subset of the features available in other products, notably Totara Learning. That solution is also based on Moodle core, although Totara forked its code base more than three years ago. ((At the time of the fork, Totara management also predicted Moodle was planning to offer the market ‘Moodle for Workplace’.)) Workplace appears to be a solid, if somewhat unremarkable platform for organizational training delivery which can provide compliance tracking, learning pathways, and other business-focused features. For organizations looking to add training features to existing stock Moodle, Workplace should offer an easier migration path than Totara.

    The bigger news is the change in the distribution and business model as described by Dougiamas.

    We are restricting distribution to Moodle Partners for now so that we can give more value back to our Moodle Partners who invested time and money into it.

    Similar to Totara’s business model, there are limitations put on the Moodle Partners to prevent modification or distribution of the code. By providing Workplace only as a SaaS solution, Moodle is using the same distribution loophole in the GPL. ((For those unfamiliar with the peculiarities of open source licensing, Moodle and Workplace are released under the General Public License (GPL). The GPL requirement to release the source code ONLY applies if you are providing someone a copy of the binary. Providing software as a service does not constitute “distribution” under the GPL. This is how Google, Amazon, Facebook and all the other major internet players can build on open source, but not release their source code.)) The upshot is that if a company or organization wants to use Moodle Workplace, they have to work through a Moodle Partner and cannot download and install the software for free.

    The business model around Moodle Workplace is clearly a departure from the norm for Moodle, where the core GPL code is available to anyone, anytime, for free. But it is not clear whether this change in model for Workplace is a limited play or has broader applications that may impact education markets. In our interview, Dougiamas directly addressed our question on whether we should expect similar changes to Moodle core:

    No, we remain intensely committed to developing and improving Moodle core as a GPL product with the same license, open source practices and active community as now.

    He further stated:

    Our team developing Workplace have been contributing features (the more general ones) into core at the same time, and the plan is that any Workplace features that also supports sectors like Higher Ed or schools will always be migrated into core this way.

    So, what are educational institutions to make of the new business model around Moodle Workplace? We’re not entirely sure at this point. At a minimum, it would appear to be an attempt to better monetize the large installed base – a move to satisfy investors and to replace the Blackboard revenue after cancellation of their Moodle Partner agreement. At a more strategic level, it could be an attempt to stay competitive with peers, particularly SumTotal and Totara, who are going after the corporate learning space.

    If Workplace is successful, it will create a new revenue stream for Moodle HQ, potentially accelerating the development of the core educational product. A Moodle Partner we interviewed for this piece claimed they were already seeing increased lead generation from the announcement. The small and medium business (SMB) market is larger and generally has faster sales cycles than the education market, which could drive partner revenue and cash flows. The partners who are able to create sales momentum in both spaces and find their product / market niche are likely to see some accelerated growth. If this is successful, Moodle HQ should capture additional revenue and accelerate the product and service roadmap. This move directly addresses the issue Michael raised in the Fall about the termination of the Blackboard contract and revenue stream.

    For Moodle, everything rides on their ability to grow alternative sources of revenue. The company has been touting newer offerings such as MoodleCloud, MoodleNet, LearnMoodle, and MoodleServices. Since we don’t have any external evidence that these are material sources of revenue for the company, and since the company itself has not shared numbers that we can independently evaluate, it’s very hard to tell what their chances are. Moodle has a huge installed base, which gives the project a lot of momentum. But the company that drives most of the core platform development has a business model that has not aged well and is in the process of diversifying into business models that are as yet unproven. I remember enough physics to know that momentum and acceleration are not the same thing. I think the risks are probably greater for Moodle Pty. than they are for Blackboard. But both sides of the equation bear watching.

    Moodle Workplace as a monetization strategy seems to be a stronger bet than the previous offerings.

    The risk for education institutions, however, is that the Workplace development roadmap pulls resources from making investments in core Moodle necessary to keep pace with better-funded rivals. At worst case, Workplace fails to find a market niche and position itself in a crowded field. The opportunity cost of investing in Workplace vs other potential investments in the core education product and cloud services could end up having larger knock on effects downstream.

    What we have observed over the past 6 – 9 months is an increased customer focus by Moodle HQ, acknowledging the importance of market messaging (e.g. first-time presence at EDUCAUSE, announcing Workplace at London conference) and better understanding and satisfying business needs of revenue-generating Moodle Partners. The jury is still out on how these changes will impact financial sustainability and competitiveness of Moodle in education markets, but there is little doubt that there are changes in behavior.

    In the end, this is another example of corporate financial health issues having an outsized impact on the LMS market in 2018 – 2019. And one that bears watching, coming from the LMS provider with the world’s largest installed base.

    Update 3/6: Changed naming throughout to Moodle HQ instead of Moodle Pty to reflect more accurate and common usage. Also edited footnote about ‘Moodle for Workplace’ prediction to remove the implication of Moodle Workplace being a copy of Totara code.

  • Why Higher Ed Hypes: The MOOC Example

    People are funny.

    My last post was called “Is Ed Tech Hype in Remission?” It was about—surprise!—the interesting phenomenon of ed tech hype seemingly fading for the moment. I started the post by apparently breaking a little news. Civitas, the learning analytics company, had announced a new round of investment. A close examination of the details, coupled with some information from our sources, indicated that the company likely took a hit in valuation in that round. Since student success analytics has been a hyped product category, I used that bit of news as a jumping off point. And I used the phrase “fire sale” to characterize the downward valuation, although I was fairly clear that I didn’t even have enough information to confirm that it is a downward valuation. In and of itself, this downward valuation, if true—I’m fairly confident that it is—is mainly of interest to investors. I brought it up as an indicator the hype cycle in action rather than a signal of Civitas’ impending doom.

    There were lots of interesting and nuanced reactions in the comments thread on the post, on Twitter, and on LinkedIn. Elsewhere, the reaction has been different. There was some press coverage, some of which was good, and some less so. These are pretty nuanced issues. The easy part of the story to cover is not about the hype cycle or how to think about solving education’s hard problems but about whether Civitas is doing awesome or terribly. Customers, ex-customers, and of course, competitors have plenty to say about that. Sales reps for Civitas’ competitors are already out on the streets, weaponizing that post.

    Look, we have a sharp rhetorical style here on e-Literate. That isn’t going to change. We want to be clear, and we want to hold actors in this space accountable. But we also try to be nuanced. So here’s a tip for you: If you get a sales rep quoting us ripping one of their competitors, make sure you read the whole post. If it was primarily about holding that competitor accountable as a bad actor, that’s fair game. On the other hand, if it was an en passant observation made in the context of a larger discussion that wasn’t especially critical of the company—like my last post—then the use of our comment is more a reflection on the sales rep than of the company we were commenting on.

    Civitas has a lot of mindshare in the student success platform market category. That market category was overvalued, not mainly because of anything Civitas said or did but because higher education and ed tech investors alike have had a tendency to look for technological magic bullets. In fact, Civitas has sometimes actively resisted that hype trend, even to the point of choosing a name that can be interpreted to mean “community.” The only choice they made that I focused on in my post was their decision to market themselves as a software platform. Which was part of my point. One reason a company inclined to name itself “Civitas” might focus on selling itself as a platform company is because the market (and funders) can only make sense of them as a technological magic bullet. It’s a systemic problem.

    This wasn’t what I intended to write about, but it happens to fit perfectly with the main subject of the follow-up post I was planning to write. It was on my mind to say something about another sharp section of that post:

    One could argue that we hit peak ed tech hype in 2012. The Year of the MOOC. Remember how there were only going to be 10 universities in the world, and only one lecture for every subject, given by the very best lecturer in the world? Remember how everyone was going to get a Stanford education for free?

    Yeah. Good times.

    Since then, the hype cycles have been shorter and less intense. Sure, there was the whole adaptive learning bubble (or “personalized learning,” as it is inaccurately called), but a lot of that was the knock-on effect of a flood of Gates Foundation money. I never got the sense that there were many True Believers in adaptive learning as a magic bullet. There are still some True Believers in learning analytics, but it’s a small group. In fact, the OER True Believers club may now be larger than the learning analytics club.

    Mostly, people seem to be approaching all of these things—learning analytics, adaptive learning, OER, inclusive access, etc.—with a little more sobriety. These developments are all getting attention, but not a lot of hype (though not always for lack of trying). The general attitude among educators and institutions seems to be more like, “Huh. So that’s a thing now. Good to know. What can I do with it?”

    Gone are the days—at least for now—when provosts or presidents emerged from their offices all across the country and proclaimed, almost in unison, “Hear ye, people! I hath spake with the good people from Coursera, and they have shared with me the miracle of recording lectures in four-camera studios and giving away the courses for free. Huzzah! Huzzah! Let us be fruitful and make MOOCs with great haste!”

    Ouch.

    It’s true that some of the stuff that happened around MOOCs was objectively dumb. Phil has a good run-down of the research from both now and then. There were schools that rushed into projects and people—most infamously, Sebastian Thrun—who displayed astonishing hubris. Many of the people at the heart of MOOC mania, whether or not they were actively or intentionally participating in the hype, were really, really smart, and some of them had the best of intentions. I never got to know Thrun or Anant Agrawal—I’ve briefly met them both—but I’ve spent some significant time with Coursera’s Daphne Koller and Andre Ng. I like them both. A lot. In fact, I worried that the two of them, but especially Andrew, were too idealistic and too focused on doing good in the world to hold onto the reins of power in a VC-owned company with the kind of growth expectations that were put on Coursera. (I was probably right.)

    And the truth is that, in 2018, universities are still building, delivering, and experimenting with MOOCs. Students are still learning from the courses, and we are still learning from the form. There was and is nothing wrong with experimenting with MOOCs to see what we can learn about new ways to reach new students or better serve some of the students we reach today. Just as there is nothing wrong with experimenting with student success analytics to see what we can learn about new ways to identify students who need help sooner or find new ways to help them (or to enable them to help themselves).

    But why does experimentation come with the insanity so often? Why were MOOCs accompanied by MOOC madness?

    I don’t know for sure, and I suspect that the full answer is complex and related to pre-rational aspects of our thought processes as they evolved over millions of years. But here’s one simple and obvious part of the answer: 160,000. That’s roughly how many students took an early MOOC in artificial intelligence offered by Sebastian Thrun and Peter Norvig. It’s no coincidence, I think that the four founders of the pioneering MOOC organizations—Thrun, Agrawal, Koller, and Ng—are all computer scientists. For one thing, they all could do the math fairly quickly to recognize how long it would take them to reach that many students via more conventional means.

    You probably should be knocked a little bit off your axis by the notion of reaching 160,000 students all over the world with one class, particularly if you are an idealistic educator. We live at the first moment in history when it is conceivable to enable every human being to have access to education equal to their intellectual potential. That is what “160,000” represents. The possibility of a new mission for higher education and the potential dawn of a new era for humanity. So yeah, some people lost their minds for a while.

    It turns out that reaching all of those potential students effectively is not so simple, and doing so in a way that is organizationally sustainable is even harder. Heck, we haven’t even figured out how to fund educating all the people in our own states here in America. How are we going to fund educating everyone in the world? I’m not saying it can’t be done. I’m saying that we should have known it wouldn’t be so easy. And we should have known that video lectures wouldn’t be the answer. (Yes, yes, I know, many of us did. The point is, people lose perspective sometimes. I have over 15 years of blog posts on this site, so if anyone wants to point out times when I did, I’m sure they could find plenty of examples.)

    This is not a sufficient explanation for the ed tech hype cycle. I could list other subjects of hype that were…shall we say, not as understandably inspiring of irrational exuberance. But it’s a place to start. Educators typically want to do good. That includes educational professionals who happen to work for for-profit companies, by the way. In order to do so, they often have to deal with organizational psychology, business process management, budgets, politics, market forces, and a whole host of confusing and interacting systems that human minds are not very good at modeling. So we tend to latch onto simpler, and often shinier, explanations. Technology will save us. Evil companies are killing education. Education need to be disrupted.

    But the thing about chasing the hype is that it is exhausting and expensive. After a while, it wears you down. That’s what I think we’re in now. A period of exhaustion. We have enough people who have been burned enough times in rapid succession, and who are trying to solve enough serious and immediate problems, that they just can’t afford to be burned chasing the next shiny thing right now. They have to focus on solving the hard problems, because those are the real problems that just might move the needle for their respective institutions. That’s good news for almost everyone, from the students, to the faculty, to the universities, to the ed tech companies that want to do the right thing.